Article

Synergies and Trade-Offs in Water Resources Management in the Bafing Watershed under Climate Change

by
Mame Henriette Astou Sambou
1,2,*,
Stefan Liersch
3,
Hagen Koch
3,
Expédit Wilfrid Vissin
4,
Jean Albergel
2 and
Moussé Landing Sane
5
1
West African Science Service Centre on Climate Change and Adapted Land Use (WASCAL), Université d’Abomey-Calavi, Cotonou 03 BP 526, Benin
2
Unité Mixte de Recherche (UMR) Laboratoire d’Études des Interactions Sol-Agrosystème-Hydrosystème (LISAH), Institut de Recherche pour le Développement (IRD), 34090 Montpellier, France
3
Potsdam Institute for Climate Impact Research (PIK), Member of the Leibniz Association, P.O. Box 60 12 03, D-14412 Potsdam, Germany
4
Laboratoire Pierre PAGNEY, Climat, Eau, Ecosystème et Développement (LACEEDE), Université d’Abomey-Calavi (République du Bénin), Cotonou 04 BP 789, Benin
5
Faculty of Sciences and Technology, Department of Physics, Cheikh Anta Diop University, Dakar 10700, Senegal
*
Author to whom correspondence should be addressed.
Water 2023, 15(11), 2067; https://doi.org/10.3390/w15112067
Submission received: 24 April 2023 / Revised: 25 May 2023 / Accepted: 25 May 2023 / Published: 30 May 2023
(This article belongs to the Section Water-Energy Nexus)

Abstract

:
Hydropower is the world’s largest and most widely used renewable energy source. It is expected that climate and land use changes, as well as hydraulic engineering measures, will have profound impacts on future hydropower potential. In this study, the hydropower potential of the Bafing watershed was estimated for the near future (P1: 2035–2065) and the far future (P2: 2065–2095). For this purpose, the moderate scenario ssp 126 and the medium–high scenario ssp 370 were used to explore possible climate impacts. In three management scenarios, we tested the interaction of the existing Manantali Dam with two planned dams (Koukoutamba and Boureya) using an ecohydrological water management model. The results show that, under ssp 126, a 6% increase in annual river flow would result in a 3% increase in hydropower potential in the near future compared with the historical period of 1984–2014. In the far future, the annual river flow would decrease by 6%, resulting in an 8% decrease in hydropower potential. Under ssp 370, the hydropower potential would decrease by 0.7% and 14% in the near and far future, respectively. The investment in the planned dams has benefits, such as an increase in hydropower potential and improved flood protection. However, the dams will be negatively affected by climate change in the future (except in the near future (P1) under ssp 126), and their operation will result in hydropower potential losses of about 11% at the Manantali Dam. Therefore, to mitigate the effects of climate change and adjust the operation of the three dams, it is essential to develop new adaptation measures through an optimization program or an energy mix combining hydro, solar, and wind power.

1. Introduction

Access to energy is essential for development because it enables basic social needs (water, food, health, education, etc.) to be met [1]. In 2016, 1.2 billion people worldwide, though mainly in Asia and Africa (where about 80% live in rural areas), did not have access to electricity [2]. Hydropower has contributed to economic and social development by providing energy and water management services. Moreover, hydropower dams can provide services beyond the provision of electricity [3]. Hydropower is a fundamental instrument for sustainable development, and it is an affordable, renewable, and flexible form of energy [4]. It accounts for nearly 16% of the world’s total electricity supply and is the largest renewable electricity source [5,6]. In Africa, 15.5% of the electricity supply is derived from hydropower [7]. Hydropower is a crucial source of electricity generation, especially in Eastern and Southern Africa [8]. Currently, 90% of national electricity generation in Ethiopia, Malawi, Mozambique, Namibia, and Zambia comes from hydropower [8]. West Africa has invested relatively little in large-scale hydraulic infrastructure, and the Senegal and Niger basins allow more than 90% of their runoff to pass through, even though it could be used for agricultural irrigation and hydropower generation [9]. More than 50% of West Africa’s hydropower potential (HPP) remains untapped, but some large hydropower dams have been built, and other projects are underway [10]. The share of hydropower in the energy mix is expected to continue to increase, which will help promote clean and renewable energy, a goal being driven by national and regional energy plans such as the Program for Infrastructure Development in Africa (PIDA) [8]. The desire to deploy renewable energy conversion technologies has been renewed by the severe environmental effects of fossil fuel-based energy sources [11]. Many governments and international organizations consider the exploitation of green energy, particularly hydropower, to be a crucial element of sustainable economic development, especially in the least-developed countries [12].
Our planet is currently dealing with the issue of climate change, which threatens all economic sectors [13]. Climate change refers to long-term changes in temperature and weather patterns [13]. A major contributing component to climate change is global warming [14]. The release of greenhouse gases, both from natural sources and as a result of human-induced changes, has accelerated the process of climate change and intensified our weather [15]. According to the IPCC Special Report on the Impacts of Global Warming of 1.5 °C, human activity is thought to be responsible for around 1.0 °C of global warming beyond pre-industrial levels, resulting in a potential increase in global temperature of 0.8 °C to 1.2 °C [16]. If global warming maintains its current trajectory, it might reach 1.5 °C between 2030 and 2050 [16]. To strengthen the global response to the threat of climate change, many agreements have been signed to stabilize greenhouse gas concentrations, such as the Paris Agreement [17]. The main objective of the Paris Agreement is to increase the effectiveness of international efforts to combat the threat posed by climate change by limiting the rise in global temperature this century to less than 2 °C above pre-industrial levels, and to pursue efforts to further limit the temperature increase to 1.5 °C. Scientific interest in hydropower in Africa is increasing both due to the importance of hydropower in developing African countries and in order to comply with the Paris Agreement [18].
The relationship between hydropower and climate change is complex. On the one hand, hydropower significantly reduces greenhouse gas emissions and mitigates global warming [2,19]. On the other hand, climate change is expected to alter river flows, which will affect the availability and reliability of hydropower generation [2]. The energy system is one of the economic sectors most affected by climate change [20]. Indeed, water availability and hydropower generation can be affected by changes in river flows (runoff volume, variability, and seasonality of discharges) and extreme weather events (floods and droughts) related to climate change [21,22,23]. Existing research has shown that climate change could severely impact hydropower in the future [24,25,26].
The source of the Senegal River, the sixth largest river in Africa, is located in the Fouta Djallon highlands and covers an area of more than 340,000 km2 [27,
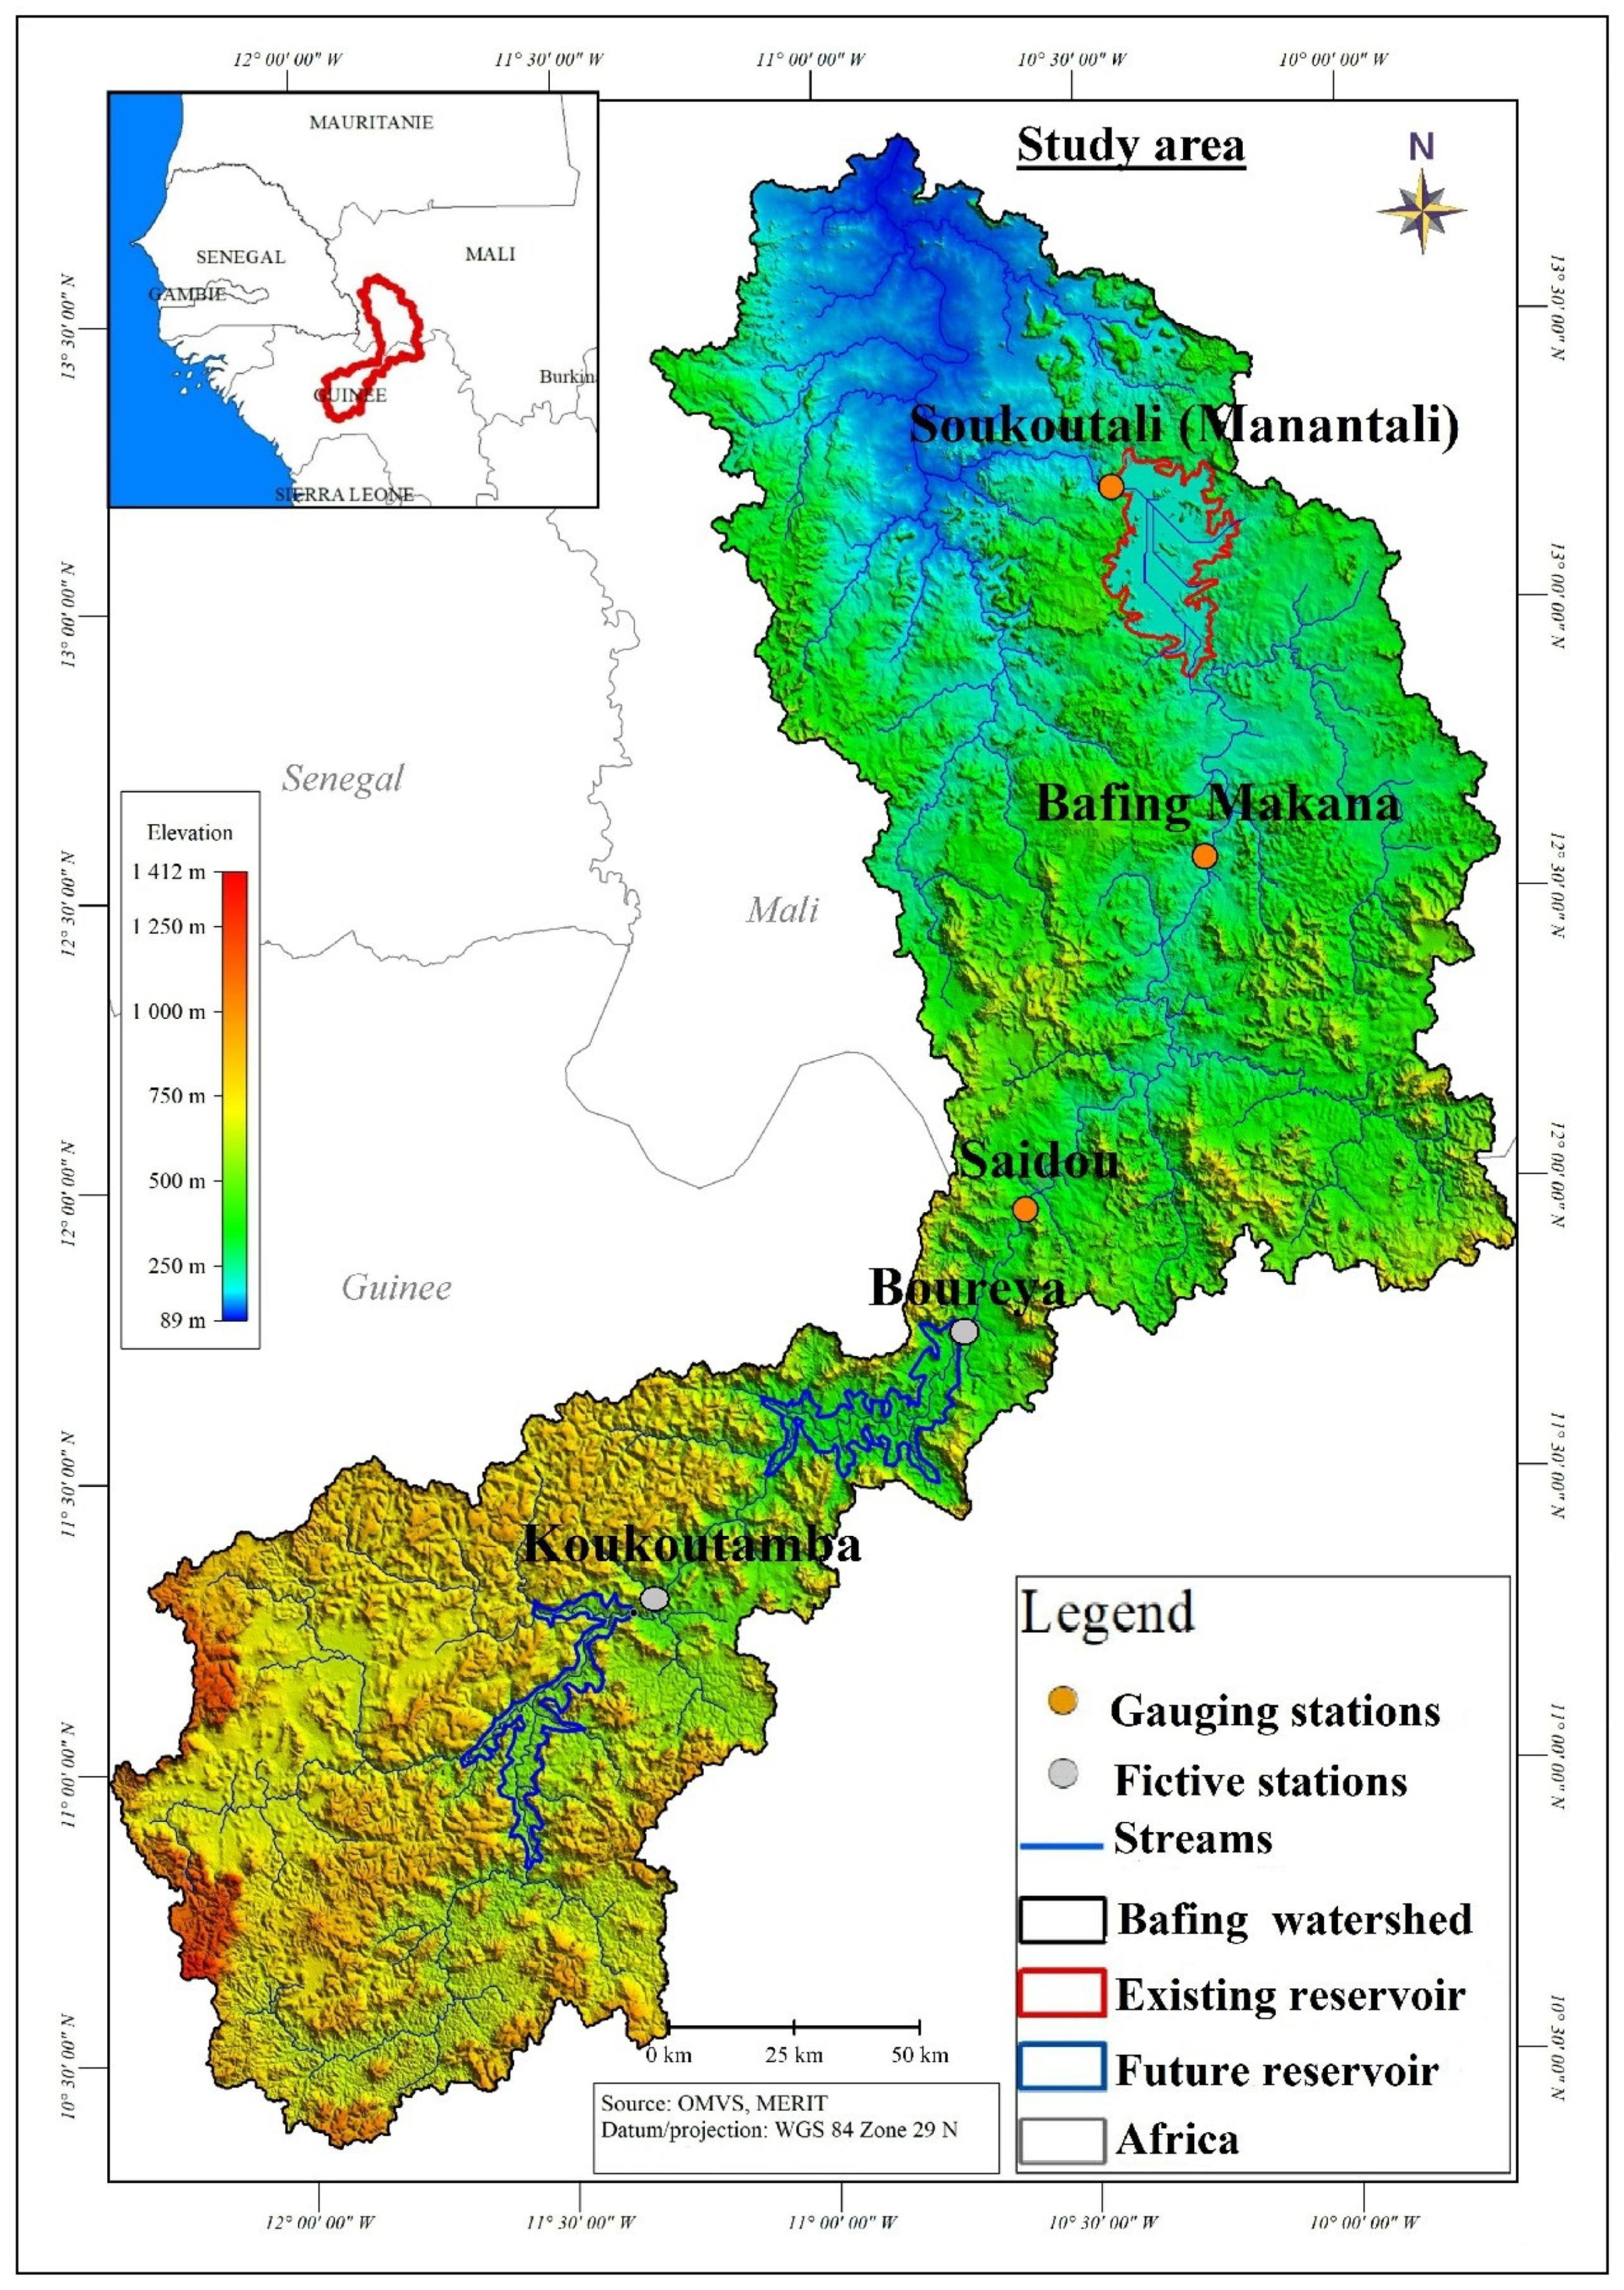
28]. The river flows through four countries: Guinea, Mali, Mauritania, and Senegal. Aware of the economic benefits of hydropower dams, the countries of the Senegal River have formed the Organization for the Development of the Senegal River (OMVS) to plan the energy development of the river. Early on, an infrastructure program was established to regulate river flows and produce electricity by constructing hydropower dams [9]. These hydropower dams are the Manantali Multipurpose Dam and the Gouina and Felou run-of-river hydropower stations. The OMVS has planned several major dams that will likely be added to the Manantali Dam in the upper Senegal River Basin in the coming years. These include the Boureya and Koukoutamba Dams, to be located upstream of the Manantali Dam [29].
Climate change has severely affected the flow of many rivers in West Africa since 1970 [30,31,32,33]. Projections indicate that a change in river flow regimes is expected in many African basins [34]. The Senegal river, for example, is expected to experience an increase in extreme rainfall [35]. While several studies have argued that climate change impacts hydropower worldwide, there have been few studies that have investigated its specific impacts in West Africa [3,10]. The West African Regional Centre on Renewable Energy and Energy Efficiency [36] states that the impacts of climate change on West Africa’s water resources are well known, but that their effects on hydropower generation, especially in the Senegal River, have not been well studied. Several studies have been carried out on the Senegal River. Some studies have focused on the impact of climate change or variability on water availability, while other studies have focused on the effects of dams on downstream water flow [28,31,35,37,38,39,40,41,42,43,44]. Despite the amount of documentation and numerous projects on the Senegal River, a study on the potential impact of climate change on its hydropower potential has not been carried out. Indeed, there are not yet any studies that have addressed the hydrological and hydropower potential (HPP) response of the basin that may result from the combined impact of future climate change (CC) and the future development of planned dams in the Bafing watershed. Therefore, this study aims to fill this gap by investigating the impacts of climate change and altered water resources management on the river flow regimes and HPP in the upper Senegal River Basin using a Soil and Water Integrated Model (SWIM) [45].
The SWIM was driven by 10 downscaled and bias-adjusted global climate models (GCMs) to generate daily river discharge and simulate dam management under two future climate scenarios (shared socioeconomic pathways 126 and 370). Upstream of the Manantali Dam on the Bafing River in Mali, we implemented into the model the two planned dams (Koukoutamba and Boureya) in Guinea and adjusted the operation of the three dams to simulate the most reliable hydropower generation. The generation and reliability of the HPP was analyzed for two future periods around the middle (near future) and the end (far future) of the 21st century. The results of this study can be considered relevant to the efforts of the OMVS to create effective strategies for water resources management in the basin.

2. Materials and Methods

2.1. Study Area

The study area was the Bafing watershed in the upper Senegal River Basin (Figure 1). It covers an area of 38,000 km2 and is located in roughly equal parts in Guinea-Conakry and in Mali between the latitudes of 10°30′ and 12°30′ N and between the longitudes of 12°30′ and 9°30′ W [37,45]. The southern part of the Bafing watershed is located in the sub-Guinean zone, and the northern region is located in the Sudanese zone [45]. The average annual precipitation is 1166 mm/year, and the annual average temperature is 27.6 °C [46]. The length of the rainy season varies from four to five months (June to October). The Manantali Hydropower Dam in Mali was built on the Bafing River in 1987. Most of its electricity is used to supply the capitals Dakar, Bamako, and Nouakchott. The 1,400 km electricity distribution grid consists of a 326 km eastward line that supplies Bamako, a westward line of more than 800 km which supplies Kayes, Matam, Dagana, and Sakal, and a 226 km Dagana–Rosso–Nouakchott line [47]. The Manantali Dam also enables the flow to be regulated to satisfy the needs for irrigation, the cultivation of flood recession on the floodplains, and the provision of drinking water for Bakel. The future construction of the Koukoutamba and Boureya Hydropower Dams is planned upstream of the Manantali Dam (Figure 1).

2.2. Data

Due to the lack of high-quality observational meteorological data (precipitation, wind, temperature, solar radiation), the gridded WFDE5 [48] reanalysis product was used to calibrate and validate the hydrological model. WFDE5 is available at a spatial resolution of 0.5° at an hourly timestep. In this study, we used daily precipitation, temperature, relative humidity, and solar radiation data. Sub-basins for the SWIM were identified using the MERIT DEM (multi-error-removed improved-terrain DEM) numerical elevation model [49], which was also used to obtain some terrain-specific metrics. The soil parameters were derived from the harmonized world soil database (http://www.fao.org/geonetwork/srv/en/main.home#soils (accessed on 23 December 2022)), and the land use and land cover map was produced by applying the random forest classification method to Landsat images from 1986. The observed discharge data (1979–1995) for the Bafing Makana station were obtained from the OMVS. To simulate the management of the dams, the reservoir module of the SWIM required information about the characteristics of the hydroelectric plants and the dams. These data were obtained from published reports [42,50,51]. The main characteristics of the implemented dams are presented in Table 1. The efficiency factors for the hydroelectric plants were calculated using the maximum head and capacity values of the hydropower plants.
To assess the impacts of climate change on river flows and hydropower potentials, future climate projections based on 10 GCMs provided by the Inter-Sectoral Impact Model Intercomparison Project Phase 3b (ISIMIP3b) were used in this study (cf. Appendix A). The GCM simulations were downscaled to a 0.5-degree horizontal grid and bias-adjusted [52]. The two climate scenarios ssp 126 (moderate scenario) and ssp 370 (medium–high scenario) were selected to cover an extensive range of projections because they represent a wide range of uncertainties in potential future trajectories [53].

2.3. Methods

2.3.1. Hydrological Model

The soil and water integrated model (SWIM) [54,55] is an ecohydrological and water management model. It is spatially semi-distributed and operates at a daily timestep [56]. It integrates relevant ecohydrological processes, sediment transport, and vegetation growth to study the effects of climate and land use change on hydrological systems and vegetation at a regional scale. The calibration procedure involves adjusting the parameters so that the simulated flows correspond to the observed flows [44]. The SWIM model was calibrated and validated manually at the Bafing Makana station. The model was manually calibrated at a daily timestep for 1979–1986 and validated for 1987–1994. The indices typically used to assess the performance of this kind of model are Nash–Sutcliffe efficiency (NSE) and Kling–Gupta efficiency (KGE) [57]. The SWIM reservoir module [58] was used to simulate the operation of the existing and future dams. The dam operation rule applied in this study requires generating a user-defined target firm hydropower yield. The daily discharge released from the dam therefore depends on these targets and the actual water volume and water level. The reservoir module was calibrated for the Manantali Dam based on pre-established management rules from 2003 to 2009. The relationships between the dam surface area, water level, and water volume were computed for the two planned dams using the module r.lake in GRASS GIS at different inundation levels. The DEM and the location of the dams served as input. Following the integration of the future dams, the operation of the Manantali Dam was adjusted. Other information required to parameterize the planned dams (such as maximum dam capacity, dead storage, firm hydropower yield, and installed hydropower capacity) was gathered from different sources [42,51,59].

2.3.2. Water Management Scenarios

The development scenarios (DSs) are designed in such a way that future dams are considered in the simulation (Table 2).

2.3.3. Simulation Periods

The period 1984–2014 represents the reference period (P0) around the year 2000, the period 2035–2065 represents the near future around 2050 (P1), and the period 2065–2095 represents the far future around 2080 (P2).

2.3.4. Impact Assessment

The main aim of this study is to evaluate the effect of climate change on the hydroelectric potential of the system by first considering the Manantali Dam alone (DS1), and then considering the Manantali, Koukoutamba, and Boureya system (DS2, DS3). A set of relevant performance indicators was used to compare the future scenarios with the reference period. These indicators were reliability, spill, and probability of exceedance (EP). We viewed spill as a failure associated with the maximum capacities that could have a negative effect on the hydropower generation. It should be noted that the management objectives of the Manantali Dam are the satisfaction of a monthly production of 70 MW from January to August and from November to December, and a monthly production of 100 MW for the months of September and October. A failure state is considered to have occurred if these monthly outputs are not met. Management objectives have not yet been established for the future dams. Thus, the reliability criterion is applicable only for the Manantali Dam. Table 3 provides a detailed explanation of each indicator used and the accompanying measurement technique.

3. Results

3.1. ISIMIP3b Climate Projections in the Bafing Watershed

According to the median of the ISIMIP3b multi-model ensemble (MMME), and compared with the reference period P0, the mean air temperature is projected to increase by 1.4 °C and 2.0 °C in the near future (P1) under ssp 126 and ssp 370, respectively. In the far future, the difference between both climate scenarios is much larger, ranging from 1.6 °C to 3.7 °C (Figure 2 and Figure 3). Precipitation is not projected to change substantially in the medium future (P1) compared with P0. The MMME ranges between an increase in average annual precipitation of 1% in ssp 126 and a decrease of 1% in ssp 370. In the far future, the climate scenario plays a larger role in precipitation projections. A decrease of 4% in average annual precipitation is projected in ssp 126, and a decrease of 8% is projected in ssp 370. A major difference between the scenarios is that under ssp 126, the MMME is within the range of P0, but it drops under the range in ssp 370 (Figure 3 and Figure 4). Figure 4 also shows that the two models CanESM5 and EC-Earth3 project much higher values than the other eight models of the ensemble.

3.2. Impacts of Climate Change at the Manantali Dam

3.2.1. Impacts of Climate Change on Flows and Hydropower at the Manantali Dam

We considered the median of the multi-model ensemble (MMME) for the analysis and interpretation of the results. The results are presented in Table 4 and Figure 5.
Consistent with the temperature projections (cf. Section 3.1), evaporation (Eta) over the Manantali Dam is projected to increase by 3% in the near future under both ssp 126 and ssp 370, and by 3% under the ssp 126 and 5% under ssp 370 in the far future (P2). The inflows into the Manantali Dam follow the general precipitation projection trends (cf. Section 3.1). In the near future (P1), the inflows are projected to either increase by 6% under ssp 126 or to decrease by 1% under ssp 370 (Table 4). The outflow of the Manantali Dam is also projected to increase by 7% under ssp 126 or to decrease by 1% under ssp 370. In the far future (P2), inflow decreases of 4% under ssp 126 and 8% under ssp 370 are projected. The outflow of the Manantali Dam is also expected to decrease by 7% under ssp 126 and 15% under ssp 370. The projected HPP corresponds to the projected inflow trends. In the near future, changes of +3% and −0.7% in Manantali Dam’s HPP are expected under ssp 126 and ssp 370, respectively. However, an increase in EP 95, EP 90, and EP 99 is projected for both ssp 126 and ssp 370, indicating an improvement in the reliability of the hydroelectric potential. There are also projected increases of 50% and 7% in the volume spilled for ssp 126 and ssp 370, respectively. This reflects the fact that an increase in the incoming flow peaks that exceeds the storage capacity of the dam will effectively increase the HPP. In the far future, Manantali Dam’s HPP is projected to decrease by 8% under ssp 126 and 14% under ssp 370. Decreases in EP 95, EP 90, and EP 99 are projected for ssp 126 and ssp 370, and this is consistent with the inflow reduction. It is interesting to note that an increase of 12% in the volume spilled is projected under ssp 126 while a decrease of 54% is projected under ssp 370. This reflects the fact that an increase in peak flows is projected under ssp 126, and this will not lead to an increase in HPP. Figure 5 also shows that both CanESM5 and EC-Earth3 project much higher discharges.

3.2.2. Impacts of Future Dams on the Manantali Dam

The inflow to the Manantali Dam inlet was used to estimate the effects of future dams on the annual flow and HPP of the Manantali Dam during the reference period (P0) using the WFDE5 climate.
The results show that the construction of dams will lead to a reduction in the HPP at the Manantali Dam (Figure 6, Table 5). Indeed, the DS2 will reduce the Manantali Dam’s inflow by 6% and its HHP by 3%. SD3 will result in an annual reduction in inflow of 12%, which will subsequently result in a reduction in HPP of 11% (Figure 6). These results are consistent with the obtained performance indicators. The EP 90 values decrease by 6% for DS2 and 12% for SD3, leading to a lower average production due to the long-term decreases in the volumes of turbinated water. The results also show that the future dams (DS2 and DS3) should have some positive effects on Manantali Dam’s HPP and flood peaks. For instance, DS2 and DS3 will decrease the spilled volume by 31% and 64%, respectively, owing to a significant decrease in extreme high inflows due to upstream storage. DS2 and DS3 will also increase EP 95 by 2% and 3%, respectively, indicating an improvement in the reliability of the hydroelectric potential resulting from a reduction in the risk that water levels in the Manantali Dam reach the lower turbine threshold.

3.2.3. Manantali Dam Hydropower Generation under the Combined Impacts of Climate Change and Development Scenarios

Climate change and the future dams (DS2, DS3) will have a negative impact on the HPP of the Manantali Dam (Table 6). In the near future (P1), in DS3, Manantali Dam’s HPP is expected to decrease by 1% under ssp 126 and 8% under ssp 370, projections which are consistent with the decline in EP 90 values. Despite this decrease in HPP, there is an improvement in the reliability of the HPP, which increases by 13% under ssp 126 and 8% under ssp 370 with the increasing EP 95 values, indicating that the risk of the water level in the Manantali Dam reaching the lower turbine threshold is reduced. The volumes spilled are projected to decrease by 42% under ssp 126 and 60% under ssp 370. This reduction in spill is caused by a significant decrease in extreme high inflows due to upstream storage.
In the far future (P2), in DS3, Manantali Dam’s HPP is expected to decrease by 17% under ssp 126 and 30% under ssp 370, and EP 90 and EP 95 values are also projected to decrease. Decreases of 62% and 91% in spilled volume are also projected under ssp 126 and ssp 370, respectively. Because inflow volumes will decrease in the future, spill will also decrease. The risk of the water levels in the Manantali Dam reaching the lower turbine threshold is high, especially under scenario ssp 370.

3.3. Future Hydropower Potential

The construction of future dams (DS2 and DS3) will increase the annual HPP in the basin (Figure 7). However, while investment in future dams will bring benefits, these benefits will be vastly different from those that would be achieved in the absence of climate change. Indeed, in the near future (P1), the HPP values of the Koukoutamba, Boureya, and Manantali Dams will increase under ssp 126 but decrease under ssp 370 (Table 7). In the far future (P2), the HPP values of the Koukoutamba, Boureya, and Manantali Dams will decrease under both ssp 126 and ssp 370, and the loss will be more severe under ssp 370 (Table 7).

4. Discussion

Energy is a strategic matter for the states bordering the Senegal River which constitute the OMVS. The OMVS is planning to significantly increase water storage by establishing large dams for hydropower generation. This analysis of the impacts of climate change on the HPP and the management of the new dams provides important information. The objective of this research was to assess the potential impacts of climate change on water availability and HPP in the Bafing watershed, and thereby to inform decision makers. Climate change projections are essential input for projecting future hydropower generation [60]. According to the median of the ten GCMs, the temperature is expected to increase in the future in all scenarios, regardless of the period considered. On the other hand, uncertainties about the precipitation projections are high. Indeed, precipitation is likely to increase in the near future (P1) according to ssp 126, but it is expected to decrease according to ssp 370. In the far future (P2), both scenarios project a decrease in precipitation. This large variance is not only related to uncertainties in the climate models, but also to the selection of the base period for comparison [61]. This has important implications for decision makers formulating long-term strategic development plans. Regarding the possible impacts of climate change on the flow and HPP at the Manantali Dam, the MMME projects a decline in inflow, outflow, and future HPP regardless of the period and scenario considered. Only the results of the projection under ssp 126 in the near future deviate from this trend, despite the evaporative losses that are likely to be offset by the increase in precipitation during this period. This result confirms the sensitivity of this energy source to precipitation. Indeed, [62] showed that increased precipitation due to climate change will lead to an increase in dam inflows and a change in annual hydropower production of +8.72% (RCP4.5) and +12.81% (RCP8.5) by 2035, and +8.63% (RCP 4.5) and +24% (RCP 8.5) by 2085. Increases in spill are also projected (except under ssp 370 in the far future), and this may trigger an increase in flooding downstream, posing a serious threat to the Bakel region in the Senegal River Valley. It should be also emphasized that, due to an elevated risk of flooding, retaining water in the dam for hydropower generation may conflict with maintaining a free volume. Interestingly, the impacts of future dams on the Manantali Dam are mixed. On the one hand, they will lead to a decrease in average hydropower generation, even though the operation of the Manantali Dam was adjusted in the model after the incorporation of the two planned dams. On the other hand, they will improve the reliability of the hydropower generation of the Manantali Dam by reducing the risk that its water level will fall below the turbine threshold. They will also contribute to a reduction in the volume spilled by controlling the peak flow upstream of the dam, thus reducing the risk of flooding in Bakel. Regarding the possible impacts of climate change and the management of the dams, the results suggest that changes in the magnitude of future flows caused by dam management are likely to be greater than those caused by climate change for the Manantali Dam. According to [63], increasing storage capacity by constructing new dams is the first surface water adaptation option to mitigate the effects of climate change, despite the negative social and environmental consequences of dams [64]. The results show that although the planned dams will increase the HPP in the basin, they will be negatively affected by climate change (except in the near future (P1) under ssp 126). Thus, operational rules must be dynamically adjusted to adapt to climate change. Our results are consistent with the findings of [65], which suggest that additional coping strategies are needed. One adaptation technique is to improve the operation of these three dams through an optimization program. Optimizing the operation of a group of hydropower dams in a basin has various advantages. It allows the full use of water resources at all scales while enabling the adjustments and compensations to mitigate the effects of interannual climate variables on each power plant [66]. The other option is to study the combinations of hydro, solar, and wind energy at the local or regional scale. The authors of [56,67] demonstrated that the appropriate management of existing and future hydropower plants in West Africa and the adoption of a new common energy policy promoting an energy mix that prioritizes renewable energies (namely hydropower, solar and wind) are essential to optimize West Africa’s renewable energy potential.

5. Conclusions

The development of the hydropower potential of the Senegal River is the primary objective of the states bordering the Senegal River, and which constitute the Organization for the Development of the Senegal River (OMVS). The OMVS is planning to construct large dams for hydropower generation in the future. Climate change (CC) is projected to have a significant impact on future hydropower potential. This analysis of the effects of climate change on the HPP and the management of new dams provides relevant information for decision makers. This article assessed the impacts of climate change on the HPP of the Bafing watershed based on existing and future dams. The ecohydrological water management model SWIM was calibrated and validated using historical data. To generate the daily river discharge and simulate dam management under two future climate scenarios (ssp 126 and ssp 370), 10 downscaled and bias-adjusted GCMs were used as input data for the SWIM. The results show that there is uncertainty about the impact of climate change on water resources and hydropower generation. In the near future, an increase in inflow of 6% compared with the reference period will lead to an increase of 3% in HPP at the Manantali Dam under ssp 126, while a decrease in inflow of 1% will cause a decrease of 0.7% in HPP under ssp 370. In the far future, a decrease in inflow of 4% compared with the reference period will cause a decrease in HPP of 8% under ssp 126, while a decrease in inflow of 8% will cause a decrease in HPP of 14% under ssp 370. The planned dams (Koukoutamba, Boureya) will provide advantages, such as flood control and additional electricity. However, they will be negatively impacted by climate change in the future (except in the near future (P1) under ssp 126). It is, therefore, essential to find an adaptation strategy to adapt the operation of these three dams and to deal with the negative effects of climate change. To reduce the impact of these negative effects, an optimization program or a hybrid system that combines hydro, solar, and wind energy should be given special attention.

Author Contributions

Conceptualization, M.H.A.S.; Methodology, M.H.A.S., S.L. and H.K.; Software, M.H.A.S., S.L. and H.K.; Validation, J.A. and E.W.V.; Writing—original draft, M.H.A.S.; Writing—review & editing, M.H.A.S., S.L., H.K., E.W.V., J.A. and M.L.S.; Supervision, S.L.; Project administration, M.H.A.S.; Funding acquisition, J.A. All authors have read and agreed to the published version of the manuscript.

Funding

This paper is a component of a PhD research financed by the German Federal Ministry of Education and Research (BMBF) and undertaken at the University of Abomey-Calavi, Republic of Benin, on behalf the West African Science Service Center on Climate Change and Adapted Land Use (WASCAL). The publication fees was funded by l’Institut de Recherche pour Développement (IRD) in support of the Laboratoire d’Etude des Interactions entre Sol-Agrosystème-Hydrosystème, Montpelier, France (LISAH).

Data Availability Statement

Acknowledgments

The authors would like to thank the ISIMIP and ECMWF for the free access of their data used in this study.

Conflicts of Interest

The authors declare no conflict of interest.

Appendix A

(a) 
Climate data
Ten GCMs from the ISIMIP3b were used in this study. The daily gridded weather dataset WFDE5, used to conduct the baseline simulations, served as basis for downscaling and bias-adjustment of the ISIMIP3b GCMs.
Table A1. Global Climate Model from Isimip 3b.
GCM ModelCharacteristics GCM (forcing)
CanESM5Canadian Center for Climate Modelling and Analysis—Canada
CNRM-CM6-1Centre National de Recherches Météorologiques (CNRM) and Cerfacs—France
CNRM-ESM2Centre National de Recherches Météorologiques (CNRM) and Cerfacs—France
EC-Earth3Royal Netherlands Meteorological Institute (KNMI)—Pays-Bas
GFDL-ESM4The GFDL Earth System Model
IPSL-CM6A-LRInstitut Pierre-Simon Laplace (IPSL)
MIROC6The Model for Interdisciplinary Research on Climate (MIROC) by The University of Tokyo Center for Climate System Research—Japon
MPI-ESM1-2-HRThe Max Planck Institute for Meteorology,
MRI-ESM2-0The Meteorological Research Institute Earth System Model Version 2.0
UKESM1-0-LLU.K. Earth System Model
(b) 
Calibration of the SWIM model
Figure A1. Simulated discharges for calibration and validation periods.
Water 15 02067 g0a1
Table A2. Performance of the model during calibration and validation with LULC of 1986.
PeriodPbiasNSER2KGE
Bafing MakanaCalibration1979–198615.40.800.800.81
Validation1987–199327.70.770.770.70
Dakka SaidouCalibration1979–198620.50.820.810.77
Validation1987–199328.50.810.790.70

References

  1. Cai, Y.P.; Huang, G.H.; Lin, Q.G.; Nie, X.H.; Tan, Q. An Optimization-Model-Based Interactive Decision Support System for Regional Energy Management Systems Planning under Uncertainty. Expert Syst. Appl. 2009, 36, 3470–3482. [Google Scholar] [CrossRef]
  2. Berga, L. The Role of Hydropower in Climate Change Mitigation and Adaptation: A Review. Engineering 2016, 2, 313–318. [Google Scholar] [CrossRef]
  3. Kumar, A.; Schei, T.; Ahenkorah, A.; Rodriguez, R.C.; Devernay, J.-M.; Freitas, M.; Hall, D.; Killingtveit, Å.; Liu, Z.; Branche, E.; et al. Hydropower. In IPCC Special Report on Renewable Energy Sources and Climate Change Mitigation; Cambridge University Press: Cambridge, UK, 2011; pp. 437–496. [Google Scholar]
  4. Keeble, B.R. Report of the World Commission on Environment and Development: Our Common Future. Med. War 1988, 4, 17–25. [Google Scholar] [CrossRef]
  5. IHA. Hydropower Status Report 2019: Sector Trends and Insights. 2019. Available online: https://www.hydropower.org/publications/status2019 (accessed on 15 May 2023).
  6. IHA. Hydropower Status Report. 2022. Available online: https://www.hydropower.org/publications/2022-hydropower-status-report (accessed on 15 May 2023).
  7. Obahoundje, S.; Diedhiou, A. Potential Impacts of Climate, Land Use and Land Cover Changes on Hydropower Generation in West Africa: A Review. Environ. Res. Lett. 2022, 17, 043005. [Google Scholar] [CrossRef]
  8. Conway, D.; Dalin, C.; Landman, W.A.; Osborn, T.J. Hydropower Plans in Eastern and Southern Africa Increase Risk of Concurrent Climate-Related Electricity Supply Disruption. Nat. Energy 2017, 2, 946–953. [Google Scholar] [CrossRef]
  9. Anne, A.; Laurent, B.; Jonathan, L. Fleuve Sénégal Analyse Des Projets Potentiels Liés à L’énergi: Focus Sur Le Sénégal. Ph.D. Thesis, Université Montpellier, Montpellier, France, 2017. [Google Scholar]
  10. Kabo-Bah, A.T.; Diji, C.J. Sustainable Hydropower in West Africa Planning, Operation, and Challenges; Academic Press: Cambridge, MA, USA, 2018. [Google Scholar]
  11. Tarroja, B.; Forrest, K.; Chiang, F.; AghaKouchak, A.; Samuelsen, S. Implications of Hydropower Variability from Climate Change for a Future, Highly-Renewable Electric Grid in California. Appl. Energy 2019, 237, 353–366. [Google Scholar] [CrossRef]
  12. Harrison, G.; Whittington, H.; Gundry, S. Climate Change Impacts on Hydroelectric Power. Proc. Univ. Power Eng. Conf. 1998, 1, 391–394. [Google Scholar]
  13. IPCC. Climate Change 2021: The Physical Science Basis—Summary for the Policymakers (Working Group I); IPCC: Geneva, Switzerland, 2021. [Google Scholar]
  14. Biasutti, M. Rainfall Trends in the African Sahel: Characteristics, Processes, and Causes. Wiley Interdiscip. Rev. Clim. Chang. 2019, 10, e591. [Google Scholar] [CrossRef]
  15. IPCC. Climate Change 2022, Mitigation of Climate Change Summary for Policymakers (SPM); IPCC: Geneva, Switzerland, 2022. [Google Scholar]
  16. IPCC. An IPCC Special Report on Impacts of Global Warming of 1.5 °C; IPCC: Geneva, Switzerland, 2018. [Google Scholar] [CrossRef]
  17. Savaresi, A. The Paris Agreement: A New Beginning? J. Energy Nat. Resour. Law 2016, 34, 16–26. [Google Scholar] [CrossRef]
  18. Huang, M.T.; Zhai, P.M. Achieving Paris Agreement Temperature Goals Requires Carbon Neutrality by Middle Century with Far-Reaching Transitions in the Whole Society. Adv. Clim. Chang. Res. 2021, 12, 281–286. [Google Scholar] [CrossRef]
  19. Fan, J.; Hu, J.; Zhang, X.; Kong, L.; Li, F.; Mi, Z. ScienceDirect Impacts of Climate Change on Hydropower Generation in China. Math. Comput. Simul. 2020, 167, 4–18. [Google Scholar] [CrossRef]
  20. Teotónio, C.; Fortes, P.; Roebeling, P.; Rodriguez, M.; Robaina-Alves, M. Assessing the Impacts of Climate Change on Hydropower Generation and the Power Sector in Portugal: A Partial Equilibrium Approach. Renew. Sustain. Energy Rev. 2017, 74, 788–799. [Google Scholar] [CrossRef]
  21. Schaeffer, R.; Szklo, A.S.; Pereira de Lucena, A.F.; Moreira Cesar Borba, B.S.; Pupo Nogueira, L.P.; Fleming, F.P.; Troccoli, A.; Harrison, M.; Boulahya, M.S. Energy Sector Vulnerability to Climate Change: A Review. Energy 2012, 38, 1–12. [Google Scholar] [CrossRef]
  22. Loucks, D.P.; Baek, E.V. Water Resource Systems Planning and Analysis-An Introduction to Methods, Models, and Applications; Springer: Berlin/Heidelberg, Germany, 2016; Volume 4. [Google Scholar]
  23. Vicuña, S.; Dracup, J.A.; Dale, L. Climate Change Impacts on Two High-Elevation Hydropower Systems in California. Clim. Chang. 2011, 109 (Suppl. S1), 151–169. [Google Scholar] [CrossRef]
  24. Kim, S.J.; Asadzadeh, M.; Stadnyk, T.A. Climate Change Impact on Water Supply and Hydropower Generation Potential in Northern Manitoba. J. Hydrol. Reg. Stud. 2022, 41, 101077. [Google Scholar] [CrossRef]
  25. Sun, L.; Zhou, X.; Gu, A. Effects of Climate Change on Hydropower Generation in China Based on a WEAP Model. Sustainability 2022, 14, 5467. [Google Scholar] [CrossRef]
  26. Wasti, A.; Ray, P.; Wi, S.; Folch, C.; Ubierna, M.; Karki, P. Climate Change and the Hydropower Sector: A Global Review. Wiley Interdiscip. Rev. Clim. Chang. 2022, 13, e757. [Google Scholar] [CrossRef]
  27. Ndiaye, E.H.M. Le Fleuve Sénégal et Les Barrages de l’OMVS: Quels Enseignements Pour La Mise En Œuvre Du NEPAD? VertigO 2003, 4. [Google Scholar] [CrossRef]
  28. Bader, J.-C. Monographie Hydrologique Du Fleuve Sénégal: De l’origines Mesures Jusqu’en; IRD: Montpellier, France, 2014. [Google Scholar]
  29. OMVS. Schéma Directeur d’Aménagement et de Gestion Des Eaux Du Fleuve Sénégal; OMVS: Dakar, Senegal, 2012. [Google Scholar]
  30. Descroix, L.; Diongue Niang, A.; Dacosta, H.; Panthou, G.; Quantin, G.; Diedhiou, A. Évolution Des Pluies de Cumul Élevé et Recrudescence Des Crues Depuis 1951 Dans Le Bassin Du Niger Moyen (Sahel). Climatologie 2013, 10, 37–49. [Google Scholar] [CrossRef]
  31. Cisse, M.T.; Sambou, S.; Dieme, Y.; Diatta, C.; Bop, M. Analysis of Flow in the Senegal River Basin from 1960 to 2008. J. Water Sci. 2014, 27, 167–187. [Google Scholar] [CrossRef]
  32. Faye, C. Variabilité et Tendances Observées Sur Les Débits Moyens Mensuels, Saisonniers et Annuels Dans Le Bassin de La Falémé (Sénégal). Hydrol. Sci. J. 2017, 62, 259–269. [Google Scholar] [CrossRef]
  33. Diallo, M.A.; Badiane, A.S.; Diongue, K.; Sakandé, L.; Ndiaye, M.; Seck, M.C.; Ndiaye, D. A Twenty-Eight-Year Laboratory-Based Retrospective Trend Analysis of Malaria in Dakar, Senegal. PLoS ONE 2020, 15, e0231587. [Google Scholar] [CrossRef]
  34. Bates, B.C.; Kundzewicz, Z.W.; Wu, S.; Palutikof, J.P. Climate Change and Water. Technical Paper of the Intergovernmental Panel on Climate Change; IPCC: Geneva, Switzerland, 2008; Volume 71. [Google Scholar] [CrossRef]
  35. Mbaye, M.L.; Diatta, S.; Gaye, A.T. Climate Change Signals Over Senegal River Basin Using Regional Climate Models of the CORDEX Africa Simulations; Springer International Publishing: Berlin/Heidelberg, Germany, 2018; Volume 249. [Google Scholar] [CrossRef]
  36. ECREEE. GIS Hydropower Resource Mapping and Climate Change Scenarios for the ECOWAS Region; ECREEE: Praia, Cabo Verde, 2017. [Google Scholar]
  37. Faye, C. Impact Du Changement Climatique Et Du Barrage De Manantali Sur La Dynamique Du Régime Hydrologique Du Fleuve Sénégal À Bakel (1950-2014). BSGLg 2015, 64, 69–82. [Google Scholar]
  38. Faye, C. Water Resources Management and Hydraulic Infrastructures in the Senegal River Basin: The Case Study of Senegal, Mali and Mauritania. In River Basin Management-Under a Changing Climate; IntechOpen: London, UK, 2023. [Google Scholar] [CrossRef]
  39. Sambou, S.; Diémé, Y.; Touré, A.K.; Badji, A.M.; Malanda-Nimy, E.N. Effet Du Barrage de Manantali Sur Les Modifications Du Régime Hydrologique Du Fleuve Sénégal Dans Le Bassin Amont: Une Approche Statistique. Sécheresse 2019, 20, 104–111. [Google Scholar] [CrossRef]
  40. Bodian, A.; Diop, L.; Panthou, G.; Dacosta, H.; Deme, A.; Dezetter, A.; Ndiaye, P.M.; Diouf, I.; Visch, T. Recent Trend in Hydroclimatic Conditions in the Senegal River Basin. Water 2020, 12, 436. [Google Scholar] [CrossRef]
  41. Bader, J.C. Programme D’optimisation de La Gestion Des Réservoirs: Manuel de Gestion Du Barrage de Diama: Version Finale; Institut de Recherche pour le Développement: Montpellier, France, 2001. [Google Scholar]
  42. Thiam, N.A. Allocation Optimale de l’eau Dans Le Bassin Versant Du Fleuve Sénégal. Master’s Thesis, Université Laval, Changé, France, 2016. [Google Scholar]
  43. Sane, M.L.; Sambou, S.; Leye, I.; Ndione, D.M.; Diatta, S.; Ndiaye, I.; Badji, M.L.; Kane, S. Calibration and Validation of the SWAT Model on the Watershed of Bafing River, Main Upstream Tributary of Senegal River: Checking for the Influence of the Period of Study. Open J. Mod. Hydrol. 2020, 10, 81–104. [Google Scholar] [CrossRef]
  44. Ndione, D.M.; Sambou, S.; Kane, S.; Diatta, S.; Sane, M.L.; Leye, I. Ensemble Forecasting System for the Management of the Senegal River Discharge: Application Upstream the Manantali Dam. Appl. Water Sci. 2020, 10, 1–15. [Google Scholar] [CrossRef]
  45. Krysanova, V.; Hattermann, F.; Wechsung, F. Development of the Ecohydrological Model SWIM for Regional Impact Studies and Vulnerability Assessment. Hydrol. Process. 2005, 19, 763–783. [Google Scholar] [CrossRef]
  46. Sane, M.L.; Sambou, S.; Diatta, S.; Leye, I.; Ndione, D.M.; Sauvage, S.; Sanchez-Perez, J.M.; Kane, S. Trends and Shifts in Time Series of Climate Data Generated by GCM from 2006 to 2090. Int. J. Sci. Eng. Res. 2019, 10, 212–229. [Google Scholar] [CrossRef]
  47. Bodian, A. Apport de La Modélisation Pluie-Débit Pour La Connaissance de La Ressource En Eau: Application Au Haut Bassin Du Fleuve Sénégal. Climatologie 2012, 9, 109–125. [Google Scholar] [CrossRef]
  48. Bruckmann, L. L’intégration Des Zones Inondables Dans La Gestion de l’eau et Le Développement de l’irrigation d’une Vallée Fluviale Sahélienne. Le Cas Des Terres de Décrue de La Moyenne Vallée Du Sénégal. Ph.D. Thesis, Université Paris Cité, Paris, France, 2016; p. 597. [Google Scholar]
  49. Cucchi, M.; Weedon, G.P.; Amici, A.; Bellouin, N.; Lange, S.; Schmied, H.M.; Hersbach, H.; Buontempo, C. WFDE5: Bias-Adjusted ERA5 Reanalysis Data for Impact Studies. Earth Syst. Sci. Data 2020, 12, 2097–2120. [Google Scholar] [CrossRef]
  50. Yamazaki, D.; Ikeshima, D.; Tawatari, R.; Yamaguchi, T.; O’Loughlin, F.; Neal, J.C.; Sampson, C.C.; Kanae, S.; Bates, P.D. A High-Accuracy Map of Global Terrain Elevations. Geophys. Res. Lett. 2017, 44, 5844–5853. [Google Scholar] [CrossRef]
  51. OMVS. Aménagement Hydroélectrique de Boureya En République de Guinée; OMVS: Dakar, Senegal, 2011; Volume 2. [Google Scholar]
  52. OMVS. Projets de Barrages; OMVS: Dakar, Senegal, 2013. [Google Scholar]
  53. Lange, S. ISIMIP3b Bias Adjustment Fact Sheet Observational Dataset Bias Adjustment and Statistical Downscaling Method Report. 2020. Available online: https://www.isimip.org/documents/413/ISIMIP3b_bias_adjustment_fact_sheet_Gnsz7CO.pdf (accessed on 2 April 2022).
  54. Meinshausen, M.; Nicholls, Z.R.J.; Lewis, J.; Gidden, M.J.; Vogel, E.; Freund, M.; Beyerle, U.; Gessner, C.; Nauels, A.; Bauer, N.; et al. The Shared Socio-Economic Pathway (SSP) Greenhouse Gas Concentrations and Their Extensions to 2500. Geosci. Model Dev. 2020, 13, 3571–3605. [Google Scholar] [CrossRef]
  55. Krysanova, V.; Hattermann, F.; Huang, S.; Hesse, C.; Vetter, T.; Liersch, S.; Koch, H.; Kundzewicz, Z.W. Modélisation Des Impacts Des Changements Climatiques et d’occupation Des Sols Avec SWIM: Enseignements Tirés d’applications Multiples. Hydrol. Sci. J. 2015, 60, 606–635. [Google Scholar] [CrossRef]
  56. Sterl, S.; Liersch, S.; Koch, H.; Lipzig, N.P.M.V.; Thiery, W. A New Approach for Assessing Synergies of Solar and Wind Power: Implications for West Africa. Environ. Res. Lett. 2018, 13, 094009. [Google Scholar] [CrossRef]
  57. Lamontagne, J.R.; Barber, C.A.; Vogel, R.M. Improved Estimators of Model Performance Efficiency for Skewed Hydrologic Data. Water Resour. Res. 2020, 56, 1–25. [Google Scholar] [CrossRef]
  58. Koch, H.; Liersch, S.; Hattermann, F.F. Integrating Water Resources Management in Eco-Hydrological Modelling. Water Sci. Technol. 2013, 67, 1525–1533. [Google Scholar] [CrossRef]
  59. OMVS. Étude de Faisabilité et d’avant-Projet Sommaire (APS) de l’aménagement Hydroélectrique de Gourbassi; OMVS: Dakar, Senegal, 2012. [Google Scholar]
  60. U.S Department of Energy. Effects of Climate Change-Federal Hydropower; U.S. Department of Energy (DOE): Washington, DC, USA, 2017. [Google Scholar]
  61. Rowell, D.P.; Senior, C.A.; Vellinga, M.; Graham, R.J. Can Climate Projection Uncertainty Be Constrained over Africa Using Metrics of Contemporary Performance ? Clim. Chang. 2016, 134, 621–633. [Google Scholar] [CrossRef]
  62. Oyerinde, G.T.; Wisser, D.; Hountondji, F.C.C.; Odofin, A.J.; Lawin, A.E.; Afouda, A.; Diekkrüger, B. Quantifying Uncertainties in Modeling Climate Change Impacts on Hydropower Production. Climate 2016, 4, 34. [Google Scholar] [CrossRef]
  63. Nassopoulos, H. Les Impacts Du Changement Climatique Sur Les Ressources En Eaux En Méditerranée. 2013. Available online: https://core.ac.uk/download/pdf/52628295.pdf (accessed on 2 February 2023).
  64. Chirag, H. Environmental Law Research Paper Topic: Impact Of Dams On The Environment. SSRN 2022, 1950311. [Google Scholar] [CrossRef]
  65. Padiyedath Gopalan, S.; Hanasaki, N.; Champathong, A.; Tebakari, T. Impact Assessment of Reservoir Operation in the Context of Climate Change Adaptation in the Chao Phraya River Basin. Hydrol. Process. 2021, 35, 1–19. [Google Scholar] [CrossRef]
  66. Shu, J.; Qu, J.J.; Motha, R.; Xu, J.C.; Dong, D.F. Impacts of Climate Change on Hydropower Development and Sustainability: A Review. IOP Conf. Ser. Earth Environ. Sci. 2018, 163, 012126. [Google Scholar] [CrossRef]
  67. Sterl, S.; Vanderkelen, I.; Chawanda, C.J.; Russo, D.; Brecha, R.J.; van Griensven, A.; van Lipzig, N.P.M.; Thiery, W. Smart Renewable Electricity Portfolios in West Africa. Nat. Sustain. 2020, 3, 710–719. [Google Scholar] [CrossRef]
Figure 1. Study area.
Water 15 02067 g001
Figure 2. Projections of future annual temperature (°C) according to (a) ssp 126 and (b) ssp 370, ISIMIP3b.
Water 15 02067 g002
Figure 3. Temperature and precipitation projections from 10 GCMs for (a) the near future and (b) the far future compared with the reference period (red represents ssp 126 and blue represents ssp 370).
Water 15 02067 g003
Figure 4. Projections of future annual precipitation (mm/a) according to (a) ssp 126 and (b) ssp 370, ISIMIP3b. (The colors represent the full range of the median annual precipitation projected by the ISIMIP3b ensemble. The darkest red and blue colors represent the driest and wettest years in the simulation period, respectively, and the years (colors) between them are interpolated).
Water 15 02067 g004
Figure 5. Inflow and hydropower projections for Manantali Dam in the near future (P1) and far future (P2) compared with the reference period (red represents ssp 126 scenario and blue represents ssp 370).
Water 15 02067 g005
Figure 6. Hydropower potential gains and losses under scenarios DS1, DS2, and DS3.
Water 15 02067 g006
Figure 7. Simulated hydropower generation according to development scenarios DS1, DS2, and DS3 based on ssp 126 and ssp 370.
Water 15 02067 g007
Table 1. Characteristics of the existing and future dams.
Main Characteristics of the DamsManantaliBoureyaKoukoutamba
Maximum capacity, including dead storage (106 m3)12,96655003600
Dead storage (106 m3)33872650678
Maximum head of hydroelectric power station (m)54.165483.7
Turbine capacity (m3/s)455370448
Installed capacity (MW)205160.7294
Firm yield (MW)1005281.1
State ExistingPlannedPlanned
Table 2. Dam development scenarios.
Development ScenarioOperational Dams
DS1Manantali only
DS2Manantali and Koukoutamba
DS3Manantali, Koukoutamba, and Boureya
Table 3. List of performance indicator names, definitions, and measurement methods.
Indicator NameDefinitionMeasurement Method
Production (GWh/a)Mean annual electricity productionMean electricity production during the simulated periods compared with the reference
Spill (Mm3/a)Spilled volumeSum of the volumes spilled during the simulated periods compared with the reference
Probability of exceedanceThe exceedance probability corresponds to the annual electricity production level that is reached with a defined probability Probability of exceedance (P99, P90, and P95) during the simulated periods compared with the reference
ReliabilityFrequency of failure statesNumber of months the request is met/the total number of months in the simulation period × 100
Table 4. Water balance components and hydropower potentials of Manantali Dam under climate change (DS1).
P0 P1 (2035–2065)P2 (2065–2095)
ssp 126% of Changessp 370% of Changessp 126% of Changessp 370% of Change
Prec. (mm/a)443.0445.00.45%440.1−1%423.8−4%407.6−8%
Inflow (BCM)9213.29765.16%9130.5−1%8633.5−6%7988.0−13%
Total_in (BCM)9663.010,236.06%9577.2−1%9068.2−6%8403.2−13%
Outflow (BCM)7848.18364.07%7735.5−1%7272.9−7%6700.8−15%
ETa860.0889.23%885.73%886.33%906.25%
Spill (BCM)0.71.051%0.77%0.812%0.3−54%
HPP (GWh_a)820.0846.03%814.0−0.70%757.0−8%702.0−14%
EP 90 (MW)60.771.618%60.50%54.0−11%43.7−28%
EP 95 (MW)48.061.729%52.59%45.2−6%36.1−25%
EP 99 (MW)35.048.137%41.819%34.5−1%25.8−26%
Table 5. Hydropower potential at the Manantali Dam under development scenarios DS1, DS2, and DS3.
DS1DS2% of Change DS3% of Change
Spill (BCM)0.70.5−31%0.2−64%
Reliability (%)85.882.5 63.7
Table 6. HPP of the Manantali Dam according DS1 (Manantali), DS3 (Manantali, Koukoutamba, and Boureya), and climate change under ssp 126 and ssp 370 in the near and far future (P2 and P3) compared with the reference period.
P0 (DS1)P0 (DS3)P1 (DS3)P2 (DS3)
ssp 126ssp 370ssp 126ssp 370
Spill (BCM)0.70.20.40.30.30.1
HPP (GWh/a)813.5734.2805.1748.5676.3572.2
EP 90 (MW)60.753.360.156.450.643.2
EP 95 (MW)4849.454.451.947.137.8
EP 99 (MW)3537.848.640.54229.7
Reliability (%)85.863.782.371.863.431.2
Table 7. Hydropower potential (GWh/a) of the Bafing watershed under the three development scenarios based on ssp 126 and ssp 370.
Scenario P0 P1P2
ssp 126ssp 370ssp 126ssp 370
DS 1Manantali820846814757702
DS 2Manantali793828793728668
Koukoutamba879905855814749
DS 3Manantali727779723661592
koukoutamba879905855814749
Boureya601617584559513
Disclaimer/Publisher’s Note: The statements, opinions and data contained in all publications are solely those of the individual author(s) and contributor(s) and not of MDPI and/or the editor(s). MDPI and/or the editor(s) disclaim responsibility for any injury to people or property resulting from any ideas, methods, instructions or products referred to in the content.

