Article

Optimizing the Pump Storage System for Hot Water Showering at Swimming Pools

Department of Building Environment and Energy Engineering, Research Institute for Smart Energy, The Hong Kong Polytechnic University, Hong Kong, China
*
Author to whom correspondence should be addressed.
Water 2023, 15(11), 2083; https://doi.org/10.3390/w15112083
Submission received: 25 April 2023 / Revised: 23 May 2023 / Accepted: 28 May 2023 / Published: 31 May 2023
(This article belongs to the Special Issue Smart Water and the Digital Twin)

Abstract

:
Previous studies have demonstrated the energy- and water-saving potentials of showering facilities in residential buildings. However, the prospect of public showering places where multiple showerheads usually worked together according to their opening hours has often been overlooked and rarely investigated. This study measured the water flow rate in a water supply pipe to understand the water-use patterns and water consumption of showering facilities in a swimming pool. The measurements were carried out on typical cold and warm days. The results showed that the average water consumption was 50.5 L/person in December (T = 19.7 °C) and 38.6 L/person in April (T = 24.5 °C). The fluctuation of the water flow rate demonstrated a water demand pattern for the showering facilities, where the maximum water flow rate was more than twice the average level, indicating inefficient working modes of the water supply pump. To improve the current situation, an appropriately sized water tank was suggested to be installed, which could ensure a more stable water flow rate in the main supply pipe, enhancing the water supply system efficiency and saving energy for the water pump. These results contribute to establishing the design data for optimizing water tank design in swimming pools or similar buildings with public showering demand and illustrate the energy-saving potential of water supply systems in showering facilities. Nevertheless, the results of this study are only based on theoretical calculations. More comprehensive field studies with a water tank are required to confirm these findings and better elucidate the effects.

1. Introduction

To combat climate change, all parts of the world are actively taking action to save energy and reduce carbon emissions. One of the simplest and most effective methods is to increase energy prices. Because of the rise in energy prices, reducing energy consumption in water utilities, especially water supply systems, has also attracted much attention since considerable energy is consumed in each stage, including water pumping, treatment, and distribution [1,2,3]. Statistics indicate that most of the energy consumed in water supply systems is because of pumping [2]. An investigation of pumping systems showed that many existing pump stations are oversized by more than 20%, which leads to inefficient pump operation and high energy consumption [4]. Therefore, an efficient water supply system has significant potential to save energy.
Building water supply systems can be divided into two types: direct and indirect [5]. The direct water supply system conveys water directly from the public water main to the end users without any transit water storage tanks. This system is easy to install and maintain, and the construction cost is low. However, the water supply could be more stable. The energy consumption is relatively high since the pump is selected based on the maximum demand and usually operates with very low efficiency [5]. In contrast, an indirect water supply system conveys water from the public water main to the end users through a transit water storage tank (such as a roof water tank). This system can provide stable water and save energy since the pump can work on its practical point. However, it also has disadvantages; for example, longer water retention times in the storage tank might damage the water quality [6].
To date, water supply systems for buildings and facilities are designed mainly based on practical cases and existing standards. The total water supply requirement criteria in most established practices are determined to meet the simultaneous maximum water demand [7,8]. Several studies have pointed out that it may not be an optimal solution because the maximum simultaneous water demand usually lasts only for a short time over the system lifetime, and the proper design of the water tank and pump efficiency can help lower the energy use [9,10]. Moreover, design practices have yet to be sufficiently concerned with public showering places, such as swimming pools. The energy conservation potential of optimizing the water supply system is often overlooked, especially in public showering places where multiple showerheads usually work together according to their opening hours (such as swimming pool-associated showering facilities), resulting in several regular water demand peaks.
Swimming is one of the most popular sports/leisure activities for modern people, and it is almost a daily activity for people living in tropical or subtropical cities, such as Singapore [11] and Hong Kong [12]. Considering the large amount of water and energy consumed by swimming pools, many studies have been conducted in the past decades to try to reduce the water consumption in the pools and the energy used to heat the water [13,14,15]. According to these studies, using solar power seems to be the standard solution for energy conservation in heating water in swimming pools in different areas worldwide. For example, Chow et al. [15] designed a solar-assisted heat pump to heat the water in an indoor swimming pool in Hong Kong; Tagliafico et al. [14] tested a solar-assisted heat pump in a swimming pool in Italy; Marinopoulosa and Katsifarakisa [13] compared the functions of solar thermal collectors, photovoltaic panels, and other methods in a swimming pool in Greece. All of these studies demonstrated the high energy-saving efficiencies of solar energy-related systems.
Apart from the water and energy consumed by the pools, the showering facilities, which are the necessary infrastructure of swimming pools, also spend a considerable amount of water and energy since all swimmers are encouraged to shower before swimming, and most of them do it again after swimming, concerning public health and personal hygiene. According to a field investigation on water consumption in swimming pools, it was the showers (34.7%), instead of the pools (25.6%), that consumed the highest percentage of water in the swimming pool [16]. However, almost all the existing studies only focused on the water and energy consumed by the pool itself. More attention should be paid to the water usage patterns of the showering facilities in swimming pools.
Additionally, previous studies have demonstrated the energy- and water-saving potentials of showering facilities in residential buildings and proposed several improvement strategies [10,17]. Similar or even greater potential for water and energy savings is expected for public showering facilities, such as swimming pools since more showerheads are installed and usually have fixed opening schedules. However, to date, there are no related published data. Thus, much research is still needed to optimize water supply systems and reduce energy consumption in public showering places. Hong Kong, as one of the most global cities in the Great Bay Area, can be a good showcase region for demonstrating the optimization of water supply systems in the showering area of swimming pools. The government manages 45 public swimming pools in Hong Kong, and they are all equipped with showering facilities [18]. Therefore, this study was conducted to identify the problems in current water supply systems for showering in these swimming pools and propose suggestions to improve energy efficiency in similar public showering places.

2. Materials and Methods
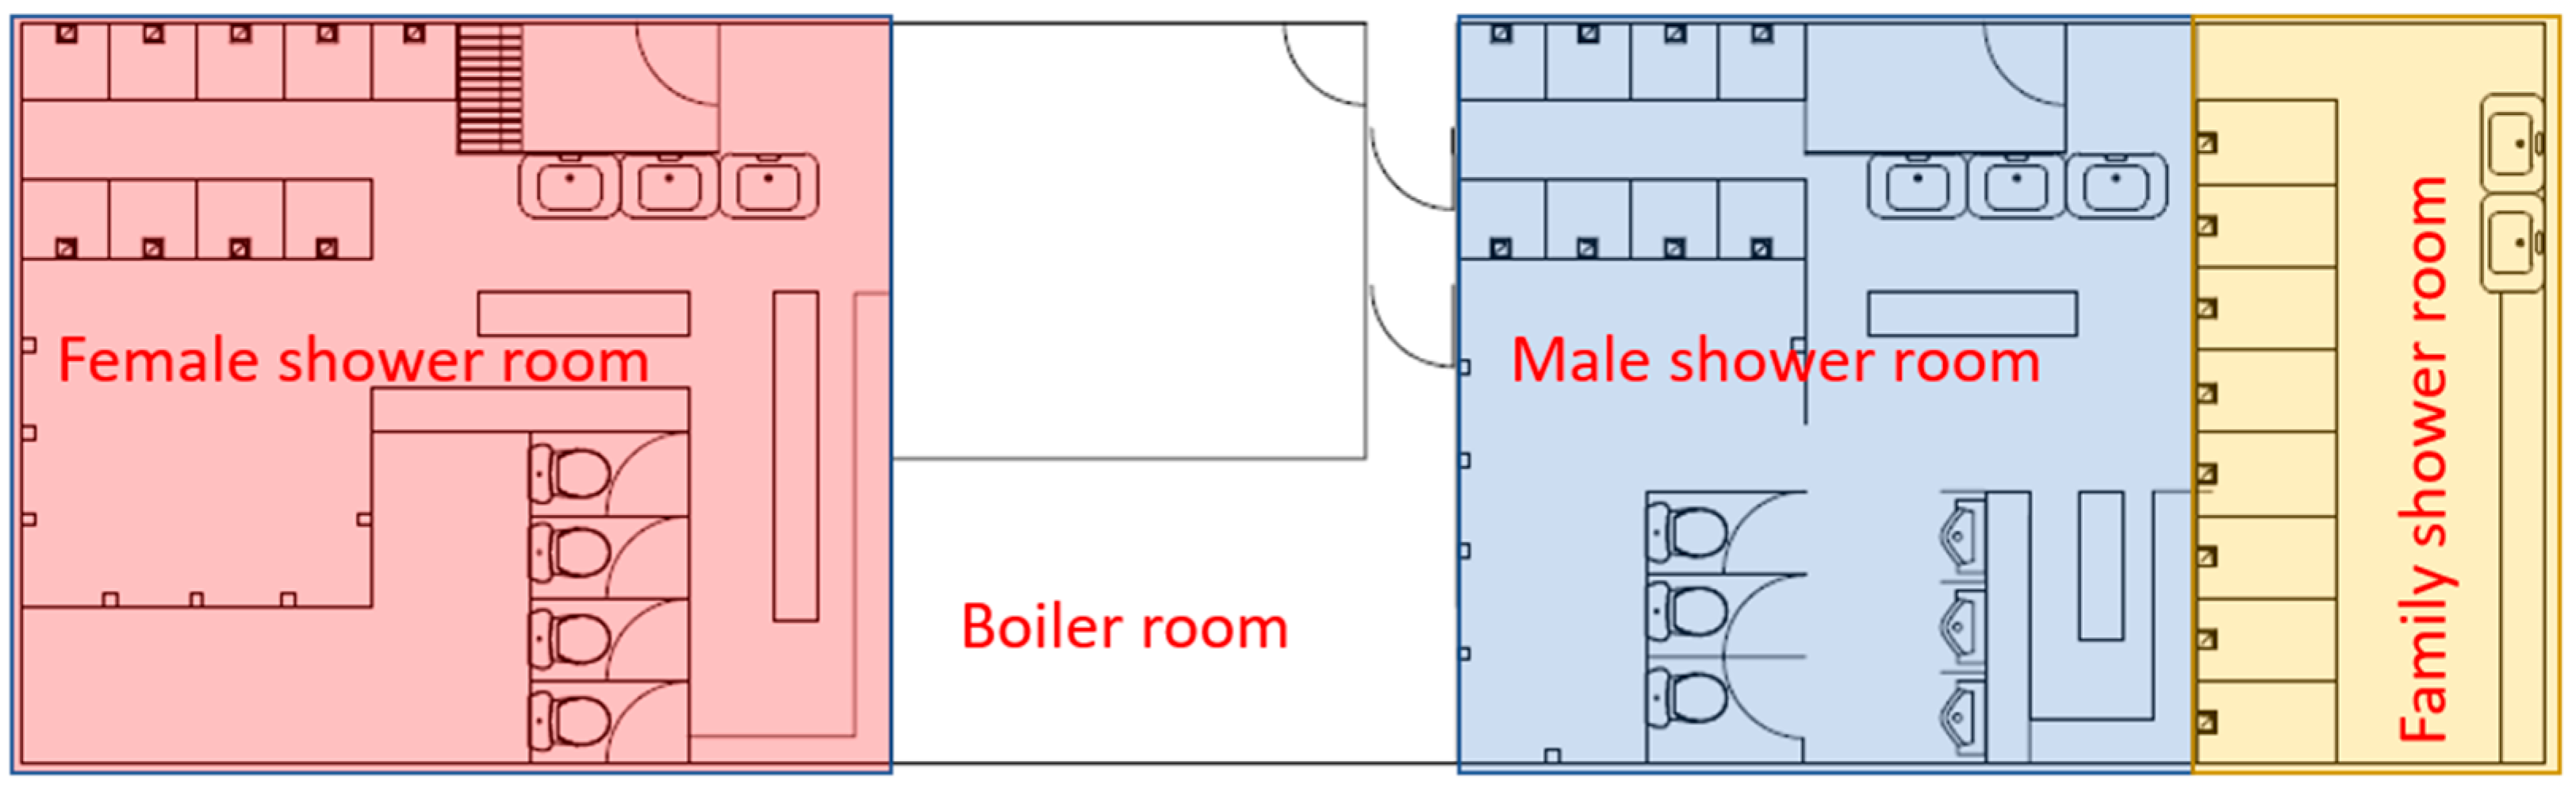
Three main research steps were involved in this study. As shown in Figure 1, a swimming pool with public showering facilities was first selected. Then, the water flow rate was measured on-site in the chosen swimming pool. At last, the collected data were analyzed to understand the water demand patterns and water consumption of the investigated showering facilities. The following subsections provide detailed information about each of these stages.

2.1. Site Selection

To identify a clear and representative water consumption pattern during showering in public swimming pools, the following criteria were applied when selecting the investigation sample: (ⅰ) open at least for one year; (ⅱ) have more than 20 showering heads; and (ⅲ) have a clear available schedule. Accordingly, a swimming pool showering facility in Hong Kong, China was selected as the case investigated in the current study (see Figure 2).
The swimming pool was only open for conducting swimming lessons, and the opening hours were from 16:30 to 19:30. Two one-hour classes were held every weekday from 17:00 to 18:00 and from 18:00 to 19:00. The swimming pool showering facility had three rooms for male, female, and family users, accounting for 25 shower heads (see Figure 3). The water was directly supplied from the public main to the water facilities in the swimming pool.

2.2. Data Collection

To investigate the water demand, the instantaneous water flow velocity (m/s) in the main water supply pipe was measured and recorded using a portable ultrasonic flowmeter Micronics Portaflow 330 (Micronics Ltd., Loudwater, UK) [8], at intervals of 5 s. The measurements were conducted on two days during the opening hours of December 2020 and April 2021. Two sets of ultrasonic transducers were attached to the main water supply pipe of the showering facilities for the measurement. To obtain accurate measurement results, the transducers were positioned on a straight pipe with at least 20 times the pipe diameter (40 mm in the current case) to the upstream side and 10 times the pipe diameter to the downstream side, according to the instructions provided in the user manual [8].
Apart from the measurement, the number of occupants was recorded by checking the swimming pool entry records during the measurement periods. The average room temperatures in the swimming pool were also recorded according to the thermometer installed in the shower room to examine the impact of room temperature on water consumption for showering.

2.3. Data Processing

Based on the measurement results, the real-time water flow rate in the swimming pool can be calculated using the following equation:
Q = v A 1000 60
where Q is the water flow rate, L/min; v is the measured water flow velocity, m/s; and A is the cross-sectional area of the main pipe, m2.
Using the real-time water flow rate, the water consumption per capita can be calculated in the following steps. First, the maximum, minimum, and average water flow rates of the showering facilities during the opening hours were calculated. Second, the daily water consumption was obtained by multiplying the average flow rate and the opening time since the measurement duration was the same as the swimming pool’s opening hours. Third, the water consumption per capita in the shower rooms of the investigated swimming pool was calculated by dividing the total water flow rate by the number of occupants.
Then, the water flow rate data were imported to IBM SPSS Statistics 27.0 (SPSS Inc. Chicago, IL, USA), and paired samples t-tests were performed to assess the differences in water flow rates in different seasons. A p-value < 0.05 was considered significant.
Additionally, to better understand the water consumption pattern, the dimensionless load variation factor ( φ t ) was applied in this study and calculated using Equation (2). The graph of time against load variation factor demonstrates the water demand variation over the whole measurement period, which helps show the overall trend of the water demand and the utilization rate of the system.
φ t = instantaneous   water   flow   rate maximum   water   flow   rate

3. Results

3.1. Water Consumption during Different Seasons

In total, 27 people, including 3 instructors and 24 students (12 for each lesson), used the showering facilities during the measurements in both seasons. Figure 4 shows the water flow rates in the main water supply pipe of the showering facilities in the investigated swimming pool. As can be seen, the water flow rate was higher in December than in April. The difference was evident in the periods after Lesson 1 (during Lesson 2) and after Lesson 2, as students were taking showers during that time. In contrast, almost no difference in the water flow rate can be identified between these two months during Lesson 1, and the water flow rate remained stable (about 5 L/min) during this period. This is caused by the water curtain located at the swimming pool’s entrance, where chlorinated water continuously flows down at a fixed rate during the opening hour of the swimming pool. All swimmers must pass through it before going to the swimming pool to protect the water quality.
According to the paired samples t-test results, the differences in the water flow rate between different seasons were always significant (p < 0.05), regardless of the periods (see Table 1). In December, the average water flow rate was 7.57 (between 0.08 and 19.98) L/min; in April, it was 5.79 (between 0.08 and 216.36) L/min. Then, based on the water flow rate and the time duration, the water consumption of the showering facilities can be calculated, which was 1363 L (50.49 L/person) and 1043 L (38.64 L/person) in December and April, respectively.

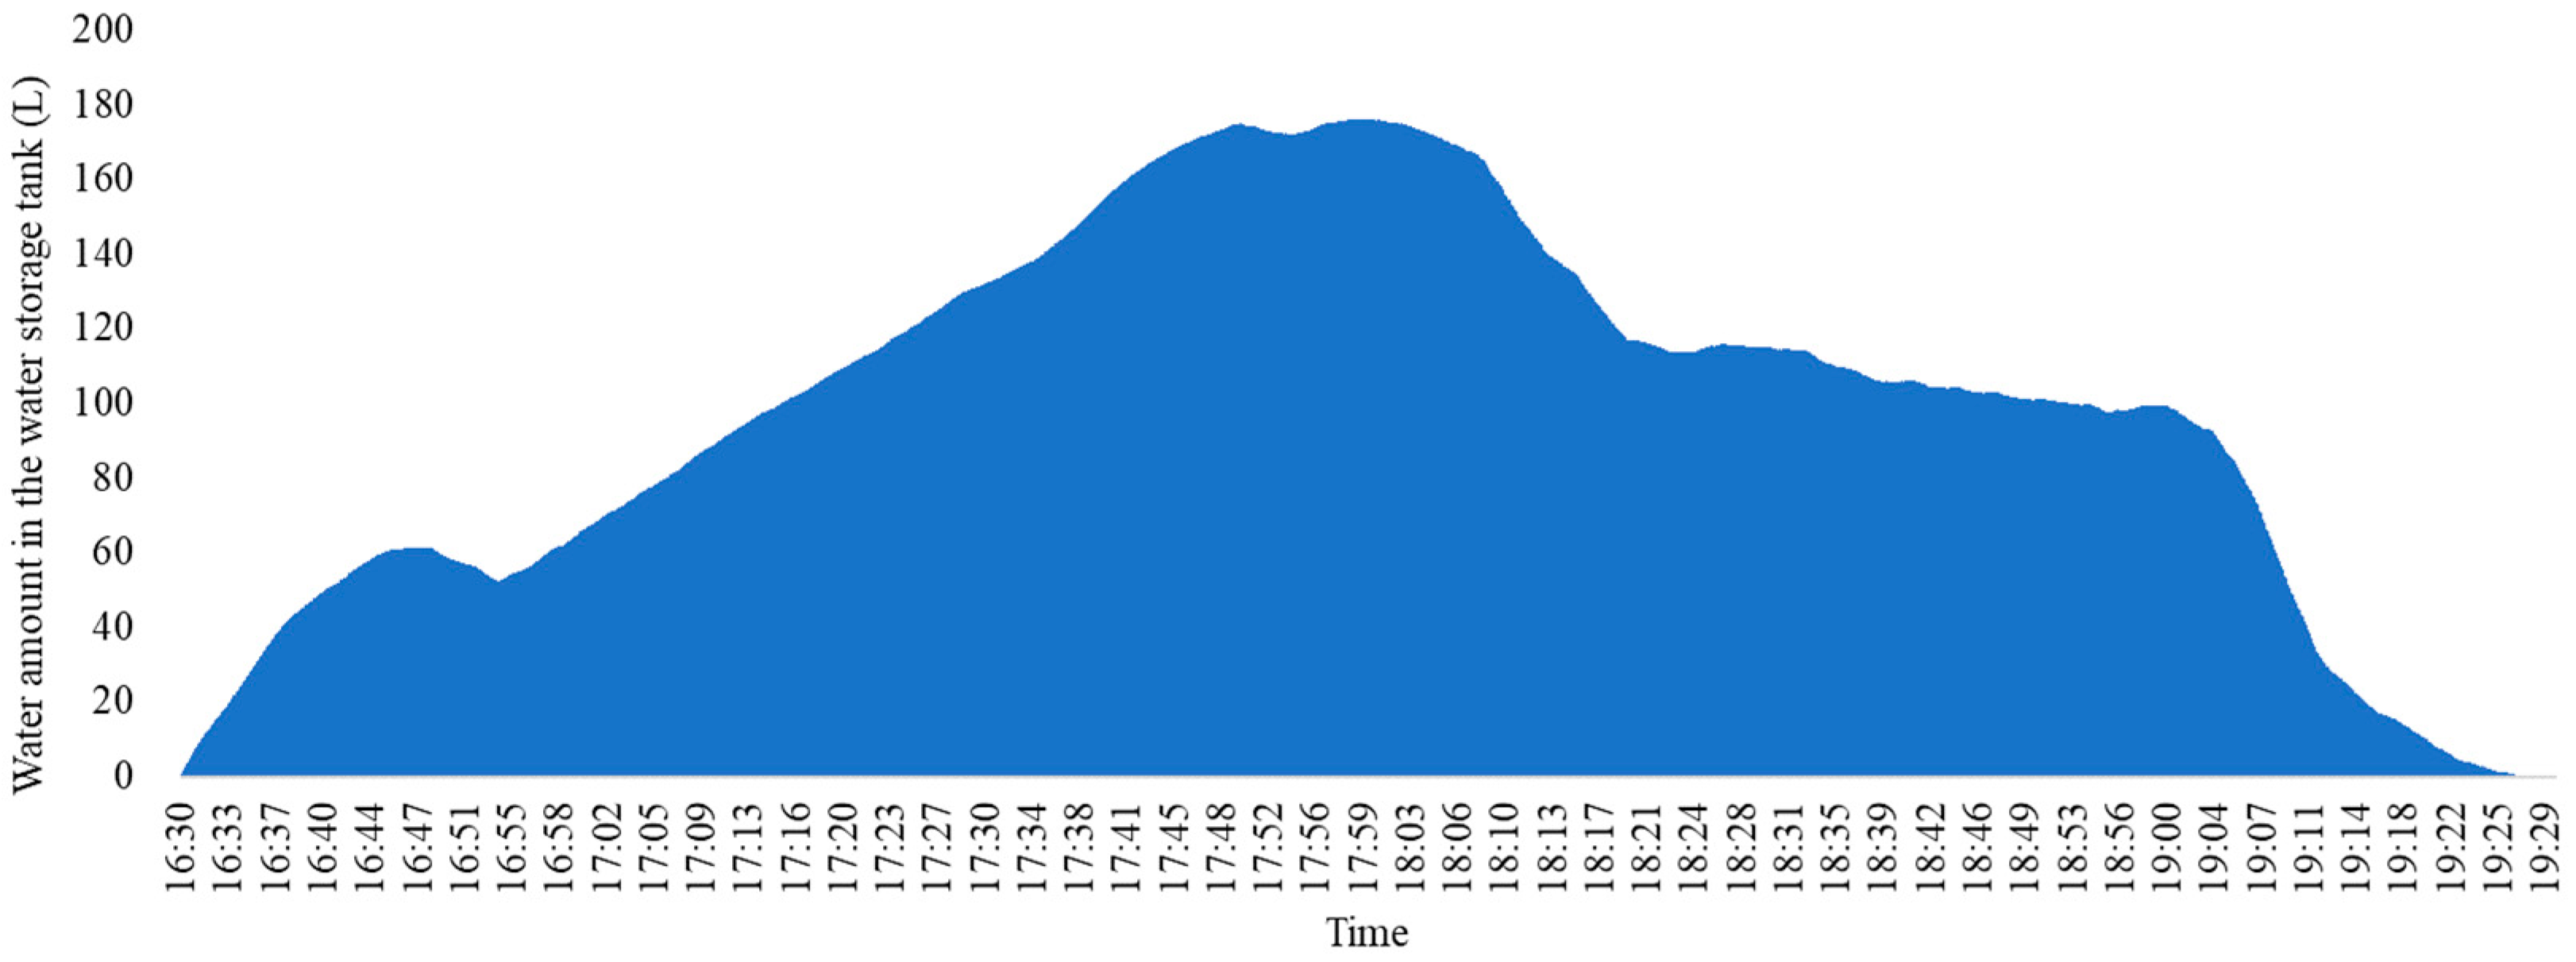
3.2. Water Demand Pattern for the Showering Facilities

As shown in Table 1, although there were considerable differences in the water supply flow rate between the two seasons, the change patterns were the same, namely, the peak periods always occurred after the swimming lessons between 18:00 and 18:20 and between 19:00 and 19:20. To better understand the water demand pattern, the load variation factor of the instantaneous water flow rate measured in both seasons in the main supply pipe for showering facilities was calculated for every 10 min using Equation (2), as illustrated in Figure 5. The maximum water load variation factor was 1 (corresponding to 19.98 L/min water flow rate), which occurred at 19:07 after the end of the second lesson in December.
As shown in Figure 5, water consumption rose significantly before and after the start and end of each lesson. This could be caused by the fact that all the swimmers, including students and instructors, were asked to shower before the swimming lesson to keep the pool clean, and they all also took a shower after the swimming lesson for personal hygiene. Since both the students and the instructor took showers after the second lesson, it resulted in the highest water demand during the investigation. Additionally, according to the field observations, people shower longer after swimming for better personal cleaning.
Furthermore, it can be seen that the average load variation factor was below 0.5 almost all the time, even during the peak periods. It indicates that the water supply flow rate could have been reduced to save pump power on frictional pipe loss and the efficacy of the pump-sparing capacity.

3.3. Improvement with Proper Storage Tank

Several previous studies have indicated that installing an appropriately sized water storage tank is one of the effective ways to improve the energy efficiency of the water supply system [19,20,21]. Using a water storage tank (see Figure 6), water can be supplied from both the main supply pipe and the tank during the peak time so that the water flow rate in the main supply pipe can be maintained at a relatively stable and low level.
To ensure the water supply during peak periods, the water supply system and the water pump had to be designed based on the maximum demand, which caused the pump to work at a low efficiency most of the time. For instance, the average water flow rate in the investigated shower rooms was 7.57 L/min in December (represented by a straight line in Figure 7). However, the maximum water flow rate was 19.98 L/min, which was more than twice the average level. If a water storage tank is installed, an average water supply rate can be maintained. Under this circumstance, as shown in Figure 7, the water will be stored in the tank when the water demand is lower than the average level (the shadow below the average line). This stored water will be conveyed to the users, together with the water coming from the main supply pipe, will be conveyed to the users when the demand exceeds the average level.
The water tank storage volume ( V 0 ) should be at least equal to the maximum water amount stored in the tank, which can be calculated based on Equation (3) [22].
V = t 0 t q w d t q 0 t t 0 + V 0
where V (L) is the total volumetric water consumption, q w is the water demand (L/min) within the water demand period t 0 t , t is time (min), q 0 is the water flow rate in the main supply pipe (L/min), and V 0 is the volume of the water storage tank (L). The solution pair of Equation (3) ( V 0 , q 0 ) should meet the following requirements at a given time within the water demand period.
V 0 = m a x t 0 t ( q w q 0 ) d t
The minimum volume of the water storage tank is 0 L when the q 0 is large enough to meet the water demand alone, i.e., q 0 = max ( q w ) ; whereas the maximum volume is V when the water loads of both the tank and the main pipe are equal to half of the demand, i.e., q 0 = q 0 , = V t t 0 .
It is assumed that the water flow rate in the main supply pipe is maintained at the average flow rate of the measurement period (i.e., 7.57 L/min) for the actual water demand pattern in December. Using Equation (4), the water amount stored in the tank can be calculated.
Figure 8 illustrates the variation in the amount of water in the tank with time for a scenario in which no water is stored in the tank before the opening hour (i.e., 16:30). The water outflow rate from the tank is lower than the water inflow rate during the initial period. Hence, the extra water inflow is stored in the tank and accumulates with time until the peak (after 18:00) to the full-tank capacity of 176 L. During the peak period, the water outflow rate is higher than the water inflow rate. Therefore, extra water outflows from the tank, and the in-tank water amount decreases with time. The water supply system and the pump operate stably in this case. The system demands are equally distributed throughout this period.
The water pumping energy for the pipe flow is determined by Equation (5), where ρ (kg/m3) is the water density, g (9.8 m/s2) is the gravitational force, h (m) is the height difference between the tank water surface and the baseline, H f is the friction head loss, and H j is the tank exit head loss. Both H f and H j are proportional to the square of the water velocity in the pipe. Therefore, decreasing the water velocity (or water flow rate when the pipe cross-section is the same) could significantly reduce the head losses in the pipe, and thus save a considerable amount of water pumping energy. Take the current case as an example; if the maximum water flow rate in the main pipe decreases by around 60% (from 19.98 to 7.57 L/min), then the maximum reduction of the head losses in the pipe could be 84% (= 1 − 0.4 × 0.4). In other words, by installing a properly sized water storage tank, the water pump capacity could be reduced by up to 84%.
E p u m p = ρ g ( h + H f + H j )
H f ,   H j   q 0   2

4. Discussions

4.1. Impact of Seasonal Climate on Showering Water Consumption

Figure 2 shows a significant difference in showering water consumption during the different seasons. Since the number of occupants was the same in these two measurement periods, the significant difference in the total water flow rate was most likely due to seasonal variations in user habits. According to the Hong Kong Observatory, the daily outdoor temperature was 15.9–20.7 °C (mean = 18.1 °C) in December 2021, and it was 22.4–27.0 °C (mean = 24.1 °C) in April 2022 [23]. The thermostat in the shower room indicated that the average room air temperature was maintained at around 19.7 °C in December and around 24.5 °C in April. The different room temperatures might lead to the showering behaviors of other users.
According to a survey conducted by Ohnaka et al. [24], the water flow rate people chose was negatively related to the water temperature. Additionally, the supply water temperature was positively correlated with the outdoor temperature [25]. Therefore, it could be inferred that the lower the room temperature, the higher the preferred water flow rate, resulting in a higher simultaneous demand for operating showerheads. Thus, a higher water flow rate in the showering facilities was observed in December than in April in the current study. Considering that the water flow rate has a more significant impact than the air temperature on the total energy consumed during showering [17], a higher temperature should be maintained in the shower room to lower the water flow rate and save energy.

4.2. Implication of the Water Storage Tank

The water supply network accounts for the most significant proportion of energy consumption in a city, especially in developed and high-density ones, such as Hong Kong and Tokyo [26,27]. Therefore, improving the energy efficiency of the water supply systems in buildings effectively saves energy and reduces carbon emissions. The results of this study suggest that installing a suitably sized water tank may help prevent using an oversized and low-efficient pump and improve the energy efficiency of the whole water supply system. Although this method has been applied to many residential buildings [20], it has rarely been studied in public showering places associated with swimming pools. The daily water demand curve is relatively consistent since these places have precise operating schedules and occupation limitations. Thus, the average water demand can be predicted. Therefore, selecting an appropriately sized water tank using the methods proposed in this study and fixing the water flow rate at the average water demand could conserve energy to the maximum extent. In addition, this method could avoid the water quality problems of traditional water tanks since the water storage amount matches the water demand, and no extra amount of water is stored in the tank after operating hours. Nevertheless, the installation space should be considered when installing a water storage tank.

4.3. Limitations of the Current Study and Suggestions for Future Research

The current study’s findings must be interpreted with caution because of the following two limitations of this research. The first limitation is the limited sample size. Due to time constraints and limited access to the equipment of the swimming pools, the measurement was only conducted over two days at one investigation site. This small sample size might have led to a bias. However, since most public swimming pools in Hong Kong are uniformly managed by the government (i.e., the Leisure and Cultural Services Department), the facilities are similar in all the swimming pools [18]. Therefore, the problem identified in this study is not a chance finding, and the suggestions can be applied to other swimming pools. These findings can also be used as a reference for water and energy conservation in swimming pools outside Hong Kong or any other public showering place in a hot and humid climate. Nonetheless, because different users might have different showering habits, broader and longer data collection periods are recommended for future research to determine the proper size of the water tank.
The second limitation is the need for more verification. The suggestion of installing a water storage tank is only based on the theoretical calculations in this study. Although the advantage is relatively straightforward, the specific and practical effectiveness of this solution is yet to be discovered. Therefore, future studies are suggested to establish a prototype of the water supply system with a water storage tank and test the actual effect of the water tank on energy and water saving. Additionally, more energy-saving technologies, such as the solar energy-related systems proposed in previous studies [13,14,15], are recommended to be used with water tanks to achieve minimum energy consumption in swimming pools.

5. Conclusions

To understand the current water supply pattern and water consumption in public showering places, this study investigated the water flow rate in a swimming pool’s main supply pipe for showering facilities. The results showed a significant impact of the room temperature on the water flow rate during showering. The higher the room temperature, the lower the water flow rate (i.e., 7.57 L/min in December, whereas it was 5.79 L/min in April) was observed. Since the water flow rate has a more significant influence on the total energy consumption during showering than the air temperature, a higher room temperature was recommended to be maintained in the shower room to reduce water and energy consumption. Additionally, this study found a clear water demand pattern for the showering facilities during the opening hours, which depended on the schedule of the swimming lessons since the occupants took a shower before and after the swimming lessons. According to the water demand pattern, the load variation factor was lower than 0.5 most of the time, indicating that the water supply system and the water pump did not work efficiently. To improve the efficiency of the water supply system and to save energy, a water storage tank with proper volume that could ensure a stable water supply rate was suggested to be installed. Nevertheless, installation space should be allowed for a water storage tank. This case study demonstrated the water- and energy-saving potential of public showering facilities and supported future improvements in water supply systems in public showering facilities. Future studies are encouraged to conduct a broader and longer field study to identify the proper size of the water tank, establish a prototype of the water storage tank, and test its actual effect in a public showering place.

Author Contributions

Conceptualization, L.-T.W. and K.-W.M.; methodology, L.-T.W. and K.-W.M.; software, D.Z.; validation, D.Z.; formal analysis, L.-T.W., C.-S.C. and D.Z.; investigation, L.-T.W., C.-S.C. and D.Z.; resources, L.-T.W. and K.-W.M.; data curation, C.-S.C. and D.Z.; writing—original draft preparation, C.-S.C. and D.Z.; writing—review and editing, L.-T.W. and K.-W.M.; visualization, D.Z.; supervision, L.-T.W. and K.-W.M.; project administration, K.-W.M.; funding acquisition, L.-T.W. and K.-W.M. All authors have read and agreed to the published version of the manuscript.

Funding

This research was supported by a grant from the Research Grants Council of the Hong Kong Special Administrative Region, China (Project no. 15217221, PolyU P0037773/Q86B).

Data Availability Statement

The data presented in this study are available upon request from the corresponding authors.

Conflicts of Interest

The authors declare no conflict of interest.

Abbreviations

The following abbreviations are used in this manuscript:
V0Water tank storage volume (L)
VTotal water consumption of the showering facilities during the opening hour per day (L)
𝑞𝑤Water demand rate (L/min) during the opening hour
𝑞0Water flow rate in the main supply pipe (L/min)
𝐸𝑝𝑢𝑚𝑝Water pumping energy (kg·m/s)
𝜌Water density (kg/m3)
gGravitational force, 9.8 m/s2
hHeight difference between the tank water surface and the baseline (m)
𝐻𝑓Friction head loss (m)
𝐻𝑗Tank exit head loss (m)

References

  1. Feldman, M. Aspects of Energy Efficiency in Water Supply Systems. In Proceedings of the 5th IWA Water Loss Reduction Specialist Conference, Cape Town, South Africa, 26–30 April 2009. [Google Scholar]
  2. Abe, B.T.; Shrivastava, P.; Moloi, K. A review of energy consumption in water supply systems. In Proceedings of the IEEE AFRICON, Accra, Ghana, 25–27 September 2019; pp. 1–4. [Google Scholar]
  3. Lam, K.L.; Kenway, S.J.; Lant, P.A. Energy use for water provision in cities. J. Clean. Prod. 2017, 143, 699–709. [Google Scholar] [CrossRef]
  4. Hydraulic Institute; Europump; U.S. Department of Energy (DOE). Variable Speed Pumping—A Guide to Successful Applications. 2004. Available online: https://www1.eere.energy.gov/manufacturing/tech_assistance/pdfs/variable_speed_pumping.pdf (accessed on 22 May 2023).
  5. Gómez, E.; Cabrera, E.; Balaguer, M.; Soriano, J. Direct and indirect water supply: An energy assessment. Procedia Eng. 2015, 119, 1088–1097. [Google Scholar] [CrossRef]
  6. Manga, M.; Okeny, L.O.; Ngobi, T.G.; Pamela, A.O.; Namakula, H.; Kyaterekera, E.; Nansubuga, I.; Kibwami, N. Impacts of storage tanks under the indirect cold water supply system on household water quality: A case of Wakiso District, Uganda. Water Supply 2021, 22, 3072–3085. [Google Scholar] [CrossRef]
  7. California Public Utilities Commission Water Division. Standard Practice for Determination of Water Supply Requirements of Water Systems (Standard Practice U-22); California Public Utilities Commission Water Division: San Francisco, CA, USA, 2005.
  8. Hong Kong Water Supplies Department. Technical Requirements for Plumbing Works in Buildings; Hong Kong Water Supplies Department: Hong Kong, China, 2021.
  9. Vrana, J.; Jaron, Z.; Kucharik, M. Peak flow rates measured in residential buildings. In Proceedings of the 42nd CIBW062 International, Kosice, Slovakia, 29 August–1 September 2016; pp. 34–44. [Google Scholar]
  10. Zhou, Y.; Mui, K.-W.; Wong, L.-T. Evaluation of design flow rate of water supply systems with low flow showering appliances. Water 2019, 11, 100. [Google Scholar] [CrossRef]
  11. Chan, Y.K. ‘Sports is Politics’: Swimming (and) Pools in Postcolonial Singapore. Asian Stud. Rev. 2016, 40, 17–35. [Google Scholar] [CrossRef]
  12. Eye on Asia. Asia Research Poll: Most Popular Sports in Asia. DataSpring. 15 July 2019. Available online: https://www.d8aspring.com/eye-on-asia/infographic-asia-research-poll-most-popular-in-asia (accessed on 28 February 2023).
  13. Marinopoulos, I.S.; Katsifarakis, K.L. Optimization of Energy and Water Management of Swimming Pools. A Case Study in Thessaloniki, Greece. Procedia Environ. Sci. 2017, 38, 773–780. [Google Scholar] [CrossRef]
  14. Tagliafico, L.A.; Scarpa, F.; Tagliafico, G.; Valsuani, F. An approach to energy saving assessment of solar assisted heat pumps for swimming pool water heating. Energy Build. 2012, 55, 833–840. [Google Scholar] [CrossRef]
  15. Chow, T.T.; Bai, Y.; Fong, K.F.; Lin, Z. Analysis of a solar assisted heat pump system for indoor swimming pool water and space heating. Appl. Energy 2012, 100, 309–317. [Google Scholar] [CrossRef]
  16. Silva, F.; Antão-Geraldes, A.M.; Zavattieri, C.; Afonso, M.J.; Freire, F.; Albuquerque, A. Improving water efficiency in a municipal indoor swimming-pool complex: A case study. Appl. Sci. 2021, 11, 10530. [Google Scholar] [CrossRef]
  17. Zhang, D.; Mui, K.-W.; Wong, L.-T. Establishing the Relationship between Occupants’ Thermal Behavior and Energy Consumption during Showering. Buildings 2023, 13, 1300. [Google Scholar] [CrossRef]
  18. Hong Kong Leisure and Cultural Services Department. Swimming Pools in Hong Kong; Hong Kong Leisure and Cultural Services Department: Hong Kong, China, 2022. Available online: https://www.lcsd.gov.hk/en/beach/swim-intro/swimlocation.html (accessed on 28 February 2023).
  19. American Water Works Association. M42 Steel Water Storage Tanks; American Water Works Association: Denver, CO, USA, 2013. [Google Scholar]
  20. Cheung, C.-T.; Mui, K.-W.; Wong, L.-T. Energy efficiency of elevated water supply tanks for high-rise buildings. Appl. Energy 2013, 103, 685–691. [Google Scholar] [CrossRef]
  21. Palkin, G.; Suvorov, I.; Gorbunov, R. Evaluation of Ways to Improve the Energy Efficiency of Sites of First Rise Supply Water Systems with Storage Tank by Laboratory Modeling. In Proceedings of the International Ural Conference on Green Energy (UralCon), Chelyabinsk, Russia, 4–6 October 2018; pp. 227–234. [Google Scholar]
  22. Wong, L.-T.; Mui, K.-W.; Zhou, Y. Energy efficiency evaluation for the water supply systems in tall buildings. Build. Serv. Eng. Res. Technol. 2017, 38, 400–407. [Google Scholar] [CrossRef]
  23. Hong Kong Observatory. Monthly Weather Summary; Hong Kong Observatory: Hong Kong, China, 2023. Available online: https://www.hko.gov.hk/en/wxinfo/pastwx/mws/mws.htm (accessed on 28 March 2023).
  24. Ohnaka, T.; Tochihara, Y.; Watanabe, Y. The effects of variation in body temperature on the preferred water temperature and flow rate during showering. Ergonomics 1994, 37, 541–546. [Google Scholar] [CrossRef] [PubMed]
  25. Wong, L.-T.; Mui, K.-W.; Guan, Y. Shower water heat recovery in high-rise residential buildings of Hong Kong. Appl. Energy 2010, 87, 703–709. [Google Scholar] [CrossRef]
  26. Shimizu, Y.; Dejima, S.; Toyosada, K. The CO2 emission factor of water in Japan. Water 2012, 4, 759–769. [Google Scholar] [CrossRef]
  27. Hong Kong Electrical And Mechanical Services Department. Hong Kong Energy End-Use Data 2022; Hong Kong Electrical and Mechanical Services Department: Hong Kong, China, 2022.
Figure 1. The research process of this study.
Water 15 02083 g001
Figure 2. Images of the selected swimming pool: the site location (a); the swimming pool (b); and the shower rooms (c).
Water 15 02083 g002
Figure 3. Floor plan of the shower rooms of the swimming pool.
Water 15 02083 g003
Figure 4. Fluctuation of water flow rate with time.
Water 15 02083 g004
Figure 5. Load variation factor on water consumption for showering facilities.
Water 15 02083 g005
Figure 6. Schematic of the water storage tank at a storage volume of V 0 .
Water 15 02083 g006
Figure 7. The real-time water demand and average water flow rate (i.e., optimized water supply rate) in December.
Water 15 02083 g007
Figure 8. Variation of water amount in the water storage tank with time.
Water 15 02083 g008
Table 1. The water flow rate (L/min) in the main water supply pipe of the showering facilities.
MaxMinMean (S.D.)
16:30–16:5917:00–17:5918:00–18:5919:00–19:30All
December
(Colder season)
19.980.085.42 (2.44)5.71 (1.11)8.85 (1.88)10.87 (2.98)7.57 (2.89)
April
(Warmer season)
16.360.084.48 (2.00)5.40 (0.98)5.91 (1.77)7.67 (3.11)5.79 (2.14)
t (p) values 8.896 (<0.001)7.743 (<0.001)61.898 (<0.001)48.913 (<0.001)44.224 (<0.001)
Note: Results were obtained from paired samples t-tests.
Disclaimer/Publisher’s Note: The statements, opinions and data contained in all publications are solely those of the individual author(s) and contributor(s) and not of MDPI and/or the editor(s). MDPI and/or the editor(s) disclaim responsibility for any injury to people or property resulting from any ideas, methods, instructions or products referred to in the content.

