Abstract
Roller Compacted Concrete (RCC) dams are critical infrastructure, playing an important role in economic and social development. However, dam failure can cause great losses. To mitigate hazards, studies of methods to deal with the uncertainty involved in the comprehensive evaluation process of the safety state of RCC dams are hot issues. Interval number theory is applied to quantify the uncertainty in this study. A comprehensive evaluation indicator system is explored, an approach to allocating the indicator weight rationally is proposed, and a comprehensive evaluation model is established. Comprehensive evaluation standards are developed. An RCC dam in China is used to illustrate the applicability of this comprehensive evaluation method based on interval number theory. The results indicate that the method and models proposed are suitable for comprehensively evaluating the safety state of RCC dams and can be used as a new procedure to monitor the safety of an RCC dam.
1. Introduction
The concept of RCC dams was proposed by J.M. Raphael from the University of California, Berkeley, in 1970 [1]. RCC dams consist of concrete placed at a lower water-to-cement ratio compared with conventional concrete with the aid of compaction equipment and methodologies typically employed for earth-fill dam construction. This construction method permits a considerable reduction in the cost and construction time of dams compared not only with traditional concrete dams but also with earth-fill dams. To date, RCC dams have become the fastest-growing international dams. With the implementation of the strategy of Western power development and transportation from West to East, increasingly more RCC dams are under construction or planned to be constructed in China. The working behavior and safety state of RCC dams not only directly affect the expected benefits of the water conservation and hydropower projects but also the safety of the lives and property of people downstream. Therefore, a comprehensive evaluation of the safety state of RCC dams is of great significance for hazard prevention and mitigation.
The working behavior of RCC dams changes over time under the influence of external load and environmental changes, with specific reflections in deformation, seepage, instability, etc. Current research on dam safety evaluation can be classified into two categories: single indicator evaluation and comprehensive evaluation, including many indicators. Wang et al. [2] tried to find the leakage path using the tracer technique and evaluated the dam seepage state with entropy weight-set pair analysis. Chelidze et al. [3] established an effective remote monitoring system for dam deformation by connecting terminals, sensors, and a central processing unit to the monitoring sites through a global system for mobile communications or general packet radio service modems and obtained a real-time evaluation of the dam deformation state by comparing the monitoring values with the theoretical values. Li et al. [4] evaluated the dam crack state using a regression coefficient fluctuation method with a statistical model and catastrophe theory. Haralampos et al. [5] evaluated the dam strength state using laboratory and in situ tests. Chen [6] studied the dam seismic safety state evaluation methods, including the dam site-specific ground motion input, improved response analysis, dynamic model test verification, field experiment investigations, dynamic behavior of dam concrete, and seismic monitoring and observation. Li et al. [7] evaluated the dam instability state using the strength reserve factor method to simulate the gradual failure and possibly unstable modes of dams. Xi et al. [8] established a concrete dam deformation safety prediction model based on deep learning by using the open-source deep learning framework TensorFlow and the mature convolutional neural network technology in deep learning theory. Chen et al. [9] evaluated the method of combining radial basis neural network and kernel principal component analysis to monitor the deformation of super-high concrete dams. Wang et al. [10] proposed a dynamic matter-element-extension model which considered the correlation among indicators and established the seepage safety evaluation model of the dynamic concrete gravity dam. He et al. [11] introduced the cloud model into a fuzzy comprehensive evaluation model to solve the problems of fuzziness and randomness in the seepage security risk evaluation index. Yang et al. [12] applied the point-to-face variable comparison analysis mode to monitor the dam-shaped variables. Panvalkar et al. [13] applied borehole nuclear logging and tracer techniques to trace the suspected leakage zones and path through the body of the dam to evaluate the seepage situation of the dam.
The studies above provide useful tools for dam safety monitoring and evaluation. However, a single indicator evaluation can reflect only partial information regarding the dam’s safety state. Comprehensive evaluation with many indicators is necessary for the overall monitoring of the dam’s safety state. Mirzabozorga et al. [14] evaluated the dam safety state by combining multi-source in situ information and finite element calculation. Mata et al. [15] merged the physical quantities measured by the automated monitoring system of a dam, appropriately weighted, into a new single indicator belonging to any of two classes (normal behavior and development of a failure scenario). Lokke et al. [16] put forward a safety evaluation method for concrete gravity dams by building a dam-water-foundation system with response spectrum analysis. Chiganne et al. [17] demonstrated a new method for evaluating the flood overtopping failure scenario for embankment dams with concrete upstream slope protection considering geotechnical, hydraulic, and structural factors. Bretas et al. [18] presented a numerical model for the safety analysis of gravity dams based on the discrete element method and evaluated the sliding failure mechanism and the stress state. Li et al. [19] used the Delphi method combined with grey relational analysis to select the dominant factors and then selected back propagation neural network combined with the AdaBoost algorithm to build the dam safety evaluation model. Han et al. [20] proposed a safety evaluation model of earth-rock dams based on the combination method of the ideal point and cloud theory model, which can scientifically solve the uncertainty problem in the safety evaluation of earth-rock dams. Wen et al. [21] determined the comprehensive evaluation grade of dam safety behavior by using the fuzzy recognition model combining the subindex evaluation level and comprehensive weight. Shu et al. [22] proposed a dam safety evaluation model based on interval-valued intuitionistic fuzzy set and evidence theory for dam safety reliability evaluations, which aimed at the multi-sources, heterogeneity, and complexity of dam safety evaluation. Li et al. [23] used the modified moving average-cosine similarity method to quantify the lag effect of operation indicators and established a comprehensive safety evaluation index system on this basis. Sang et al. [24] proposed a new method combining an extended cloud model and an extended analytic hierarchy process to address the uncertainty problem in the evaluation of the overall safety trend of dams and the selection of safety trend warning indicators.
These studies on dam safety state evaluation provide powerful technical support for its operation. However, the construction interfaces of RCC dams make them different from other types of dams. The structural characteristics of the RCC dam make the construction layer easy to become a weak surface and the concentrated channel of seepage in the structure of the RCC dam. However, the current research on the characteristics of the RCC dam layer mainly focuses on the aspects of the layer strength and interlayer bonding qualities, while few pieces of research focus on the comprehensive evaluation of the characteristics of the RCC dam layer. The development of a comprehensive evaluation method for the safety state of RCC dams considering the specific structural characteristics of RCC dams and the uncertainty in the evaluation procedure is necessary. Extenics, rough set, fuzzy theory, gray system theory, attribute mathematics, and set pair analysis are normally used for dealing with uncertainty problems [25,26,27,28,29,30,31,32]. Each of the methods has its own advantages and disadvantages. Recently, the interval number theory [33] has shown advantages in dealing with the uncertainty problem. Therefore, the interval number theory is applied in this study to handle the uncertainty in the comprehensive evaluation of the RCC dam safety state considering the construction interfaces. Using interval numbers rather than natural numbers to describe the evaluation indicators and safety state is more reasonable and acceptable.
The rest of this paper is organized as follows. Based on interval number theory, the comprehensive evaluation indicator system is built correspondingly in Section 2, methods for calculating the interval number weights of these indicators are discussed in Section 3, and the comprehensive evaluation model is established in Section 4. Then, an RCC dam in China is utilized as a case study to verify the feasibility of this proposed method in Section 5. Finally, Section 6 is a summary that concludes this work.
2. Comprehensive Evaluation Indicators
2.1. Comprehensive Evaluation Indicator System
According to the principles of building the indicator system, i.e., scientific and operational, clearly prior and relatively independent, qualitative and quantitative, and reasonably hierarchical indicators were determined. As RCC dams are constructed in layers, the interface gap between adjacent layers is larger than in traditional concrete dams. This gap generates a certain pressure at the interface when compressing the cement concrete, creating an interface effect. The interface effect is mainly reflected in several aspects: stress concentration, interface exchange, and overall deformation. Therefore, in addition to the traditional dam evaluation items, the corresponding interface stresses, displacements, and other interface characteristics should be considered. We built the evaluation indicator system shown in Figure 1. The first level is the target level reflecting the safety state of the RCC dam. The second level is the criterion level, including the deformation, seepage, stress, and stability state of an RCC dam. The third level is the indicator level constituted by the displacement of the dam body, the seepage of the dam body, the stress of the dam heel, the stress of the dam toe, the stress of the dam abutment, the stress of the interfaces, and stability against sliding. The fourth level is the basic level, including horizontal displacement, vertical displacement, the ratio of the interface displacement to the total displacement, uplift pressure, quantity of leakage, ratio of the interface leakage to the total leakage, range of tensile stress, the normal vertical stress, the range of compressive stress, the maximum tensile stress, the maximum compressive stress, the maximum shear stress, stability against sliding of the dam foundation, stability against sliding of the interface, etc.
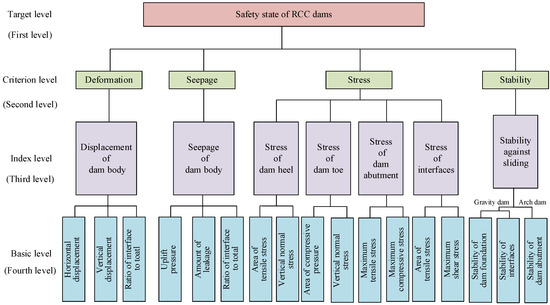
Figure 1.
Comprehensive evaluation indicator system for the safety state of RCC dams.
2.2. Grades of Evaluation Indicators
Considering the guidelines on dam safety evaluation and the practical conditions of dam operation, we divide the evaluation indicators into five grades. Since some of the evaluation indicators are qualitative and others are quantitative, the respective grading methods are described.
2.2.1. Grades of Qualitative Evaluation Indicators
The qualitative indicators are usually graded with the experience of experts. To make the grades as accurate as possible, site management, design recheck, and construction review are investigated overall with the aid of professional regulations, relevant standards, and documents. The grading standards are shown in Table 1.

Table 1.
Grading standards for qualitative evaluation indicators.
2.2.2. Grading Standards for Quantitative Evaluation Indicators
The quantitative evaluation indicators are also divided into five grades: grades I, II, III, IV, and V. Grade I: the monitoring data change normally and do not exceed the allowed design value or the maximum historical value. Grade II: the monitoring data are close to or slightly exceed the allowed design value or the maximum historical value, and the monitoring data of the key positions in the dams are normal. Grade III: The monitoring data exceed the allowed design value or the maximum historical value, and the monitoring data for the key position in dams change normally. Grade IV: the monitoring data exceed the allowed design value or the maximum historical value, and the monitoring data for the key position in the dams obviously changes. Grade V: the monitoring data heavily exceed the allowed design value or the maximum historical value, and the monitoring data for the key position in the dams obviously change.
2.3. Interval Number Expressions of Evaluation Indicators
The interval number, denoted by , where is the lower boundary of an interval and is the upper bound, represents a range that can describe the uncertainty, while a point value cannot. Thus, interval number theory is widely used in the uncertainty problem research field.
2.3.1. Interval Number Expressions of Qualitative Evaluation Indicators
If the interval is used to represent a qualitative evaluation indicator, interval numbers for the five grades can be obtained by the equal interval partition method usually used in system engineering. The interval numbers are listed in Table 2.
Table 2.
Interval numbers for five grades of qualitative evaluation indicators.
2.3.2. Interval Number Expressions of Quantitative Evaluation Indicators
The main structural characteristic of the RCC dam is the existence of the layer, which is different from ordinary concrete dams. The layer influence zone is the weak zone of the RCC dam, and it is the key to influencing the strength, stability, and seepage of the RCC dam. The deformation, seepage, stress, and stability of the layer are not only the main reflection of the characteristics of the layer but are also related to the safe operation of the RCC dam. Different from qualitative evaluation indicators, quantitative evaluation indicators are more complicated to grade with interval numbers. From the grading standards of the quantitative evaluation indicators described above, the interval number expressions of deformation, seepage, stress, and stability are studied.
- (1)
- Interval number expressions of the deformation indicators
The deformation monitoring data are denoted by , time by , the monitoring values calculated with the deformation monitoring model by , the standard deviation of the deformation monitoring model by , the time effect component of the deformation monitoring model by , the first level early warning value of deformation by , the second level early warning value of deformation by , and the third level early warning value of deformation by . Thus, the interval numbers of the five grades can be expressed using these variables. Grade I: and . Grade II or , , and . Grade III: . Grade IV: . Grade V: .
The deformation feature of RCC dams is different from that of conventional concrete dams because of the interfaces existing in RCC dams. To display the interface influence, the ratio of the interface deformation to the total deformation is adopted. The interface deformation is denoted by , and we express the grades as follows through reference to the available literature [34,35]. Grade I: , Grade II: , Grade III: , Grade IV: , and Grade V: .
- (2)
- Interval number expressions of the seepage indicators
The seepage monitoring data are denoted by , time by , the value calculated with the seepage monitoring model by , the standard deviation of the seepage monitoring model by , the time effect component of the seepage monitoring model by , the designed value of seepage by , and the maximum value of the seepage data series by . Thus, Grade I: and . Grade II: or , , and . Grade III: and . Grade IV: and . Grade V: and .
Similarly, adapting the ratio of the interface seepage to the total seepage, we express the grades as follows. Grade I: , Grade II: , Grade III: , Grade IV: , and Grade V: , where is the interface seepage.
- (3)
- Interval number expressions of the stress indicators
The stress monitoring data are denoted by , the designed value of stress by , the compressive stress, tensile stress or shear stress by , the maximum value of stress data series by , the stress in the control range by , and the maximum value of stress in the control range by . Assuming the compressive stress is positive, and the tensile stress is negative, the interval numbers of the five grades can be expressed as follows. Grade I: , Grade II: , Grade III: , Grade IV: , and Grade V: .
- (4)
- Interval number expression of the stability indicators
According to the strength reserve coefficient method, the standard of stability safety coefficient against sliding is , where is the safety coefficient in a quasi-elastic state and is the safety coefficient allowed. Considering the water pressure overload, environmental degradation, and material parameter variation, is adopted to describe the grades of stability safety. Grade I: , Grade II: , Grade III: , Grade IV: , and Grade V: .
In addition, the stability of interfaces in the RCC dams usually plays an important part in RCC dam safety. Using the cohesion and friction coefficient to describe the stability, we express the grades as follows. Grade I: , Grade II: , Grade III: , Grade IV: , and Grade V: , where is the interface cohesion and is the RCC cohesion. Grade I: , Grade II: , Grade III: , Grade IV: , and Grade V: , where is the interface friction coefficient and is the RCC friction coefficient.
2.4. Normalization Method of the Interval Number Indicators
From the interval number expressions of the evaluation indicators above, we can see that some indicators have no units, and others have different units. Normalization is necessary to make all kinds of indicators comparable. There are two main methods for the normalization of interval numbers: the “interval-point” method and the “interval-interval” method [36]. The “interval-interval” method is adopted in this study, and the general expression is
or
where is the maximum interval, is the minimum interval, means the lower boundary of an interval, and means the upper bound. The maximum interval and the minimum interval are obtained by interval sequencing based on the possibility degree theory. Let and . The relationship between and can be
shown visually in Figure 2.
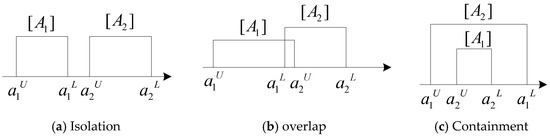
Figure 2.
Three cases of the relationship between intervals.
Let and ; the possibility degree of is
simply denoted by (), and the possibility degree matrix is
Since , the matrix is a fuzzy complementary judgment matrix with a sequencing vector , where
Thus, the interval can be sequenced by , and the interval number indicators can be normalized.
3. Interval Number Weights of the Comprehensive Evaluation Indicators
There are three main classes of methods for determining weights: subjective weighting methods, including expert evaluation, the Delphi method, etc., and objective weighting methods, including principal component analysis, factor analysis, the analytical hierarchy process, the entropy method, etc. The rationality of index weight directly affects the accuracy of comprehensive evaluation. The determination of weight is mainly divided into subjective methods and objective methods. Using one kind of method alone has a certain one-sidedness. The subjective method assigns weight according to experts’ subjective emphasis on indicators, while the objective method determines weight according to data information. Combining subjective and objective methods can not only give consideration to expert experience but also reduce subjective arbitrariness so as to achieve the unity of subjective and objective weights for indicators.
Combined methods with subjective and objective weighting are more applicable. In this study, the weights of the comprehensive evaluation indicators are calculated with a combined method using expert evaluation and the improved analytical hierarchy process. In addition to the interval number weight, this combined method is used for the first time to reflect the fuzziness and uncertainty in the comprehensive evaluation.
3.1. Interval Number Weights Obtained by Expert Evaluation
Let experts evaluate indicators. The evaluation result of indicator by expert is denoted by , shown in Table 3.
Table 3.
Data structure of interval number weights obtained by expert evaluation.
In Table 3, means the interval number weight of indicator given by the expert group. Since different experts have different experiences, different weights should be assigned to different experts. Thus, is amended as
where is the weight to show the degree of importance of expert .
3.2. Interval Number Weights Obtained by the Improved Analytical Hierarchy Process
The analytical hierarchy process (AHP) is a method to determine the indicator weight by comparing the degree of importance of each indicator. The process can be divided into three steps: compare the degree of importance of each indicator, form the comparison matrix; check the consistency of the comparison matrix; calculate the weight of the indicator. AHP can be improved by making the comparison matrix consistent using an optimal transfer matrix, named the improved AHP, which can be used to obtain the weight of the indicator more quickly and conveniently. The application steps are as follows.
(1) On the basis of the degree of importance of the indicators, form the comparison matrix using the reciprocal 1~9 scaling method, shown in Table 4, where means the comparative result of indicator with indicator .
Table 4.
Reciprocal scale method of 1~9.
(2) Calculate the transfer matrix
(3) Calculate the optimal transfer matrix
where .
(4) Calculate the weight of indicator
where is the weight of indicator j, is the difference measure between the eigenvectors of the function, and p is the length of the eigenvectors.
3.3. Integrated Interval Number Weights Obtained by Combined Methods
Combining the weights obtained by expert evaluation with those by improved AHP, integrated weights can be obtained.
where .
Therefore, the integrated interval number weights of indicators can be expressed as
where means the integrated interval number weight of indicator .
The weights are constrained by , where and refers to the weight of deformation, seepage, stress, and stability.
4. Comprehensive Evaluation Models with Interval Number Indicators and Weights
The comprehensive evaluation interval number can be calculated with the interval number indicators and weights , expressed as
where , with , , and as the interval number indicators of deformation, seepage, stress, and stability, respectively, , expressing the interval number weights of those indicators, and . and can be obtained by operation of and through an optimization algorithm. However, in Section 2.3.2, there is more than one interval number of deformation, seepage, stress, and stability. We can use one interval number such as to express the indicator of deformation by combining the indicators of the same category by expert evaluation. This method can also be used to process indicators of seepage, stress, and stability.
Once the comprehensive evaluation interval number is calculated, to obtain the evaluation result of the RCC dam safety state, reasonable evaluation standards should be set. According to enforcement rules for the hydropower dam safety inspections and some statistics, the evaluation grades are set as five: I: Normal, II: Almost Normal, III: Mildly Abnormal, IV: Abnormal, and V: Dangerous, shown in Table 5.
Table 5.
Evaluation standards of the safety state for RCC dams.
In summary, the procedure of establishing the comprehensive evaluation model based on interval number theory can be shown in Figure 3.
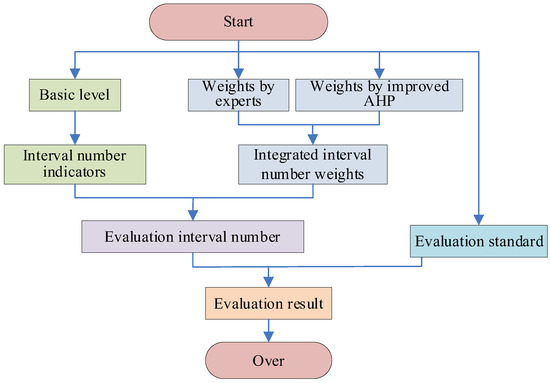
Figure 3.
Comprehensive evaluation procedure of the safety state for RCC dams.
5. Case Study
To verify the validity and feasibility of this proposed method, an RCC Dam (Figure 4) located in the Guangxi Zhuang Autonomous Region on the south coast of China was taken as a case study. This RCC Dam is the most important engineering structure of the Red River cascade development project used for power generation, flood prevention, and shipping, with a dam height of 216.5 m.
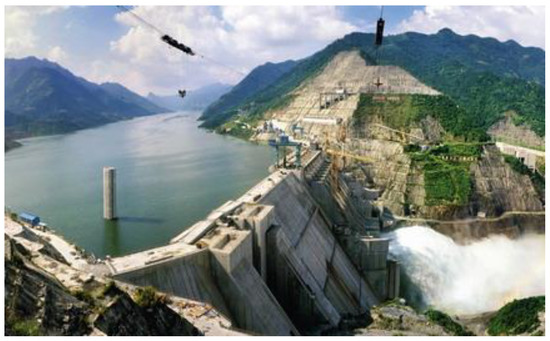
Figure 4.
An RCC dam.
The orthographic perpendicular lines and inverted perpendicular lines are placed in the dam body to monitor the dam deformation. Osmometers monitor dam osmotic pressure; stress and strain gauge groups monitor dam stress. Dam stability is obtained by stability analysis using the finite element method. Taking the typical block 11#, for example, its monitoring system (see Figure 5) consists of osmometers UP11-1 and UP11-3; inverted perpendicular line IP11, orthographic perpendicular lines PL11-3, PL11-2, and PL11-1; groups of stress and strain gauges S511-1, S511-2, S511-3, and S511-4.
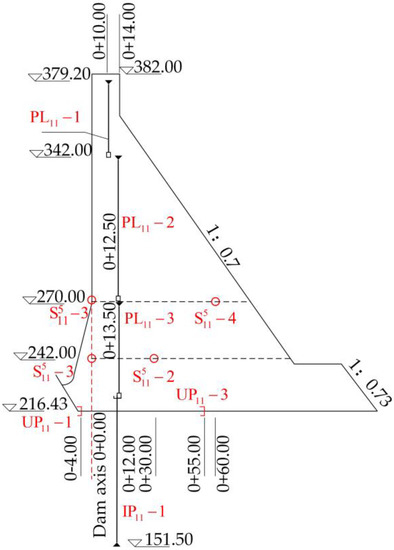
Figure 5.
Monitoring instruments of block 11#.
The monitoring data series from 10 October 2006 to 28 August 2009 is studied. First, the interval number expressions and grades of the indicators are determined using the above procedure. These parameters are listed in Table 6.
Table 6.
Interval number expressions and grades of the indicators.
Combine the indicators of the same category and normalize them. The interval number indicators finally are . The weights calculated by expert evaluation are , and the weights calculated by improved AHP are . If in Equation (13) is assumed to be 0.4, the integrated interval number weights are . Finally, the comprehensive evaluation interval number is calculated by the optimization algorithm as . Comparison of this result with the comprehensive evaluation standards shows that the comprehensive safety state of dam block 11# in this RCC dam is between “almost normal” and “normal”; in other words, the comprehensive safety grade is II~I.
Table 6 shows that for single indicator safety evaluation of dam block 11#, the deformation and stress state grades are both I, the seepage state is II~I, and the stability state is III~I. The reason the safety grades of seepage and stability are relatively low is that the interfaces in dam block 11# weaken its ability for anti-leaking and anti-sliding. The comprehensive evaluation result provides overall information for decision-makers.
Although we try to make the evaluation of the safety state for RCC dams comprehensive and objective, there is some subjectivity. For example, in Equation (13) is supposed to be 0.4, which is individually experiential. In addition, the evaluation safety state of dam block 11# is based on the site monitoring data and the back analysis result with the finite element method that we can obtain, so more attention is required when performing similar work. As many as possible of the indicators in Figure 1 are recommended for inclusion, with the purpose of providing the most reliable evaluation result. Finally, the research on easy-to-use indicators needs further testing and improvement by validation so that dam managers can use this procedure conveniently to evaluate and monitor the RCC dam safety state.
6. Conclusions
RCC dams have become the fastest-growing international dams, and the dam height has been increasing. Therefore, safety state monitoring and evaluation of RCC dams have been a major concern. However, RCC dams with a particular structure characteristic of interfaces behave differently from traditional concrete dams. In addition, the RCC dam structure is uncertain, non-conservative, and non-linear and consists of an anisotropic material. Therefore, the safety state evaluation of RCC dams is a hard job with much uncertainty, especially the comprehensive safety state evaluation. In this study, we developed a comprehensive evaluation method for the safety state of RCC dams based on interval number theory.
We built a comprehensive evaluation indicator system, developed the interval number expressions and weights of these indicators, established a comprehensive evaluation model, and set evaluation standards. In addition, we verified the performance of the proposed method with an RCC dam in China. The case study shows that this method is efficient and applicable.
The comprehensive evaluation of the safety state of RCC dams involves many indicators and levels. Uncertainty intersection is inevitable. The analytical techniques and methods call for more in-depth research.
Author Contributions
X.C.: conceptualization, formal analysis, writing—reviewing and editing. P.X.: conceptualization, software, writing—original draft. X.L.: conceptualization, methodology, writing—reviewing. C.S.: data curation, methodology. All authors have read and agreed to the published version of the manuscript.
Funding
This research was supported by the Belt and Road Special Foundation of the State Key Laboratory of Hydrology-Water Resources and Hydraulic Engineering (Funding number: Grant No. U2021nkms06; Funder: Xudong Chen), Fund of National Dam Safety Research Center (Funding number: CX2022B05; Funder: Xudong Chen), and the Fund of Research on Key Technologies of spatio-temporal information and collaborative design in engineering (Funding number: YJZD2020-01; Funder: Peng Xu).
Data Availability Statement
Not applicable.
Conflicts of Interest
The authors declare that they have no known competing financial interests or personal relationships that could have appeared to influence the work reported in this paper.
References
- Raphael, J.M. The Optimum Gravity Dam, Rapid Construction of Concrete Dams; American Society of Civil Engineers: New York, NY, USA, 1970. [Google Scholar]
- Wang, T.; Chen, J.S.; Wang, T.; Wang, S. Entropy weight-set pair analysis based on tracer techniques for dam leakage investigation. Nat. Hazards 2015, 76, 747–767. [Google Scholar] [CrossRef]
- Chelidze, T.; Matcharashvili, T.; Abashidze, V.; Kalabegishvili, M.; Zhukova, N. Real time monitoring for analysis of dam stability: Potential of nonlinear elasticity and nonlinear dynamics approaches. Front. Struct. Civ. Eng. 2013, 7, 188–205. [Google Scholar] [CrossRef]
- Li, Z.; Gu, C.; Wang, Z.; Wu, Z. On-line diagnosis method of crack behavior abnormality in concrete dams based on fluctuation of sequential parameter estimates. Sci. China Technol. Sci. 2015, 58, 415–424. [Google Scholar] [CrossRef]
- Haralampos, G.; Christos, O. Determination of factors affecting compressive strength of lean RCC mixtures: The experience of Filiatrinos Dam. Geotech. Geol. Eng. 2014, 32, 1317–1327. [Google Scholar]
- Chen, H.Q. Seismic safety of high concrete dams. Earthq. Eng. Eng. Vib. 2014, 13, 1–16. [Google Scholar] [CrossRef]
- Li, B.; Zhang, Z.; Liu, Y.; Yang, S. Evaluation Standard for Safety Coefficient of Roller Compacted Concrete Dam Based on Finite Element Method. Math. Probl. Eng. 2014, 2014, 601418. [Google Scholar] [CrossRef]
- Xi, W.; Yang, J.; Song, J.; Qu, X. Deep learning model of concrete dam deformation prediction based on CNN. IOP Conf. Ser. Earth Environ. Sci. 2020, 580, 012042. [Google Scholar] [CrossRef]
- Chen, S.; Gu, C.; Lin, C.; Zhao, E.; Song, J. Safety monitoring model of a Super-high concrete dam by using RBF neural network coupled with kernel principal component analysis. Math. Probl. Eng. 2018, 2018, 1712653. [Google Scholar] [CrossRef]
- Wang, X.; Yu, H.; Lv, P.; Wang, C.; Zhang, J.; Yu, J. Seepage safety assessment of concrete gravity dam based on matter-element extension model and FDA. Energies 2019, 12, 502. [Google Scholar] [CrossRef]
- He, Y.; Zhao, M.; Wang, K.; Liu, P. Fuzzy comprehensive evaluation of earth rockfill dam seepage security risk based on cloud model. Water Resour. Power 2018, 36, 83–86. [Google Scholar]
- Yang, C.; Yang, J.; Li, Y.; Han, L.; Chen, S. 3D laser scanning point cloud analysis method for dam deformation monitoring. Bull. Surv. Mapp. 2021, 10, 54–59. [Google Scholar]
- Panvalkar, G.A.; Chunade, A.D. Tracing dam seepage using nuclear logging and tracer techniques—A case study. ISH J. Hydraul. Eng. 2018, 24, 311–316. [Google Scholar] [CrossRef]
- Mirzabozorg, H.; Hariri-Ardebili, M.; Heshmati, M.; Seyed-Kolbadi, S. Structural safety evaluation of Karun III Dam and calibration of its finite element model using instrumentation and site observation. Case Stud. Struct. Eng. 2014, 1, 6–12. [Google Scholar] [CrossRef]
- Mata, J.; Leitão, N.S.; de Castro, A.T.; da Costa, J.S. Construction of decision rules for early detection of a developing concrete arch dam failure scenario, a discriminant approach. Comput. Struct. 2014, 142, 45–53. [Google Scholar] [CrossRef]
- Lokke, A.; Chopra, A.K. Response spectrum analysis of concrete gravity dams including dam-water-foundation interaction. J. Struct. Eng. 2015, 141, 1–9. [Google Scholar] [CrossRef]
- Chiganne, F.; Marche, C.; Mahdi, T.F. Evaluation of the overflow failure scenario and hydrograph of an embankment dam with a concrete upstream slope protection. Nat. Hazards 2014, 71, 21–39. [Google Scholar] [CrossRef]
- Bretas, E.M.; Lemos, J.V.; Lourenco, P.B. A DEM based tool for the safety analysis of masonry gravity dams. Eng. Struct. 2014, 59, 248–260. [Google Scholar] [CrossRef]
- Li, H.; Ouyang, J.; Li, F.; Xie, X. Study on safety evaluation model of small and medium-sized earth-rock dam based on BP-AdaBoost algorithm. IOP Conf. Ser. Mater. Sci. Eng. 2019, 490, 032024. [Google Scholar] [CrossRef]
- Han, L.; Liu, M.; Zhang, H.; Yao, L.; Ge, W. Safety assessment model of Earth-rock dam based on ideal point-cloud theory. J. Eng. Sci. Technol. Rev. 2019, 12, 38–50. [Google Scholar]
- Wen, L.; Yang, Y.; Li, Y.; Liu, Y.; Zhou, H. Comprehensive evaluation method for the concrete-face rockfill dams behavior based on the fuzzy recognition model. J. Perform. Constr. Facil. 2022, 36, 04022021. [Google Scholar] [CrossRef]
- Shu, X.; Bao, T.; Li, Y.; Zhang, K.; Wu, B. Dam Safety Evaluation Based on Interval-Valued Intuitionistic Fuzzy Sets and Evidence Theory. Sensors 2020, 20, 2648. [Google Scholar] [CrossRef] [PubMed]
- Li, M.; Si, W.; Ren, Q.; Song, L.; Liu, H. An integrated method for evaluating and predicting long-term operation safety of concrete dams considering lag effect. Eng. Comput. 2020, 37, 2505–2519. [Google Scholar] [CrossRef]
- Sang, L.; Wang, J.; Sui, J.; Dziedzic, M. A new approach for dam safety assessment using the extended cloud model. Water Resour. Manag. 2022, 36, 5785–5798. [Google Scholar] [CrossRef]
- Su, H.; Hu, J.; Yang, M.; Wen, Z. Assessment and prediction for service life of water resources and hydropower engineering. Nat. Hazards 2015, 75, 3005–3019. [Google Scholar] [CrossRef]
- Zheng, G.; Jing, Y.; Huang, H.; Zhang, X.; Gao, Y. Application of life cycle assessment (LCA) and extenics theory for building energy conservation assessment. Energy 2009, 34, 1870–1879. [Google Scholar] [CrossRef]
- Pawlak, Z. Rough Sets: Theoretical Aspects of Reasoning about Data; Springer Science & Business Media: Dordrecht, The Netherland, 1991. [Google Scholar]
- Greco, S.; Matarazzo, B.; Slowinski, R. Rough sets theory for multicriteria decision analysis. Eur. J. Oper. Res. 2001, 129, 1–47. [Google Scholar] [CrossRef]
- Deng, J.L. Courses of Grey System Theory; Huazhong University of Science and Technology Press: Wuhan, China, 1990. [Google Scholar]
- Harris, J. Fuzzy Logic Applications in Engineering Science; Springer Science & Business Media: Dordrecht, The Netherland, 2005. [Google Scholar]
- Miller, R.L.; Brickman, P.; Bolen, D. Attribution versus persuasion as a means for modifying behavior. J. Personal. Soc. Psychol. 1975, 31, 430–470. [Google Scholar] [CrossRef]
- Zhao, K.Q. Set pair analysis and its preliminary application. Explor. Nat. 1994, 13, 67–72. [Google Scholar]
- Sevastianov, P. Numerical methods for interval and fuzzy number comparison based on the probabilistic approach and dempster-shafer theory. Inf. Sci. 2007, 177, 4645–4661. [Google Scholar] [CrossRef]
- Chen, L. Gradual Change Characteristics and Safety Monitoring Models of RCC Dams. Ph.D. Dissertation, University of Hohai, Nanjing, China, 2006. [Google Scholar]
- Li, B. Gradual Change Laws of Mechanical Parameters and Comprehensive Analysis Methods of Interfaces for RCC Dams. Ph.D. Dissertation, University of Hohai, Nanjing, China, 2010. [Google Scholar]
- Yu, X.H.; Xu, Z.S.; Chen, Q. A method based on preference degrees for handling hybrid multiple attribute decision making problems. Expert Syst. Appl. 2011, 38, 3147–3154. [Google Scholar] [CrossRef]


Disclaimer/Publisher’s Note: The statements, opinions and data contained in all publications are solely those of the individual author(s) and contributor(s) and not of MDPI and/or the editor(s). MDPI and/or the editor(s) disclaim responsibility for any injury to people or property resulting from any ideas, methods, instructions or products referred to in the content. |
© 2023 by the authors. Licensee MDPI, Basel, Switzerland. This article is an open access article distributed under the terms and conditions of the Creative Commons Attribution (CC BY) license (https://creativecommons.org/licenses/by/4.0/).