Article

Water Quality Sampling and Multi-Parameter Monitoring System Based on Multi-Rotor UAV Implementation

College of Mechanical and Electrical Engineering, Zhongkai University of Agriculture and Engineering, Guangzhou 510225, China
*
Author to whom correspondence should be addressed.
Water 2023, 15(11), 2129; https://doi.org/10.3390/w15112129
Submission received: 5 May 2023 / Revised: 24 May 2023 / Accepted: 1 June 2023 / Published: 3 June 2023
(This article belongs to the Special Issue Application of AI and UAV Techniques in Urban Water Science)

Abstract

:
Water quality sampling and monitoring are fundamental to water environmental protection. The purpose of this study was to develop a water quality sampling and multi-parameter monitoring system mounted on a multi-rotor unmanned aerial vehicle (UAV). The system consisted of the UAV, water sampling and multi-parameter detection device, and path planning algorithm. The water sampling device was composed of a rotating drum, a direct current (DC) reduction motor, water suction hose, high-pressure isolation pump, sampling bottles, and microcontroller. The multi-parameter detection device consisted of sensors for potential of hydrogen (pH), turbidity, total dissolved solids (TDS), and a microcontroller. The flight path of the UAV was optimized using the proposed layered hybrid improved particle swarm optimization (LHIPSO) and rapidly-exploring random trees (RRT) obstacle avoidance path planning algorithm, in order to improve the sampling efficiency. Simulation experiments were conducted that compared the LHIPSO algorithm with the particle swarm optimization (PSO) algorithm and the dynamic adjustment (DAPSO) algorithm. The simulation results showed that the LHIPSO algorithm had improved global optimization capability and stability compared to the other algorithms, validating the effectiveness of the proposed algorithm. Field experiments were conducted at an aquaculture fish farm, and the device achieved real-time monitoring of three water quality parameters (pH, TDS, turbidity) at depths of 1 m and 2 m. A rapid analysis of three parameters (ammonia nitrogen, nitrite, dissolved oxygen) was performed in the laboratory on the collected water samples, and validated the feasibility of this study.

1. Introduction

Currently, the world is facing severe water shortages [1,2] and pollution [3,4]. The rapid development of industry and agriculture has not only consumed large portions of freshwater resources, but has also discharged a large amount of wastewater [5,6]. The majority of the wastewater is discharged into the environment without treatment, resulting in increasingly severe water pollution, and prevention and control of water pollution are extremely difficult [7,8]. Monitoring and analyzing water quality parameters for water resources can provide important scientific basis and decision support for water resource management, environmental protection, and water pollution prevention [9,10]. Common water quality parameters used include pH, dissolved oxygen, turbidity, ammonia nitrogen, nitrite, TDS, and others. By regularly monitoring these water quality parameters, abnormal conditions in the water body can be promptly detected, such as excessive harmful substances or the presence of water pollution sources; this enables corresponding measures to be taken for water quality treatment and protection [11,12].
Currently in most regions, water quality monitoring relies on traditional methods of manual sampling and laboratory testing [13,14]. Sampling personnel collect samples using boats to reach the target water areas. However, it is difficult to the ensure the safety of sampling personnel accessing areas that have steep terrain and toxic pollution, making the work challenging.
In addition, common methods of water quality monitoring include the establishment of water quality monitoring stations in water bodies [15,16] and the installation of wireless water quality monitoring sensors [17] that enable continuous monitoring of the water quality. Water quality data are transmitted, stored, and accessed online through wireless communication [18]. However, fixed-point monitoring is limited by its fixed location, providing limited spatial coverage. Furthermore, the continuous operation of sensors in fixed-point monitoring requires regular maintenance and inspection to prevent malfunctions and unreliable data. To increase the coverage of sampling locations, using boats equipped with water quality sampling and detection equipment allows for the flexible selection of sampling points without geographical limitations. By remotely controlling the boats, the risks that are associated with manual sampling can be reduced [19,20]. However, the movement of unmanned boats is still restricted by the water environment. For example, strong water currents may affect the stability of unmanned boats, making it challenging to perform accurate water quality sampling. Additionally, obstacles in the water such as rocks, floating debris, and water vegetation can hinder the movement and sampling process of unmanned boats, increasing operational difficulties and risks.
To overcome the limitations of water environment on water quality sampling, UAVs have been applied in the field of water quality monitoring [21,22,23]. UAVs have flexible and highly maneuverable flight platforms, and offer greater flexibility and maneuverability compared to unmanned boats; this allows them to monitoring water bodies while avoiding interference from water currents, rocks, and other obstacles. UAV technology can also be combined with remote sensing techniques, such as thermal infrared sensors [24] and multispectral sensors [25], to obtain water-related data. Remote sensing techniques primarily focus on specific water quality parameters [26], such as water surface temperature, chlorophyll concentration, turbidity, etc. [27]. However, for certain pollutants or trace elements, it may not be possible to directly obtain accurate concentration values through remote sensing data [28].
By equipping UAVs with water quality sampling and monitoring devices, real-time on-site measurement of water quality parameters can be achieved [29,30,31]. For parameters that cannot be directly measured, water samples can be collected and further analyzed in the laboratory to better understand the spatial distribution and variations in water quality parameters. However, the use of UAVs for water sampling is often limited by payload capacity and endurance [30]. To effectively improve the efficiency of water quality sampling, path planning for UAVs is crucial [32,33]. During the path planning process, factors such as water body characteristics, distribution of sampling points, and flight safety need to be considered in order to ensure that UAVs can efficiently cover the target area and collect an adequate number of water quality samples [34].
The purpose of this study was to develop a water sampling and multi-parameter detection system, and integrate it into a quadcopter UAV. The sampler is capable of submerging to a specific depth to collect water samples, while the integrated monitoring device with multiple water quality parameter sensors can monitor the water quality parameters at that specific depth. Additionally, a combined LHIPSO and RRT path planning algorithm was proposed to provide an optimized solution for path planning during the UAV’s water sampling and detection operations. The organizational structure of this article is as follows: the overall structure and working principles of water quality sampling and detection system of UAV are covered in Section 1; the control scheme of water quality sampling and the multi-parameter monitoring system are outlined in Section 2; and the hierarchical hybrid improved dual layer combination path planning algorithm for obstacle avoidance of PSO and RRT is discussed in Section 3.

2. Materials and Methods

2.1. Overall Structure of UAV Water Sampling and Detection System

The overall structure of the UAV water sampling and detection system consists of a multi-rotor UAV and water sampling with multi-parameter monitoring sensors [35]. The UAV serves as a mobile platform, and its payload capacity, flight time, and stability are essential to successfully complete water sampling and real-time parameter monitoring. The UAV is composed of a Pixhawk flight control unit, a 1400 mm wheelbase carbon fiber frame, a power kit (Tohang T8, AoshengDongguan, Dongguan, China), and a 20 Ah battery. Previous tests have shown that its payload capacity is 10 kg, and it has a maximum flight time of 18 min when fully loaded.
The water sampling device was installed underneath the UAV body and consisted of an ESP32 controller, high-pressure isolation pump, a DC reduction motor, a hollow storage drum, a suction hose, a switch valve group, and sampling bottles. The controller was connected to each component via the external signal pins; it communicates with the flight control system in real-time, and sends the outputs control signals to complete the sampling operation. The output shaft of the DC reduction motor is connected to the drum to achieve the release and recovery of the hose. The push-rod motor drives the sleeve ring to move periodically back and forth so that the hose is evenly wound on the drum. The high-pressure isolation pump is connected to one end of the latex tube, generating a powerful suction force through the port connected to the rubber tube to extract water quality samples from the water source. The device has six switch valves, one of which was used as a cleaning valve not connected to any collection bottle, while the others were connected to their respective sampling bottles. The water quality samples are transported through the rubber tube via the valves and stored in the corresponding sampling bottles. The water quality monitoring sensor mounted at the end of the sampling hose was used to measure three parameters, namely the pH, turbidity, and TDS values. The sensor data were transmitted in real-time to the cloud monitoring platform through a wireless terminal [19]. The performance parameters of the three water quality monitoring sensors are provided in Table 1.
The efficiency of each component was tested by installing the water sampling device at a height of 3 m. The time required for the sampling hose to rise and fall was approximately 56 s, with an average speed of 0.054 m/s. The water pump took 9 s to extract the water sample through the suction hose and deliver it to the sampling valve unit, with an average speed of 0.333 m/s. It took 6 s to fill the sampling bottle with 300 mL of water from the sampling valve. The control unit of the water sampling device adjusts the running time of the water pump according to the flying height and sampling depth of a UAV to ensure the required water intake capacity. The hardware structure of the UAV water sampling and multi-parameter monitoring system is shown in Figure 1.

2.2. Control Scheme for Water Sampling and Multi-Parameter Monitoring System

The water sampling and multi-parameter monitoring system can be controlled using two types of methods, remote manual control and autonomous control. In the proposed monitoring system, the water sampling and real-time multi-parameter monitoring controller was connected to the same local area network (LAN) as the upper computer. The on-site end and the upper-computer end communicated with each other via the IP address assigned in a specific rule. A webpage access terminal was created using HTML and CSS programming languages, through which the ESP32 pins were controlled to activate the water sampling device remotely and read measurement data from the sensors. In automatic mode, the UAV follows the sampling test points preloaded in the flight controller for flight planning. When the UAV reaches the target sampling point, the flight controller outputs a PWM signal to activate the water sampling device, and the UAV enters hover mode to perform the sampling and testing operations [35].
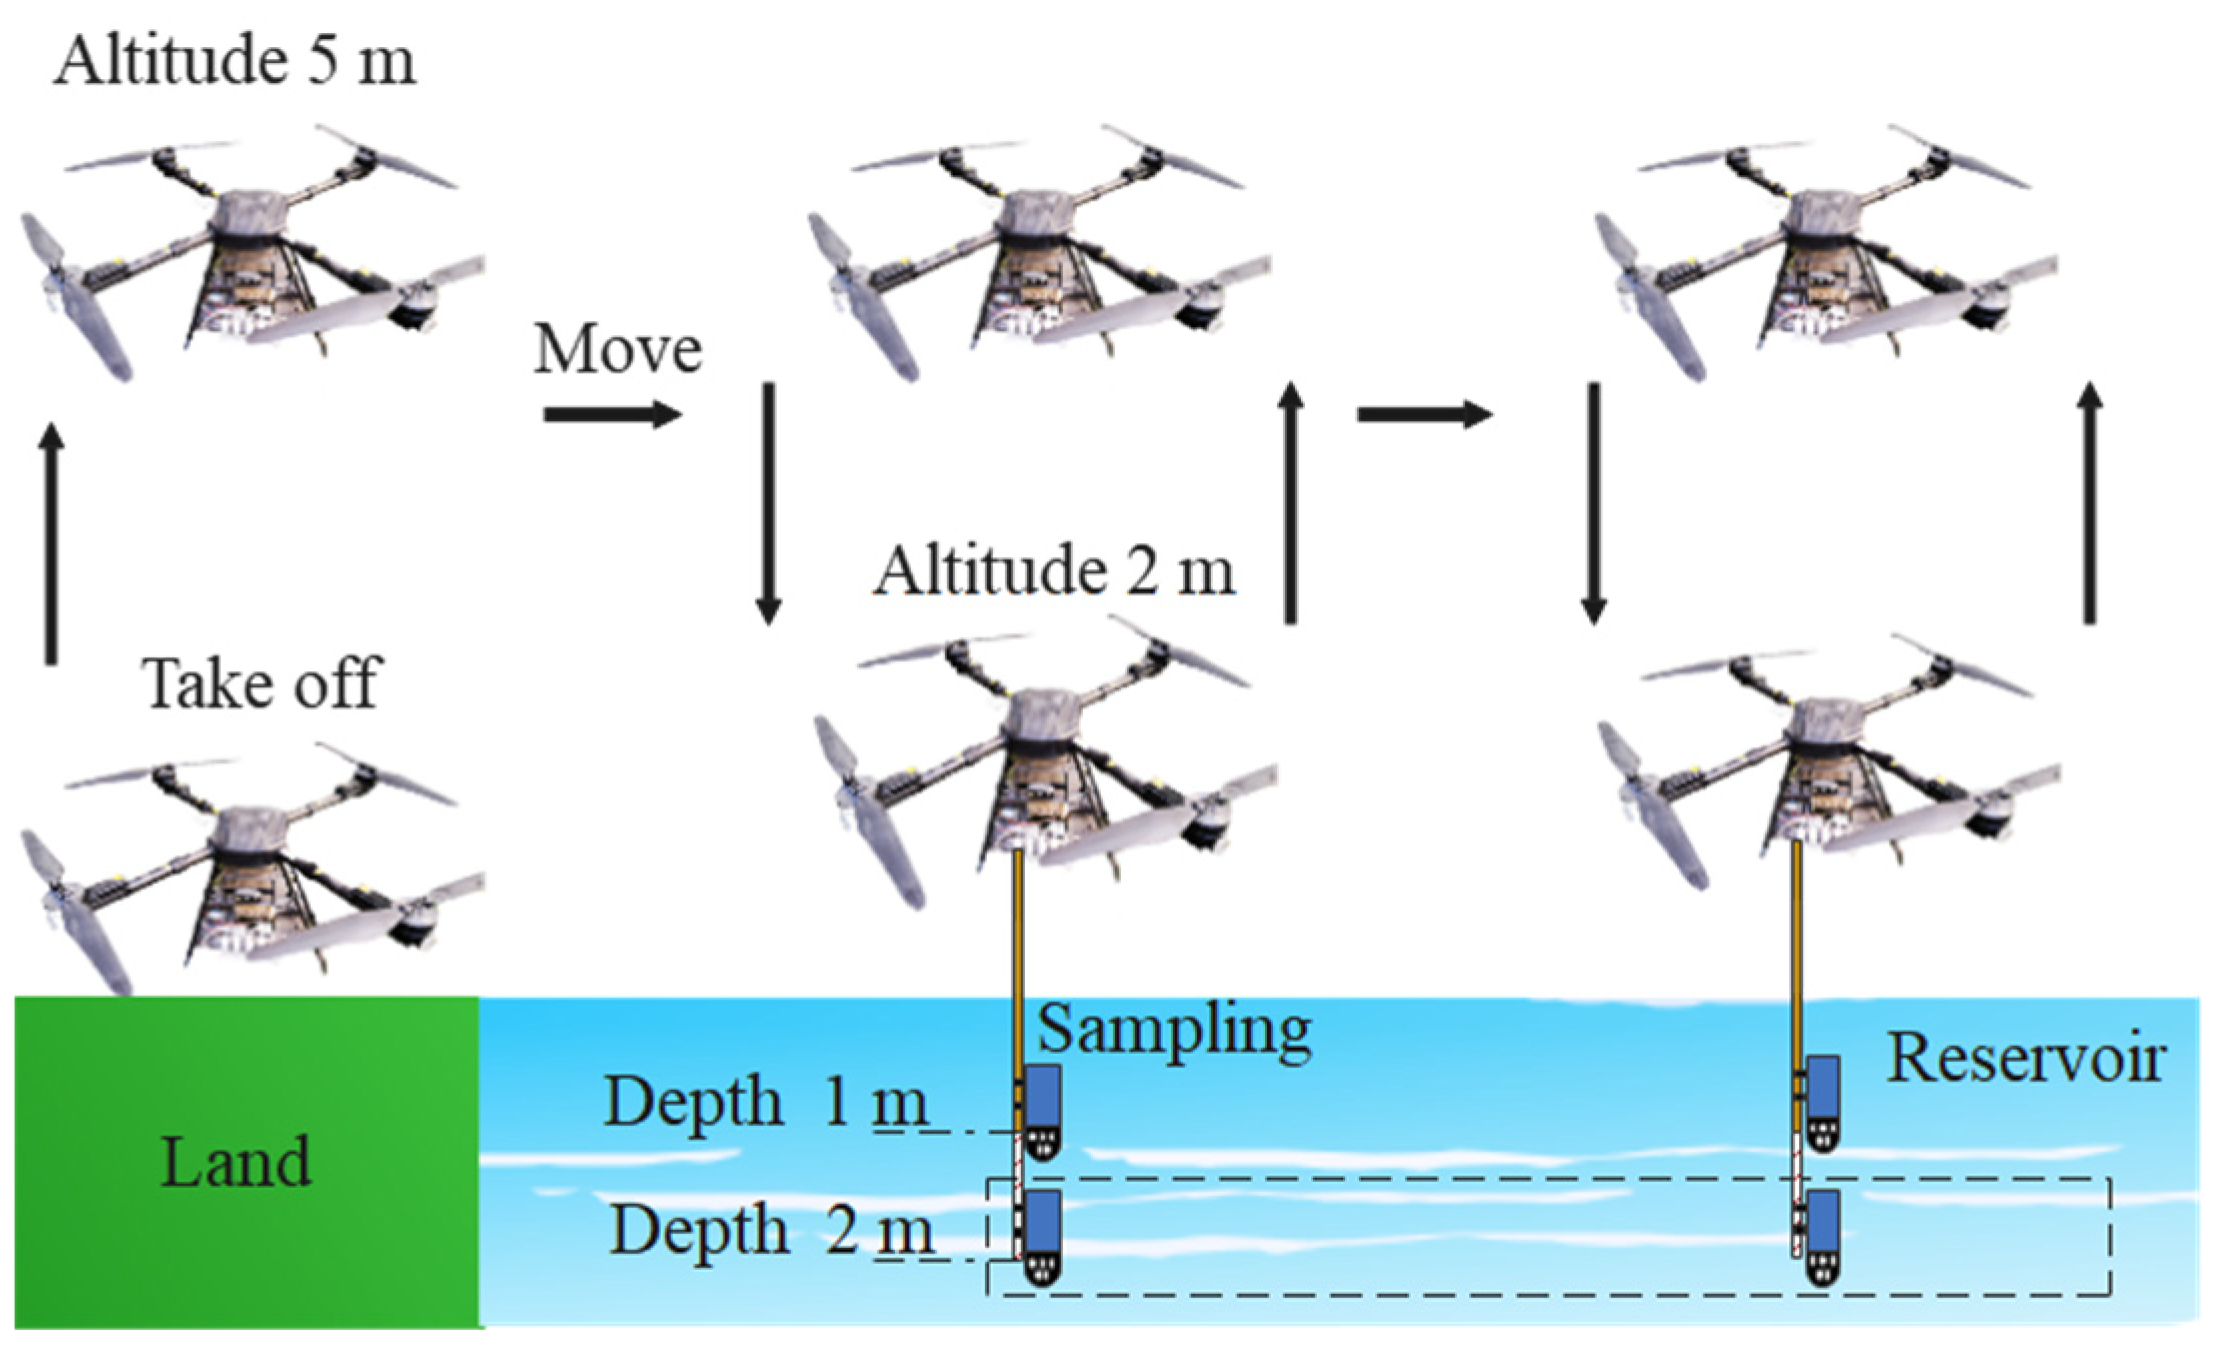
When the UAV receives an activation signal from the flight controller output, the drum drive motor in the water sampling device rotates to lower the water intake hose and start the water pump. The water sample first goes through the flushing valve group to clean the pipeline, and then switches to the sampling valve group for sampling; the samples were stored in different sampling bottles according to the path planning point order. After the water quality monitoring sensor reached the specified water depth, the real-time detected measurement data were sent to the upper computer for storage through the Wi-Fi module. The automatic sampling process of the UAV water quality sampling and monitoring system is illustrated in Figure 2. In Figure 2, the dotted box is used to differentiate between the sampling processes of two different depths.
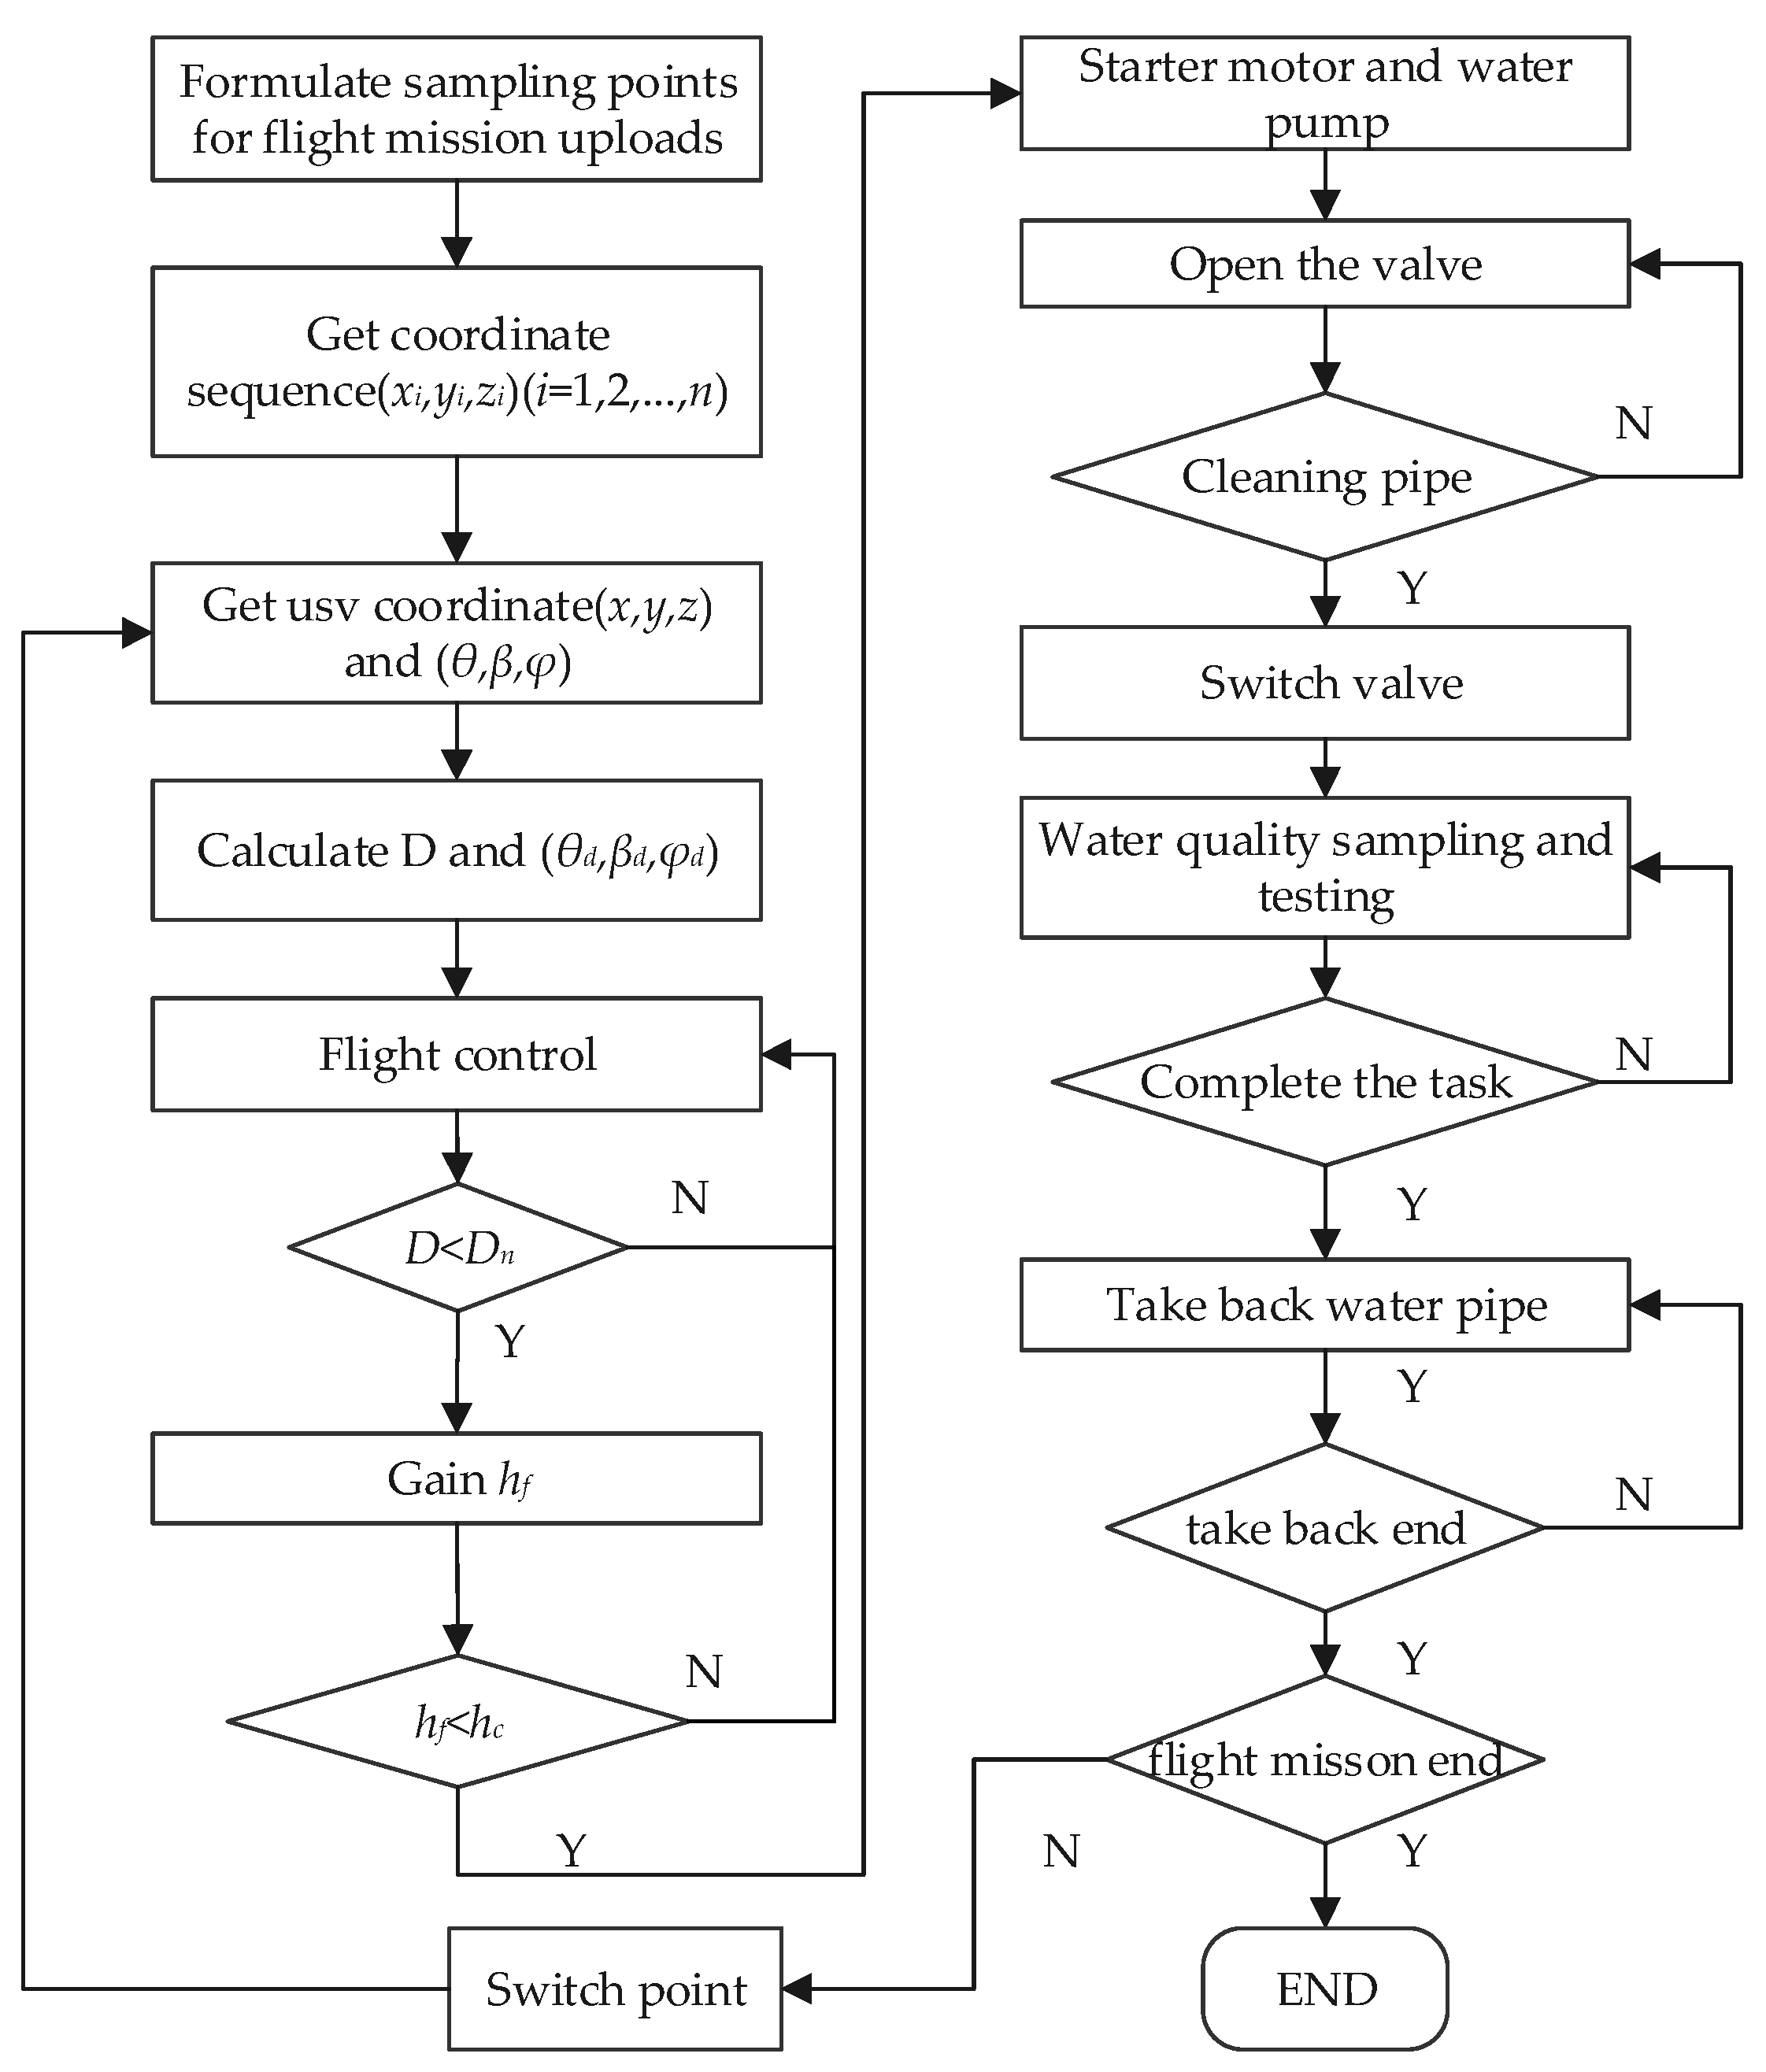
The flight controller receives the sequence of sampling position coordinates ( x i , y i , z i ) ( i = 1 , 2 , , n ) sent by the mission planner. The flight controller obtains the current position ( x , y , z ) and attitude angle ( θ , β , φ ) of the UAV through the GPS and attitude sensors. The flight controller calculates the distance D between the current position and the target position, as well as the difference ( θ d , β d , φ d ) between the current and target attitude angles, and converts the calculated data into the corresponding output values for each channel to control the UAV and reach the target position. This process is repeated until the UAV traverses all of the sampling coordinates and returns to the starting point. The flight height h f was set to 5 m, the sampling height h c was set to 2 m, and the hovering sampling operation time T s was set to 2 min. The autonomous flight water quality sampling and monitoring process of a UAV is shown in Figure 3.
The auxiliary communication channel output (Aux PWMs) of the UAV flight control was connected to the water quality sampling and multi-parameter detection device controller. The auxiliary communication channel outputs the PWM signal after the UAV enters hover mode. Once the signal is received by the controller of the water quality sampling and multi-parameter detection device, it will start the collection and monitoring of water quality samples. This configuration ensures that the UAV provides the necessary signals when hovering, so that the controller can accurately perform sampling and monitoring tasks.

3. Double-Layer Composite Path Planning Algorithm Based on PSO and RRT

In our study, we conducted a field topographic survey and environmental analysis, and used an outdoor handheld GPS centimeter-level locator and a UAV to collect geographic data and images of the sampled area; this enabled us to obtain accurate positions and characteristics of the terrain and obstacles. Before planning the UAV platform, we combine these acquired geographic data and obstacle information into the path planning algorithm. Therefore, our approach combined traditional geographic information acquisition with advanced UAV aerial survey technology, in order to obtain the necessary information.
Path planning is an important field in UAV technology, as it enables UAVs to complete tasks quickly and accurately. In order to minimize the flight time of UAVs in water sampling, and considering geographical threats and the locations of sampling points, an optimal collision-avoidance flight path was planned to improve flight efficiency and reduce losses. To achieve the shortest UAV flight path, a combined optimization problem of UAV sampling point sequence planning and flight trajectory collision avoidance was addressed [36]. This research proposed a dual-layer combined path planning algorithm based on LHIPSO and RRT. First, the original problem was transformed into a traveling salesman problem based on sampling points, and the hierarchical mixed improved PSO algorithm was used to calculate the order in which the UAV traversed the sampling points, providing the initial path from the starting point to the endpoint for the UAV to traverse each sampling point. Then, in an operational scenario, where obstacles exist during sampling conducted by the UAV, obstacle threat constraints were added, and the RRT algorithm was introduced to perform path obstacle avoidance processing on the initial path, resulting in the shortest obstacle-avoidance flight path for the UAV [37].

3.1. Hierarchical Hybrid Improved PSO Algorithm

The standard PSO algorithm is based on the continuous interval iterative search, and is suitable for optimizing continuous functions. Although the initial position and velocity of particles are continuous values, the UAV path planning in water quality sampling belongs to the class of combinatorial optimization problems. Therefore, the discrete PSO algorithm was used in this study. In the proposed method, we used the following assumptions: (1) The flight speed of the UAV was constant; (2) the time of water sampling of every point was constant. This algorithm introduced swapping and swapping sequences to realize the coding of particle positions and velocities [38,39]. The position of a particle was defined by the order of sampling points, and the velocity had to be able to modify the position. The updated velocity value of a particle was defined as a swapping sequence, where each swapping subsequence indicated two sampling points to be swapped. The following updating formulas of a particle’s position and velocity are given by (1) and (2), respectively:
v i ( t + 1 ) = ω v i t + c 1 ( p b e s t i t x i t ) + c 2 ( g b e s t t x i t )
x i ( t + 1 ) = x i t + v i ( t + 1 )
where ω is the inertia weight; c 1 and c 2 are acceleration factors; v i t and x i t represent the velocity and position of a particle i in an iteration t , respectively; v i ( t + 1 ) and x i ( t + 1 ) are the velocity and position of particle i in an iteration ( t + 1 ) , respectively; p b e s t i t is the best position obtained by particle i after iteration t ; g b e s t t is the best position obtained by the particle swarm after iteration t .
To address the problem of the standard PSO algorithm easily falling into local optima, an LHIPSO algorithm was proposed that was based on the PSO algorithm [40,41]. First, the performance of the PSO algorithm was improved by introducing dynamic adjustment. In addition, the particles were sorted in ascending order according to their fitness values, and the parameters low and up were set as boundaries to divide the particle swarm into three sub-swarms. The sub-swarm with lower fitness values represents the more optimal particle positions; different sub-swarms adopt different learning strategies to increase the diversity of particle species. High-quality particles with lower fitness values have a higher probability of having optimal solutions in their neighborhoods; thus, in this study, only the individual extreme values were used for updating, in order to accelerate local convergence. The intermediate particles were updated using both individual and global extreme values to ensure both global and local search capabilities. Poor-quality particles with higher fitness values were introduced with the genetic algorithm crossover and mutation operators, in order to enhance the algorithm’s ability to escape from local optima. The hierarchical learning framework is illustrated in Figure 4.

3.1.1. Dynamic Adjustment of Model Parameters

Based on the effect of the inertial weight on the search ability of an algorithm, nonlinear decay was used in this study for optimization [42]. In the early stage, a larger inertia weight can enhance the global search ability, and in the later stage, a smaller inertia weight can enhance local search ability. The formula for weight decay is expressed as follows:
ω = ω m a x ( ω m a x ω m i n ) ( t t m a x ) 2
The learning factor influences the weight of particles moving towards the individual best and the global best solutions. In the early stages, the focus should be placed on individual cognition, while in the later stages, emphasis should be placed more on population cognition. Inspired by the sine–cosine algorithm (SCA) mathematical model, this study dynamically adjusted the learning factor by leveraging its volatility and periodicity [43]. Assume that p is a random number between zero and one, which represents the randomness between the sine–cosine updates. The updated formulas in the local learning mode based on a particle’s own historical optimal solution and the basic learning mode based on both a particle’s own historical optimal solution and the global optimal solution of the population are given by Equations (4) and (5), respectively.
v i ( t + 1 ) = { [ ω m a x ( ω m a x ω m i n ) ( t t m a x ) 2 ] v i t + c 1 s i n c 2 ( p b e s t i t x i t ) p < 0.5 [ ω m a x ( ω m a x ω m i n ) ( t t m a x ) 2 ] v i t + c 1 c o n c 2 ( p b e s t i t x i t ) p < 0.5
v i ( t + 1 ) = { [ ω m a x ( ω m a x ω m i n ) ( t t m a x ) 2 ] v i t + c 1 s i n c 2 ( p b e s t i t x i t ) + c 2 s i n c 1 ( g b e s t t x i t ) p < 0.5 [ ω m a x ( ω m a x ω m i n ) ( t t m a x ) 2 ] v i t + c 1 c o n c 2 ( p b e s t i t x i t ) + c 2 c o n c 1 ( g b e s t t x i t ) p < 0.5

3.1.2. Introduction of Crossover and Mutation Operators

The introduction of crossover and mutation operators into the genetic algorithms provided randomness and variability, so an algorithm could effectively search for global optimal solutions [44,45,46]. The crossover operator in traditional genetic algorithms can cause repeated genetic codes after encoding, where each genetic code represents a sampling point that only needs to be visited once. Therefore, this study adopted a local matching crossover method, which randomly generates two crossover points, exchanges the crossover area between two parent particles, constructs mapping relationships based on the genetic codes within the area, and eliminates the repeated genetic codes in the offspring. The mutation operator performs mutation based on the order of execution, randomly generates two mutation points, and exchanges the genetic codes between the mutation points, thus exchanging the sampling points.

3.2. Obstacle Avoidance Path Planning Algorithm Based on Hierarchical Mixed Improved PSO and RRT

The RRT algorithm gradually constructs a tree by randomly generating sample points in the state space, and then finds a path from the start point to the end point. The tree nodes of the tree represent a point in the state space, which can be represented as ( q 1 , q 2 , , q n ) , n where q is a dimensionality of the state space. The distance between two state points is denoted by d t , and is calculated as follows:
d t ( q 1 , q 2 ) = ( i = 1 n ( q 1 i q 2 i ) 2 )
Next, a point in the state space is randomly sampled, and its coordinates are represented as q r a n d = ( q r a n d 1 , q r a n d 2 , , q r a n d n ) . Then, the nearest node to the sampled point in the tree is selected and denoted by q n e a r , which can be expressed as the following:
q n e a r = a r g m i n q i T d t ( q r a n d , q i )
where T represents all of the nodes in the tree.
A new node obtained by moving for a certain distance from node q n e a r node towards the sampled point is denoted by q n e w , and is calculated as follows:
q n e w = q n e a r + q r a n d q n e a r d t ( q r a n d q n e a r ) Δ q
where Δ q represents the maximum distance limit between the current node and the target node.
If a new node is not within an obstacle area or crosses the flight zone boundary, it is added to the tree, and a path from node q n e a r to the new node is constructed. After repeating the process of generating sampling points multiple times, a path from the start point to the end point is generated [47]. The RRT algorithm is combined with the LHIPSO algorithm. According to the sampling point sequence planned by LHIPSO, the RRT algorithm sequentially plans executable paths for adjacent points, and finally generates the shortest path that traverses all of the sampling points.

3.3. Path Processing

The path generated by the combination of the two algorithms has the shortcomings of large turning angles and excessive redundant points, so redundant point removal and smoothing processes are performed to reduce redundancy and increase smoothness, respectively [48,49,50]. The redundant point removal process is performed using a reverse traversal method. First, the target point is stored in an array, and then the target point is connected to the second-to-last node, and it is determined whether a collision has occurred. If there is no collision, the UAV continues to traverse forward along the planned path points. If there is a collision, the current node is stored in the first position of the array, and current node is used to replace the target point and the UAV continues to traverse in reverse until the initial point is reached. At this time, the array node data denote the result after redundant point removal.
The smoothing process using the quadratic B-splines is performed to further reduce excessive turning angles, even after the removal of redundant points. The mathematical expression of the quadratic B-spline curve P(t) is given by the following:
P ( t ) = 1 2 ( 1 t ) 2 P 0 + 1 2 ( 2 t 2 + 2 t + 1 ) P 1 + 1 2 t 2 P 2
where p 0 , p 1 , and p 2 are the control points of the curve; t is the independent variable, and t ∈ [0, 1].

3.4. Implementation Steps of the Improved Algorithm

In the LHIPSO algorithm, the particle positions and velocities are initialized first, and then the path lengths between sampling points are calculated. The distances between the initial position of the UAV and the sampling points also need to be calculated. The fitness value is obtained by summing the path lengths between the UAV and the first and last sampling points and the path lengths between the sampling points, in the order of their execution. After the initialization of the particles’ positions and velocities, the fitness values of the particles are calculated. The particle swarm is divided into three subgroups using a hierarchical method according to the obtained fitness values. The first layer updates the velocity and position values using Equation (4); the second layer updates the velocity and position values with Equation (5); and the third layer updates the velocity and position values using the crossover and mutation operators. After each update iteration, the fitness value of the particles is recalculated, and hierarchical partitioning and individual and population best solution updating are performed until the maximum number of iterations is reached.
The pseudocode for the LHIPSO algorithm is shown in Algorithm 1.
Algorithm 1: LHIPSO algorithm
Input: ωmax; ωmin; c1; c2; low; up; Pc; Pm; iteration number; sampling point; M; N; UAV point;
Output: Sampling point execution sequence
1:Random initialization of M particles
2:for i = 1 to N do//Calculate the distance between the sampling points
3: for j =1 to N do//n is the number of sampling points
4:  calculate D(i,j)//D(i,j) is the sampling point distance
5: end for
6:end for
7:for i = 1 to M do//Calculate the fitness value
8: Calculate fitness(i)
9:end for
10:Calculate pbest, gbest//Calculate the local and global optimality value
11:while iter < itermax
12: Array = sort(fitness)//Sort fitness(i) in ascending order according to fitness value
13: The velocity and position of pop(1:low,:) are updated by Equation (4).
14: The velocity and position of pop(low + 1:up,:) are updated by Equation (5).
15: The velocity and position of pop(up + 1:M,:) are updated by the crossover mutation operator.
16: Calculate fitness
17: [minvalue,min_index] = min(fitness)//Determine the minimum fitness value and index
18: if minvalue < fitness(pbest) then//Update the local optimality value
19:  pbest = pop(min_index)
20: end if
21: if minvalue< fitness(gbest) then//Update the global optimality value
22:  gbest = pbest
23: end if
26:end while
25:Return gbest
Using the LHIPSO algorithm, the optimal execution order of the sampling points can be obtained. The initial position of a UAV is added to both the beginning and the end of the execution sequence, and the resulting execution sequence is used as the position sequence for RRT algorithm planning. Then, the adjacent points in the position sequence are set as the start and end points of the RRT algorithm, and a path is generated by the RRT algorithm. In particular, the first point in the position sequence is set as the start point of the RRT algorithm, and the second point is set as the end point; then, a path is generated using the RRT algorithm. Furthermore, the next points in the position sequence are selected and set as the start and end points of the RRT algorithm, and the algorithm continues until paths are generated between all of the adjacent points. Finally, a UAV obstacle-avoidance path is obtained, which starts from the initial position of the UAV, traverses all of the sampling points, and returns to its initial position.
The pseudocode for the RRT algorithm is shown in Algorithm 2.
Algorithm 2: RRT algorithm
Input: map; sampling point; N; UAV point; gbest; step
Output: UAV flight path
1:Position sequence = [UAV point; sampling point(gbest);UAV point]//The sequence of locations that need to be planned
2:for i = 1 to (N + 1) do//Cyclic planning of adjacent points
3: Xstart = Position sequence[i]
4: T = Xstart
5: Xgoal = Position sequence[i + 1]
6: parent = 1
7: while goalFound = false//Whether to plan to the end
8:  Xrand = sample(Xstart, Xgoal)
9:  Xnear = Nearest(T, Xrand)
10:  Xnew = Steer(Xnear, Xrand, step)
11:  if Obstaclecollision(Xnew, Xnear, map) == false//Obstacle judgment
12:   parent(Xnew) = Xnear
13:   T = [T, Xnew]
14:   if distance(Xnew, Xgoal) ≤ Thresholdvalue//Target point judgment
15:    goalFound = True
16:    break;
17:   end if
18:  else if
19:   continue
20:  end if
21: end while
22: Path = [Path, T]//All adjacent point path combinations
23:end for
24:return Path

4. Experimental Analysis and Results

4.1. Simulation Experiment

4.1.1. Environmental Model Design

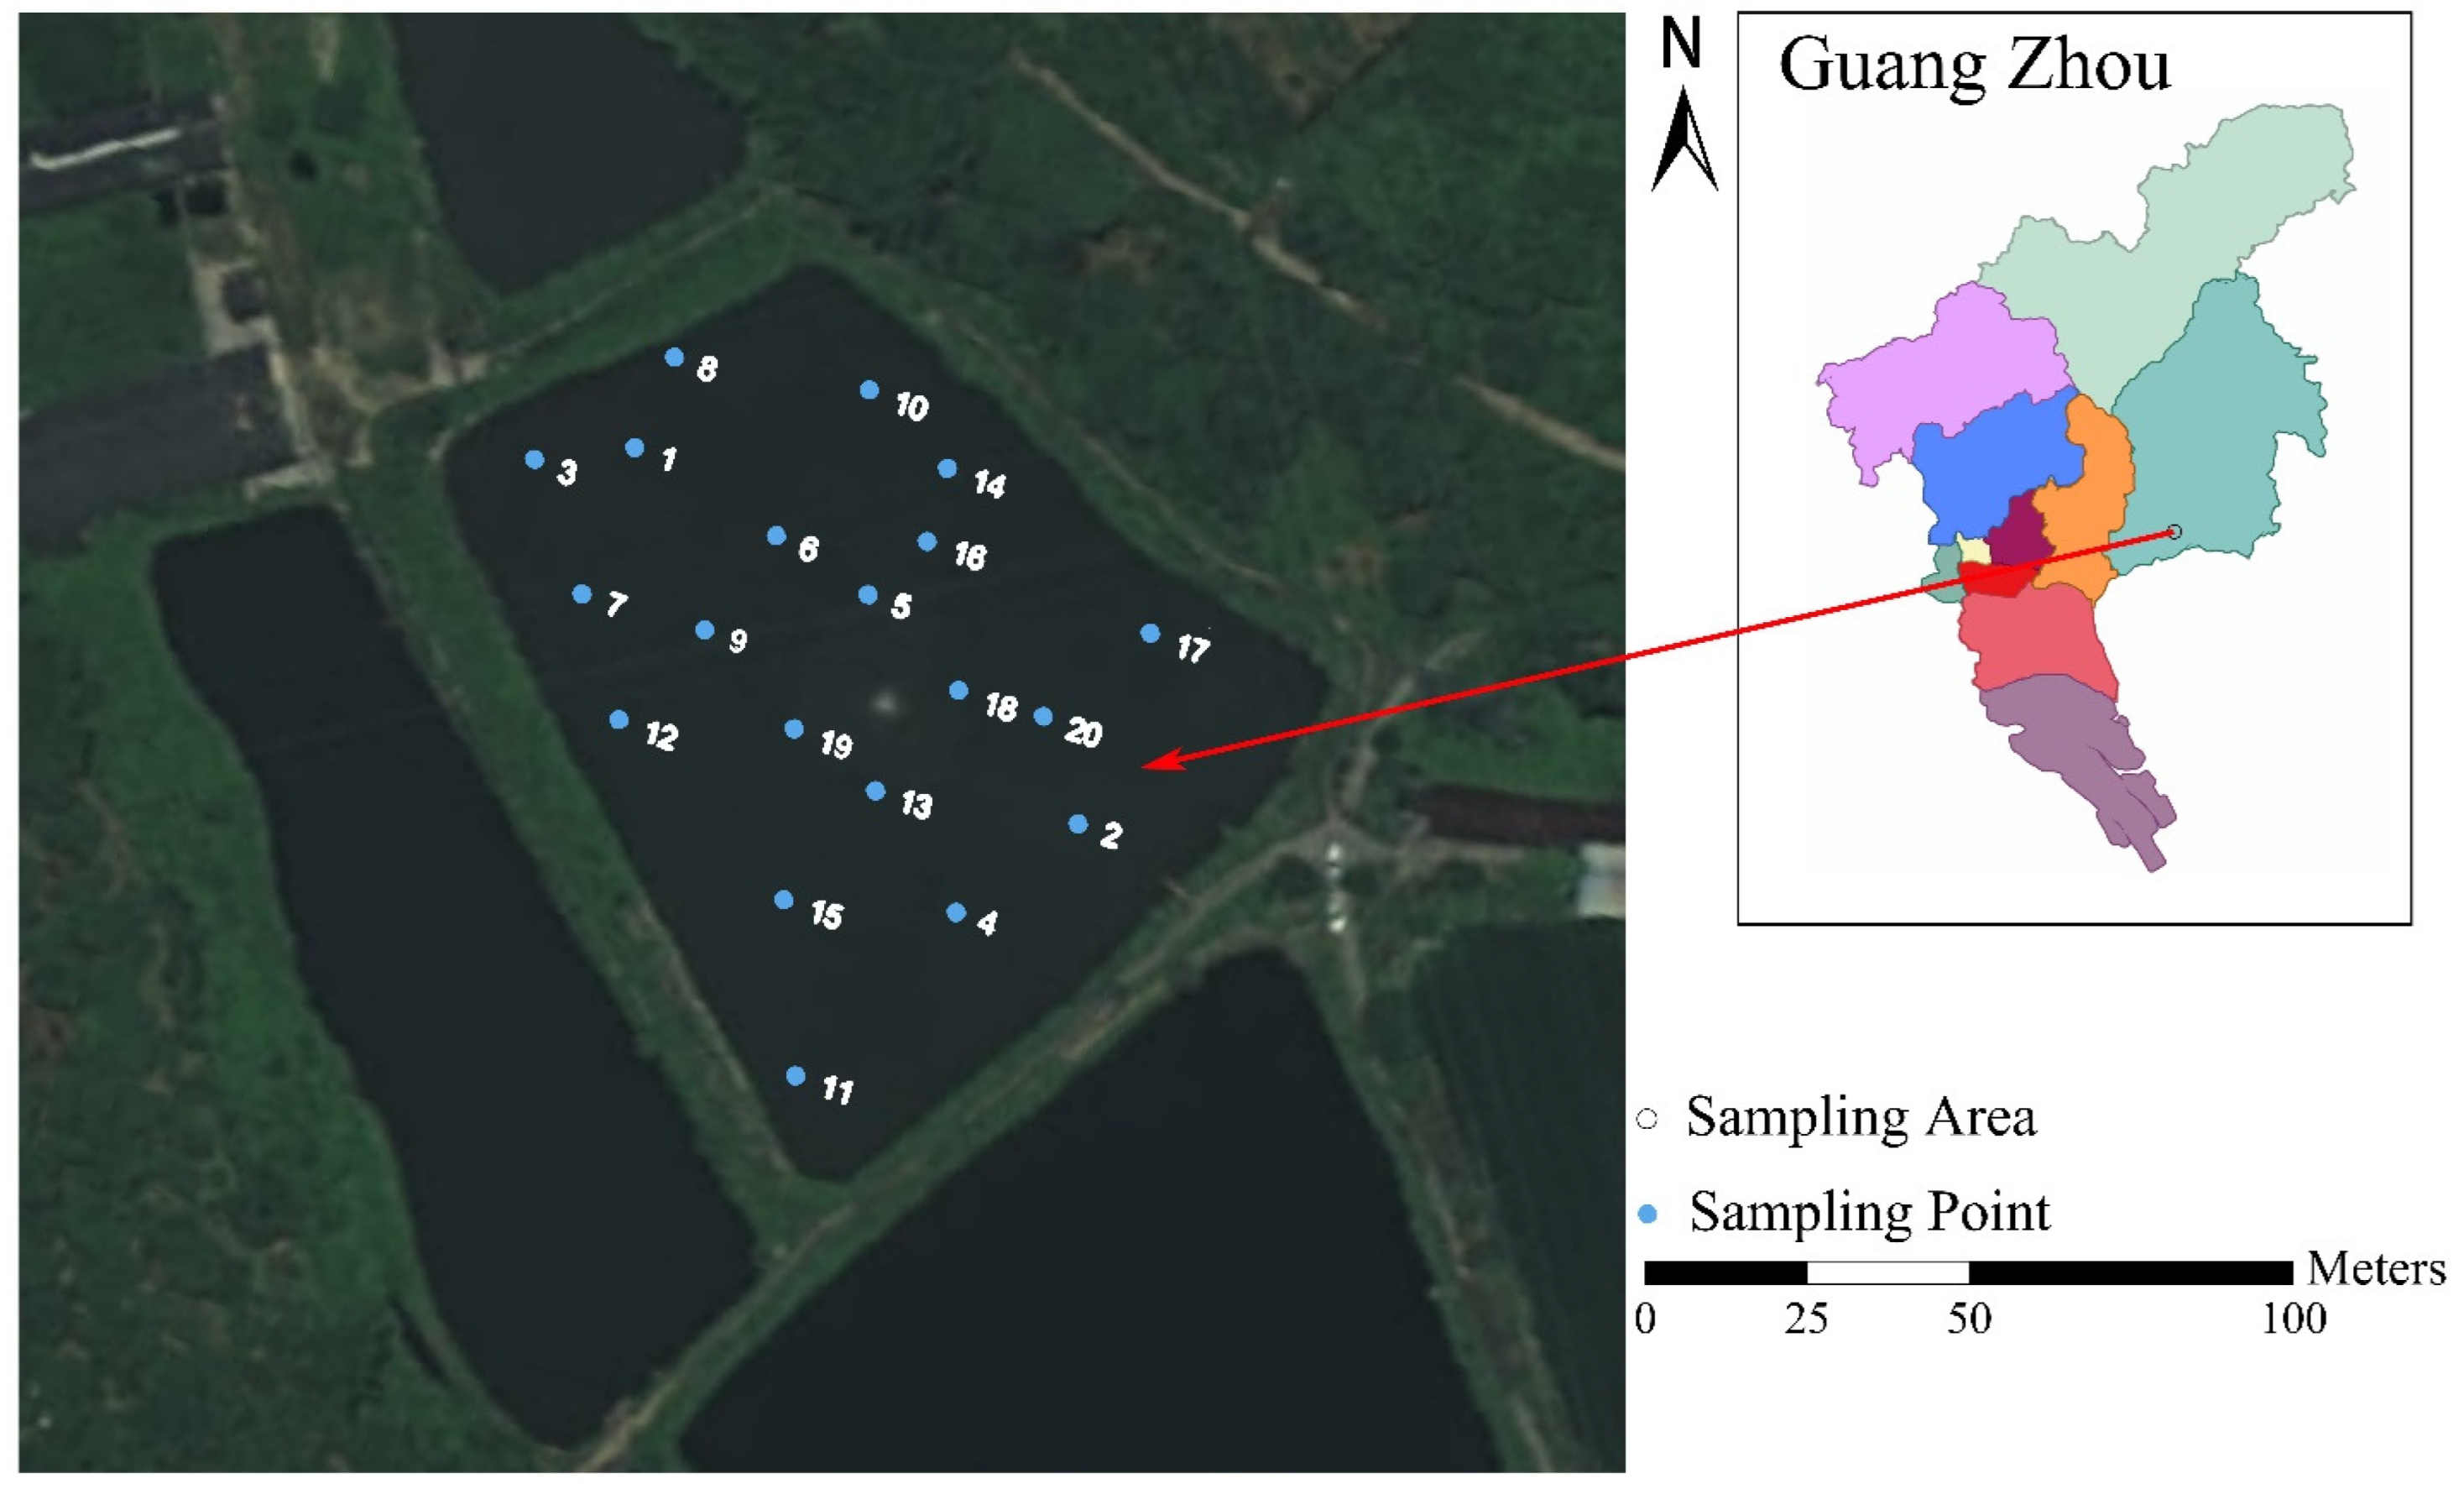
In this study, a fish pond in Zengcheng District, Guangdong Province, China was selected as a test environment; its location on the satellite map is shown in Figure 5. In Figure 5, the blue dots represent the sampling point locations, and the numbers indicate the sampling point numbers. The map is a map of Guangzhou City, where different colors represent different districts. After conducting the field survey of the fish pond environment, Matlab R2020a (MathWorks, Natick, MA, USA) was used to model the environment, and the obtained simulated test environment is shown in Figure 6. In Figure 6, the white area represents the UAV’s flight space, the blue circles denote obstacles in the fish pond, and the black boundary indicates the constraints of the working space. In the algorithm simulation, 20 sampling points and 1 takeoff point were set. To ensure the randomness and uniform distribution of the sampling points’ locations, the working environment was divided into 20 regions based on the height and width of the pond, and a random sampling position was generated in each region. In Figure 6, the red dot represents the takeoff point of the UAV, and the black dots denote the locations of the sampling points.

4.1.2. Simulation Results and Analysis

The simulations were conducted using MATLAB R2020a software on a pc using the Windows 10 operating system, and the path planning experiments were performed using the designed simulation environment. First, the proposed LHIPSO algorithm was used to calculate an optimal order to traverse each sampling point, thus obtaining the initial path of the UAV as shown in Figure 7a. Next, based on the simulation environment, the path was obtained by performing RRT obstacle avoidance processing, as shown in Figure 7b. The obtained path was optimized by removing redundant points and smoothing the path to eliminate shaking and unnecessary turning. The path obtained after redundant points removal is shown in Figure 7c, and the path after performing the B-spline path smoothing operation is shown in Figure 7d.
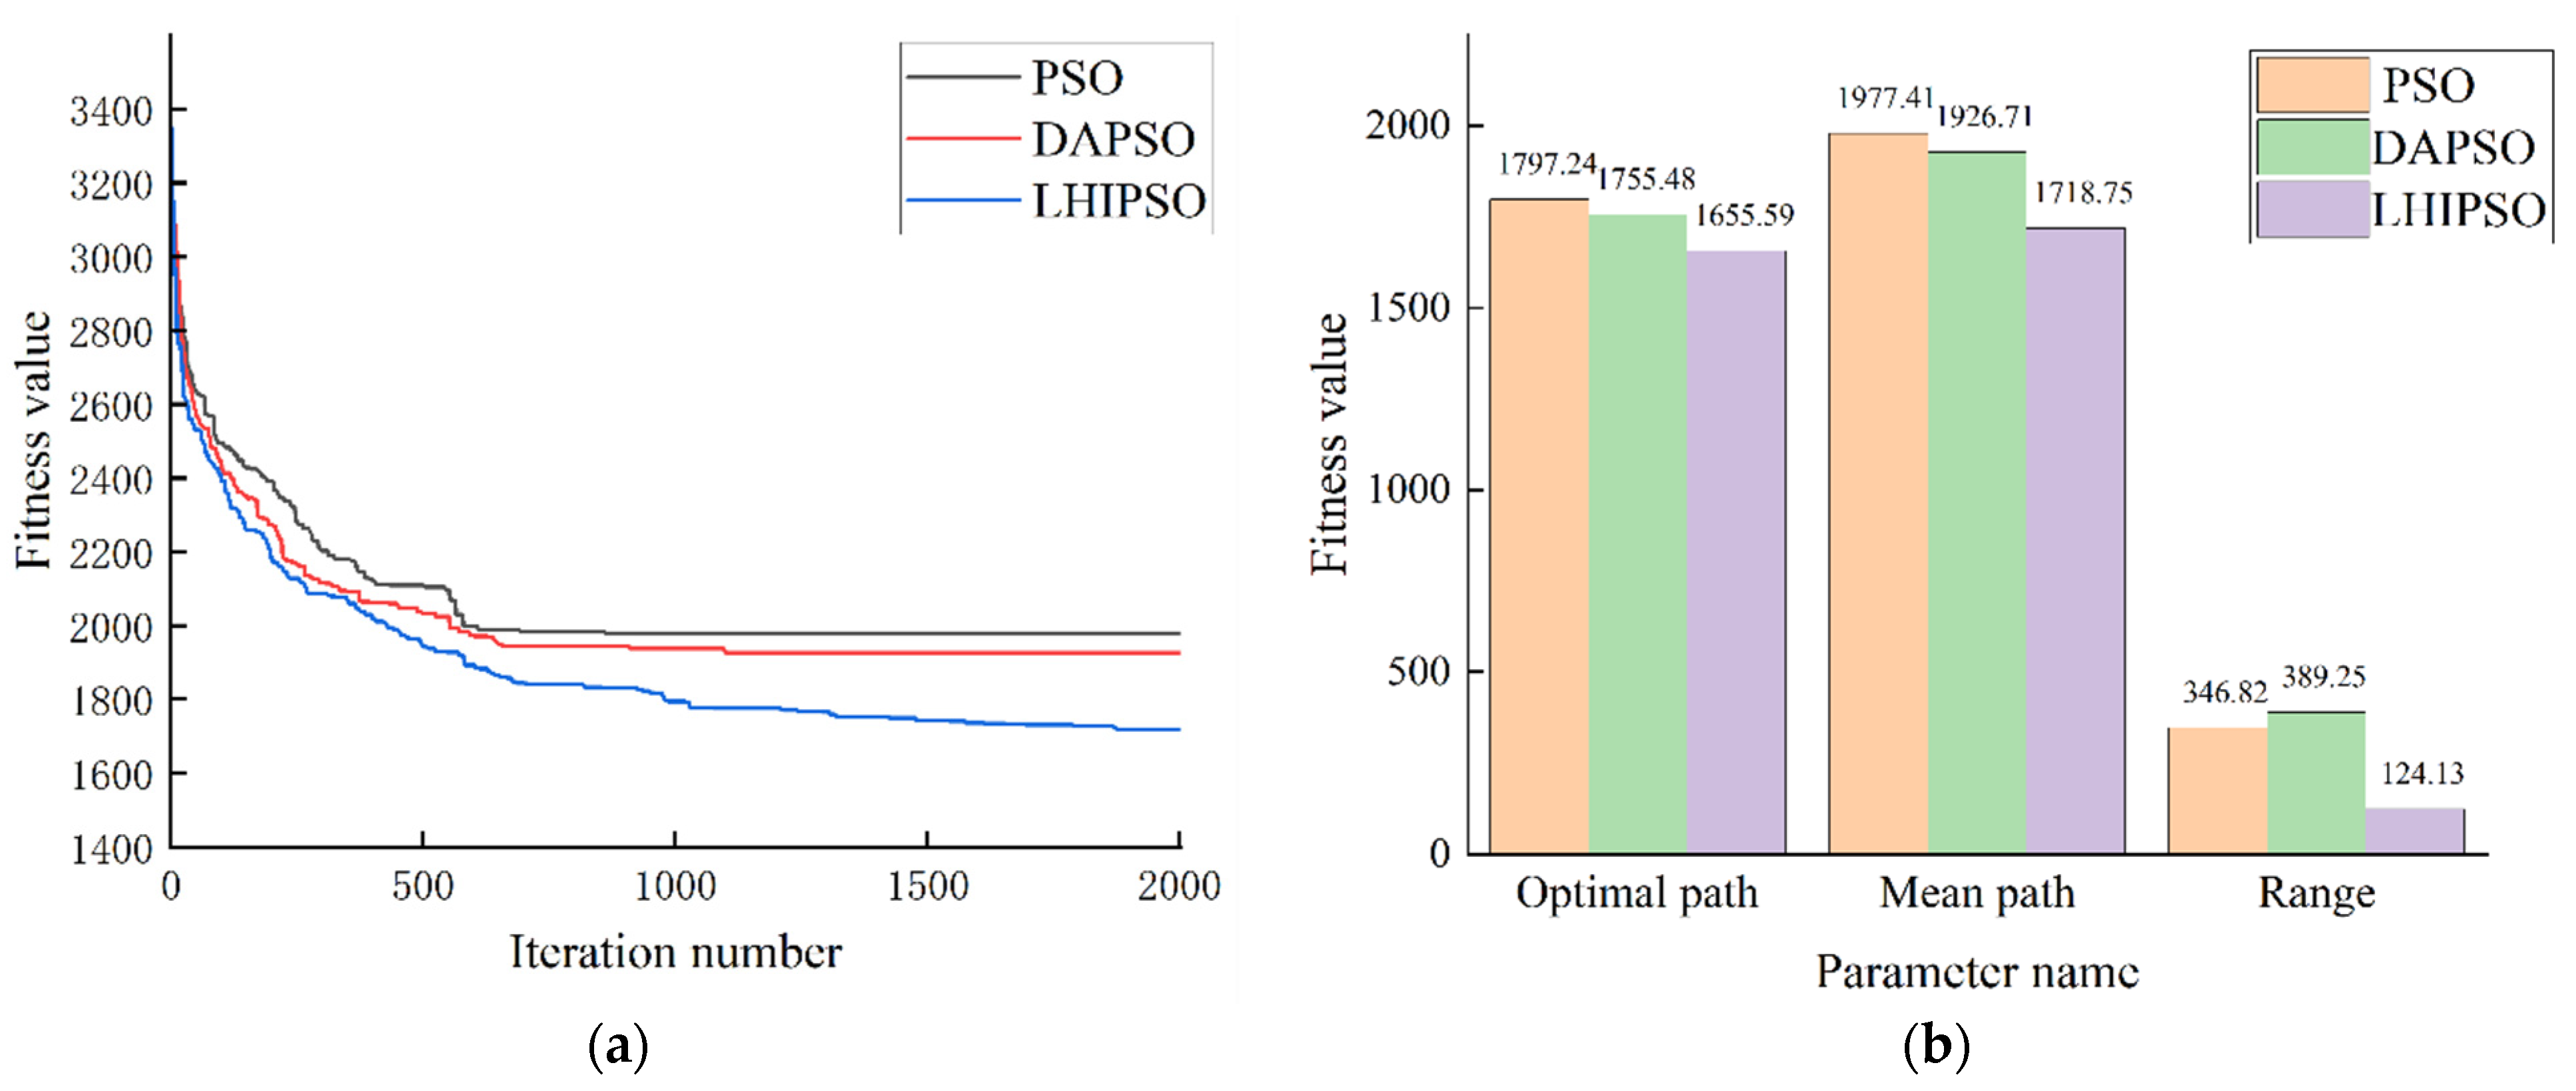
Path planning algorithm performance: Next, the PSO algorithm defined by Equations (1) and (2); the DAPSO algorithm based on the dynamic parameter adjustment given by Equation (5); and the LHIPSO algorithm were all used in the comparison tests to verify the effectiveness of the proposed algorithm. The parameters of each algorithm were kept the same. The number of iteration times was 2000 for all, and the population size was 50. Each algorithm was run 10 times in the simulation environment, and the average values were taken as experimental data. As the number of iterations increased, the algorithm gradually tended towards a better direction, and the fitness value continued to decrease. The relationship curve between the number of iterations and the fitness value is shown in Figure 8a. The best fitness values, average fitness values, and range of the three algorithms in the 10 experiments are shown in Figure 8b.
The experimental results showed that in the simulation environment, the average length of the path planned by the LHIPSO algorithm was shortened by 13.08% and 10.79% compared to those of the PSO and DAPSO algorithms, respectively, indicating the stronger global optimization ability of the LHIPSO algorithm. The range of the 10 path plans obtained by the LHIPSO algorithm was reduced by 64.21% and 68.11% compared to the other algorithms, reflecting the stability of the LHIPSO algorithm. In conclusion, the proposed algorithm was effective due to dynamically changing the weight and learning factor based on the particle swarm algorithm and introducing the improvement methods, such as crossover, mutation algorithms, and hierarchical learning.
Cost comparison: The experimental fish pond had an approximate area of 1 hectare. For the study, 20 sampling points were selected, where each point was sampled and tested at two depths: 1 m and 2 m. When comparing traditional manual sampling to the proposed UAV sampling method, there were differences found in terms of sampling time and labor costs. On average, manual sampling at a single location takes around 5 min, while UAV sampling at a single location takes approximately 3 min. In terms of labor costs, manual sampling requires at least two personnel, one to operate the boat and another to manually collect the samples. On the other hand, UAV sampling only requires one person to handle replacement of the sampling bottles.

4.2. Field Experiment

To verify the reliability of the proposed LHIPSO algorithm, several field experiments were conducted in a real environment. The experiments were conducted in a fish pond for aquaculture located in Zengcheng District, Guangdong Province. The fish pond was divided into regions based on a grid system, and random grid points were selected for water quality sampling tests. The upper computer sent a flight plan with the sampling points, and the water quality sampling device was activated after the UAV reached the sampling points for water quality sampling and monitoring. The collected data were used to create a visualization map of the water quality parameters distribution, which was then processed by the ArcMap (Esri, Redlands, CA, USA) and interpolated using the Kriging method. Based on the latitude and longitude values of the sampling points and water quality parameters information, the data at the intermediate position were simulated, and a visualization map was generated.

Fishpond Experiment Data and Analysis

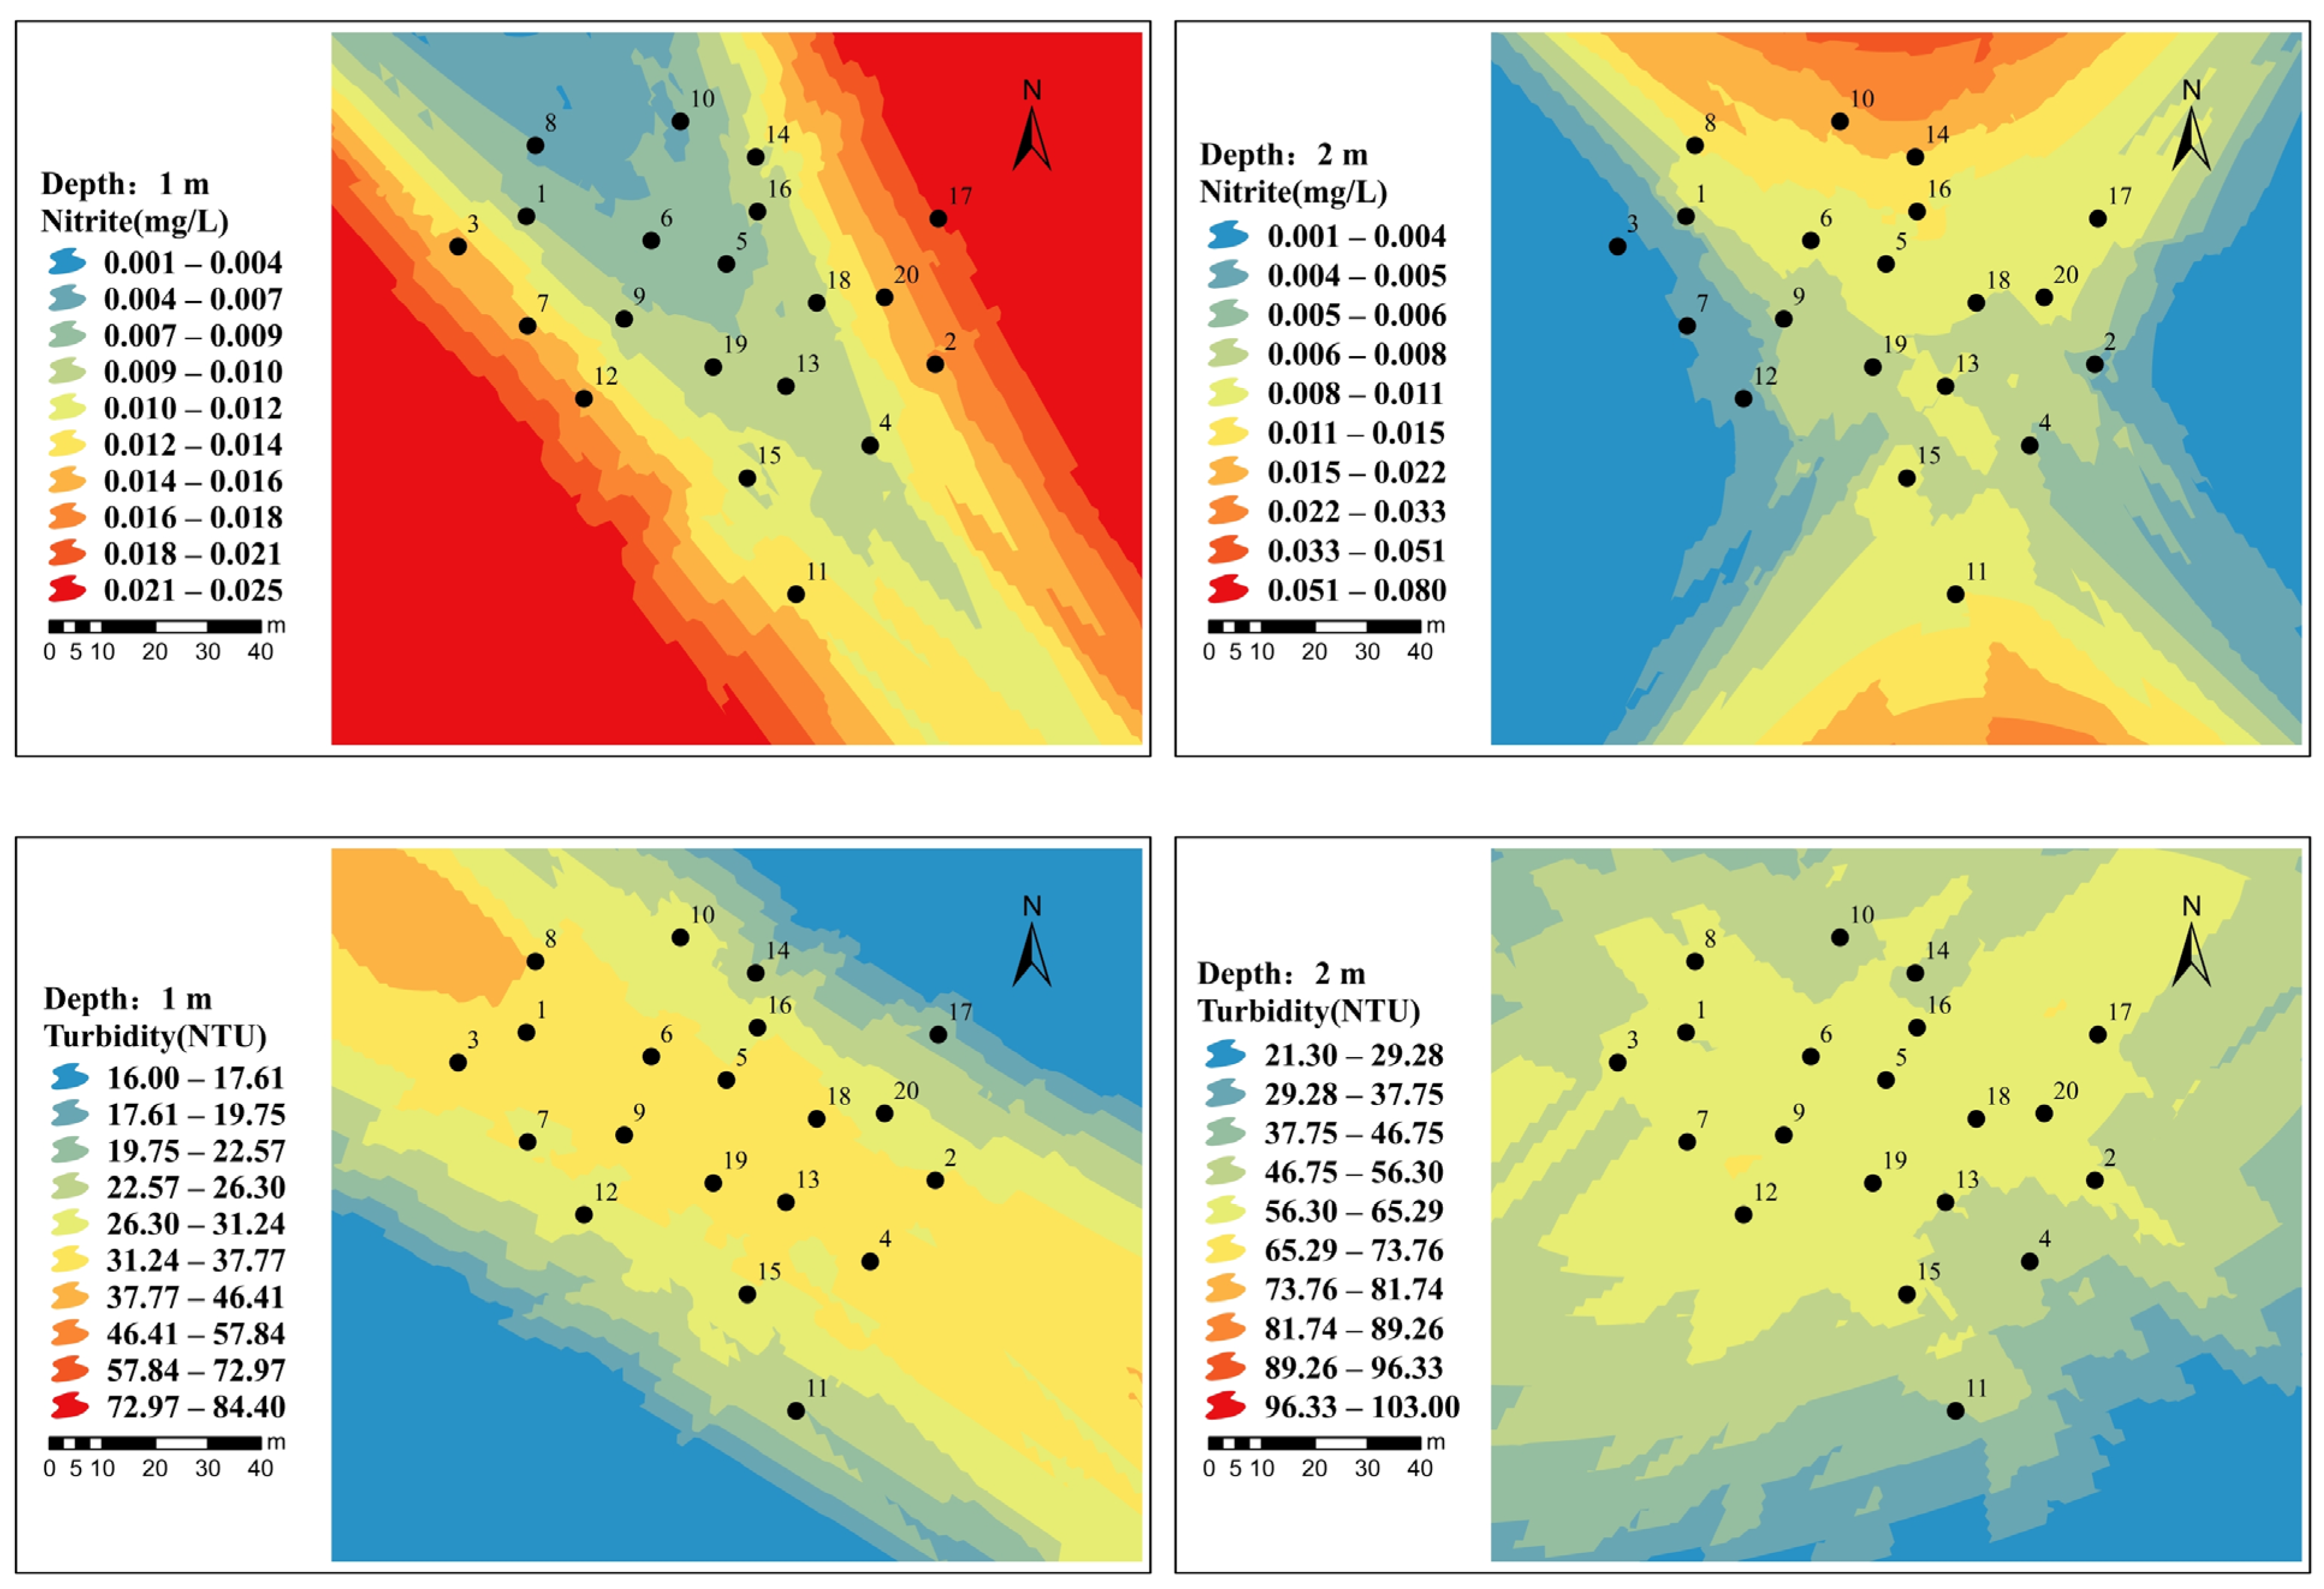
The water quality parameters of the fish pond are shown in Table 2. The visualization parameter map generated by interpolating the sampling point positions and parameters is presented in Figure 9. The average measurement values of the ph, TDS, and turbidity parameters at a depth of 1 m were 7.72, 84.35 ppm, and 34.16 NTU, respectively. The average measurement values of the nitrite, ammonia nitrogen, and dissolved oxygen were 0.011 mg/L, 0.37 mg/L, and 9.47 mg/L, respectively. The average measurement values of the pH, TDS, and turbidity at a depth of 2 m were 7.485, 84.35 ppm, and 58.42 NTU, respectively. The average measurement values of the nitrite, ammonia nitrogen, and dissolved oxygen were 0.013 mg/L, 0.31 mg/L, and 7.25 mg/L, respectively. Based on the results, there were no significant differences in the TDS, pH, nitrite, and ammonia nitrogen values at different depths. The difference in the average measurement values of turbidity was 24.26 NTU, and that of dissolved oxygen was 2.22 mg/L.
The pH value ranged from 6.9 to 8.52, indicating a neutral overall condition with weak alkalinity in some areas. The distribution patterns of the TDS at the two depths were similar, having higher values at the northwest and southeast ends. The average values of ammonia nitrogen were 0.011 and 0.013 mg/L, which both met the requirement for ammonia nitrogen content in fish ponds to be less than 0.5 mg/L; however, there were some exceedances at a few sampling points. The spatial variation in dissolved oxygen was mainly affected by the light intensity, and showed certain variations in both the horizontal and vertical directions. In the horizontal direction, the amount of plankton and the dissolved oxygen produced by photosynthesis were relatively higher in the leeward position, which was due to the effects of different wind directions and strengths. In the vertical direction, as the light intensity decreased with depth, the dissolved oxygen content in the upper layer of water was generally higher than that in the lower layer. As shown in Table 2, the average dissolved oxygen content at a depth of 1 m was higher than that at a depth of 2 m. The measurement of nitrite ranged from 0.001 to 0.08. According to the GB3838-2002 standard for surface water quality, the nitrite content in Class III fishery water areas should be less than or equal to 0.15 mg/L, thus the water quality of the fish pond met this standard. The main factors affecting the water turbidity were suspended sediment and algae, which could be related to fish feed or sediment carried by rainfall runoff.

5. Conclusions

To address the problems of low efficiency, high labor costs, and potential dangers in traditional water quality sampling, this study proposed a multi-rotor UAV-based water quality sampling and multi-parameter monitoring system. The proposed system performs both manual and automatic control of a UAV to reach sampling locations, activates the water sampling device upon reaching the target location and entering hover mode, and collects samples and monitors parameters of the target water area. The measured data are wirelessly transmitted to the upper computer for further analysis. The proposed system is equipped with five sampling bottles, each of which is capable of holding 300 mL of samples, which facilities the collection process of multiple samples in a single flight, and reduces the time required for sample collection. The proposed system uses several water quality monitoring sensors to obtain real-time data on pH, turbidity, and TDS parameters.
To meet the operational requirements of the UAV water quality sampling and detection, a double-layered combination path planning algorithm based on the LHIPSO and the RRT obstacle avoidance was developed. The effectiveness of the proposed algorithm was verified through simulation experiments, and further validated in practical application examples. Sample collection and testing experiments were conducted in outdoor fish ponds, and a total of 40 water samples were collected at 20 locations, at depths of 1 m and 2 m. The experimental results demonstrated that the proposed system can meet the requirements of water quality sampling and monitoring processes, having superior mobility and safety and a lower cost of operation than existing water quality monitoring methods. Future research efforts will focus on optimizing the water quality sampling and multi-parameter monitoring system, including accelerating sampling speed, increasing the number of collection bottles, and deploying more water quality parameter detection probes.

Author Contributions

Conceptualization, R.Z. and X.L.; methodology, Z.W.; software, Z.S.; validation, B.W. All authors have read and agreed to the published version of the manuscript.

Funding

This research is supported the Featured Innovation Projects of Guangdong Province of China under Grant 2021KTSCX049, the 2023 Guangdong Provincial Science and Technology Innovation Strategy Special Project under Grant pdjh2023a0256, and the Natural Science Foundation of Guangdong Province of China under Grant 2019A1515011346.

Data Availability Statement

Please contact the corresponding author for data.

Conflicts of Interest

The authors declare no conflict of interest.

References

  1. Mekonnen, M.M.; Hoekstra, A.Y. Four billion people facing severe water scarcity. Sci. Adv. 2016, 2, e1500323. [Google Scholar] [CrossRef] [Green Version]
  2. Wang, Z.; Zhong, R.; Lai, C.; Zeng, Z.; Lian, Y.; Bai, X. Climate change enhances the severity and variability of drought in the Pearl River Basin in South China in the 21st century. Agric. For. Meteorol. 2018, 249, 149–162. [Google Scholar] [CrossRef]
  3. Han, D.; Currell, M.J.; Cao, G. Deep challenges for China’s war on water pollution. Environ. Pollut. 2016, 218, 1222–1233. [Google Scholar] [CrossRef] [Green Version]
  4. Currell, M.J.; Han, D. The Global Drain: Why China’s Water Pollution Problems Should Matter to the Rest of the World. Environment 2017, 59, 16–29. [Google Scholar] [CrossRef]
  5. Hu, Y.; Cheng, H. Water pollution during China’s industrial transition. Environ. Dev. 2013, 8, 57–73. [Google Scholar] [CrossRef]
  6. Liu, Y.; Wang, P.; Gojenko, B.; Yu, J.; Wei, L.; Luo, D.; Xiao, T. A review of water pollution arising from agriculture and mining activities in Central Asia: Facts, causes and effects. Environ. Pollut. 2021, 291, 118209. [Google Scholar] [CrossRef] [PubMed]
  7. Warren-Vega, W.M.; Campos-Rodríguez, A.; Zárate-Guzmán, A.I.; Romero-Cano, L.A. A Current Review of Water Pollutants in American Continent: Trends and Perspectives in Detection, Health Risks, and Treatment Technologies. Int. J. Environ. Res. Public Health 2023, 20, 4499. [Google Scholar] [CrossRef]
  8. Liu, W.; Chen, W.; Feng, Q.; Deo, R.C. Situations, challenges and strategies of urban water management in Beijing under rapid urbanization effect. Water Supply 2019, 19, 115–127. [Google Scholar] [CrossRef]
  9. Hangan, A.; Chiru, C.G.; Arsene, D.; Czako, Z.; Lisman, D.F.; Mocanu, M.; Pahontu, B.; Predescu, A.; Sebestyen, G. Advanced Techniques for Monitoring and Management of Urban Water Infrastructures—An Overview. Water 2022, 14, 2147. [Google Scholar] [CrossRef]
  10. Ermilio, J.; Pattison, I.; Sohail, M. Performance Monitoring and Sustainable Management of Piped Water Supply Infrastructure in Developing Communities. J. Water Resour. Plan. Manag. 2022, 148, 05021030. [Google Scholar] [CrossRef]
  11. Tang, M.; Xu, W.; Zhang, C.; Shao, D.; Zhou, H.; Li, Y. Risk assessment of sectional water quality based on deterioration rate of water quality indicators: A case study of the main canal of the Middle Route of South-to-North Water Diversion Project. Ecol. Indic. 2022, 135, 108592. [Google Scholar] [CrossRef]
  12. Pan, B.; Han, X.; Chen, Y.; Wang, L.; Zheng, X. Determination of key parameters in water quality monitoring of the most sediment-laden Yellow River based on water quality index. Process Saf. Environ. Prot. 2022, 164, 249–259. [Google Scholar] [CrossRef]
  13. Rand, J.M.; Nanko, M.O.; Lykkegaard, M.B.; Wain, D.; King, W.; Bryant, L.D.; Hunter, A. The human factor: Weather bias in manual lake water quality monitoring. Limnol. Oceanogr. Methods 2022, 20, 288–303. [Google Scholar] [CrossRef]
  14. Eliades, D.G.; Polycarpou, M.M.; Charalambous, B. A Security-Oriented Manual Quality Sampling Methodology for Water Systems. Water Resour. Manag. 2011, 25, 1219–1228. [Google Scholar] [CrossRef]
  15. Romić, D.; Castrignanò, A.; Romić, M.; Buttafuoco, G.; Kovačić, M.B.; Ondrašek, G.; Zovko, M. Modelling spatial and temporal variability of water quality from different monitoring stations using mixed effects model theory. Sci. Total Environ. 2020, 704, 135875. [Google Scholar] [CrossRef]
  16. Asadollahfardi, G.; Heidarzadeh, N.; Mosalli, A.; Sekhavati, A. Optimization of water quality monitoring stations using genetic algorithm, a case study, Sefid-Rud River, Iran. Adv. Environ. Res. 2018, 7, 87–107. [Google Scholar]
  17. Chen, W.; Hao, X.; Lu, J.; Yan, K.; Liu, J.; He, C.; Xu, X. Research and Design of Distributed IoT Water Environment Monitoring System Based on LoRa. Wirel. Commun. Mob. Comput. 2021, 2021, 9403963. [Google Scholar] [CrossRef]
  18. Martínez, R.; Vela, N.; El Aatik, A.; Murray, E.; Roche, P.; Navarro, J.M. On the Use of an IoT Integrated System for Water Quality Monitoring and Management in Wastewater Treatment Plants. Water 2020, 12, 1096. [Google Scholar] [CrossRef] [Green Version]
  19. Cao, H.; Guo, Z.; Wang, S.; Cheng, H.; Zhan, C. Intelligent wide-area water quality monitoring and analysis system exploiting unmanned surface vehicles and ensemble learning. Water 2020, 12, 681. [Google Scholar] [CrossRef]
  20. Chang, H.C.; Hsu, Y.L.; Hung, S.S.; Ou, G.R.; Wu, J.R.; Hsu, C. Autonomous Water Quality Monitoring and Water Surface Cleaning for Unmanned Surface Vehicle. Sensors 2021, 21, 1102. [Google Scholar] [CrossRef]
  21. Lally, H.T.; O’Connor, I.; Jensen, O.P.; Graham, C.T. Can drones be used to conduct water sampling in aquatic environments? A review. Sci. Total Environ. 2019, 670, 569–575. [Google Scholar] [CrossRef]
  22. Bussières, S.; Kinnard, C.; Clermont, M.; Campeau, S.; Dubé-Richard, D.; Bordeleau, P.A.; Roy, A. Monitoring Water Turbidity in a Temperate Floodplain Using UAV: Potential and Challenges. Can. J. Remote Sens. 2022, 48, 565–574. [Google Scholar] [CrossRef]
  23. Castendyk, D.; Voorhis, J.; Kucera, B. A validated method for pit lake water sampling using aerial drones and sampling devices. Mine Water Environ. 2020, 39, 440–454. [Google Scholar] [CrossRef] [Green Version]
  24. Caldwell, S.H.; Kelleher, C.; Baker, E.A.; Lautz, L.K. Relative information from thermal infrared imagery via unoccupied aerial vehicle informs simulations and spatially-distributed assessments of stream temperature. Sci. Total Environ. 2019, 661, 364–374. [Google Scholar] [CrossRef]
  25. Wójcik, K.A.; Bialik, R.J.; Osińska, M.; Figielski, M. Investigation of Sediment-Rich Glacial Meltwater Plumes Using a High-Resolution Multispectral Sensor Mounted on an Unmanned Aerial Vehicle. Water 2019, 11, 2405. [Google Scholar] [CrossRef] [Green Version]
  26. Chen, J.; Wang, Z.; Wu, X.; Chen, X.; Lai, C.; Zeng, Z.; Li, J. Accuracy evaluation of GPM multi-satellite precipitation products in the hydrological application over alpine and gorge regions with sparse rain gauge network. Hydrol. Res. 2019, 50, 1710–1729. [Google Scholar] [CrossRef] [Green Version]
  27. Pan, X.; Wang, Z.; Ullah, H.; Chen, C.; Wang, X.; Li, X.; Li, H.; Zhuang, Q.; Xue, B.; Yu, Y. Evaluation of Eutrophication in Jiaozhou Bay via Water Color Parameters Determination with UAV-Borne Hyperspectral Imagery. Atmosphere 2023, 14, 387. [Google Scholar] [CrossRef]
  28. Koparan, C.; Koc, A.B.; Privette, C.V.; Sawyer, C.B. Adaptive Water Sampling Device for Aerial Robots. Drones 2020, 4, 5. [Google Scholar] [CrossRef] [Green Version]
  29. Sparaventi, E.; Rodriguez-Romero, A.; Navarro, G.; Tovar-Sánchez, A. A Novel Automatic Water Autosampler Operated From UAVs for Determining Dissolved Trace Elements. Front. Mar. Sci. 2022, 9, 879953. [Google Scholar] [CrossRef]
  30. Koparan, C.; Koc, A.B.; Privette, C.V.; Sawyer, C.B. In Situ Water Quality Measurements Using an Unmanned Aerial Vehicle (UAV) System. Water 2018, 10, 264. [Google Scholar] [CrossRef] [Green Version]
  31. Banerjee, B.P.; Raval, S.; Maslin, T.J.; Timms, W. Development of a UAV-mounted system for remotely collecting mine water samples. Int. J. Min. Reclam. Environ. 2020, 34, 385–396. [Google Scholar] [CrossRef]
  32. Davis, A.; Wills, P.S.; Garvey, J.E.; Fairman, W.; Karim, M.A.; Ouyang, B. Developing and Field Testing Path Planning for Robotic Aquaculture Water Quality Monitoring. Appl. Sci. 2023, 13, 2805. [Google Scholar] [CrossRef]
  33. Cui, X.; Wang, Y.; Yang, S.; Liu, H.; Mou, C. UAV path planning method for data collection of fixed-point equipment in complex forest environment. Front. Neurorobotics 2022, 16, 1105177. [Google Scholar] [CrossRef] [PubMed]
  34. Radhakrishnan, V.; Wu, W. Energy Efficient Communication Design in UAV Enabled WPCN Using Dome Packing Method in Water Distribution System. Energies 2022, 15, 3844. [Google Scholar] [CrossRef]
  35. Ore, J.P.; Elbaum, S.; Burgin, A.; Detweiler, C. Autonomous Aerial Water Sampling. J. Field Robot. 2015, 32, 1095–1113. [Google Scholar] [CrossRef] [Green Version]
  36. Ostertag, M.; Atanasov, N.; Rosing, T. Trajectory Planning and Optimization for Minimizing Uncertainty in Persistent Monitoring Applications. J. Intell. Robot. Syst. 2022, 106, 2. [Google Scholar] [CrossRef]
  37. Wu, B.; Guo, D.; Zhang, B.; Zhang, X.; Wang, H.; Wang, H.; Jiang, H. Completion time minimization for UAV enabled data collection with communication link constrained. IET Commun. 2022, 16, 1025–1040. [Google Scholar] [CrossRef]
  38. Strąk, Ł.; Skinderowicz, R.; Boryczka, U.; Nowakowski, A. A Self-Adaptive Discrete PSO Algorithm with Heterogeneous Parameter Values for Dynamic TSP. Entropy 2019, 21, 738. [Google Scholar] [CrossRef] [Green Version]
  39. Zhong, Y.; Lin, J.; Wang, L.; Zhang, H. Discrete comprehensive learning particle swarm optimization algorithm with Metropolis acceptance criterion for traveling salesman problem. Swarm Evol. Comput. 2018, 42, 77–88. [Google Scholar] [CrossRef]
  40. Kumar, G.; Anwar, A.; Dikshit, A.; Poddar, A.; Soni, U.; Song, W.K. Obstacle avoidance for a swarm of unmanned aerial vehicles operating on particle swarm optimization: A swarm intelligence approach for search and rescue missions. J. Braz. Soc. Mech. Sci. Eng. 2022, 44, 56. [Google Scholar] [CrossRef]
  41. Ma, Z.; Chen, J. Adaptive path planning method for UAVs in complex environments. Int. J. Appl. Earth Obs. Geoinf. 2022, 115, 103133. [Google Scholar] [CrossRef]
  42. Moazen, H.; Molaei, S.; Farzinvash, L.; Sabaei, M. PSO-ELPM: PSO with elite learning, enhanced parameter updating, and exponential mutation operator. Inf. Sci. 2023, 628, 70–91. [Google Scholar] [CrossRef]
  43. Li, R.; Zhuang, Q.; Yu, N.; Li, R.; Zhang, H. Improved Hybrid Particle Swarm Optimizer with Sine-Cosine AccelerationCoefficients for Transient Electromagnetic Inversion. Curr. Bioinform. 2021, 17, 60–76. [Google Scholar]
  44. Wu, P.; Wang, D. Classification of a DNA Microarray for Diagnosing Cancer Using a Complex Network Based Method. IEEE/ACM Trans. Comput. Biol. Bioinform. (TCBB) 2019, 16, 801–808. [Google Scholar] [CrossRef]
  45. Li, S.; Wang, Z.; Wu, X.; Zeng, Z.; Shen, P.; Lai, C. A novel spatial optimization approach for the cost-effectiveness improvement of LID practices based on SWMM-FTC. J. Environ. Manag. 2022, 307, 114574. [Google Scholar] [CrossRef] [PubMed]
  46. Khan, I.; Pal, S.; Maiti, M.K. A Hybrid PSO-GA Algorithm for Traveling Salesman Problems in Different Environments. Int. J. Uncertain. Fuzziness Knowl. -Based Syst. 2019, 27, 693–717. [Google Scholar] [CrossRef]
  47. Janoš, J.; Vonásek, V.; Pěnička, R. Multi-Goal Path Planning Using Multiple Random Trees. Ieeerobotics Autom. Lett. 2021, 6, 4201–4208. [Google Scholar] [CrossRef]
  48. Zhang, S.; Yao, J.; Wang, R.; Tian, Y.; Wang, J.; Zhao, Y. Selection of inspection path optimization scheme based on analytic hierarchy process and inspection experimental study. J. Mech. Sci. Technol. 2023, 37, 355–366. [Google Scholar] [CrossRef]
  49. Wang, L.; Wang, H.; Yang, X.; Gao, Y.; Cui, X.; Wang, B. Research on smooth path planning method based on improved ant colony algorithm optimized by Floyd algorithm. Front. Neurorobotics 2022, 16, 955179. [Google Scholar] [CrossRef]
  50. Zhang, L.; Zhang, Y.; Zeng, M.; Li, Y. Robot navigation based on improved A* algorithm in dynamic environment. Assem. Autom. 2021, 41, 419–430. [Google Scholar] [CrossRef]
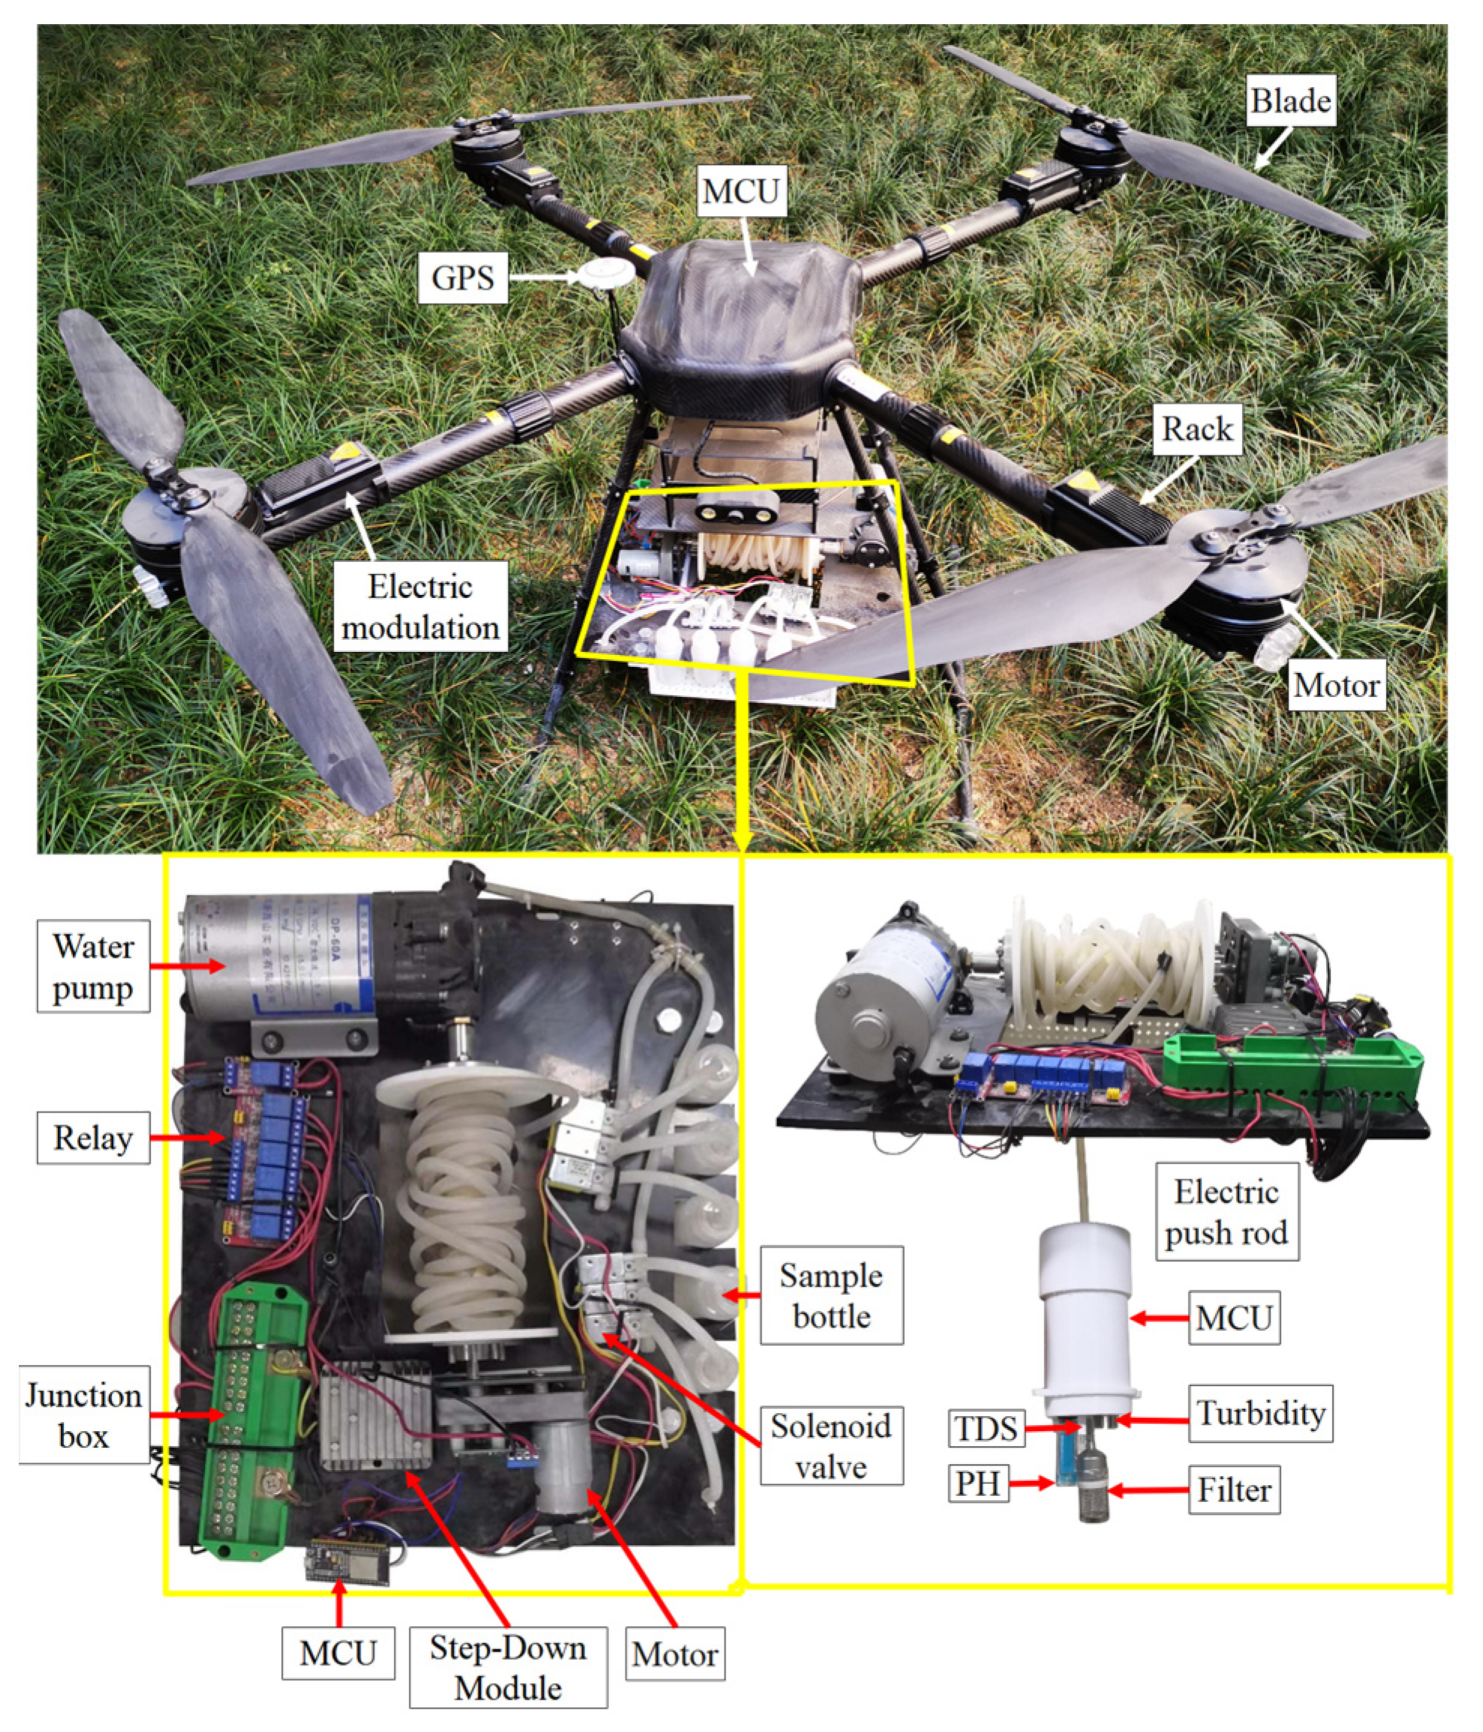
Figure 1. Structure of UAV sampling and detection system.
Water 15 02129 g001
Figure 2. Illustration of the autonomous sampling process of the UAV water quality sampling and monitoring system.
Water 15 02129 g002
Figure 3. The flowchart of the sampling and detection process, where ( x i , y i , z i ) denotes the UAV’s position; ( x i , y i , z i ) ( i = 1 , 2 , , n ) is the waypoint sequence; ( θ , β , φ ) is a set consisting of the pitch, yaw, and roll angles of the UAV; D is the distance between the UAV’s position and the current sampling position; D n is the distance error threshold; ( θ d , β d , φ d ) is the difference between the current and target attitude angles; h c is the current flying altitude; h n is the UAV’s altitude at the sampling point.
Water 15 02129 g003
Figure 4. Layered hybrid PSO algorithm framework.
Water 15 02129 g004
Figure 5. Satellite image of the fish pond used in the experiments.
Water 15 02129 g005
Figure 6. Fish pond simulation environment.
Water 15 02129 g006
Figure 7. Simulation results of UAV path planning: (a) path planning result of the LHIPSO algorithm; (b) the path obtained after using the RRT in path planning; (c) the path after removing redundant points for the previously planned path; (d) the second-order B-spline smoothing path.
Water 15 02129 g007
Figure 8. Simulation experimental data. (a) Curve of the relationship between iteration count and fitness value. (b) Comparison of algorithm parameters.
Water 15 02129 g008
Figure 9. The pond water quality parameters.
Water 15 02129 g009aWater 15 02129 g009b
Table 1. Model and parameters of water quality monitoring components.
Sensor NameComponent ImageTest RangeOperating Voltage (V)/Current (mA)Accuracy
(at 25 °C)
Output Voltage (V)Operating Temperature (°C)
pHWater 15 02129 i0010–145 V/(5–10) mA±1%0–50–60
TurbidityWater 15 02129 i0020–1000 NTU5 V/40 mA±5%0–4.5−20–90
TDSWater 15 02129 i0030–1000 ppm(3.3–5.0) V/(3–6) mA±5%0–2.30–55
Table 2. The water quality parameters in the fish pond.
Water Quality ParametersDepth: 1 mDepth: 2 m
Maximum ValueMinimum ValueMean ValueMaximum ValueMinimum ValueMean Value
TDS (ppm)928284.35888384.35
Turbidity (NTU)84.41634.1610321.358.42
pH8.526.957.728.446.97.485
Nitrite (mg/L)0.0250.0010.0110.080.0010.013
Ammonia Nitrogen (mg/L)1.370.020.370.640.010.31
DO (mg/L)14.423.59.4712.653.877.25
Disclaimer/Publisher’s Note: The statements, opinions and data contained in all publications are solely those of the individual author(s) and contributor(s) and not of MDPI and/or the editor(s). MDPI and/or the editor(s) disclaim responsibility for any injury to people or property resulting from any ideas, methods, instructions or products referred to in the content.