Article

Control of Loose Deposits in a Simulated Drinking Water Distribution System Using Ultrafiltration

1
Key Laboratory of Yangtze River Water Environment, Ministry of Education, Tongji University, Shanghai 200092, China
2
Shanghai National Engineering Research Center of Urban Water Resources Co., Ltd., Shanghai 200092, China
*
Author to whom correspondence should be addressed.
Water 2023, 15(12), 2210; https://doi.org/10.3390/w15122210
Submission received: 19 April 2023 / Revised: 25 May 2023 / Accepted: 9 June 2023 / Published: 12 June 2023

Abstract

:
Loose deposits on water supply pipe walls easily fall off and may affect the safety of the drinking water supply, and the control of them has been a hot research issue in recent years. In this research, we used two simulated pipeline test reactors to systematically study the formation and shedding pattern of loose sediment on the pipeline, analyze its characteristics, and explore the control role of the ultrafiltration process on loose sediment in the water supply pipeline network. The results showed that the loose deposits adhered to the pipe reactor fed by filtered water formed slower than did that fed by unfiltered water, the maximum accumulation of the loose deposits was reduced from 2.17 to 1.46 g/m2. The reactor after ultrafiltration showed a reduction of more than 40% in the concentration of substances other than Ca and Si. Copper and zinc were reduced by more than 80%, while the iron content was reduced by 91.2%. When the shear force of the pipe wall of the water pipeline is less than 0.33 Pa, there are loose deposits formed on the pipe wall; when the shear force of the pipe wall of the water pipeline is greater than 0.94 Pa, it was found that the loose deposits on the pipe wall were shed more completely. Ultrafiltration removes most of the suspended living bacteria, but it is not effective in removing dissolved organic matter from the water, resulting in high peak levels of bacteria on the walls and in the effluent. The maximum bacterial content of the reactor effluent after ultrafiltration was 1.6 × 10⁴ CFU/cm2 after 22 d. It is therefore necessary to consider the use of the ultrafiltration process in conjunction with other processes to achieve the ultimate goal of controlling microbial contamination in the pipeline network.

1. Introduction

The research of secondary pollution and prevention technology of the water supply network to protect the water quality and improve the safety of water supply has become an important issue of urban water supply. How to ensure the water quality of tap water in the water supply network in the process of transmission is an urgent research topic in the field of water treatment engineering in China.
The drinking water distribution system is a large tubular reactor, in which complex physical, chemical and biological reactions occur. The detachment of biofilms and corrosives from water supply pipe walls produces problems, such as turbidity, color, taste, odor, and microbial contamination. These problems have been systematically studied [1,2]. The texture of the biofilm and pipe scale is relatively dense; therefore, these components are firmly attached to the pipe wall and are resistant to falling off. However, an unconsolidated layer of loose deposits occurs outside the biofilm and pipe scale and directly contacts with the water. These loose deposits adversely affect water quality, are hard to control, and have drawn much attention in recent years [3,4,5,6,7].
Loose deposits have a porous structure, which is easily washed away. From a dynamic hydraulic model and a pilot study, Friedman et al. found that a flow velocity of 1.5 m/s is enough to remove biofilms, corrosion products and other debris attached to the pipe walls; for loose deposits, however, a velocity of only 0.5–0.8 m/s is sufficient to remove loose deposits [8,9]. Additionally, lower velocities (higher than 0.02 m/s) have been noted to be effective in resuspending loose deposits [10].
Loose deposits are primarily and typically composed of volatile solids (up to 65% dry weight) and iron oxides (up to 70% dry weight) [11,12]. Annie et al. sampled four water supply systems in different cities in Canada and found that the principal components of loose deposits were iron corrosion products (38–72%), organics (14–24%) and silicates/aluminates (7–16%). The composition of different loose deposits in different pipeworks display substantial differences, which are related to the water source, front-end processing, pipe material, pH, water hardness, residual chlorine content and other factors [13,14,15].
Loose deposits can provide habitats for microbes and become key sites for microbial growth. Heterotrophic plate counts are high in loose deposits (up to 5.8 × 10⁸ CFU/g of dry matter) [16,17]. Liu et al. defined and described the phases in drinking water distribution systems as bulk water, pipe wall biofilm, suspended solids and loose deposits; the biofilm and loose deposit bacteria account for over 98% of the total number of bacteria. Depending on the amount of loose deposits, the contribution of bacteria from deposits may be 7-fold higher than the pipe wall biofilm [9]. In addition to actinomycetes and fungi, some pathogenic bacteria, such as coliforms and mycobacteria, were found in the loose deposits [18,19].
The influence of loose deposits on the water quality of the pipe network is very significant, and the research on loose deposits on the wall of water pipes at home and abroad still lacks systematization. We believe that the following three problems exist and need to be further studied: first, the lack of systematic research on the formation rules and mechanisms of loose sediments on the pipe wall, and the correlation between different water quality parameters and the formation of loose sediments has not been established; second, the structural characteristics of loose sediments and the impact of their leaching on water quality and other key issues need to be further clarified; third, the control methods of loose sediments on the pipe wall are not mature and no effective solutions are proposed [20].
Therefore, it is very necessary to carry out the study of loose sediments in pipe walls and propose corresponding control methods to solve the water quality problems caused by loose sediments in urban water supply networks.
Flushing or mechanical cleaning is a useful method to remove loose deposits from pipe walls [11]. Annie et al. defined loose deposits as the particulate matter that can be easily dislodged from the pipes when the flow velocity increases [13]. Liu et al. defined loose deposits as the particulate matter accumulated/settled on the bottom of the pipe [9]. The definitions agree that loose deposits are primarily composed of particles and that they easily fall off when flushed.
However, the energy consumption of these methods is high, and the process requires the water supply to be turned off, which can affect daily life [21]. Studies have shown that viable microbial numbers in new deposits were almost as high as in the old deposits after one year [19]. Therefore, the effectiveness of these cleaning methods is limited.
Increasing the chlorine dose is a method to reduce microbial populations, but the chlorine demand of the deposits is higher than that of the biofilm and can reach 1.8 mg Cl2 L–1 within 24 h [16]. Particulate matter and organics in the loose deposits protect the microbes. Therefore, chlorine disinfection displays minimal effect on the microbial numbers in soft deposits.
Membrane processes for drinking water were studied as early as 1985 in Europe. Currently, ultrafiltration has become a widely used water treatment technology. Ultrafiltration can effectively intercept particles in treated water and decrease the amount of particles in pipeworks [22]. In the International Water Association (IWA) third “cutting-edge technology” international conference, membrane technology was identified as the core technology of the future of drinking water treatment, known as the “third generation of drinking water treatment technology”.
At present, there are few systematic studies on the impact of an ultrafiltration process on water quality, on the amount and composition of sediment generation, on the content of various elements and the amount of particulate matter in water after sediment shedding, and on the growth of bacteria in sediment, and there is a lack of research on the comprehensive consideration of an ultrafiltration process on the control of loose sediment in water supply pipe walls [23]. This research uses reactors to simulate pipework for drinking water to investigate whether ultrafiltration is effective in controlling the generation of loose deposits.

2. Materials and Methods

2.1. Characteristics of the Tap Water

The water used in the experiments was tap water from Tongji University. This tap water satisfied the requirements of the national standard for drinking water quality. The basic water quality parameters in the experiments are listed in Table 1.

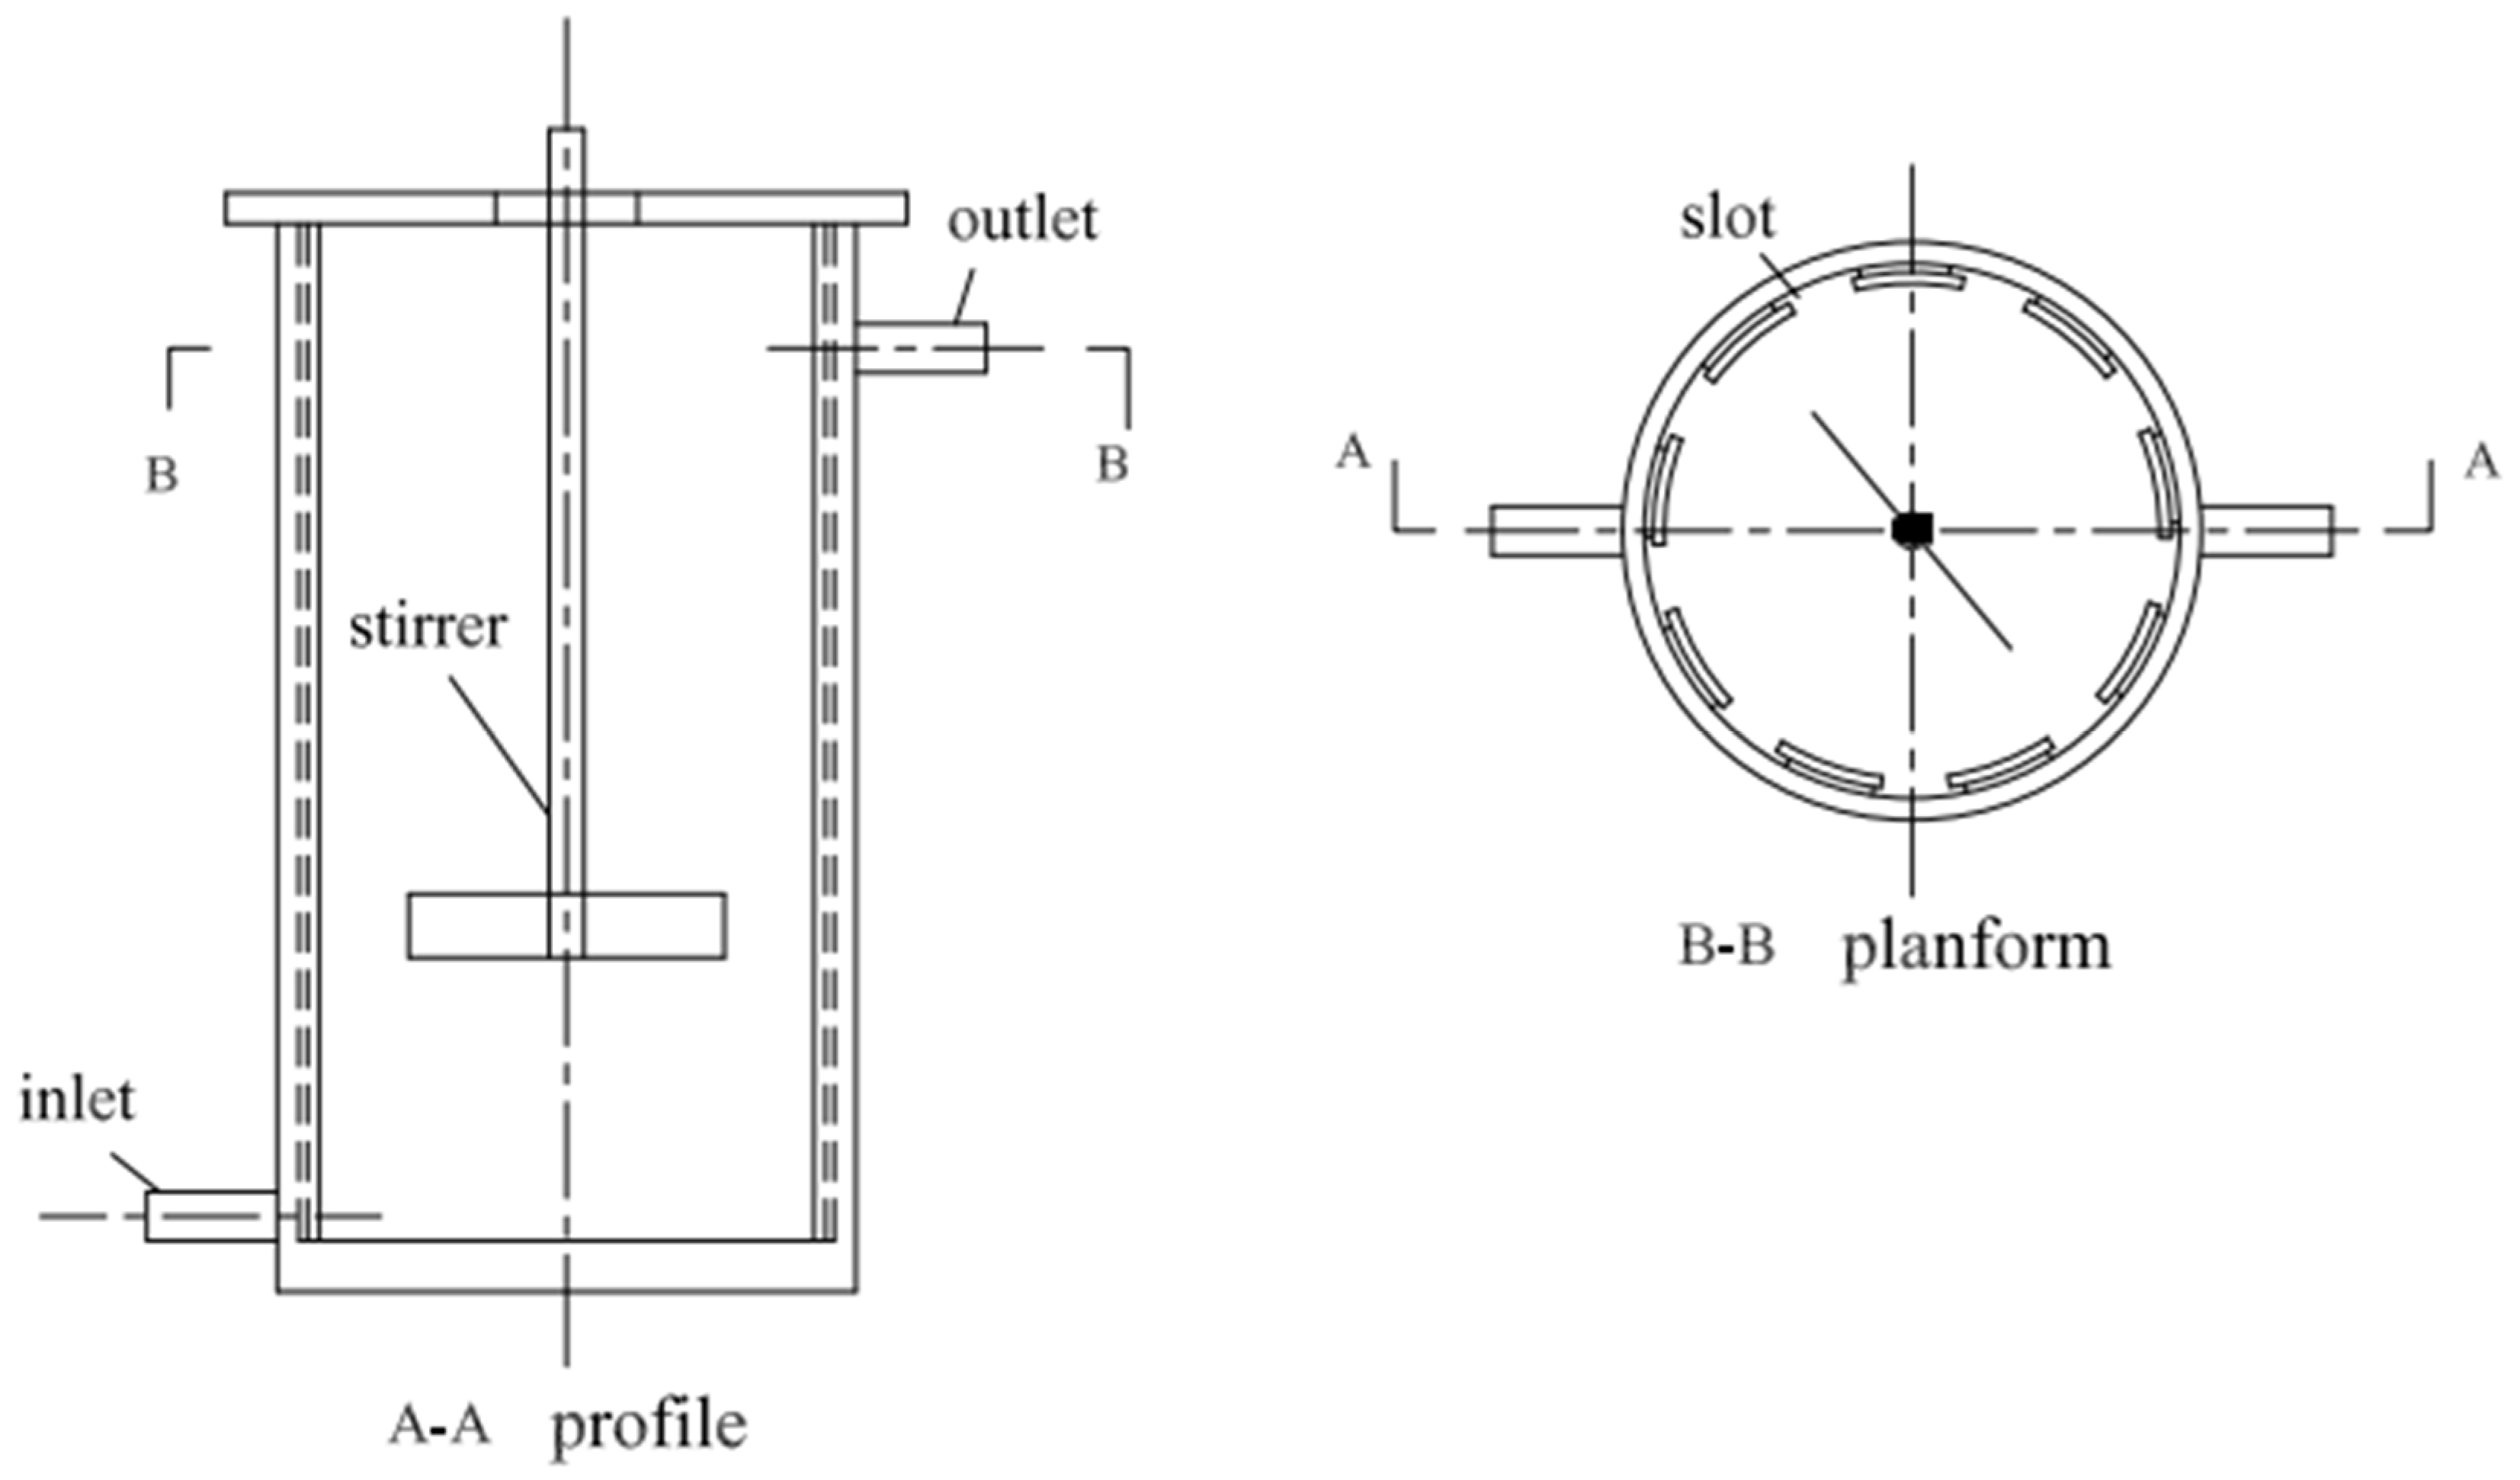
2.2. Reactor Design and Operation

The experiments were performed in two simulated pipe reactors. The schematic diagram of the cylindrical reactor is shown in Figure 1. Removable slides were vertically installed in annularly distributed slots on the inner surface of the reactor. Water was rotated under the action of stirrer motor (D2010W, Sile Instruments Corporation of Shanghai, China), thus forming a shear stress between the water and inner wall of the reactor. The magnitude of the shear stress can be controlled by setting the rotation speed of the motorized stirrer. This system simulates the hydraulic conditions of an actual water pipe. Stirring with the shaft stirrer drives the water flow rotation, the water flow and the reaction wall around the shear stress formed between the inserts; when the same as the actual shear stress in the pipeline, we believe that the simulation of the actual shear force in the pipeline [24]. The reactors and slides are composed of polyvinyl chloride (PVC). The reactor has an inner diameter of 9.4 cm, a water storage depth of 17 cm and a working volume of 1.2 L. The raw water is pumped into the reactor through an inlet at the bottom and then overflows through an outlet. The stirring blade is composed of stainless steel and has a diameter of 6 cm and a height of 1.2 cm.
The shear stress of the actual pipe wall can be calculated using Equation (1):
τ = d ρ g i 4
where τ represents the shear stress (N/m2); d is the pipe diameter (m); ρ is the fluid density (kg/m3); i is the hydraulic slope (dimensionless) related to the pipe material, pipe diameter and water velocity; and i can be calculated using the formula established by A. Hazen and G.S. Williams.
According to Newton’s laws of internal friction and the Camp and Stein Formula,
τ = μ P V
where μ represents the dynamic viscosity of the water (Pa·s); P is the power consumed by the water in the reactor (W); and V is the volume of the reactor.
From Equation (2), the shear stress, τ, can be controlled by setting the power of the reactor. The power of the agitator is calculated using Equation (3):
P = N P ρ N 3 d 5
where Np represents the agitation power coefficient and can be calculated using the agitation power formula [25]; ρ is the fluid density (kg/m3); N is the rotation speed (r/s); and d is the diameter of the stirring blade (m).
Combining Equations (2) and (3), the correspondence between the rotation speed and the inner-wall shear stress for a specific experimental condition can be determined. The correspondences between the rotation speed and flow velocity in an actual pipeline can also then be determined (using a water temperature of 20 °C and an actual pipe made of plastic, for the calculation).
The experiments were performed in two identical reactors. Ultrafiltrated tap water was pumped into the research reactor, and tap water without ultrafiltration was pumped into the control reactor. The inflow of these two reactors was controlled by an identical peristaltic multichannel pump (BT100-1L, Hubei Lange Company of China, Xiaogan City, China), with a 6 mL/min flow rate and a hydraulic retention time at the reactor of 200 min. The ultrafiltration membrane module was bundled with a hollow fiber membrane composed of PVC and provided by Hainan Lisheng Company (Haikou City, China). The membrane pore size was 0.01 μm, and the filtering area was 0.1 m2. Figure 2 displays a diagram of the experimental setup. The rotation speed is adjusted according to the actual required shear force, and the adjustment size is based on Table 2. Samples are taken every half day, 1 mL at a time for suspensions, and loose deposits on the slide are scraped using cotton swabs.

2.3. Analysis Method

The mass of the loose deposit was analyzed by the weight of the slides. Slides were removed, placed into an electric heating drier at 60 °C for 1 h, and then cooled to a constant temperature and humidity. Loose deposits were carefully wiped from the slides and then weighed using a piece of clean and dry quantitative filter paper.
Suspended bacteria were counted using R2A agar plates for HPCs. The incubations were performed at 25 °C for 7 d [26].
The HPC represents the total number of heterotrophic bacteria. The number of HPCs as suspended bacterium was then measured in the loose deposits. The HPC on the slide was counted using the following method. First, 2~3 cotton swabs were sterilized and then used to wipe the inner wall of the slides 5~6 times from top to bottom. We consider the material scraped from the inside of the slide as the loose deposits. The swabs were placed into a test tube with 10 mL of sterilized normal saline, and the test tube was placed in an ultrasonic cleaning machine (the power was 250 W) for 25 min. Finally, the results were converted into CFU/cm2.
The loose deposit solution was obtained by placing the slide into a dry and clean 50 mL colorimetric tube, and a certain amount of pure water was then added to submerge the slide. The colorimetric tube was then placed in an ultrasonic cleaning machine (the power was 250 W) for 25 min. Al, As, Ca, Cr, Cu, Fe, Mn, Pb and Zn were measured using inductively coupled plasma mass spectrometry (Agilent ICP-MS7700); Si was measured using inductively coupled plasma atomic emission spectrometry (ICP-Agilent 720ES).
The turbidity was measured using a portable turbidimeter (HACH2100Q). The TOC was measured using a TOC-L CPH total organic carbon analyzer (SHIMADZU Corporation). The particle count and particle size distribution were measured by a laser particle analyzer (IBR Versa Count Particle analyzer GR-1000A).

3. Results

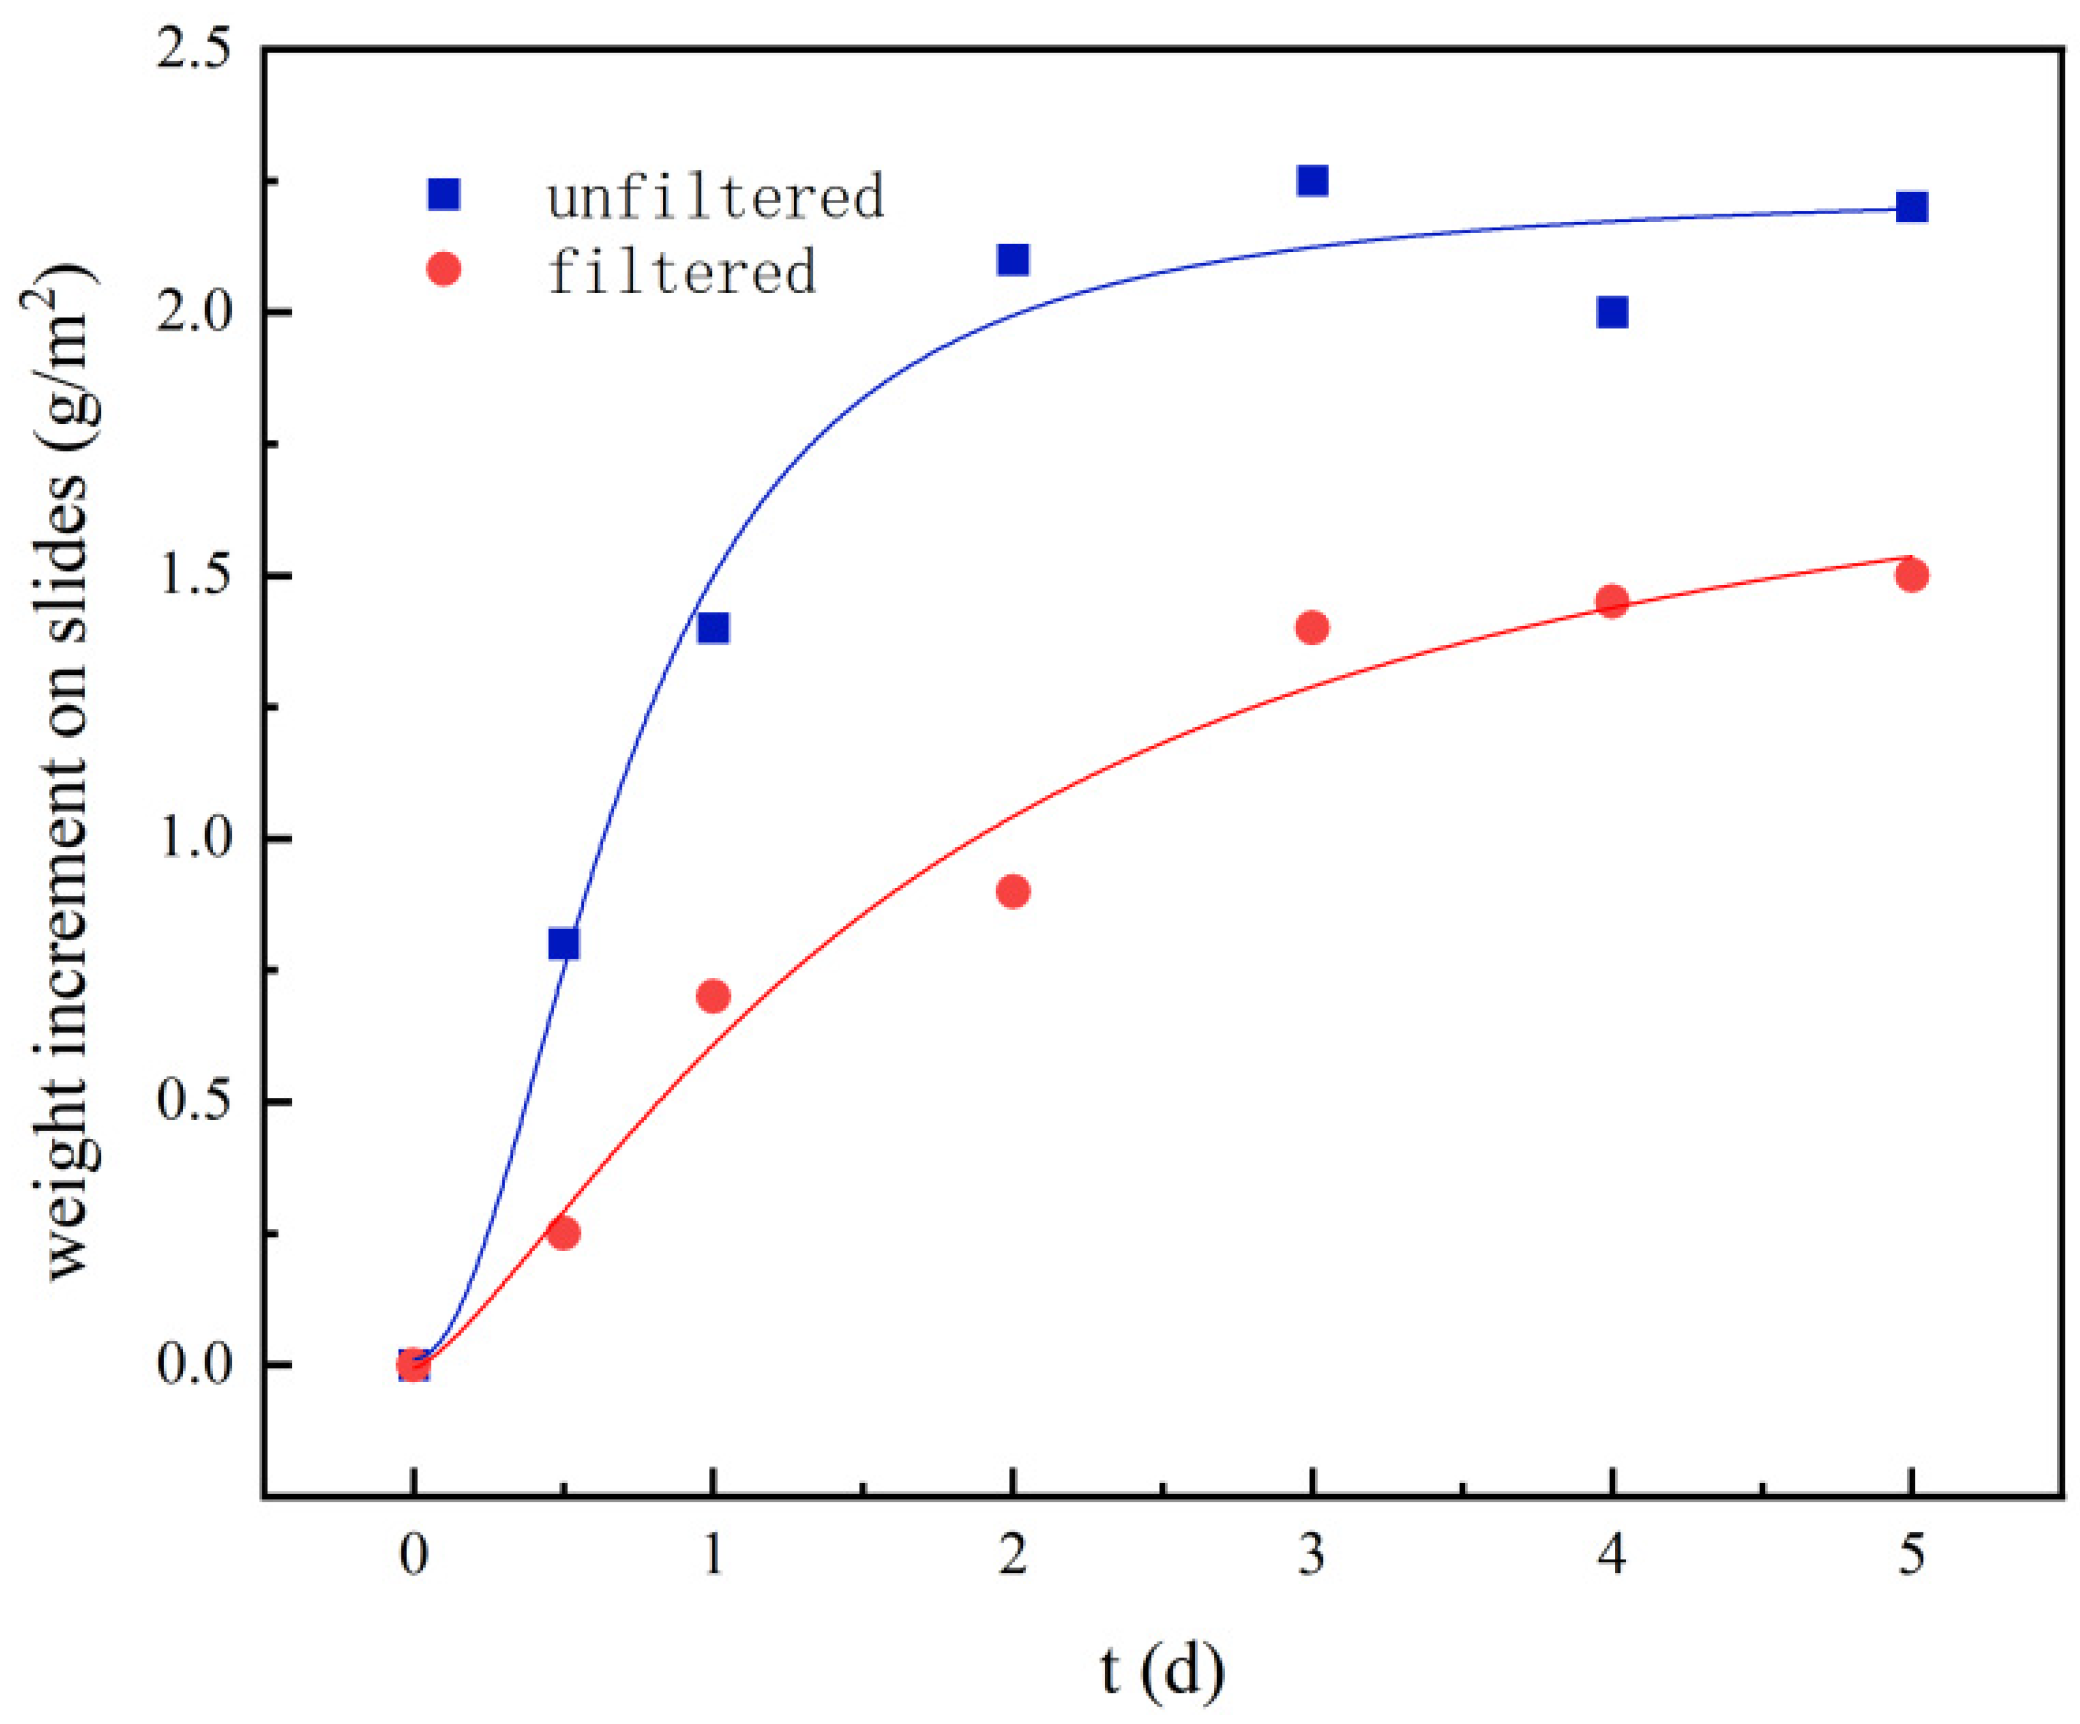
3.1. Effect of the Ultrafiltration on the Accumulation of Loose Deposits

The rotation speed of the motor stirrers was set to 0 to ensure that the shear stress on the inner wall of the reactors was at a minimum. The accumulated weights of the loose deposits on the slides for the two conditions are shown in Figure 3. The mass growth of the deposits in the two reactors both displayed an initially rapid and then slowing trend. The accumulation on the slides in the control reactor plateaued after 2~3 d; the maximum mass was approximately 2.17 g/m2. The accumulation on the slides in the research reactor plateaued after 3~4 d, and the maximum mass was approximately 1.46 g/m2. When comparing these curves, the filtered water displayed a smaller accumulation velocity and mass in the reactor than did the unfiltered water.

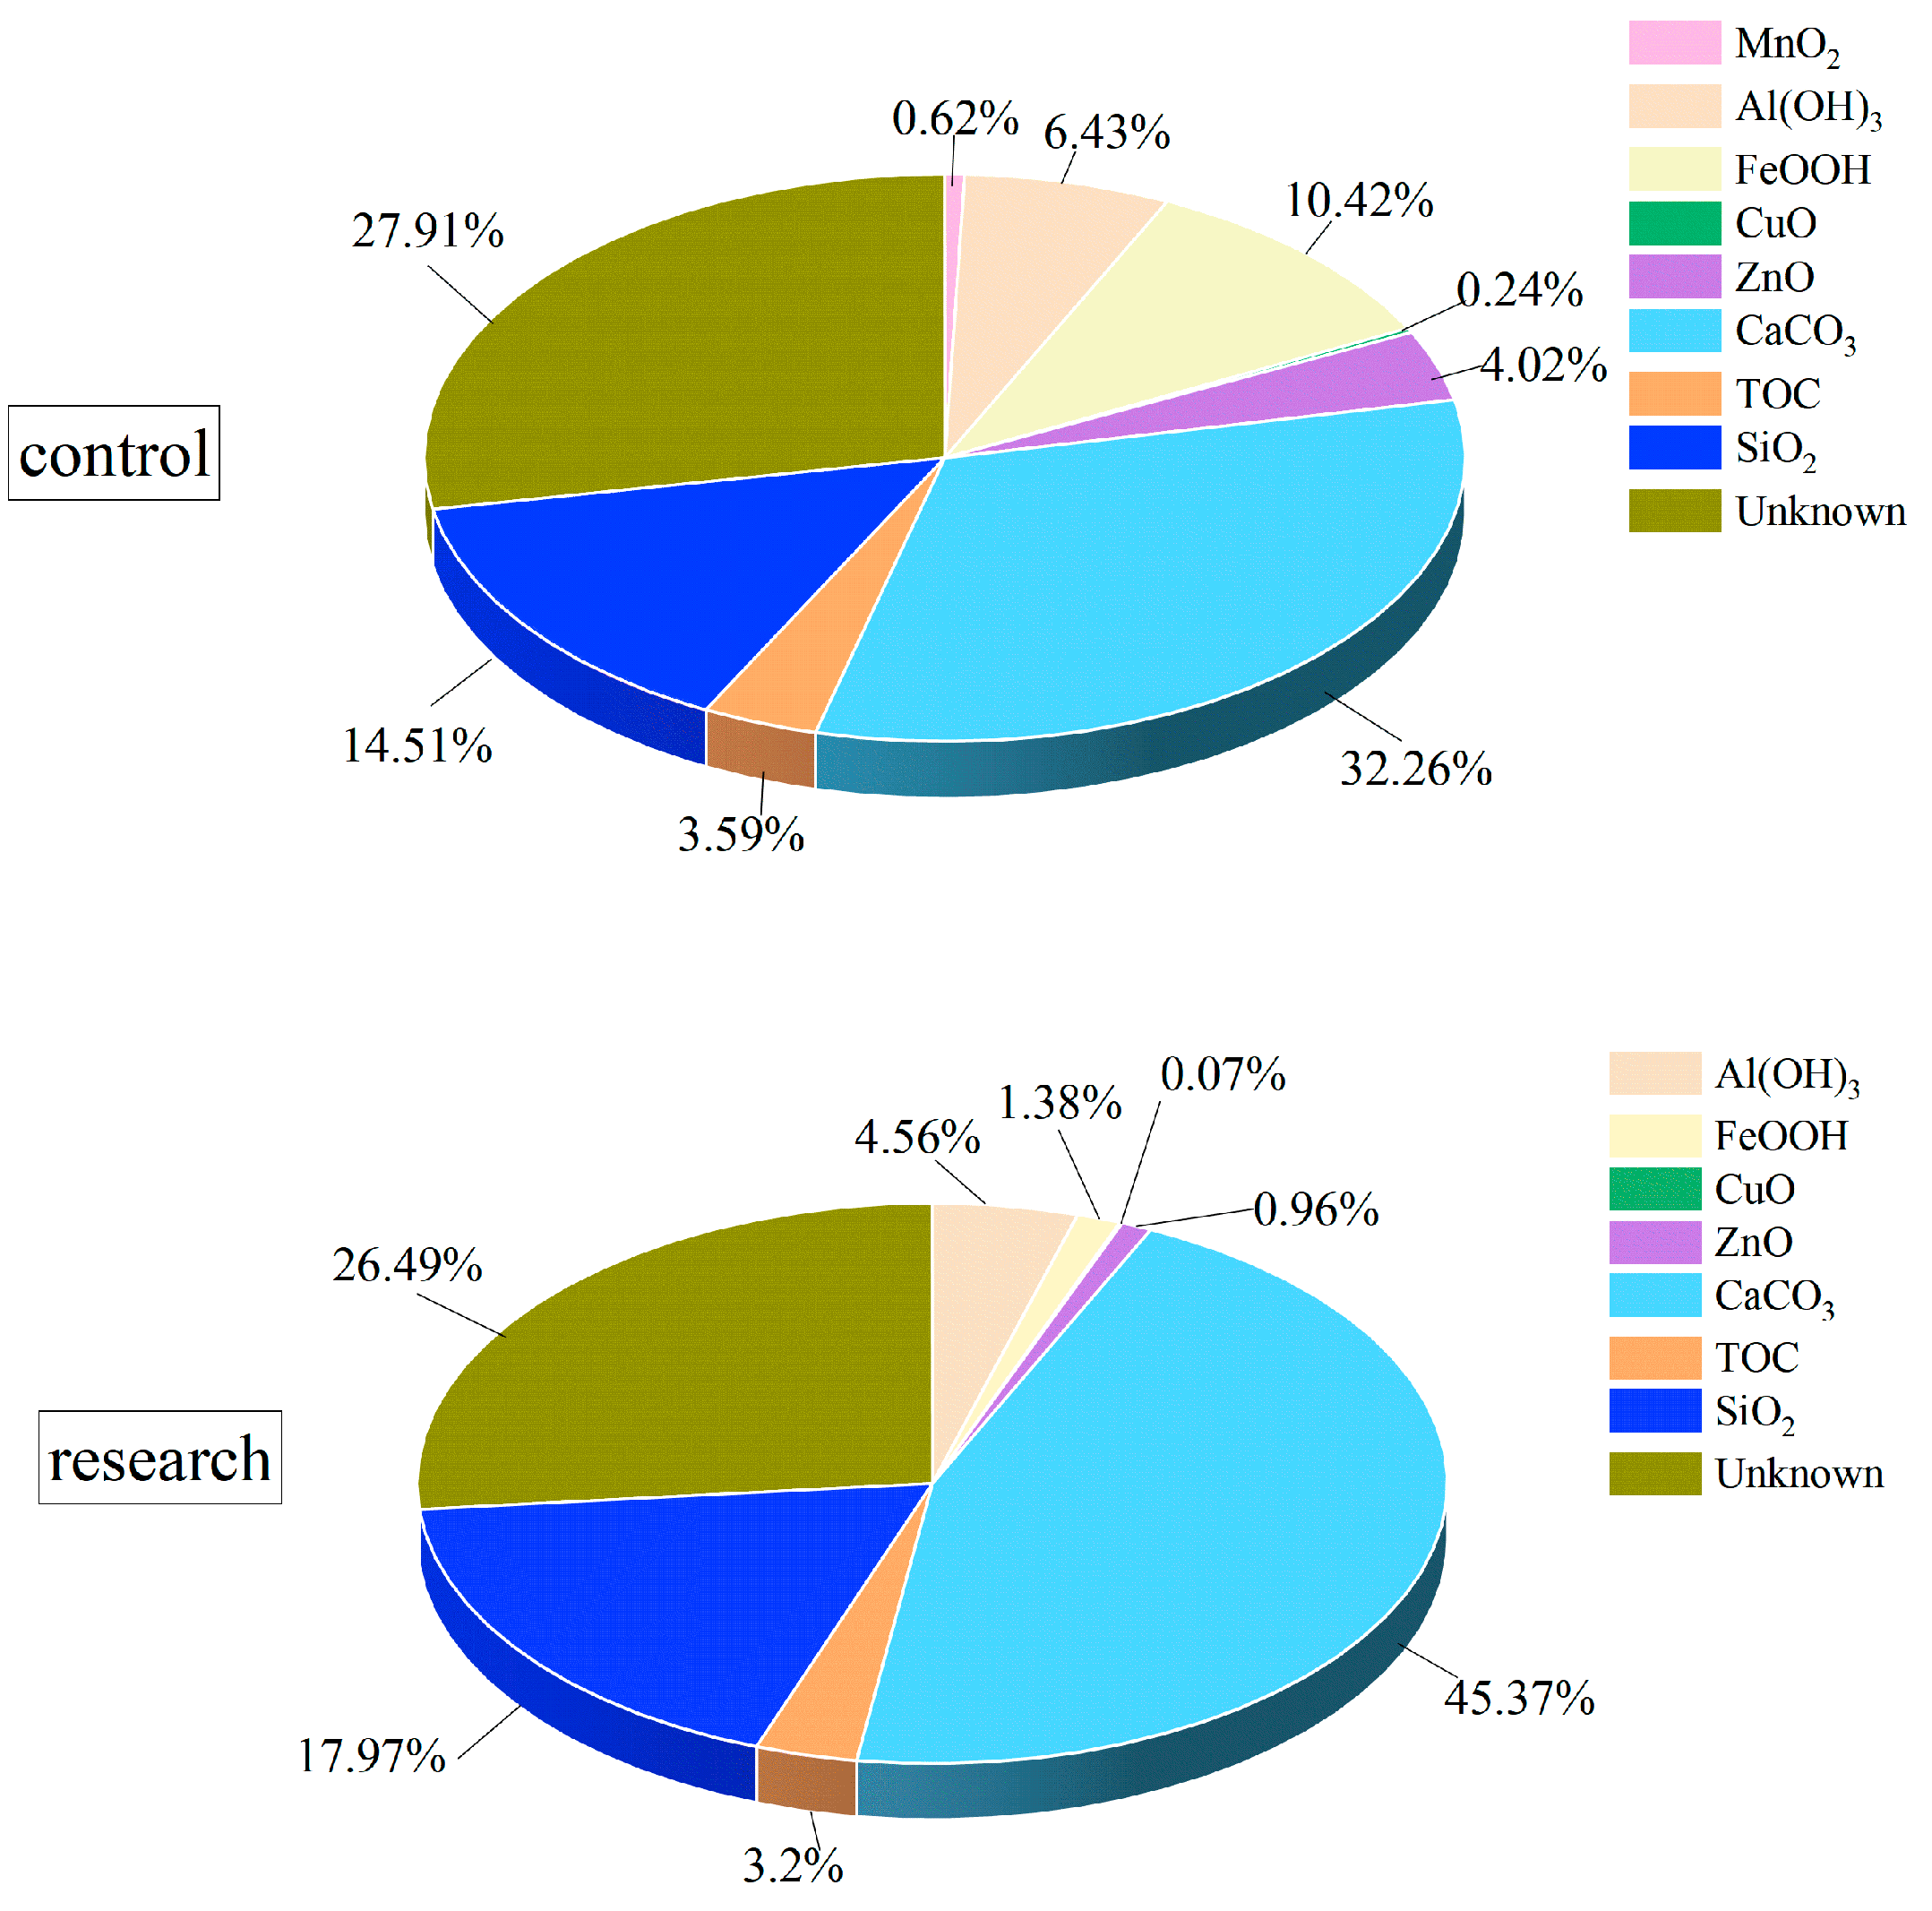
3.2. Composition of Loose Deposits for the Filtered and Unfiltered Conditions

The reactors were operated at a zero-shear-stress condition to allow the loose deposits on the inner walls to grow to saturation. The loose deposits were then sampled and converted into solutions for the TOC and element analysis. The mass of the elements was computed assuming their oxidized forms. The TOC of two types of loose deposits were determined, as shown in Figure 4. When comparing these pie charts, the two deposits have identical major components: CaCO3, SiO2 and TOC. In the control reactor, Mn, Al, Fe, Cu and Zn occupy greater proportions (21.7%) of the loose deposit than in the research reactor (7.0%). Organics in the loose deposits are relatively scarce, because the organic content in the inflows is low. Simultaneously, microbes in the loose deposits break down and use a portion of the organics. The unknown portion of the loose deposits consists of other untested elements, the inevitable wastage during sampling and analysis, and the error and bias in the conversion and calculation.
The absolute contents of the components and a comparison of the two loose deposits are listed in Table 3. Absolute content values are measured in the experimental group compared to those measured in the control group. The magnitude of the reduction of the substance is 1 minus the absolute content. The absolute content of various components of deposit in the research reactor is lower than that in the control reactor. Except for Ca and Si, the reductions in the substance concentrations exceed 40%. The reductions in the Cu and Zn content are above 80%, and the reduction in the Fe content reaches 91.2%. These reductions result from the fact that the reactors are composed of PVC, which does not release any of these elements or components. Ultrafiltration directly reduced the amount of substances that entered the reactors and therefore reduced the accumulations in the loose deposits.

3.3. Effect of the Loose Deposits on the Water Quality with and without Ultrafiltration

Ultrafiltration can remove a portion of the impurities from the water, thereby reducing the generation of loose deposits at the source. The water qualities of the filtered and unfiltered tap water are shown in Table 4. The suspended solids, such as the turbidity and bacteria, various metals and organics in the water were all reduced to a different extent after ultrafiltration, which demonstrates the ability of ultrafiltration to improve the water quality. Because the drinking water pipe network is a relatively closed system, the pipe scale, biofilm and loose deposits on the inner wall originate from the water passing through the pipelines (when the pipelines are clean and undamaged). Loose deposits are primarily developed by the gathering of particles in the water. Therefore, ultrafiltration can control the formation of loose deposits on the inner pipe wall.
After setting the rotating speed of the motor stirrer, the shear stress on the inner wall of the reactors was 0.092 Pa, 0.33 Pa and 0.70 Pa for water flows of 0.2, 0.4 and 0.6 m/s, respectively, in a 400 mm plastic pipe (Table 2). These three velocities are low compared with an average economic flow velocity of 0.6~0.9 m/s. At the end of the drinking water distribution network, the water consumption differs substantially at different times of the day. Therefore, the majority of the time, the flow velocity remains at a low level, even for long periods of time. Thus, these velocities are more representative of the actual situation.
According to Table 5, the concentration of every element in the effluents of the two reactors displays an upward trend, with increases in the shear stress on the inner wall of the reactors. For both reactors, the concentration of the elements conformed to the relationship: 0.70 Pa effluent > 0.33 Pa effluent > 0.092 Pa effluent > 0 Pa effluent. Therefore, higher stresses result in higher concentrations. This characteristic shows that the loose deposits are easily washed away. For all hydraulic conditions, the concentration of each element in the effluent from the research reactor was lower than that from the control reactor. Therefore, ultrafiltration can restrict the growth of loose deposits and the accumulation of various elements.

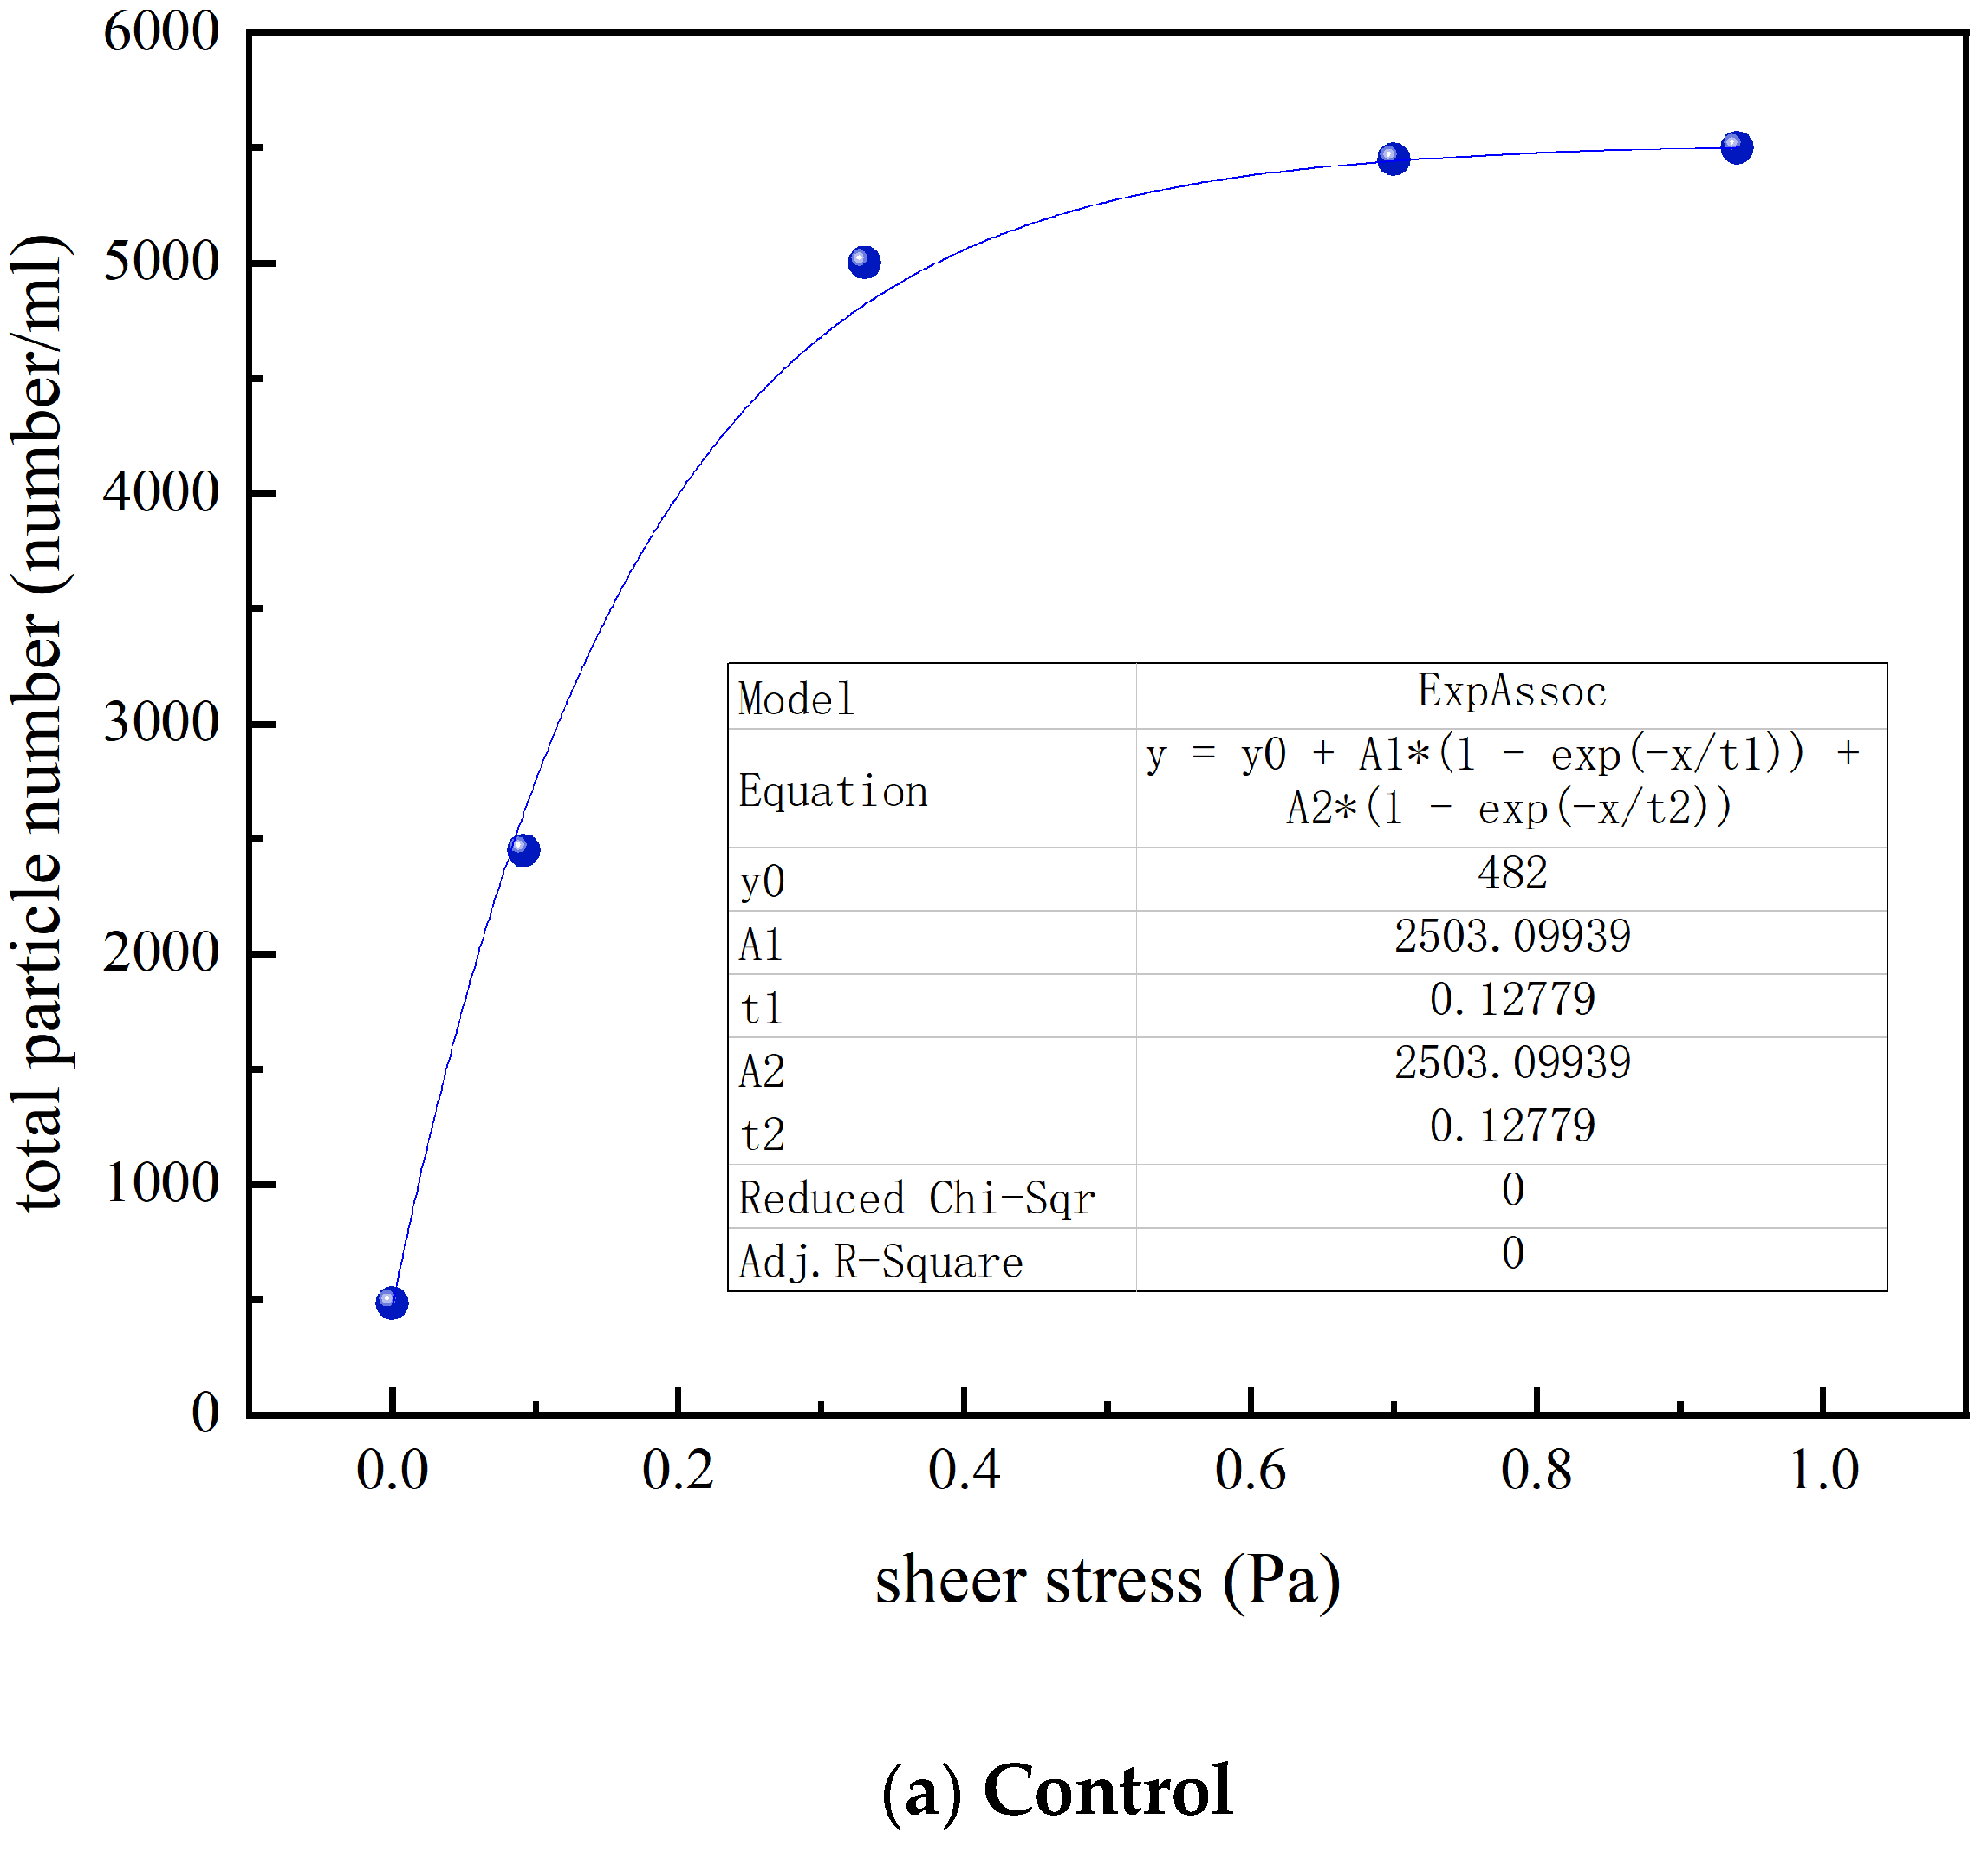
3.4. Effect of UF on the Particle Count and Size Distribution

The effluents of two reactors experiencing different hydraulic conditions (shear stresses of 0, 0.092, 0.33, 0.70 and 0.94 Pa) were sampled, and the particle counts were analyzed. A shear stress of 0.94 Pa is equivalent to a water velocity of 0.7 m/s in a 400 mm plastic pipe. The relationship between the shear stress and the total number of particles in the effluent was fitted using the ExpAssoc exponential function, as shown in Figure 5. The two curves display similar shapes. When the shear stress increased, the total number of particles in the effluent also increased. This trend is first rapid and then slows, leveling after the shear stress reaches 0.50 Pa. At 0.50 Pa, the loose deposits completely fall off. The two curve intervals range differently: the total number of particles in the effluent from the control reactor can surpass 5000, whereas the total number of particles in the effluent from the research reactor can surpass 450, which represents a nearly 10-fold difference.
Effluents from the two reactors for different hydraulic conditions were sampled, and the particle size distribution was analyzed. The results are shown in Figure 6. The heights of the columns represent the number of particles in each range.
When comparing the following figures, the particle number in every range of the research reactor is smaller than that of the control reactor, regardless of the influent or effluent. In both cases, more particles appear in the effluent than in the inflow. Higher shear stresses cause more particles to appear. When the shear stress increased from 0 to 0.33 Pa, the particle counts increased significantly. When the shear stress increased from 0.33 to 0.94 Pa, the particle counts were maintained at approximately an identical level, which represents the complete exfoliation of loose deposits under higher shear stresses. The particles in the influents were primarily smaller than 10 μm, but those in the effluents generally had a size between 10 and 15 μm. Effluents with a shear stress of 0.092 Pa primarily contained particles larger than 15 μm, higher than in the effluents, with a shear stress of 0.33 and 0.94 Pa.

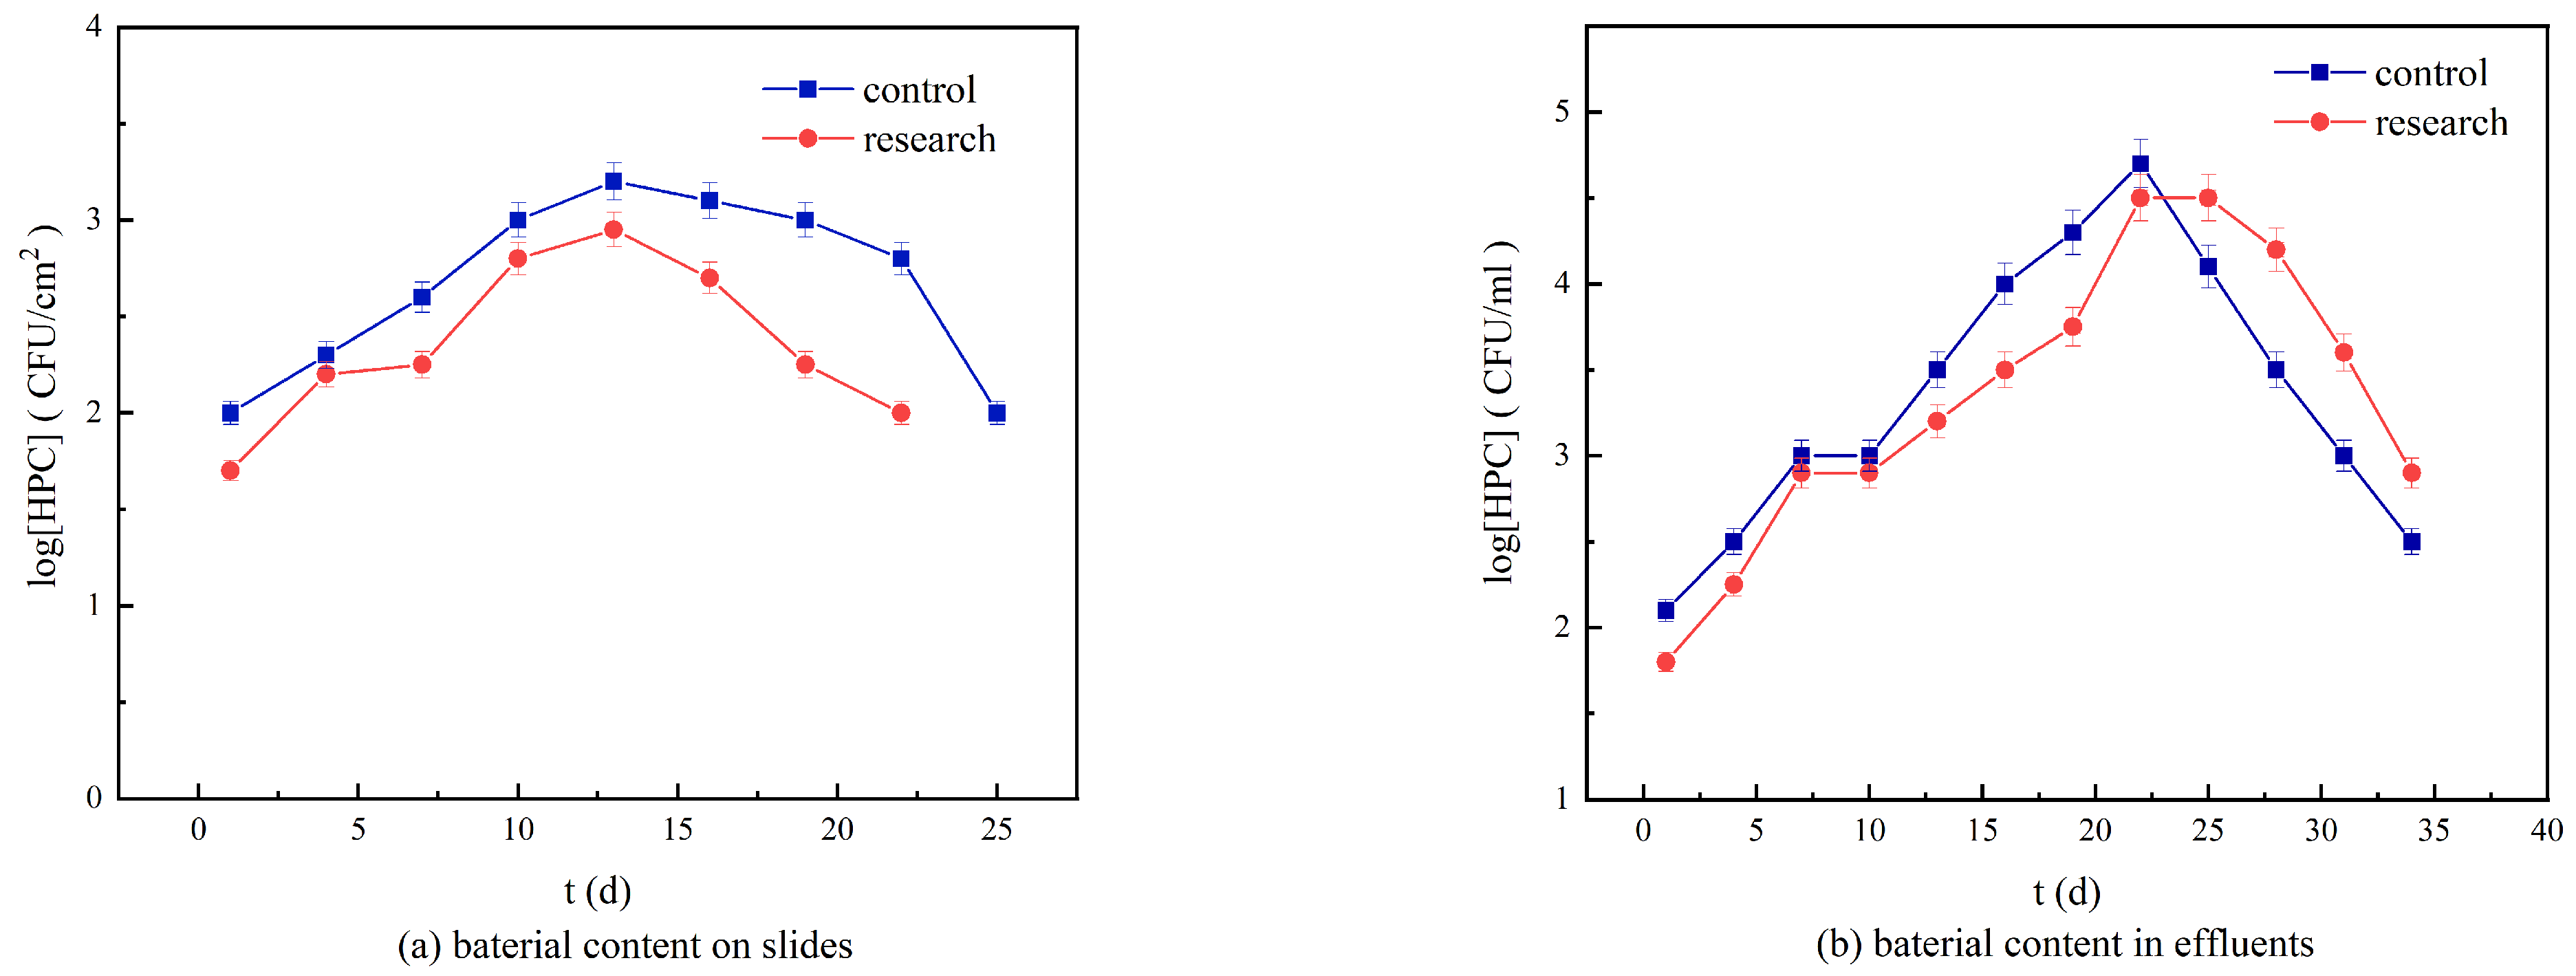
3.5. Bacterial Content in the Loose Deposits

The reactors were sterilized and operated under a zero-shear-stress condition to allow the loose deposits on the inner walls to grow to saturation. The loose deposits on the slides and in the effluents from the two reactors were sampled, and the HPC was measured at regular intervals. From Figure 7, the bacterial contents in the effluents and on the slides in both cases increase in the beginning and decrease at the end. Tap water carries microbes into the sterilized reactors, and a portion of the microbes then adhere to the inner wall of the reactors and multiply using the DOC in the water. The loose deposits provide a good habitat for bacteria. A positive correlation is noted between the suspended bacterial content in the water and the adherent bacterial content on the inner wall, with a growth curve hysteresis of approximately 10 d. This relationship is noted because the reactor is relatively small and the influent quality is steady. Therefore, the bacteria falling off the inner wall become the main source of suspended bacteria in the water. A decrease in the bacterial content in the late period in the experiments is related to the oligotrophic environment in the reactors.
The bacterial content on the inner wall of the reactors reached a maximum after approximately 13 d, with 1.3 × 10³ CFU/cm2 in the control reactor and 6.3 × 10² CFU/cm2 in the research reactor. The bacterial content on the inner wall of the control reactor was 0.5 orders of magnitude higher than that of the research reactor throughout the experiment; the content declined after the peak at approximately 13 d. The bacterial content on the inner wall of the research reactor also declined after a similar peak.
The bacterial content in the effluents of the reactors displayed a maximum after approximately 22 d, with 3.2 × 10⁴ CFU/cm2 in the control reactor and 1.6 × 10⁴ CFU/cm2 in the research reactor. The bacterial content in the effluent of the control reactor was 0.1~0.5 orders of magnitude higher than that of the research reactor during the early and middle phases of the experiment, but the content decreased rapidly after the peak at approximately 22 d. The final content in the control reactor was 0.2~0.5 orders of magnitude less than that of the research reactor during the late phase in the experiment. The bacterial content in the effluent of the research reactor displayed a maximum value at approximately 22~25 d and then decreased rapidly.

4. Discussion

When considering the water quality, the accumulation of loose deposits and the absolute contents of various components, ultrafiltration removes particles from the water and controls the loose deposits. The decrease in loose deposits is shown not only in a decreased total mass but also in other quality indices, such as the metal and organics concentrations. Vreebrug et al. displayed analogous results during a comparative study on two similar independent municipal pipe networks: one supplied effluent from waterworks with ultrafiltration, and the other supplied effluent from waterworks with a conventional process [27]. The risk of discoloration refers to water color problems caused by metal ions in the water. Ultrafiltration can remove many metal ions and particles. Therefore, this previous study indicated that the discoloration risk was regenerated within 1.5 years in the area supplied with conventional drinking water, whereas in the area supplied with ultrafiltrated water, the discoloration risk required 10~15 years [27].
According to the results of the particle count and particle size distribution analysis, the particles in the inflows are almost always smaller than 10 μm, regardless of filtration. However, the effluents contain particles larger than 10 μm, which indicates that during the water delivery process, small particles form larger particles through adhesion, adsorption and abscission. This finding is similar to the results of previous studies. Sly et al. found that water contained fewer particles initially after treatment but that with increases in the pipeline distance, the turbidity and particle size in the water continually increased; particles larger than 3 μm were in the concentration range of 293~1116 per mL [28].
Effluents from the 0.092 Pa shear stress flow contain primarily large particles exceeding 15 μm. These large particles may result because they lack stability and require turbulence to form. Therefore, these particles only exist in slight hydraulic disturbances. When the shear stress increases, they break into small particles.
In this study, the bacterial content in the effluent and on the inner wall of the research reactor remained at a high level (exceeding the national standard of 100 CFU/mL), although this level is lower than that of the control reactor. Therefore, ultrafiltration cannot effectively control for microbes in the loose deposits. Zacheus et al. sampled and studied 16 water supply network systems in eight towns in Finland and reported that loose deposits on the pipe wall provided a habitat for microbes. The microbial population in the loose deposits was hundreds and even thousands of times larger than that in water. This population included heterotrophic bacteria, actinomycetes, fungi and Escherichia coli [19]. Vreeburg et al. analyzed deposit samples gathered from real pipe networks and reported that those deposits in particle-free supplied areas using ultrafiltration contained more organics [27]. These organics originate from the DOC in the water. Therefore, ultrafiltration does not effectively remove the dissolved organic matter from the water, and these organics enable microbes to grow in loose deposits.

5. Conclusions

The accumulation velocity and mass of the loose deposits in the reactor with ultrafiltration are smaller than for the water without ultrafiltration. With a lag of about 1–2 days, its mass was also much lower than that without ultrafiltration. The impurities in the tap water are lower after ultrafiltration, and the contents of various components in the loose deposits also decrease. The concentration of most substances is reduced by more than 40%, while the removal of copper, zinc and iron ions is up to more than 80%.
Ultrafiltration is effective in removing particulate matter from water, thereby reducing the amount of loose sediment produced. The reduction can be reflected not only in the total mass of loose sediment, but also in other individual indicators, such as inorganic metal elements, organic matter, etc.
Ultrafiltration can remove most of the suspended living bacteria but still cannot remove the DOC from the water effectively. Therefore, the bacterial content in the effluent and on the inner wall of the research reactor remains at a high level, although this level is lower than that found for the control reactor. Subsequent use of the ultrafiltration process in combination with other processes such as periodic flushing, chlorine disinfection and UV disinfection can be considered to have achieved the ultimate goal of controlling microbial contamination in the pipeline network.

Author Contributions

Conceptualization, Y.Z. and H.H.; methodology, Y.Z. and H.H.; software, M.Q.; validation, Y.Z., H.H. and M.Q.; formal analysis, Y.Z., H.H. and M.Q.; investigation, M.Q. and H.H.; resources, Y.Z., H.H. and M.Q.; data curation, M.Q. and H.H.; writing—original draft preparation, H.H.; writing—review and editing, Y.Z., H.H., M.Q. and L.Z.; visualization, M.Q.; supervision, Y.Z.; project administration, Y.Z. and L.Z.; funding acquisition, Y.Z. and L.Z. All authors have read and agreed to the published version of the manuscript.

Funding

This work was funded by the National Natural Science Foundation of China (No. 52070145 and 51778453).

Data Availability Statement

Not applicable.

Conflicts of Interest

The authors declare no conflict of interest.

References

  1. Deines, P.; Sekar, R.; Husband, P.S.; Boxall, J.B.; Osborn, A.M.; Biggs, C.A. A new coupon design for simultaneous analysis of in situ microbial biofilm formation and community structure in drinking water distribution systems. Appl. Microbiol. Biotechnol. 2010, 87, 749–756. [Google Scholar] [CrossRef]
  2. Tsai, Y.; Pai, T.; Qiu, J. The impacts of the AOC concentration on biofilm formation under higher shear force condition. J. Biotechnol. 2004, 111, 155–167. [Google Scholar] [CrossRef]
  3. Gao, J.; Liu, Q.; Song, L.; Shi, B. Risk assessment of heavy metals in pipe scales and loose deposits formed in drinking water distribution systems. Sci. Total Environ. 2018, 652, 1387–1395. [Google Scholar] [CrossRef] [PubMed]
  4. Li, G.; Ma, X.; Chen, R.; Yu, Y.; Tao, H.; Shi, B. Field studies of manganese deposition and release in drinking water distribution systems: Insight into deposit control. Water Res. 2019, 163, 114897. [Google Scholar] [CrossRef] [PubMed]
  5. Liu, G.; Tao, Y.; Zhang, Y.; Lut, M.; Knibbe, W.-J.; van der Wielen, P.; Liu, W.; Medema, G.; van der Meer, W. Hotspots for selected metal elements and microbes accumulation and the corresponding water quality deterioration potential in an unchlorinated drinking water distribution system. Water Res. 2017, 124, 435–445. [Google Scholar] [CrossRef]
  6. Zhang, S.; Tian, Y.; Guo, H.; Liu, R.; He, N.; Li, Z.; Zhao, W. Study on the occurrence of typical heavy metals in drinking water and corrosion scales in a large community in northern China. Chemosphere 2022, 290, 133145. [Google Scholar] [CrossRef] [PubMed]
  7. Zhuang, Y.; Han, B.; Chen, R.; Shi, B. Structural transformation and potential toxicity of iron-based deposits in drinking water distribution systems. Water Res. 2019, 165, 114999. [Google Scholar] [CrossRef] [PubMed]
  8. Friedman, M.; Kirmeyer, G.J.; Antoun, E. Developing and Implementing a Distribution System Flushing Program. J. AWWA 2002, 94, 48–56. [Google Scholar] [CrossRef]
  9. Liu, G.; Bakker, G.L.; Li, S.; Vreeburg, J.H.G.; Verberk, J.Q.J.C.; Medema, G.J.; Liu, W.T.; Van Dijk, J.C. Pyrosequencing Reveals Bacterial Communities in Unchlorinated Drinking Water Distribution System: An Integral Study of Bulk Water, Suspended Solids, Loose Deposits, and Pipe Wall Biofilm. Environ. Sci. Technol. 2014, 48, 5467–5476. [Google Scholar] [CrossRef]
  10. Poças, A.; Rebola, N.; Cordeiro, B.; Rodrigues, S.; Benoliel, M.J.; Vreeburg, J.; Menaia, J. Methodology for Sampling Drinking Water Discolouration Loose Deposits at Low Velocities. Water Supply 2013, 13, 1116–1122. [Google Scholar] [CrossRef]
  11. Yang, F.; Shi, B.; Bai, Y.; Sun, H.; Lytle, D.A.; Wang, D. Effect of sulfate on the transformation of corrosion scale composition and bacterial community in cast iron water distribution pipes. Water Res. 2014, 59, 46–57. [Google Scholar] [CrossRef] [PubMed]
  12. Li, G.; Ding, Y.; Xu, H.; Jin, J.; Shi, B. Characterization and release profile of (Mn, Al)-bearing deposits in drinking water distribution systems. Chemosphere 2018, 197, 73–80. [Google Scholar] [CrossRef] [PubMed]
  13. Carrière, A.; Gauthier, V.; Desjardins, R.; Barbeau, B. Evaluation of loose deposits in distribution systems through: Unidirectional flushing. J. AWWA 2005, 97, 82–92. [Google Scholar] [CrossRef]
  14. van Summeren, J.; Blokker, M. Modeling particle transport and discoloration risk in drinking water distribution networks. Drink. Water Eng. Sci. 2017, 10, 99–107. [Google Scholar] [CrossRef] [Green Version]
  15. Braga, A.S.; Filion, Y. The interplay of suspended sediment concentration, particle size and fluid velocity on the rapid deposition of suspended iron oxide particles in PVC drinking water pipes. Water Res. X 2022, 15, 100143. [Google Scholar] [CrossRef]
  16. Gauthier, V.; Gérard, B.; Portal, J.-M.; Block, J.-C.; Gatel, D. Organic matter as loose deposits in a drinking water distribution system. Water Res. 1999, 33, 1014–1026. [Google Scholar] [CrossRef]
  17. Chen, L.; Li, X.; van der Meer, W.; Medema, G.; Liu, G. Capturing and tracing the spatiotemporal variations of planktonic and particle-associated bacteria in an unchlorinated drinking water distribution system. Water Res. 2022, 219, 118589. [Google Scholar] [CrossRef]
  18. Torvinen, E.; Suomalainen, S.; Lehtola, M.J.; Miettinen, I.T.; Zacheus, O.; Paulin, L.; Katila, M.-L.; Martikainen, P.J. Mycobacteria in Water and Loose Deposits of Drinking Water Distribution Systems in Finland. Appl. Environ. Microbiol. 2004, 70, 1973–1981. [Google Scholar] [CrossRef] [Green Version]
  19. Zacheus, O.M.; Lehtola, M.J.; Korhonen, L.K.; Martikainen, P.J. Soft deposits, the key site for microbial growth in drinking water distribution networks. Water Res. 2001, 35, 1757–1765. [Google Scholar] [CrossRef]
  20. Qiu, M.; Zhou, L.; Zhang, Y. Research on the Formation and Shedding Rule of Loose Sediment in Water Supply Pipe Wall. China Water Wastewater 2015, 31, 27–31. [Google Scholar]
  21. Lehtola, M.J.; Laxander, M.; Miettinen, I.T.; Hirvonen, A.; Vartiainen, T.; Martikainen, P.J. The effects of changing water flow velocity on the formation of biofilms and water quality in pilot distribution system consisting of copper or polyethylene pipes. Water Res. 2006, 40, 2151–2160. [Google Scholar] [CrossRef] [PubMed]
  22. Jiang, H.; Wang, Y.; Tan, Z.; Hu, L.; Shi, J.; Liu, G.; Yin, Y.; Cai, Y.; Jiang, G. Dissolved metal ion removal by online hollow fiber ultrafiltration for enhanced size characterization of metal-containing nanoparticles with single-particle ICP-MS. J. Environ. Sci. 2023, 126, 494–505. [Google Scholar] [CrossRef] [PubMed]
  23. Marais, S.; Ncube, E.; Msagati, T.; Mamba, B.; Nkambule, T.T. Comparison of natural organic matter removal by ultrafiltration, granular activated carbon filtration and full scale conventional water treatment. J. Environ. Chem. Eng. 2018, 6, 6282–6289. [Google Scholar] [CrossRef]
  24. Su, Z.; Zhou, R.; Xu, Y.; Yang, S. Biofilm Growth Characteristics in the Internal Surface of Water Supply Pipelines. Water Purif. Technol. 2010, 29, 58–61. [Google Scholar]
  25. Wang, K.; Yu, J. Mixing Equipment; Chemical Industry Press Industrial Equipment and Information Engineering Publishing Center: Beijing, China, 2003. [Google Scholar]
  26. Williams, M.D.; Ravindran, V.; Pirbazari, M. Modeling and process evaluation of membrane bioreactor for removing biodegradable organic matter from water. Chem. Eng. Sci. 2012, 84, 494–511. [Google Scholar] [CrossRef]
  27. Vreeburg, J.; Schippers, D.; Verberk, J.; van Dijk, J. Impact of particles on sediment accumulation in a drinking water distribution system. Water Res. 2008, 42, 4233–4242. [Google Scholar] [CrossRef]
  28. Gerke, T.L.; Little, B.J.; Maynard, J.B. Manganese deposition in drinking water distribution systems. Sci. Total. Environ. 2016, 541, 184–193. [Google Scholar] [CrossRef] [Green Version]
Figure 1. Schematic diagram of the simulated in-pipe reactor.
Water 15 02210 g001
Figure 2. Diagram of the experimental setup.
Water 15 02210 g002
Figure 3. Loose deposit productions for the filtered and unfiltered conditions.
Water 15 02210 g003
Figure 4. Composition of the loose deposits collected from the control and the research reactors.
Water 15 02210 g004
Figure 5. Relationship between the shear stress and the total number of particles in the effluents.
Water 15 02210 g005aWater 15 02210 g005b
Figure 6. Particle size distribution in the influents and effluents for different hydraulic conditions.
Water 15 02210 g006
Figure 7. (a) Comparison of bacteria content on slides in the control and research reactors (b) Comparison of bacteria content in effluents in the control and research reactors.
Water 15 02210 g007
Table 1. Water quality parameters of the tap water used in the experiments.
Water Quality ParameterTOC/(mg·L–1)NH4-N/(mg·L–1) UV254pHTurbidity/NTUChloramine/(mg·L–1)
Tap water2.580 ± 0.300.092 ± 0.0020.069 ± 0.0027.10 ± 0.020.62 ± 0.120.13 ± 0.02
Table 2. Correspondence between the rotation speed, shear stress and flow velocity in an actual pipeline.
Rotation Speed (r/min)Shear Stress (Pa)Corresponding Velocity in an Actual Pipeline (m/s)
d = 100 mmd = 200 mmd = 300 mmd = 400 mm
1000.04840.1250.1330.1380.141
2000.12560.2090.2220.2310.237
3000.21940.2820.3010.3120.320
4000.32610.3500.3720.3860.396
5000.44380.4130.4400.4560.468
6000.57140.4740.5040.5230.536
7000.70800.5320.5690.5870.602
8000.85280.5880.6260.6490.666
9001.00530.6420.6840.7090.727
Table 3. Absolute contents of the components in two loose deposits.
ComponentAlFeCuZnCaSiMnTOC
research/control47.5–48.2%8.9–9.2%18.8–19.0%16.0–18.3%94.2–95.6%83.0–85%059.7–60.1%
Table 4. Water quality of the tap water with and without ultrafiltration.
SampleElement Concentration/(μg/L)TOC/(mg/L)Bacteria Content/(CFU/mL)Turbidity/NTU
MnCuPbAlFeZn
Unfiltered1.92.51.235.823.1111.21.71740.62
Filtered00024.86.5104.01.60<100.15
Table 5. Elemental concentrations in different effluents (μg/L).
Element0 Pa0.092 Pa0.33 Pa0.70 Pa
ResearchControlResearchControlResearchControlResearchControl
Al24.835.126.146.926.353.835.155.8
As0.420.530.460.640.480.650.500.66
Ca900310,36210,23110,81910,52311,43510,91511,848
Cr0.220.620.360.560.410.600.461.08
Cu1.292.533.636.654.4912.68.0313.8
Fe6.5123.19.6468.811.671.212.279.5
Mn0.571.881.812.681.973.032.043.59
Pb0.201.163.8913.97.3623.18.1729.3
Zn104111123137141159146164
Disclaimer/Publisher’s Note: The statements, opinions and data contained in all publications are solely those of the individual author(s) and contributor(s) and not of MDPI and/or the editor(s). MDPI and/or the editor(s) disclaim responsibility for any injury to people or property resulting from any ideas, methods, instructions or products referred to in the content.

