Article

Unlocking the Secrets of River Pollution: Analyzing Organic Pollutants in Sediments—Experimental Study

by
Sadeq Abdullah Abdo Alkhadher
1,*,
Suhaimi Suratman
1,
Hussein E. Al-Hazmi
2,*,
Mohamad Pauzi Zakaria
3,
Bartosz Szeląg
4,
Joanna Majtacz
2 and
Jakub Drewnowski
2
1
Institute of Oceanography and Environment, Universiti Malaysia Terengganu, Kuala Nerus 21030, Malaysia
2
Faculty of Civil and Environmental Engineering, Gdansk University of Technology, Narutowicza 11/12, 80-233 Gdansk, Poland
3
Institute of Ocean and Earth Sciences (IOES), University of Malaya, Kuala Lumpur 50603, Malaysia
4
Faculty of Environmental, Geomatics and Renewable Energy, Kielce University of Technology, 25-314 Kielce, Poland
*
Authors to whom correspondence should be addressed.
Water 2023, 15(12), 2216; https://doi.org/10.3390/w15122216
Submission received: 13 April 2023 / Revised: 24 May 2023 / Accepted: 9 June 2023 / Published: 13 June 2023
(This article belongs to the Special Issue Water Governance Solutions towards Future Environmental Challenges)

Abstract

:
Untreated wastewater released into rivers can result in water pollution, the spread of waterborne diseases, harm to ecosystems, contamination of soil and groundwater, as well as air pollution and respiratory problems for nearby humans and animals due to the release of greenhouse gases. The current study aims to investigate the recent input of anthropogenic loads into the rivers using linear alkylbenzene (LAB), which is one of the molecular chemical markers with application of sophisticated model statistical analyses. In order to determine the compositions of LABs, which act as wastewater pollution molecular indicators, surface sediment samples from the Muar and Kim Kim rivers were collected. Gas chromatography-mass spectrometry (GC-MS) was utilized to identify LABs and investigate their sources and degradation. ANOVA and the Pearson correlation coefficient were employed to determine the significance of differences between sampling locations, with a threshold of p < 0.05. To assess the degradation degree and efficacy of wastewater treatment plants (WWTPs), LABs were identified based on chains ranging from long to short (L/S), C13/C12 homolog, and internal to external (I/E) congeners. The results indicated that LAB concentrations in the studied areas of the Muar River ranged from 87.4 to 188.1 ng g−1dw. There were significant differences in LAB homology at p < 0.05, and a significant percentage of sampling stations contained C13-LAB homology. Based on the LAB ratios (I/E) determined, which ranged from 1.7 to 2.2 in the studied areas, it was concluded that effluents from primary and secondary sources are being discharged into the marine ecosystem in those areas. The degradation of LABs was up to 43% in the interrogated locations. It can be inferred that there is a requirement for enhancing the WWTPs, while also acknowledging the efficacy of LAB molecular markers in identifying anthropogenic wastewater contamination.

1. Introduction

Wastewater can be classified into various types based on origin and characteristics, including mainstream (domestic), side-stream (industrial), agricultural, stormwater, hospital, and commercial wastewater [1,2,3,4,5,6]). Each type requires different treatment processes to make it safe for reuse or discharge into the environment [7,8,9,10,11,12,13,14,15]. However, treated wastewater released into rivers can contain organic chemical substances, such as linear alkylbenzenes (LABs), commonly used in the production of detergents. When LAB-containing wastewater is released into a river, significant degradation occurs in the LABs, and some of them can be transferred downstream and accumulate in the sediments and aquatic species [16]. LABs are hydrophobic, meaning they do not readily dissolve in water, but instead tend to adsorb onto organic matter, such as sediment or algae [17,18]. An essential component of these hazards stemming from the widespread use of detergents and surfactants in daily living, agriculture and industries during the past few years is the pollution of coastal and riverine ecosystems. In spite of Malaysia’s growing urbanization and industry, the country’s sanitary sewer systems, even those in populated and developed areas, are of low quality [19,20,21]. It is crucial to monitor the ecosystems of various rivers and estuaries that receive land-based contaminants, such as industrial and municipal wastewater. This monitoring helps identify potentially hazardous pollutants and adverse impacts on the marine environment, providing essential data for potential environmental management and preservation efforts [22].
One way to measure domestic contaminants is through the use of organic chemical substances such as LABs, which are the primary components in detergents such as LASs [23]. During the 1960s, LAB became the preferred chemical for detergent production, as it offered better biodegradability and affordability compared to branching alkylbenzenes [24]. Due to insufficient sulfonation, LABs are released into the marine environment in a large amount of non-treated household and industrial wastewater [25,26]. Thus, LABs are commonly used as indicators of anthropogenic pollution due to their strong and persistent affinity for industrial effluents [17]. LAB is utilized to indicate the extent of degradation in sediment and particulate matter due to their distinctive phenyl substitution on the linear alkyl chain present in both their structured exterior and inner isomers [27]. Furthermore, LAB is used to determine the duration of residency and types of released domestic and industrial wastewater, including primary and secondary wastewater treatment steps, into an aquatic ecosystem [28].
Malaysia has experienced tremendous economic and demographic expansion over the past three decades, even as it has rapidly developed in terms of industrialization, urbanization, and motorization. As a result, there are now more dangers and potential negative impacts that could damage this nation, particularly as a result of the toxins linked to urbanization and industrialization that are gradually released into the aquatic ecosystem [23].
In Malaysia, the sources and degree of sewage or wastewater contamination vary from one area to another [20,29]. Due to the abundance of urbanized growth and wastewater treatment plants (WWTPs) on Malaysia’s western coast, residential waste is increasingly brought from point sources such as factories and non-point sources such as discharge from different sources. Due to less growth on Malaysia’s eastern coast, the majority of the country’s pollution originates in urban and industrial areas [21,30]. Higher health risks to people and the ecosystem would result from increased inputs of untreated wastewater into river and coastal ecosystems, particularly in slum regions, locations that are overcrowded, constrained, or without wastewater treatment systems.
The sediment particles have similar characteristics to LAB species such as hydrophobicity and high affinity to sediments and suspended particles. Therefore, the sediment analysis has certain advantages over the other environmental media [19,25]. On the other hand, the cost of the LAB analysis process, transportation and sample-keeping may be major issues. Since the rising contamination degree among the rivers, which, in turn, caused severe pollution in Peninsular Malaysia’s rivers, which are represented in this study by both the Muar and Kim Kim rivers, the marine ecosystem is exposed to the accumulation of organic pollutants, including LAB. Studies on the distribution and transportation routes of LAB in Malaysia’s sedimentary environment are, however, scarce. Researchers routinely analyze various environmental samples, including sediments, to better understand the levels of LAB pollution in the riverine environments. Furthermore, the rivers analyzed in this study had never been tested for LABs levels. As a result, this study covers a data gap and demonstrates LAB trends in the study area. The current study aims to provide data about the recent input of LABs as molecular markers of the anthropogenic contributions in the researched rivers. The researched location underwent measurement of LAB distribution, concentration, and levels of degradation as well as improving the efficiency of the existing WWTPs.

2. Materials and Methods

2.1. Experimental Design

The research sites investigated in this study are situated in the Muar and Kim Kim rivers located in the southern region of Malaysia (see Figure S1 in the Supplementary Material (SM)). A detailed description of the research locations is provided in Table 1, including station codes for the Muar River (SMu1, SMu2, SMu3) and the Kim Kim River (SKK1, SKK2, SKK3).
These study areas were selected based on varying levels of anthropogenic activities, ranging from low to high, in their surrounding regions. Surface sediment samples were collected to assess the recent anthropogenic inputs of LAB in these regions. An Ekman dredge was used to collect the top 4 cm of sediment, which were then placed in pre-solvent washed stainless steel containers, transferred to a cooler box, and transported to the laboratory, where they were maintained at −20 °C in a freezer.

2.2. Chemical Analysis

Two columns had applied for extraction of hydrocarbons from the sediments. The first column had been used for purification to remove polar mixtures [31], followed by the second one that had been utilized for fractionation to obtain the anticipated extract, according to descriptions in the literature [32].
According to [33], a cellulose thimble containing 10 g of dried sediment was subjected to a 10 h extraction with 250 mL of dichloromethane (DCM) using a soxhlet apparatus. Before extraction, each sample was spiked with a fixed volume of 50 μL of “1-Cn” LAB as surrogate standards (SS) for recovery correction of LAB individuals. The extracted sample was then reduced in volume using a rotary evaporator before being loaded onto a chromatography column filled with 5% H2O-deactivated silica gel (60–200 mesh size, Sigma Chemical Company, St. Louis, MO, USA) with a 0.9 cm i.d. and 9 cm height.
In the first step of the elution process, a pure 3:1 v/v hexane/DCM mixture (20 mL) was used to elute the extracted hydrocarbons, which were then further reduced to 2 mL. In the second step, a silica gel column that had been fully activated with a 0.47 cm i.d. and 18 cm height was used to isolate the LAB fraction using 4 mL of hexane. The reduced extract was then transferred to a 2 mL amber vial and dried with a gentle stream of nitrogen until completely dry. Finally, internal standards (IS = biphenyl-d10, m/z = 164) were added to the LAB fraction before GC-MS (Agilent Technologies, Santa Clara, CA, USA) measurement.
In order to identify LAB individuals, an Agilent Technologies 7890A series gas chromatograph was connected to a C5975 MSD split/splitless injector. A 30 m fused silica capillary column with a 0.25 mm (i.d.) and a DB-5MS capillary column with a 0.25 m film thickness were used. Helium was used as the carrier gas, maintaining a pressure of 60 kg cm2 throughout the analysis. The LABs were detected at m/z = 91, 92, and 105, and the mass spectrum data were collected using the selective ion monitoring (SIM) mode. The GC-MS was set to 70 eV for the ionization procedure, using an external source at 200 °C and an electron multiplier voltage of approximately 1250 eV. Following a 1 min purge, the sample was injected in splitless mode with the injection port maintained at 300 °C.

2.3. Quality Assurance and Control

In the allowed range (between 60 and 120%), surrogate standards for LAB (1-Cn LAB) were recovered with a reasonable efficiency percentage and only slightly less of the target compounds were lost during the analytical procedure of the LAB. The range of recoveries for LAB surrogates for all sediment in this analysis was between 87–98%. To further avoid any possible sources of cross pollution with the analysis steps, there was a blank sample (four samples per batch) that contained all the standards (SS, IS, and NS) that were present in a regular sample. Every day, freshly manufactured SS, IS, and NS were added to sediment samples at known concentrations. To identify the target LAB congeners at m/z = 91, 92, and 105, SIM was conducted using GC-MS. A five-point calibration curve was generated by analyzing a LAB standard mixture (SS, IS, NS) with concentrations ranging from 0.25 to 5.0 ppm. The limits of detection (LOD) and quantitation (LOQ) were determined by dividing the lowest concentrations of each calibration curve, resulting in values between 0.02–0.1 ng g−1 and 0.1–2 ng g−1, respectively [34].

2.4. Statistical Analysis

The statistical analysis methodology applied in the study was first aimed at establishing correlations between independent variables using Statistica® 14.0.1 software. As a first step, an analysis of variance (ANOVA) was performed to determine the significance of differences at a p-value of less than 0.05 in the distribution of LAB between different locations. The next step was a statistical analysis to determine the correlation between the independent variables. PCA analysis was performed to identify factors describing the variability of organic fractions at the measurement points. PCA calculations were also aimed at identifying the variation of C10, C11, C12, C13, C13/C12, I/E, I/S, and Labdegr at the measurement points. The HCA (hierarchical cluster analysis) method was used to verify the relationships obtained. Based on the results of calculations by the methods given above, theoretical models were developed for C10, C11, C12, C13, and C14 simulations. A detailed discussion of the data analysis methods used is discussed in Section S1—Support Information.

2.5. Total Organic Carbon Method (TOC)

The samples were crushed in a mortar and pestle after being temporarily dried in a 60 °C oven for the entire night. In order to completely moisten each weighted dried sediment sample (1–2 g) with 1M HCl, inorganic carbon was removed. HCl was then eliminated through sample drying for 10 h at 100 °C. A LECO CR-412 analyzer (Eltra Elemental Analyzers Germany, Nordrhein-Westfalen, Germany) was utilized to analyze the TOC in the sediments [35]. Table 2 has the calculated TOC%.

3. Result and Discussion

3.1. Composition, Distribution and Concentration LAB

The 26 different isomers of LABs are written as n-Cm LAB, where “n” is the carbon number and “m” is the location of phenyl on the alkyl chain. The total number of LAB C10–C14 found in samples from all sites is under study (Figure S2 in the SM File).
The composition profile of LAB homologs at the sample sites is shown in Figure 1a, b. The study showed high levels of C13 homologs in all study stations and the concentrations of longer-chain LABs (C13 and C14) were higher than those of short-chain homologs (C10 and C11).
Lengthy-chain LABs (C13 and C14), as opposed to other LAB homologs (C10 and C11), tend to prevail in marine environments, demonstrating that LABs have long lateral transit in this area. When the composition of LABs was carefully analyzed, it was found that the first station along the Muar River (SMu1) had a significant concentration of C13 homologs, indicating that these chemicals undergo anaerobic conditions [17,36].
This chain length distribution was in line with earlier research published by [37,38], which discovered that surface sediments included an increase in the number of LABs with longer alkyl chains (C13–C14) in opposed to wastewater effluents because these chains are less volatile and have lower vapor pressure than those with shorter chains. With increasing chain length, this compositional distribution of LAB returns to a high hydrophobicity of LAB, as seen by the low abundance of C10 and C11 homologs (short-chain LAB) in all research sites [39]. Distribution of LAB homologs in the sediments of these research sites have lower C10 homologs compared to the detergents examined by [40].
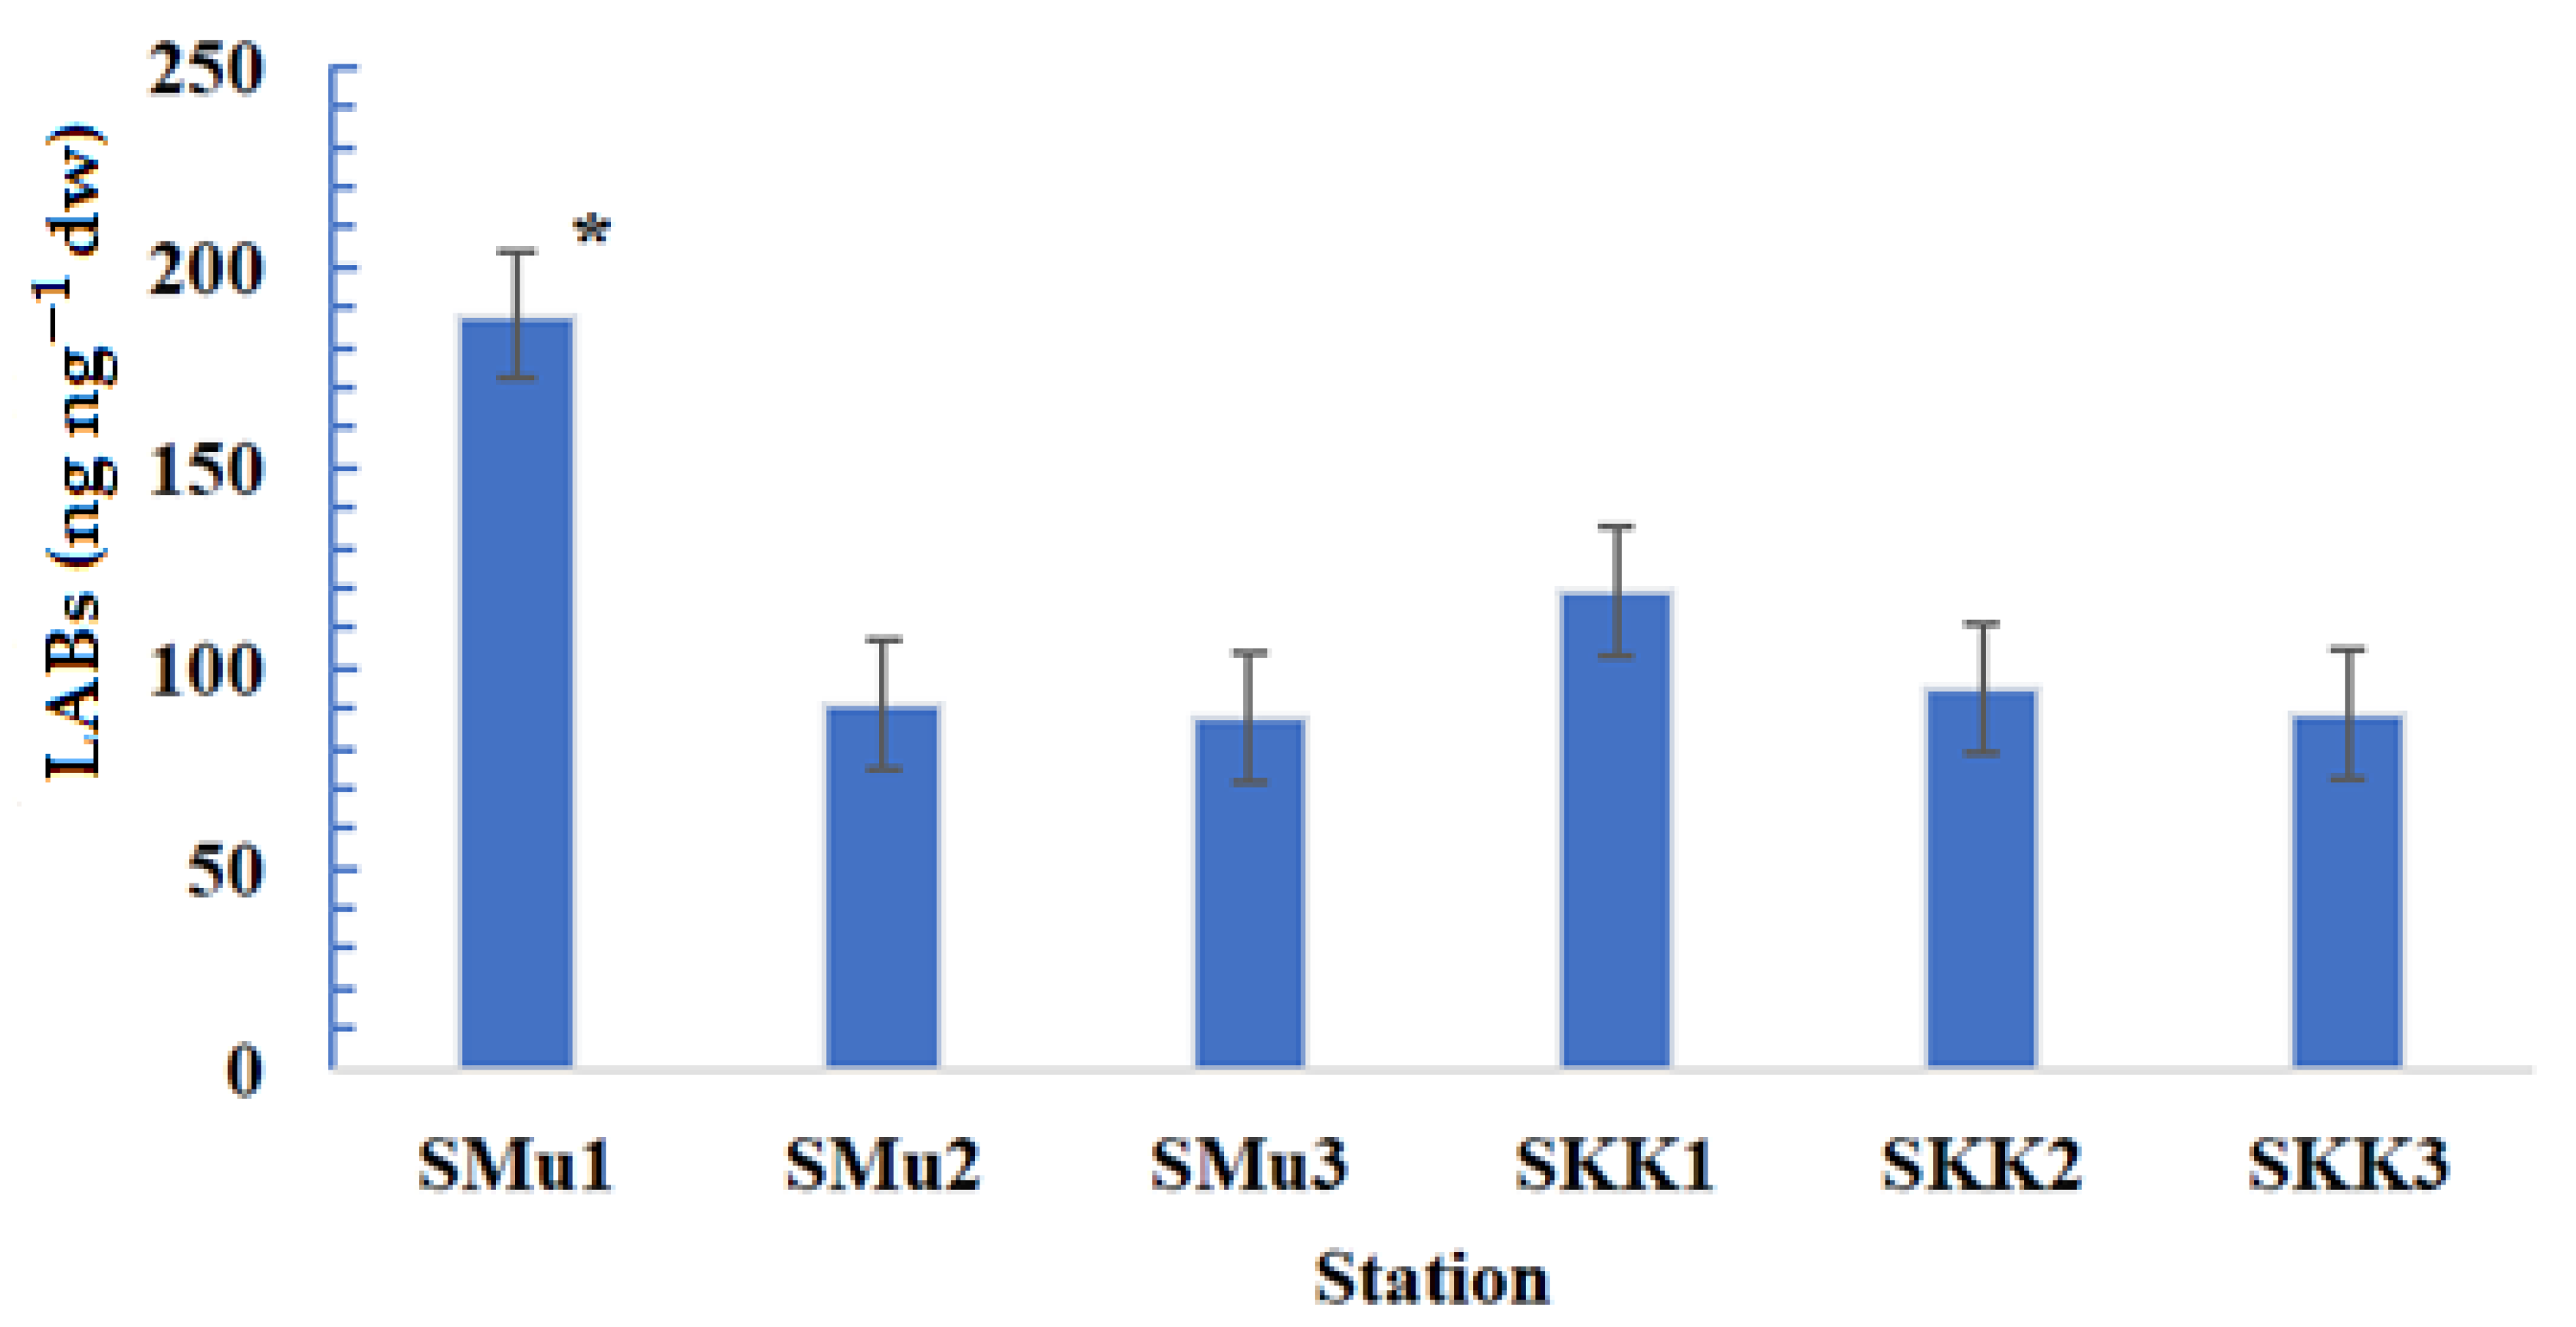
Table 2 demonstrates the presence of LAB C10–14 in the Muar and Kim Kim rivers’ surface sediments varied between 87.4 in the Muar River estuary (SMu3) to 188.1 ng g−1 dw in the upstream of the river (SMu1; Figure 2).
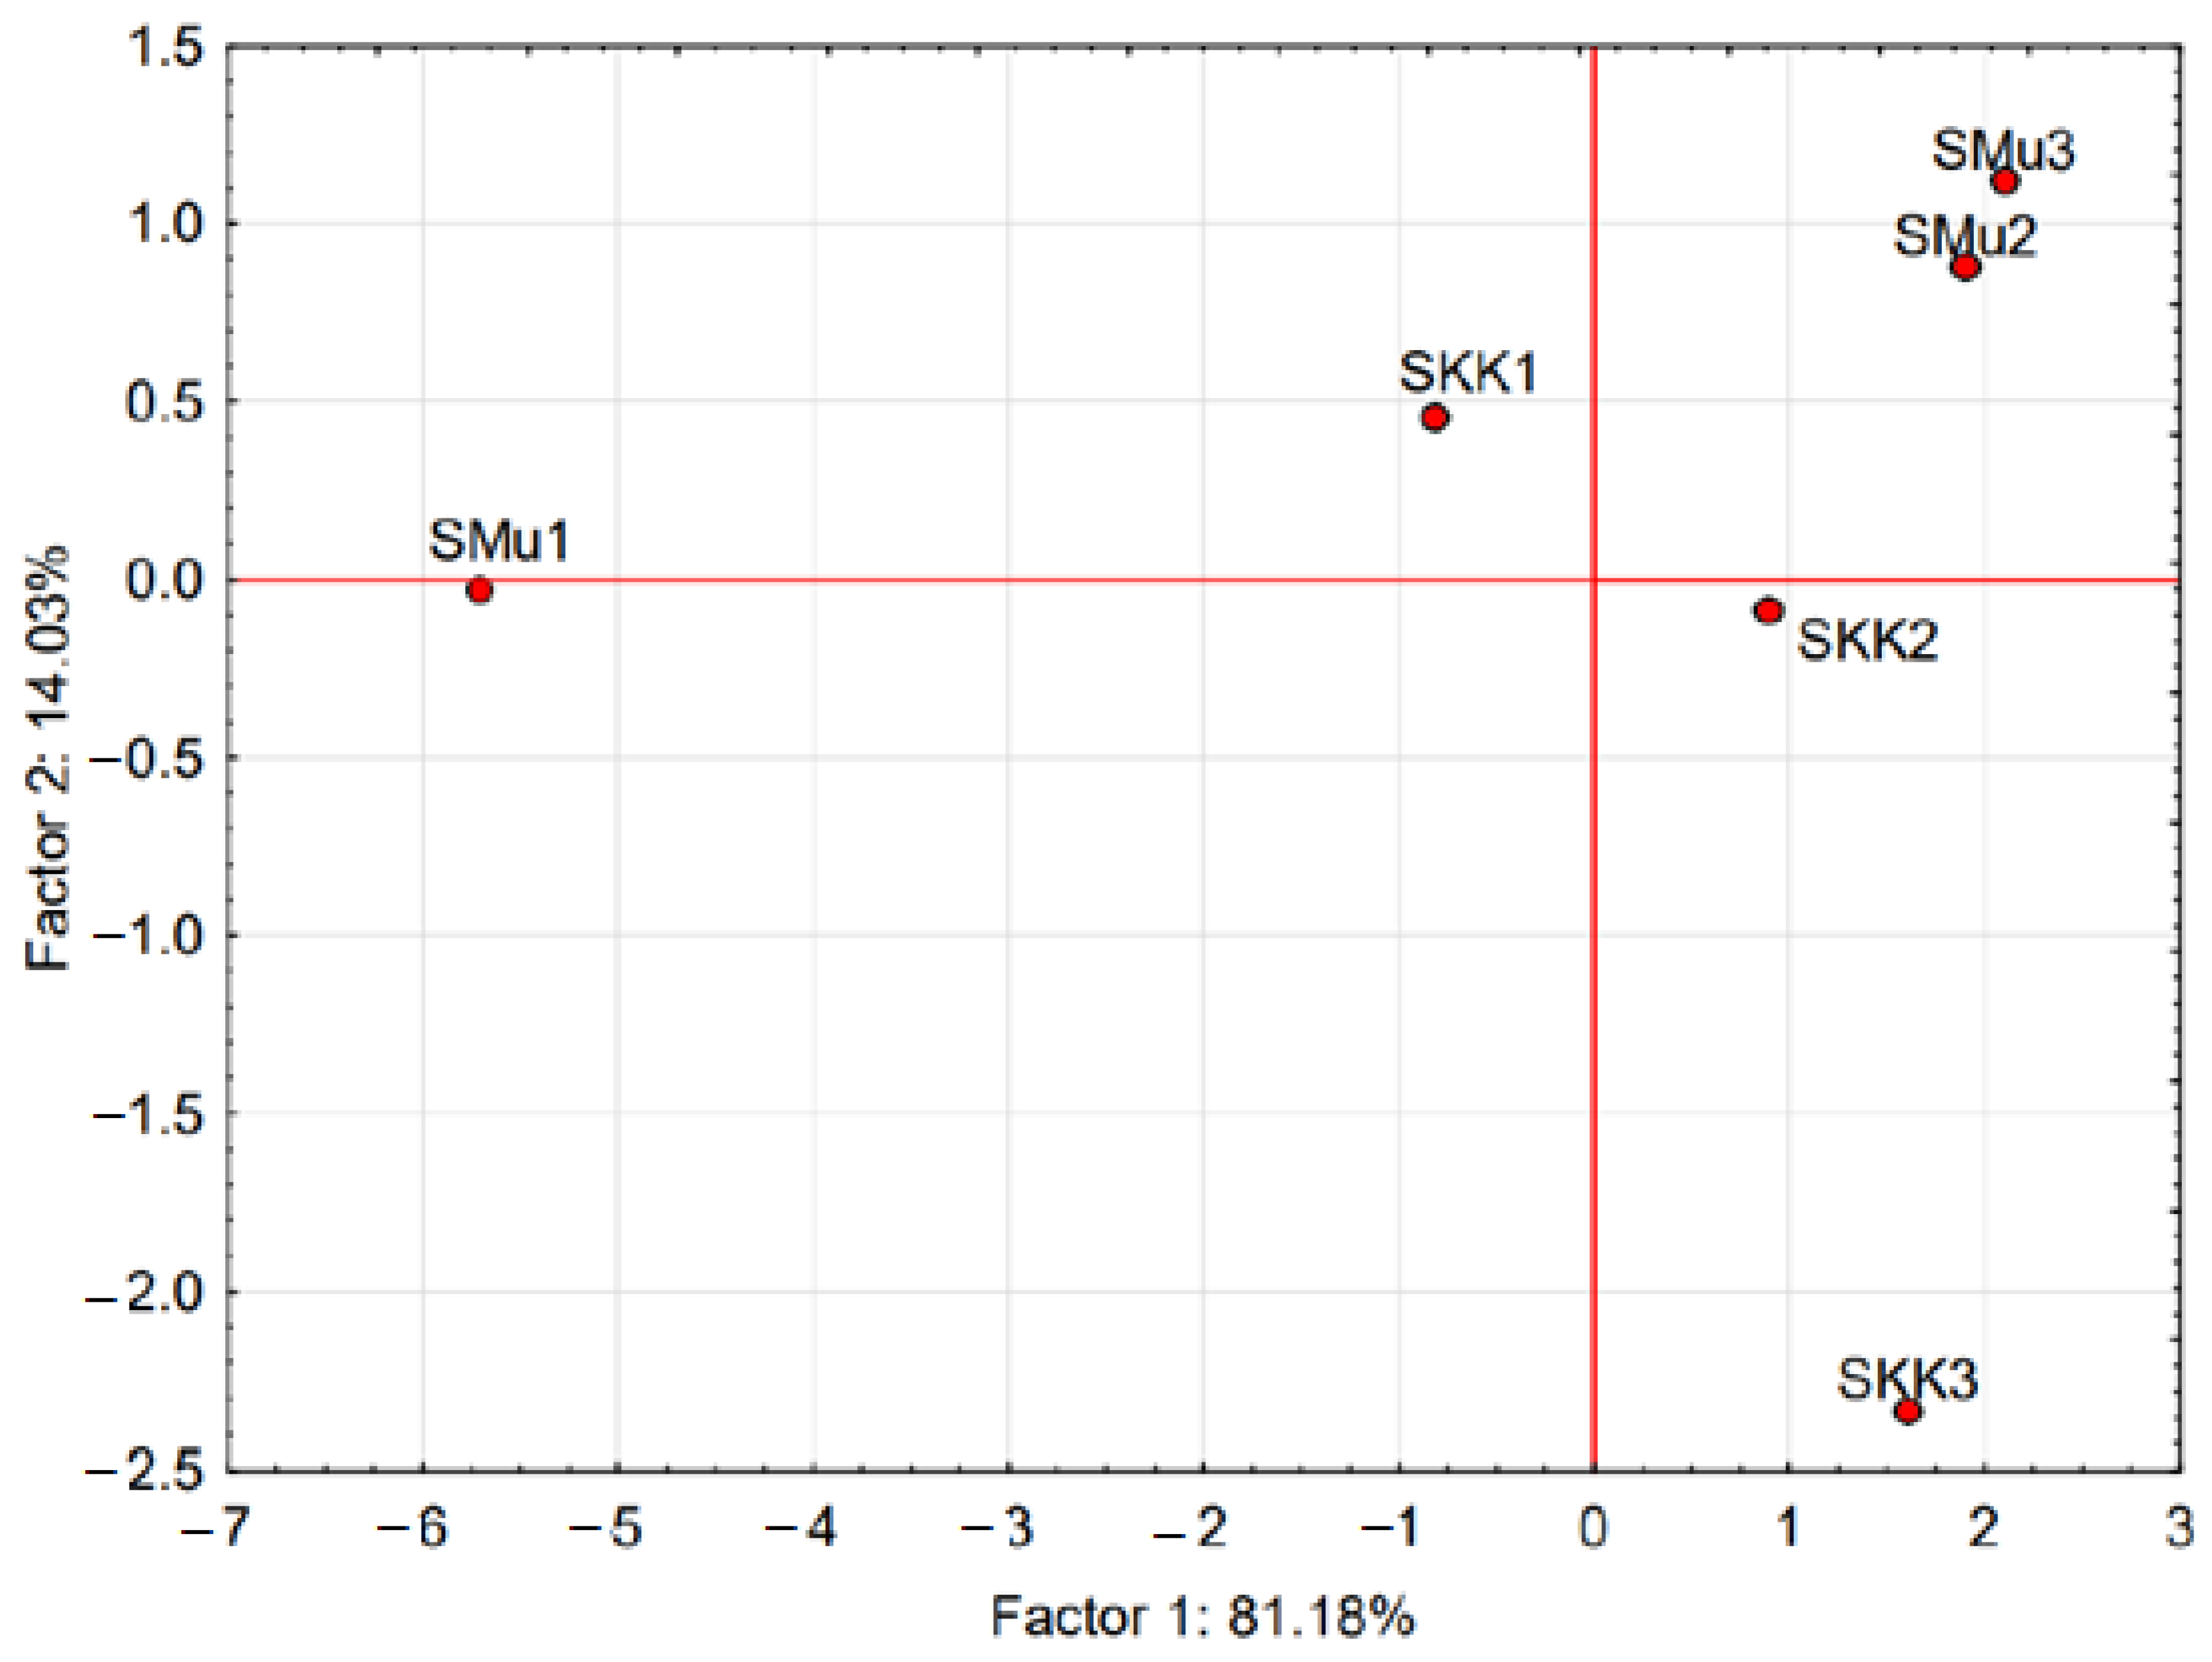
SMu3 in the Muar River had the lowest concentration of LABs, whereas the first station of the river (SMu1) had the highest; this was confirmed by the F1 principal component values of −5.71 and 2.10 (Figure 3).
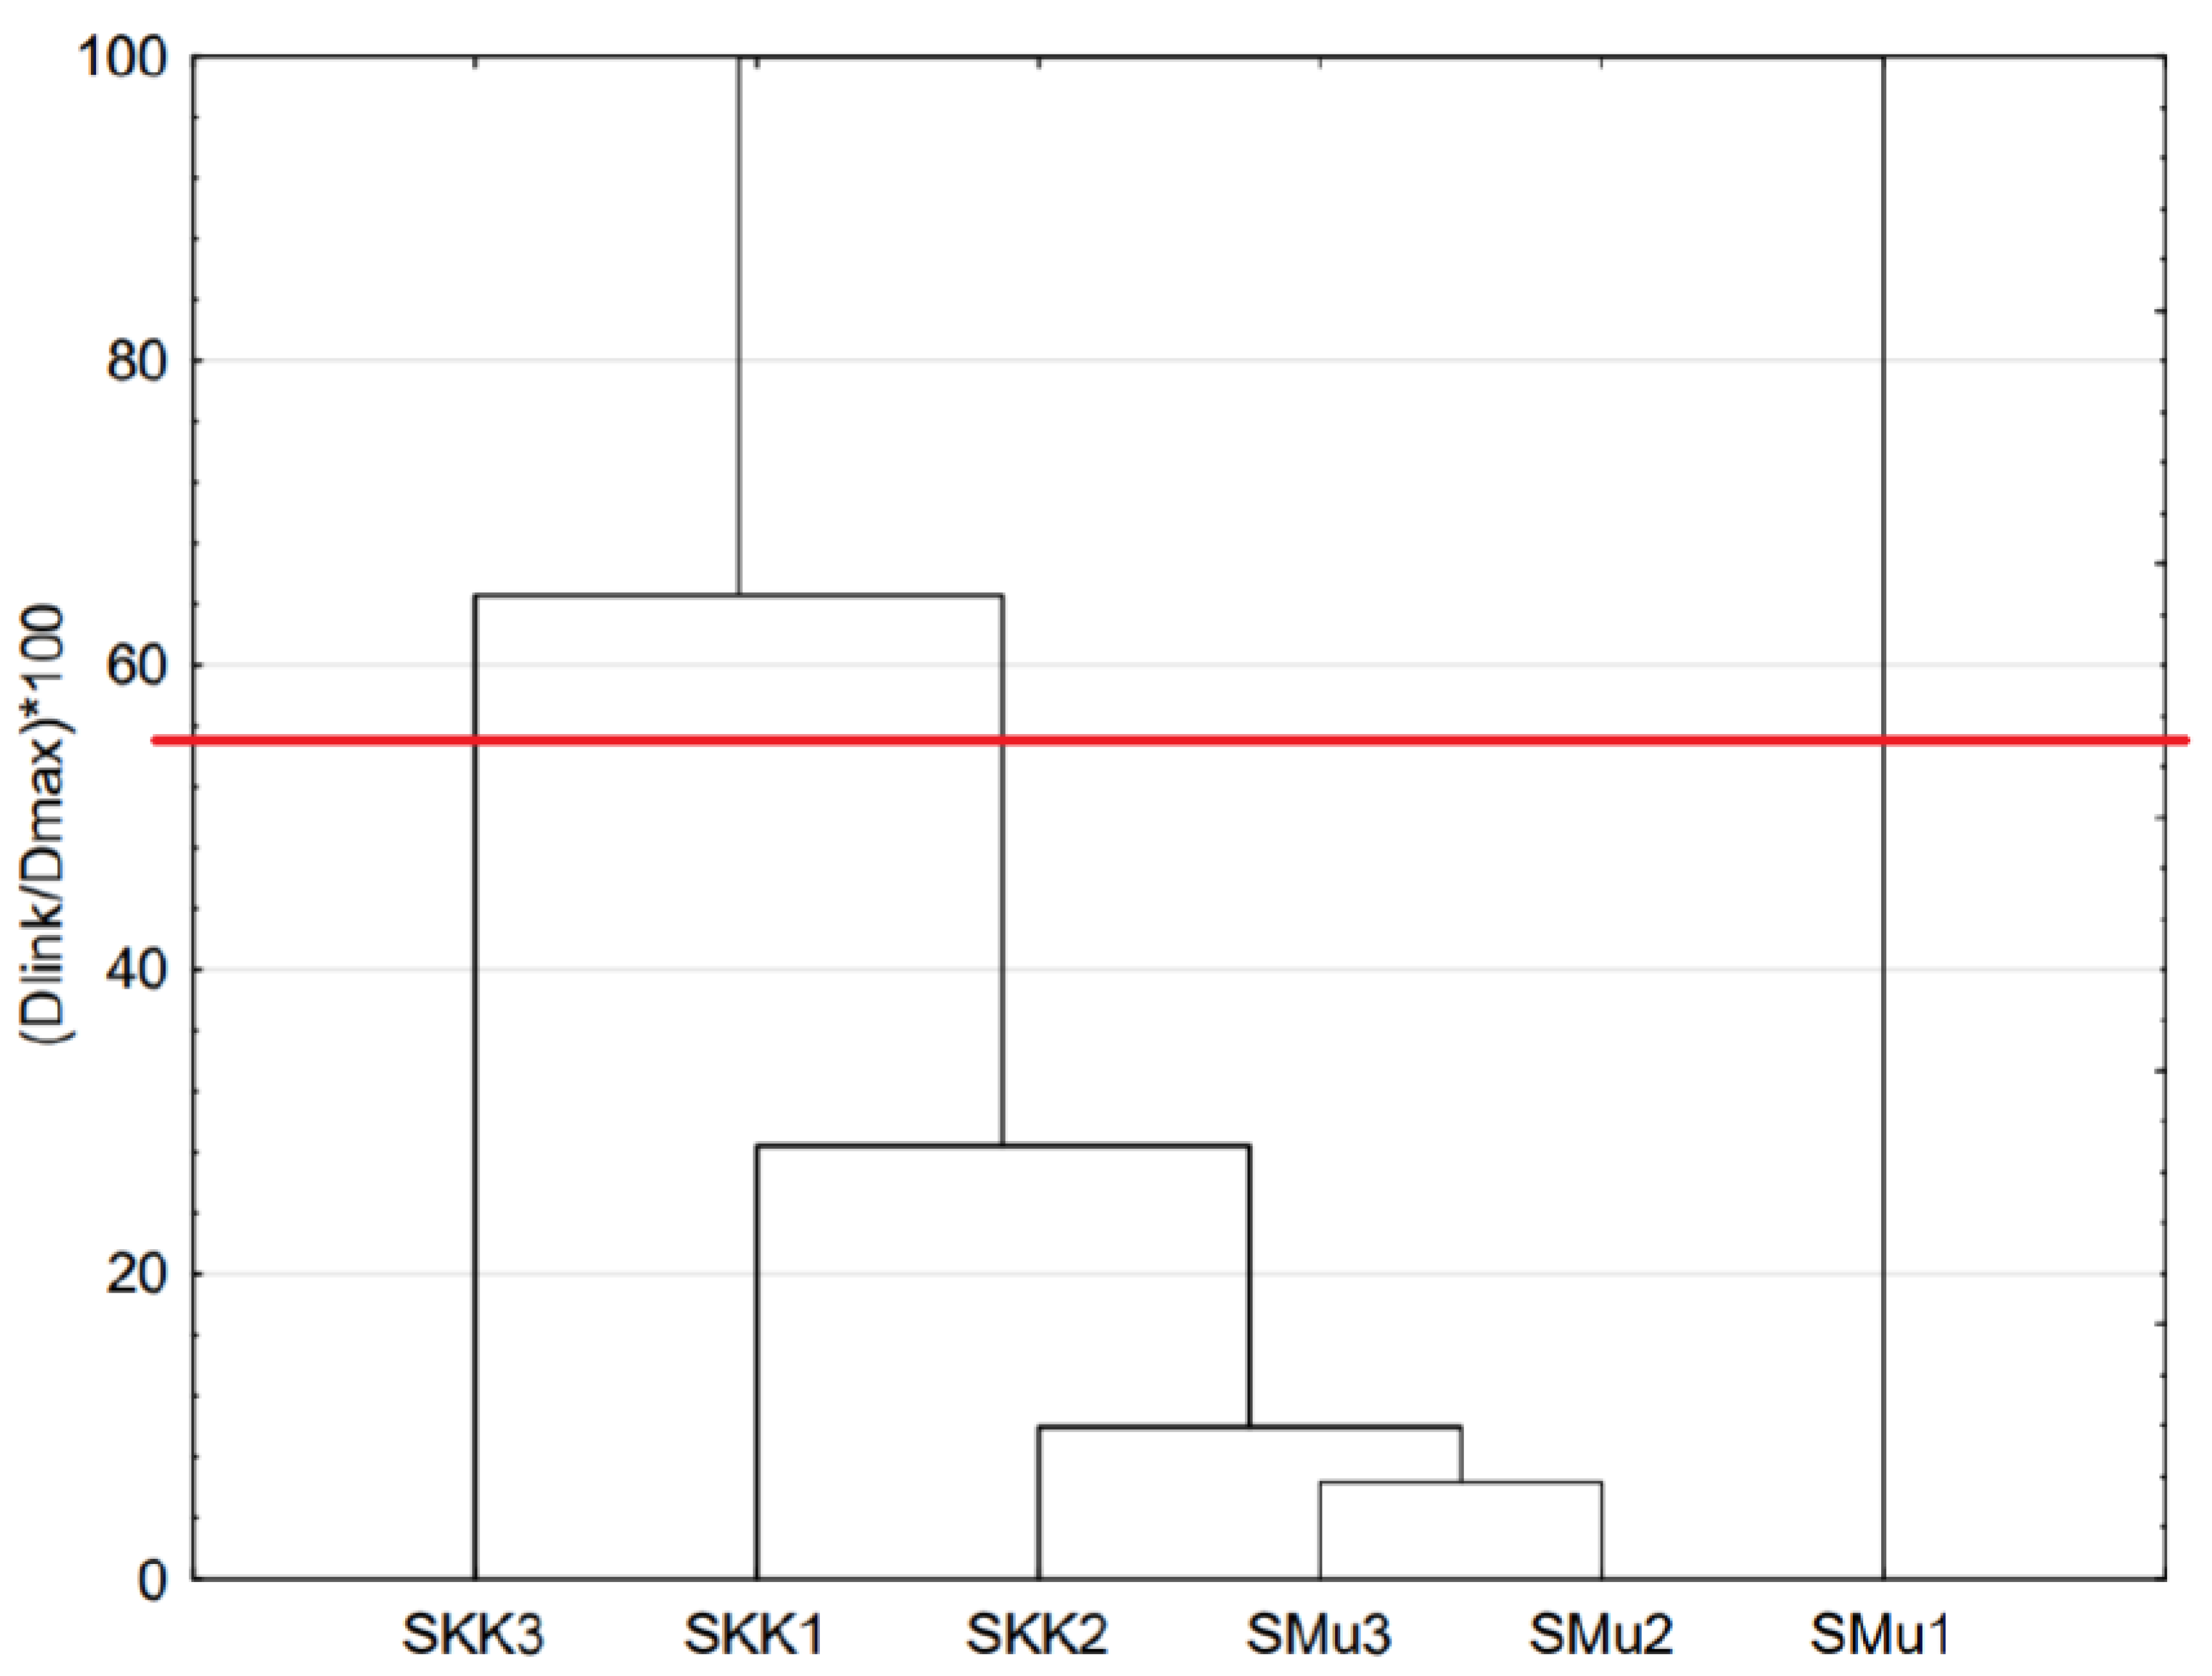
This variability was also confirmed by the dendrogram and the determined distances between measurement points for the Muar River (Figure 4).
The calculations performed showed very strong correlations (R2 ≥ 0.9) between C12, C13-I/E, Labdegr, and LABs. A strong correlation (R2 = 0.7–0.9) was found for C10, C11, C14-LABs and C13, C14-L/S (Table 3).
This suggests that LABs may be a reliable indicator of anthropogenic contamination in the marine environment, as shown in Table S1 in the SM File. At p < 0.05, it was consistent with a significant difference in LAB concentration between the research sites (Table 4).
The results of this investigation showed that Muar River’s LAB levels are greater than those in the Kim Kim River. This was also confirmed by the PCA results (Figure 3), which showed that the F1 value for the measurement points ranged from −5.71 to 2.10 for Muar, while for Kim Kim it was −0.82–1.52. These regional distributions are most likely the result of increased industrialization and urbanization near sampling sites. LAB distribution in the investigated sediments followed the pattern: Muar River > Kim Kim River, demonstrating that the geographic site does affect LAB dispersion. This was also confirmed by PCA calculations, which showed that while the first component (F1) describes the variability of LAB, I/E, L/S, and TOC, the second component depends on the location of the measurement points (geographic coordinates).
According to [29,41], the LAB concentrations in the investigated sites are lower than those found in the Sarawak River, Sembulan River, and Anzali Wetland. However, the levels of LAB observed in this study are high and comparable to those reported in the Kim Kim estuary and Southern Brazil, as noted by [42,43]. When compared to the levels of LAB in sediment samples from other locations in Malaysia and around the world (Table 5), the concentrations of LAB in the examined areas are generally low to moderate.
The discharge of wastewater effluents, combined with the dilution of organic particle materials, is the most probable explanation for the spatial distribution of LAB in the rivers and coastal environments under study, as reported by [50,51]. However, in some areas, the high rate of urbanization, industry, and inadequate wastewater systems may contribute to the spatial distribution of LAB, as noted by [30,52].

3.2. TOC Evaluation

[53], reported that LABs, owing to their high hydrophobicity, tend to strongly adhere to organic molecules when introduced to aquatic environments. This led to a correlation between the level of LABs and the total organic carbon (TOC) found in sediments.
TOC was assessed in all sediment samples, and a relationship between LAB and TOC was observed at several locations, including Muar River, with an R2 value of 0.54 (see Figure 5).
These findings indicate that the spatial distribution of LAB from the land to those stations may be influenced by TOC, which is consistent with the results of TOC analysis in Dongjiang River. The Dongjiang River study showed a linear correlation between LAB concentrations and TOC content, with an R2 value of 0.82, and identified wastewater discharge as the primary source of organic carbon in the sediments. Previous research has established a significant correlation between TOC and the amounts of hydrophobic organic compounds, as demonstrated by studies such as [54,55,56].
There was only a minimal association between the sediments from the Kim Kim River (R2= −0.42; Figure 5) among LAB and TOC. This indicates that TOC had a minor influence on the distribution of LAB in the sediments, and that the main factor driving the redistribution of LAB in those areas’ sediments was the extent of wastewater input from various anthropogenic activities. The Kim Kim River’s SKK3 had TOC with 81 mg g−1 and SKK2 had TOC with 9.0 mg/g. The TOC results are distinct from those in Selangor and Perak rivers in West Malaysia (R2= 0.008 and 0.17, respectively). This shows that the intensification of anthropogenic input in those locations was a contributing factor to the distribution of LAB in the Selangor and Perak rivers, also demonstrating that the TOC was not a determining factor [19,22].

3.3. Assessment of LAB Reduction and Effluents Treatments Efficiency

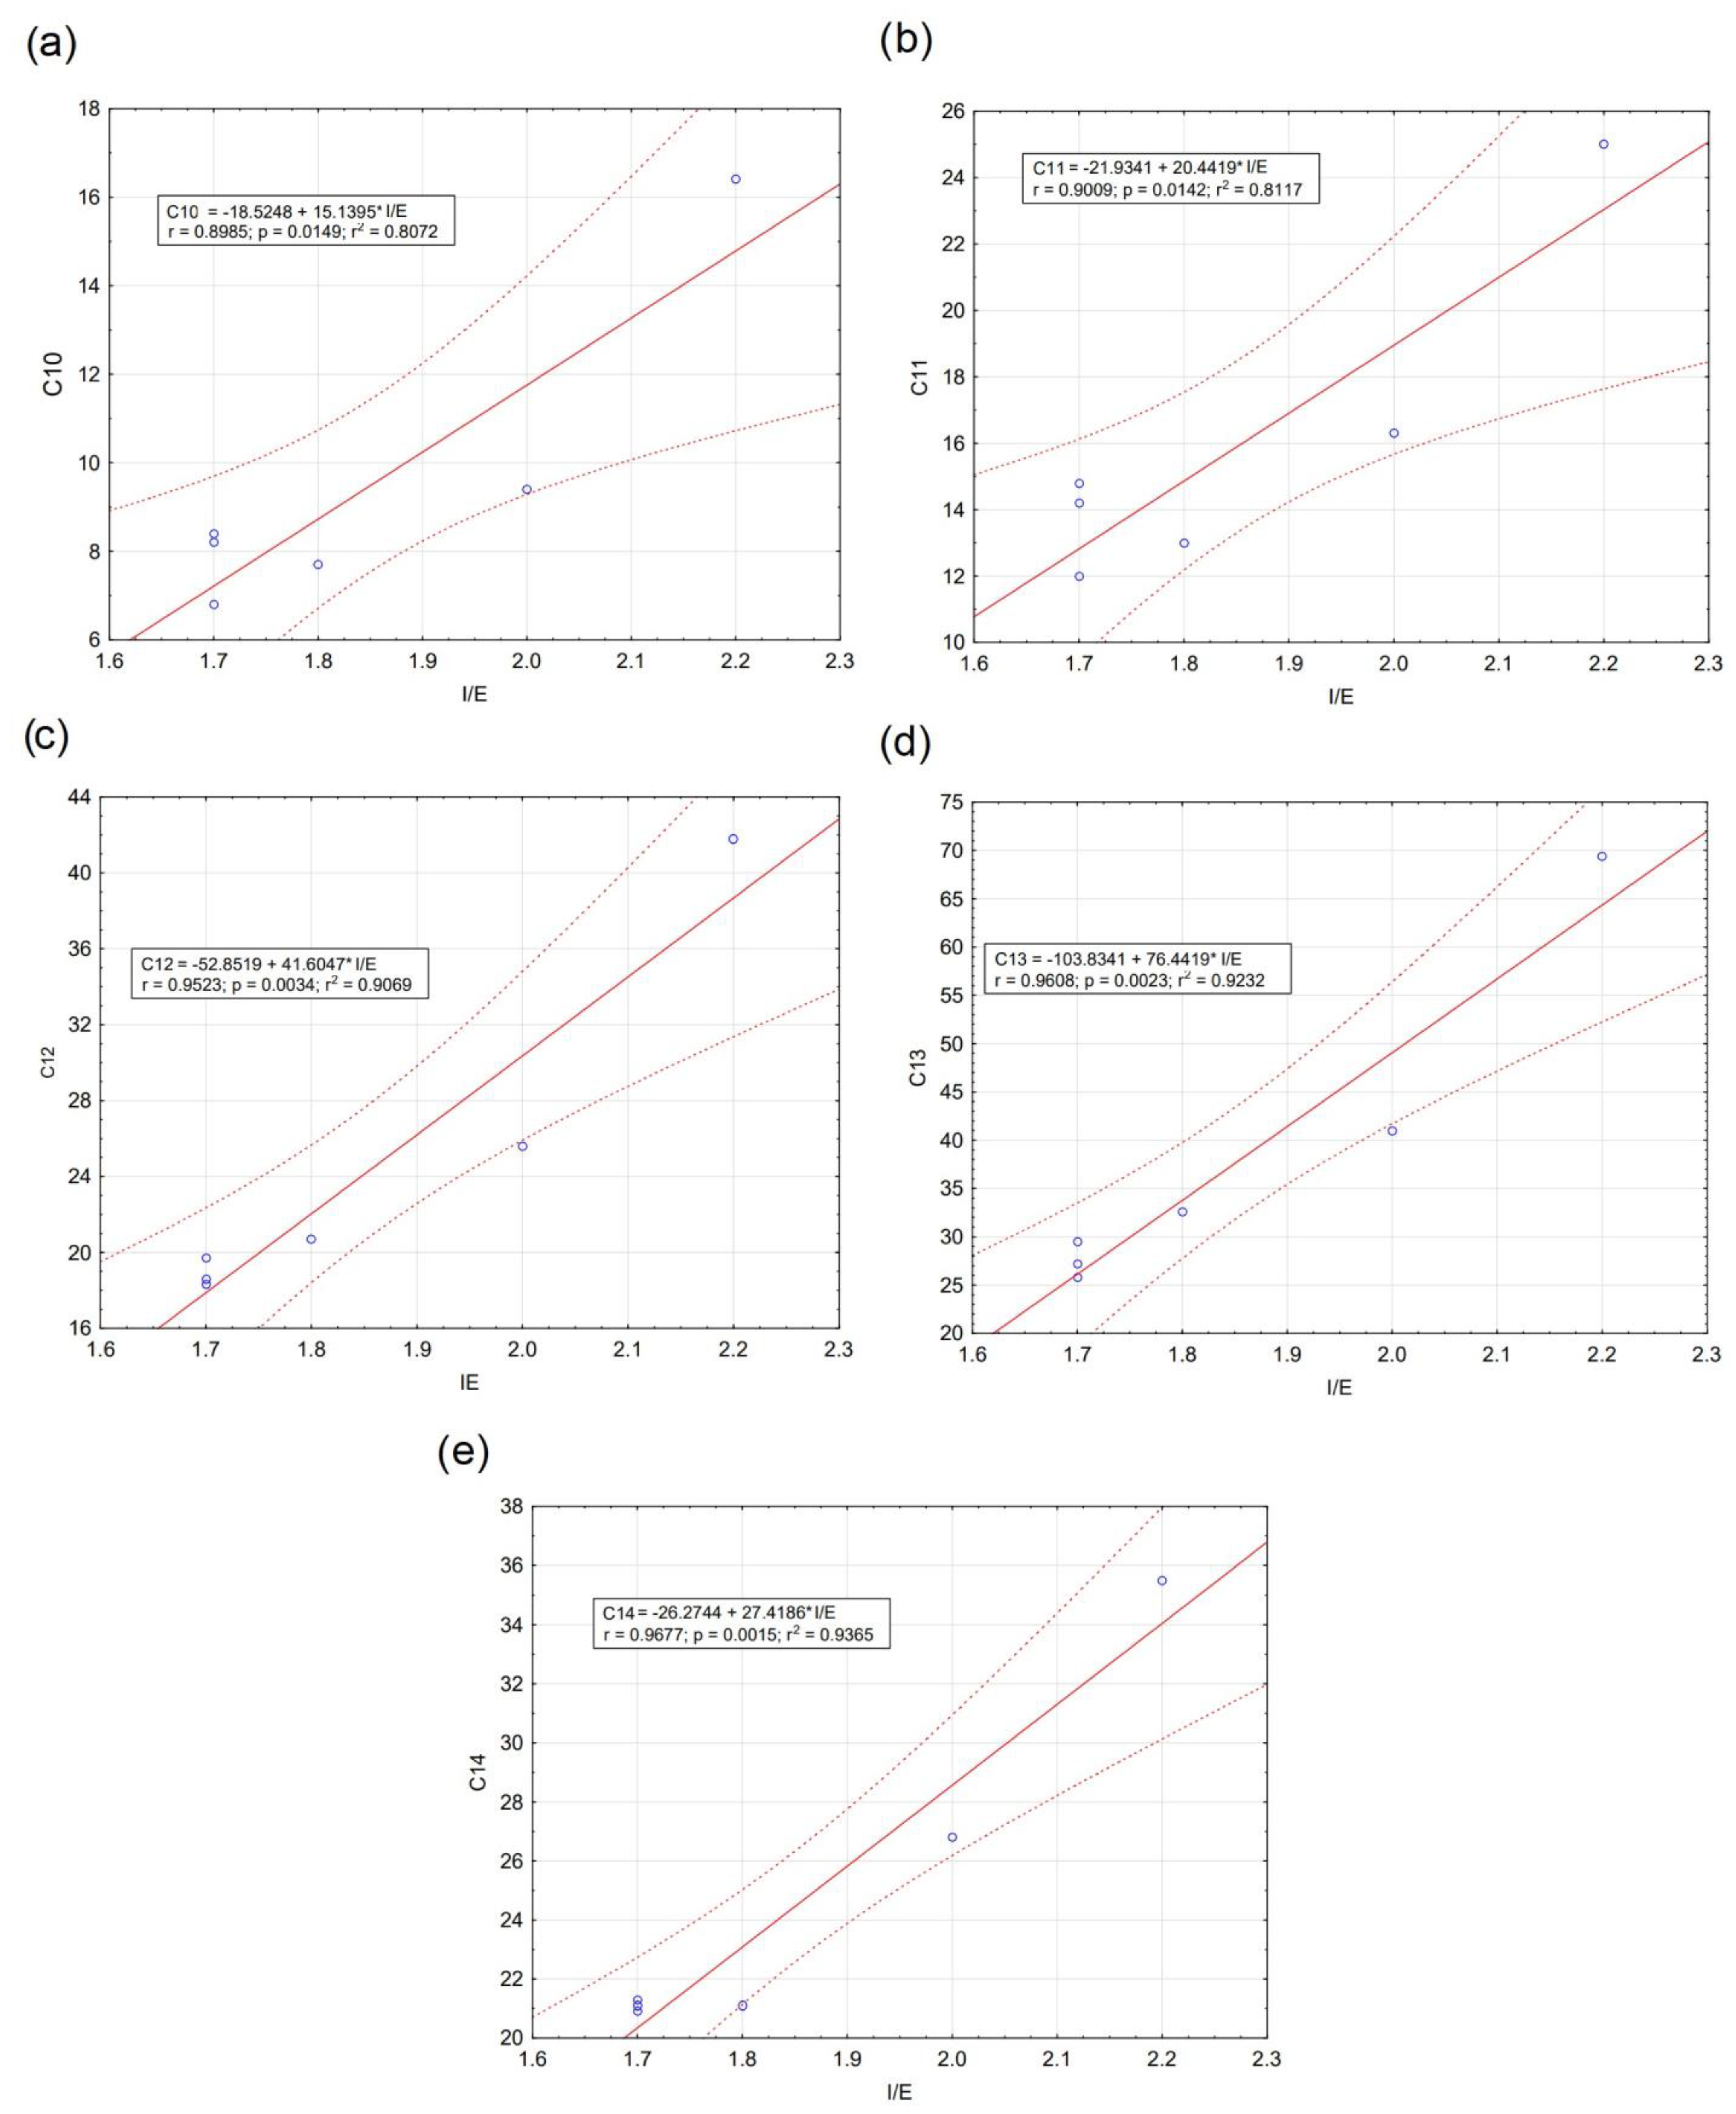
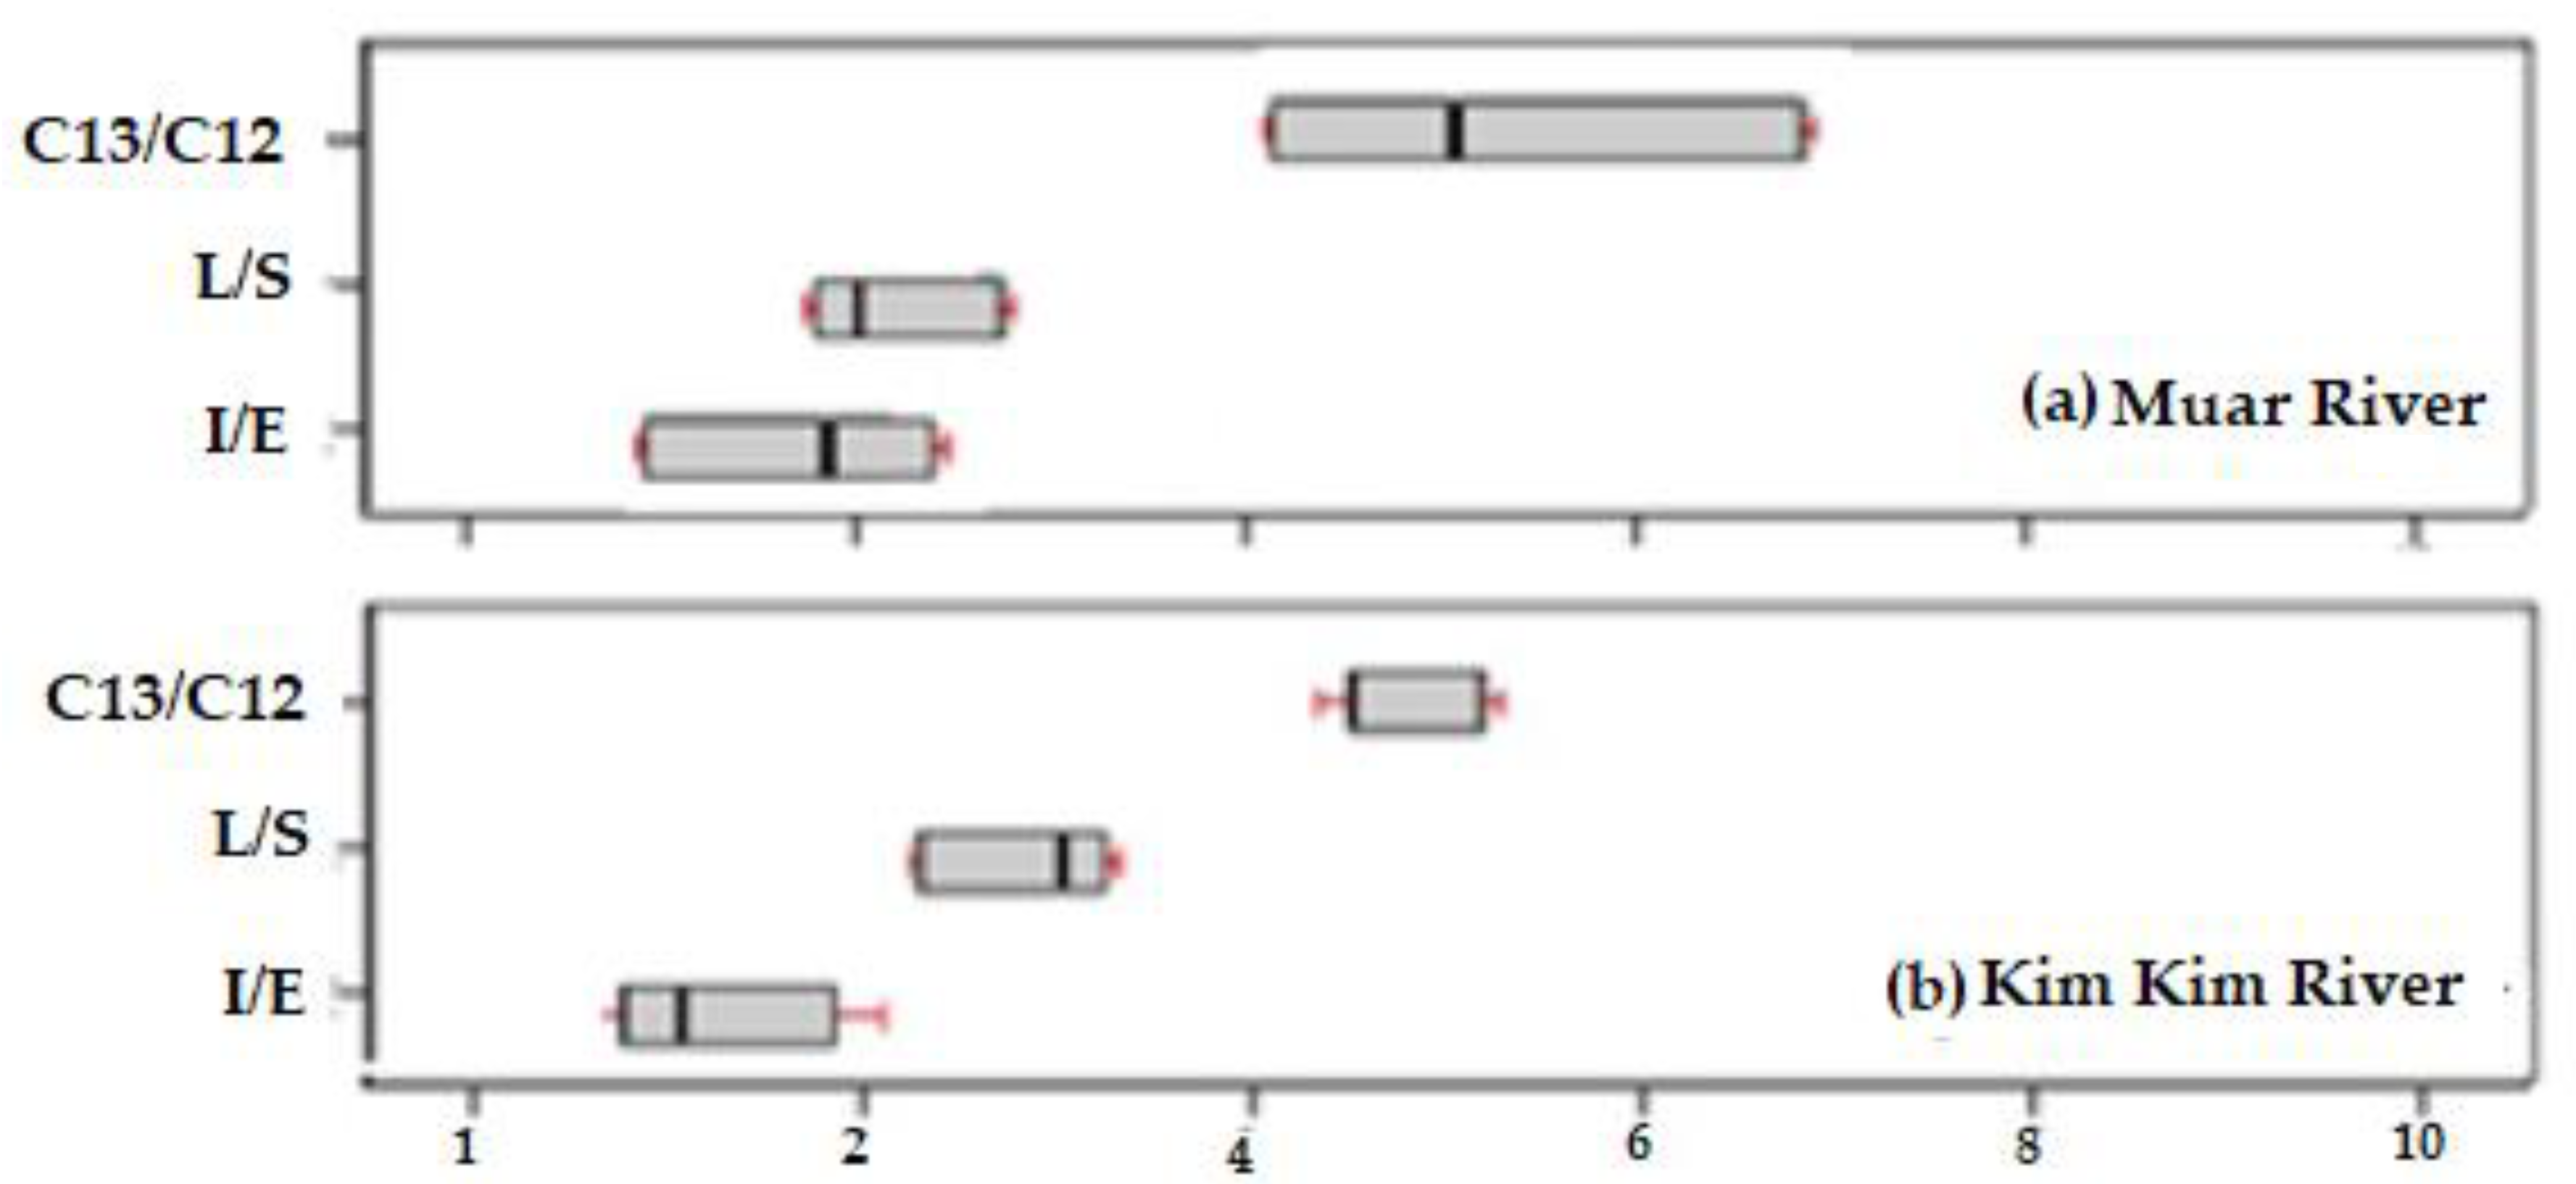
The LAB ratios play a significant role in the degradation and sources of LAB in aquatic ecosystems. To determine the effectiveness of wastewater treatment and the rate of LAB degradation in riverine ecosystems, the I/E ratios are commonly utilized [57,58]. In addition, the calculations performed for the Muar River and the Kim Kim River showed relationships (Figure 6a–e):
C 10 Labs = 15.14 · I / E 18.53                                 R 2 = 0.81
C 11 Labs = 41.60 · I / E 52.85                               R 2 = 0.91
C 12 Labs = 41.60 · I / E 52.85                                       R 2 = 0.91
C 13 Labs = 76.44 · I / E 103.83                               R 2   = 0.920
C 14 Labs = 27.42 · I / E 26.27                             R 2 = 0.94
Low levels with LAB degradation were found in the surface sediments of the study environment at SMu2, SMu3 and SKK3 in the Muar and Kim Kim River, respectively, while high levels were found at SMu1 in Muar River. This is clarified by that the Muar River has a higher level of selective biodegradation of LAB species than Kim Kim River, which has weak degradation and inadequately treated wastewater in some stations.
The I/E ratios varied across the sampling stations, with values ranging from 1.7 in SMu2, SMu3, and SKK3 of the Muar and Kim Kim Rivers, respectively, to 2.2 in SMu1 of the Muar River. These findings suggest that LABs primarily originated from secondary treatment processes in the Muar station, whereas primary wastewater treatment was the primary source in the Kim Kim River. The disparity can be attributed to the fact that the Muar area has more WWTPs than the Kim Kim region, as depicted in Figure 7. LABs are produced from a variety of sources, including residential, daily human uses, flows from rainstorms and industrial wastes, and these wastewaters have a strong attachment to particulate matter such as wastewater particles and organic matter, and may therefore improve the LAS transport from their initial sources into the aquatic ecosystem [48,59,60].
LAB biodegradation in the investigated areas was assessed further using the other two ratios (L/S, C13/C12) that have been proposed to represent the level of wastewater treatment and the degree of LAB degradation [40]. Muar stations has greater L/S and C13/C12 levels than Kim Kim area. According to the research findings, the L/S ratio observed in Muar sediments ranged from 2.0 at the third station (SMu3) to 2.7 at SMu1. These results demonstrate that the L/S ratio in the sediments was higher than the ratio of 1.8 found in detergents [46], suggesting an enhancement in LAB degradation. The C13/C12 ratio was also more than the 1.7 that observed in the riverine sediments by [61], ranging from 4.2 at the third station (SMu3) in Muar River to 6.7 at the first station (SMu1).
Due to increased fishing activity by locals in the shoreline areas in recent years, there has been a notable increase in direct discharge from ferries and vessels [62]. LABs increase in the river, estuary, and coastal sediments brought on by detergent waste discharge, and washing from ferries and boats affect molecular indices to some extent. The flushing of urban materials into estuaries and the marine environment through drains and rivers is made worse by heavy rainfall and flash floods. Therefore, the sedimentary habitats of the investigated locations were found to have a high signature of primary and less secondary sources. LAB ratios demonstrate how quickly LABs are degrading in study samples. In contrast to the Selangor River sediments, the examined area displayed a higher presence of C13-LAB and elevated levels of all three markers (0.6, 2.3, and 2.1). Previous studies have shown that sedimentary LAB is highly susceptible to biodegradation, as demonstrated by [22]. The sedimentary ratios of L/S and C13/C12 in the research area are proposed as more reliable indicators of biodegradation and the efficacy of wastewater treatment. Environmental conditions and a small amount of LAB may influence the evaluation of biodegradation. Fluvial transport is the primary source for the release of terrestrial LAB into the aquatic environment. Moreover, this is in line with earlier published anthropogenic PAHs [57]. The wastewater from places near sampling stations may mix with organic materials before it reaches the test site since it is dumped into the river waters.

4. Conclusions

The LAB difference between the Muar and Kim Kim rivers was statistically significant at p < 0.05, ranging from 87.4 to 188.1 ng g−1 dw in Muar’s sediment. Among the sampling locations, the first station in the Muar River had the highest LAB, while the third station had the lowest, with SC-homologs being the least prevalent. The I/E ratio data indicated that LABs originate from a range of primary to secondary wastewater treatment types near the sample locations, with a high I/E ratio of 2.2 at the first station of the Muar River. These results indicate that untreated industrial and residential waste may persist for a prolonged period due to insufficient wastewater treatment plants resulting in a low I/E ratio. It is expected that levels of industrial and urban wastewater discharge will increase along the rivers in the future. To prevent the release of LABs and other harmful substances into rivers and other water bodies, it is important to properly treat wastewater before it is discharged into the environment. This can include using advanced treatment technologies to remove contaminants from the wastewater or implementing regulations and policies to limit the use of certain chemicals in consumer products. Moreover, regular assessments of wastewater pollution and upgrades to WWTPs are necessary to minimize environmental concerns and improve public health in riverine areas.

Supplementary Materials

The following supporting information can be downloaded at: https://www.mdpi.com/article/10.3390/w15122216/s1, Figure S1: Map of the investigated area, showing sites of Muar and the Kim Kim rivers; Figure S2: Gas chromatograms of LABs in surface sediments of the (a) Muar River (b) Kim Kim River. IIS (Internal Injection Standard-biphenyl, d10), Surrogates 1-Cn-LABs (n:8-14) from left to right) indicated by asterisks. Subscripts indicate the alkyl chain length. Numbers on the peaks indicate the phenyl substituted position on the alkyl chain; Table S1: Pearson correlation coefficients between total LABs concentration in the Muar and Kim Kim rivers. Significant Pearson correlation (p < 0.05); Section S1. Statistical analysis data.

Author Contributions

Conceptualization, S.A.A.A. and M.P.Z.; Methodology, H.E.A.-H. and J.M.; Software, H.E.A.-H., B.S. and J.D.; Validation, H.E.A.-H. and M.P.Z.; Formal analysis, B.S., J.M. and J.D.; Investigation, S.A.A.A. and S.S.; Resources, M.P.Z.; Data curation, S.A.A.A. and J.D.; Writing—original draft, S.A.A.A. and J.M.; Writing—review & editing, S.S. and H.E.A.-H.; Visualization, B.S.; Supervision, S.S. and M.P.Z.; Funding acquisition, S.S. All authors have read and agreed to the published version of the manuscript.

Funding

The postdoctoral scheme grant from University Malaysia Terengganu (UMT) and the Inisiatif Putra Berkumpulan Grant from the University of Perak (UPM) are funding this study (9412401).

Data Availability Statement

The metadata used to support the findings of this study have been deposited in the University 301 Putra Malaysia repository at http://upm.edu.my/.

Conflicts of Interest

The authors declare no conflict of interest.

References

  1. Almasian, A.; Mahmoodi, N.M.; Olya, M.E. Tectomer grafted nanofiber: Synthesis, characterization and dye removal ability from multicomponent system. J. Ind. Eng. Chem. 2015, 32, 85–98. [Google Scholar] [CrossRef]
  2. Mahmoodi, N.M.; Bashiri, M.; Moeen, S.J. Synthesis of nickel–zinc ferrite magnetic nanoparticle and dye degradation using photocatalytic ozonation. Mater. Res. Bull. 2012, 47, 4403–4408. [Google Scholar] [CrossRef]
  3. Mahmoodi, N.M.; Ghezelbash, M.; Shabanian, M.; Aryanasab, F.; Sae, M.R. Efficient removal of cationic dyes from colored wastewaters by dithiocarbamate-functionalized graphene oxide nanosheets: From synthesis to detailed kinetics studies. J. Taiwan Inst. Chem. Eng. 2017, 81, 239–246. [Google Scholar] [CrossRef]
  4. Al-Hazmi, H.E.; Hassan, G.K.; Maktabifard, M.; Grubba, D.; Majtacz, J.; Mąkinia, J. Integrating conventional nitrogen removal with anammox in wastewater treatment systems: Microbial metabolism, sustainability and challenges. Environ. Res. 2022, 215, 114432. [Google Scholar] [CrossRef]
  5. Al-Hazmi, H.E.; Grubba, D.; Majtacz, J.; Ziembińska-Buczyńska, A.; Zhai, J.; Mąkinia, J. Combined partial denitrification/anammox process for nitrogen removal in wastewater treatment. J. Environ. Chem. Eng. 2023, 11, 108978. [Google Scholar] [CrossRef]
  6. Al-Hazmi, H.E.; Lu, X.; Grubba, D.; Majtacz, J.; Badawi, M.; Mąkinia, J. Sustainable nitrogen removal in anammox-mediated systems: Microbial metabolic pathways, operational conditions and mathematical modelling. Sci. Total Environ. 2023, 868, 161633. [Google Scholar] [CrossRef]
  7. Hosseini, F.; Sadighian, S.; Hosseini-Monfare, H.; Mahmoodi, N.M. Dye removal and kinetics of adsorption by magnetic chitosan nanoparticles. Desalination Water Treat. 2016, 57, 24378–24386. [Google Scholar] [CrossRef]
  8. Bogacki, J.P.; Al-Hazmi, H. Automotive fleet repair facility wastewater treatment using air/ZVI and air/ZVI/H2O2 processes. Arch. Environ. Prot. 2017, 43, 24–31. [Google Scholar] [CrossRef]
  9. Feng, Y.; Lu, X.; Al-Hazmi, H.; Mąkinia, J. An overview of the strategies for the deammonification process start-up and recovery after accidental operational failures. Rev. Environ. Sci. Biotechnol. 2017, 16, 541–568. [Google Scholar] [CrossRef]
  10. Mousavi, S.R.; Asghari, M.; Mahmoodi, N.M. Chitosan-wrapped multiwalled carbon nanotube as filler within PEBA thin film nanocomposite (TFN) membrane to improve dye remova. Carbohydr. Polym. 2020, 237, 116128. [Google Scholar] [CrossRef] [PubMed]
  11. Al-Hazmi, H.; Grubba, D.; Majtacz, J.; Kowal, P.; Makinia, J. Evaluation of Partial Nitritation/Anammox (PN/A) Process Performance and Microorganisms Community Composition under Different C/N Ratio. Water 2019, 11, 2270. [Google Scholar] [CrossRef] [Green Version]
  12. Al-Hazmi, H.E.; Lu, X.; Majtacz, J.; Kowal, P.; Xie, L.; Makinia, J. Optimization of the Aeration Strategies in a Deammonification Sequencing Batch Reactor for Efficient Nitrogen Removal and Mitigation of N 2 O Production. Environ. Sci. Technol. 2021, 55, 1218–1230. [Google Scholar] [CrossRef]
  13. Al-Hazmi, H.; Lu, X.; Grubba, D.; Majtacz, J.; Kowal, P.; Mąkinia, J. Achieving Efficient and Stable Deammonification at Low Temperatures—Experimental and Modeling Studies. Energies 2021, 14, 3961. [Google Scholar] [CrossRef]
  14. Al-Hazmi, H.E.; Yin, Z.; Grubba, D.; Majtacz, J.B.; Mąkinia, J. Comparison of the Efficiency of Deammonification under Different DO Concentrations in a Laboratory-Scale Sequencing Batch Reactor. Water 2022, 14, 368. [Google Scholar] [CrossRef]
  15. Al-Hazmi, H.E.; Shokrani, H.; Shokrani, A.; Jabbour, K.; Abida, O.; Mousavi Khadem, S.S.; Habibzadeh, S.; Sonawane, S.H.; Saeb, M.R.; Bonilla-Petriciolet, A.; et al. Recent advances in aqueous virus removal technologies. Chemosphere 2022, 305, 135441. [Google Scholar] [CrossRef]
  16. Alkhadher, S.A.A.; Kadir, A.A.; Zakaria, M.P.; Al-Gheethi, A.; Keshavarzifard, M.; Masood, N.; Alenezi, K.M.; Magam, S.M. Linear alkylbenzenes in surface sediments of an estuarine and marine environment in peninsular Malaysia. Mar. Pollut. Bull. 2020, 153, 111013. [Google Scholar] [CrossRef]
  17. Alkhadher, S.A.A.; Kadir, A.A.; Zakaria, M.P.; Al-Gheethi, A.; Magam, S.M.; Masood, N. Monitoring of Sewage Pollution in the Surface Sediments of the Coastal Ecosystems using linear alkylbenzenes (LABs) as Molecular Markers. J. Soils Sediments. 2020, 20, 3230–3242. [Google Scholar] [CrossRef]
  18. Alkhadher, S.A.A.; Kadir, A.A.; Zakaria, M.P.; Al-Gheethi, A.; Asghar, B.H.M. Determination of Linear Alkylbenzenes (LABs) in Mangrove Ecosystems Using the Oyster Crassostrea Belcheri as a Biosensor. Mar. Pollut. Bull. 2020, 154, 111115. [Google Scholar] [CrossRef] [PubMed]
  19. Magam, S.M.; Halimoon, N.; Zakaria, M.P.; Aris, A.Z.; Kannan, N.; Masood, N. Evaluation of distribution and sources of sewage molecular marker (LABs) in selected rivers and estuaries of Peninsular Malaysia. Environ. Sci. Pollut. Res. Int. 2015, 23, 5693–5704. [Google Scholar] [CrossRef] [PubMed]
  20. Alkhadher, S.A.A.; Suratman, S.; Zakaria, M.P. Lateral Distribution, Environmental Occurrence and Assessment of Organic Pollutants in Surface Sediments of the West and South Peninsular Malaysia. Water Air Soil Pollut. 2023, 234, 124. [Google Scholar] [CrossRef]
  21. Alkhadher, S.A.A.; Suratman, S.; Zakaria, M.P. Lateral distribution, environmental occurrence, and assessment of organic pollutants in surface sediments of the East Malaysia. Environ. Monit Assess. 2023, 195, 720. [Google Scholar] [CrossRef] [PubMed]
  22. Masood, N.; Zakaria, M.P.; Halimoon, N.; Aris, A.Z.; Magam, S.M.; Kannan, N.; Mustafa, S.; Ali, M.M.; Keshavarzifard, M.; Vaezzadeh, V.; et al. Anthropogenic waste indicators (AWI) particularly PAHs and LABs in Malaysian sediments: Application of aquatic environment for identifying anthropogenic pollution. Mar. Pollut. Bull. 2015, 102, 160–175. [Google Scholar] [CrossRef] [PubMed]
  23. Alkhadher, S.A.A.; Zakariab, M.; Suratman, S.; Alanazi, T.Y.A.; Al-Bagawi, A.H.; Magam, S.M.; Masood, N.; Kadir, A.A.; Al-Gheethi, A. Assessment of Sewage Molecular Markers in Port Dickson Coast and Kim Kim River with Sediment Linear Alkylbenzenes. Polycycl. Aromat. Compd. 2021, 43, 343–355. [Google Scholar] [CrossRef]
  24. Shokri, A.; Karimi, S. A Review in Linear Alkylbenzene (LAB) Production Processes in the Petrochemical Industry. Russ. J. Appl. Chem. 2020, 94, 1546–1559. [Google Scholar] [CrossRef]
  25. Alkhadher, S.A.A.; Suratman, S.; Zakaria, M.P. Occurrence and Assessment of Organic Pollutants Residues in the Aquatic Environment of the Coastal Sediments. Sustainability 2023, 15, 8365. [Google Scholar] [CrossRef]
  26. Koul, B.; Yadav, D.; Singh, S.; Kumar, M.; Song, M. Insights into the Domestic Wastewater Treatment (DWWT) Regimes: A Review. Water 2022, 14, 3542. [Google Scholar] [CrossRef]
  27. Alkhadher, S.A.A.; Zakaria, M.P.; Yusoff, F.M.; Kannan, N.; Suratman, S.; Keshavarzifard, M.; Magam, S.M.; Masood, N.; Vaezzadeh, V.; Sani, M.S.A. Baseline distribution and sources of linear alkylbenzenes (LABs) in surface sediments from Brunei Bay, Brunei. Mar. Pollut. Bull. 2015, 101, 397–403. [Google Scholar] [CrossRef]
  28. Okbah, M.A.; Ibrahim, A.M.A.; Gamal, M.N.A. Environmental monitoring of linear alkylbenzene sulfonates and physicochemical characteristics of seawater in El-Mex Bay (Alexandria, Egypt). Environ. Monit. Assess. 2012, 185, 3103–3115. [Google Scholar] [CrossRef] [Green Version]
  29. Magam, S.M.; Zakaria, M.P.; Halimoon, N.; Masood, N.; Alsalahi, M.A. Aliphatic Distribution of Linear Alkylbenzenes (LABs) in Sediments of Sarawak and Sembulan Rivers, Malaysia. Environ. Asia 2012, 5, 48–55. [Google Scholar]
  30. Shahbazi, A.; Zakaria, M.P.; Yap, C.K.; Tan, S.G.; Surif, S. Use of different tissues of Perna viridis as biomonitors of polycyclic aromatic hydrocarbons (PAHs) in the coastal waters of Peninsular Malaysia. Environ. Forensics 2010, 11, 248–263. [Google Scholar] [CrossRef]
  31. Zakaria, M.P.; Takada, H.; Tsutsumi, S.; Ohno, K.; Yamada, J.; Kouno, E.; Kumata, H. Distribution of polycyclic aromatic hydrocarbons (PAHs) in rivers and estuaries in Malaysia: A widespread input of petrogenic PAHs. Environ. Sci. Technol. 2022, 36, 1907–1918. [Google Scholar] [CrossRef]
  32. Masood, N.; Halimoon, N.; Aris, A.Z.; Zakaria, M.P.; Vaezzadeh, V.; Magam, S.M.; Bong, C.W. Seasonal variability of anthropogenic indices of PAHs in sediment from the Kuala Selangor River, west coast Peninsular Malaysia. Environ. Geochem. Health 2018, 40, 2551–2572. [Google Scholar] [CrossRef] [PubMed]
  33. Masood, N.; Alkhadher, S.; Magam, S.M.; Halimoon, N.; Alsukaibi, A.; Zakaria, M.P.; Vaezzadeh, V.; Keshavarzifard, M.; Maisara, S.; Khaled Bin Break, M. Monitoring of linear alkyl benzenes (LABs) in riverine and estuarine sediments in Malaysia. Environ. Geochem. Health 2021, 44, 3687–3702. [Google Scholar] [CrossRef]
  34. Takada, H.; Eganhouse, R.P. Molecular markers of anthropogenic waste: Their use in determining sources, transport pathways and fate of wastes in the environment. Encycl. Environ. Anal. Remediat. 1998, 5, 2883–2940. [Google Scholar]
  35. Nelson, D.; Sommers, L. Total carbon, organic carbon and organic matter. In Methods of Soil Analysis. Part 3: Chemical Methods; Sparks, D.L., Ed.; Soil Science Society of America: Madison, WI, USA, 1996; pp. 961–1010. [Google Scholar]
  36. Dauner, A.L.I.; Hernández, E.A.; MacCormack, W.P.; Martins, C.C. Molecular characterisation of anthropogenic sources of sedimentary organic matter from Potter Cove, King George Island, Antarctica. Sci. Total Environ. 2015, 502, 408–416. [Google Scholar] [CrossRef] [PubMed]
  37. Eganhouse, R.P.; Pontolillo, J. Susceptibility of synthetic long-chain alkylbenzenes to degradation in reducing marine sediments. Environ. Sci. Technol. 2008, 42, 6361–6368. [Google Scholar] [CrossRef]
  38. Gustafsson, Ö.; Long, C.M.; MacFarlane, J.; Gschwend, P.M. Fate of linear alkylbenzenes released to the coastal environment near Boston Harbor. Environ. Sci. Technol. 2001, 35, 2040–2048. [Google Scholar] [CrossRef]
  39. Sherblom, P.M.; Gschwend, P.M.; Eganhouse, R.P. Aqueous solubilities, vapor pressures, and 1-octanol-water partition coefficients for C9-C14 linear alkylbenzenes. J. Chem. Eng. Data 1992, 37, 394–399. [Google Scholar] [CrossRef]
  40. Luo, X.J.; Chen, S.J.; Ni, H.G.; Yu, M.; Mai, B.X. Tracing sewage pollution in the Pearl River Delta and its adjacent coastal area of South China Sea using linear alkylbenzenes (LABs). Mar. Pollut. Bull. 2008, 56, 158–162. [Google Scholar] [CrossRef] [PubMed]
  41. Bakhtiari, A.R.; Javedankherad, I.; Mohammadi, J.; Taghizadeh, R. Distribution of linear alkylbenzenes as a domestic sewage molecular marker in surface sediments of International Anzali Wetland in the southwest of the Caspian Sea, Iran. Environ. Sci. Pollut. Res. 2018, 25, 20920–20929. [Google Scholar] [CrossRef]
  42. Isobe, K.O.; Zakaria, M.P.; Chiem, N.H.; Minh, L.Y.; Prudente, M.; Boonyatumanond, R.; Saha, M.; Sarkar, M.; Takada, H. Distribution of linear alkylbenzenes (LABs) in riverine and coastal environments in South and Southeast Asia. Water Res. 2004, 38, 2449–2459. [Google Scholar] [CrossRef] [PubMed]
  43. Zacchi, F.L.; Flores-Nunes, F.; Mattos, J.J.; Lima, D.; Lüchmann, K.H.; Sasaki, S.T.; Bícego, M.C.; Satie Taniguchi, S.; Montone, R.C.; Almeida, E.A.; et al. Biochemical and molecular responses in oysters Crassostrea brasiliana collected from estuarine aquaculture areas in Southern Brazil. Mar. Pollut. Bull 2018, 135, 110–118. [Google Scholar] [CrossRef] [PubMed]
  44. Cabral, A.C.; Dauner, A.L.L.; Xavier, F.C.B.; Garcia, M.R.D.; Wilhelm, M.M.; Santos, V.C.G.; Netto, S.A.; Martins, C.C. Tracking the sources of allochthonous organic matter along a subtropical fluvial-estuarine gradient using molecular proxies in view of land uses. Chemosphere 2020, 251, 126435. [Google Scholar] [CrossRef] [PubMed]
  45. Raymundo, C.; Preston, M. The distribution of linear alkylbenzenes in coastal and estuarine sediments of the Western North Sea. Mar. Pollut. Bull. 1992, 24, 138–146. [Google Scholar] [CrossRef]
  46. Ni, H.G.; Lu, F.H.; Wang, J.Z.; Guan, Y.F.; Luo, X.L.; Zeng, E.Y. Linear alkylbenzenes in riverine runoff of the Pearl River Delta (China) and their application as anthropogenic molecular markers in coastal environments. Environ. Pollut. 2008, 154, 348–355. [Google Scholar] [CrossRef]
  47. Martins, C.C.; Ferreira, J.A.; Taniguchi, S.; Mahiques, M.M.; Bícego, M.C.; Montone, R.C. Spatial distribution of sedimentary linear alkylbenzenes and faecal steroids of Santos Bay and adjoining continental shelf, SW Atlantic, Brazil: Origin and fate of sewage contamination in the shallow coastal environment. Mar. Pollut. Bull. 2008, 56, 1359–1363. [Google Scholar] [CrossRef]
  48. Zhang, K.; Wang, J.Z.; Liang, B.; Shen, R.L.; Zeng, E.Y. Assessment of aquatic wastewater pollution in a highly industrialized zone with sediment linear alkylbenzenes. Environ. Toxicol. Chem. 2012, 31, 724–730. [Google Scholar] [CrossRef]
  49. Rinawati; Koike, T.; Koike, H.; Kurumisawa, R.; Ito, M.; Sakurai, S.; Togo, A.; Saha, M.; Arifinc, Z.; Takada, H. Distribution, source identification, and historical trends of organic micro pollutants in coastal sediment in Jakarta Bay, Indonesia. J. Hazard. Mater. 2012, 217–218, 208–216. [Google Scholar]
  50. Zeng, E.Y.; Khan, A.R.; Tran, K. Organic pollutants in the coastal environment Off San Diego, California. 3. Using linear alkylbenzenes to trace sewage-derived organic materials. Environ. Toxicol. Chem. 1997, 16, 196–201. [Google Scholar] [CrossRef]
  51. Cabral, A.C.; Martins, C.C. Insights about sources, distribution, and degradation of sewage and biogenic molecular markers in surficial sediments and suspended particulate matter from a human-impacted subtropical estuary. Environ. Pollut. 2018, 241, 1071–1081. [Google Scholar] [CrossRef]
  52. Sakai, N.; Yusof, R.; Sapar, M.; Yoneda, M.; Ali, M.M. Spatial analysis and source profiling of beta-agonists and sulfonamides in Langat River basin, Malaysia. Sci. Total Environ. 2016, 548–549, 43–50. [Google Scholar] [CrossRef]
  53. Wang, X.C.; Zhang, Y.X.; Chen, R.F. Distribution and partitioning of polycyclic aromatic hydrocarbons (PAHs) in different size fractions in sediments from Boston Harbor, United States. Mar. Pollut. Bull. 2001, 42, 1139–1149. [Google Scholar] [CrossRef]
  54. Arzayus, K.M.; Dickhut, R.M.; Canuel, E.A. Fate of atmospherically deposited polycyclic aromatic hydrocarbons (PAHs) in Chesapeake Bay. Environ. Sci. Technol. 2001, 35, 2178–2183. [Google Scholar] [CrossRef]
  55. Accardi-Dey, A.; Gschwend, P.M. Assessing the combined roles of natural organic matter and black carbon as sorbents in sediments. Environ. Sci. Technol. 2002, 36, 21–29. [Google Scholar] [CrossRef]
  56. Hinga, K.R. Degradation rates of low molecular weight PAH correlate with sediment TOC in marine sub tidal sediments. Mar. Pollut. Bull. 2003, 46, 466–474. [Google Scholar] [CrossRef]
  57. Takada, H.; Ishiwatari, R. Linear alkylbenzenes in urban riverine environments in Tokyo: Distribution, source, and behavior. Environ. Sci. Technol. 1987, 21, 875–883. [Google Scholar] [CrossRef]
  58. Alkhadher, S.A.A.; Zakaria, M.P.; Yusoff, F.M.; Kannan, N.; Suratman, S.; Magam, S.M.; Masood, N.; Keshavarzifard, M.; Vaezzadeh, V.; Sani, M.S.A. Distribution and sources of linear alkylbenzenes (LABs) in surface sediments from Johor Bahru Coast and the Kim Kim River, Malaysia. Environ. Forensics 2016, 17, 36–47. [Google Scholar] [CrossRef]
  59. Harwood, J.J. Molecular markers for identifying municipal, domestic and agricultural sources of organic matter in natural waters. Chemosphere 2014, 95, 3–8. [Google Scholar] [CrossRef] [PubMed]
  60. Cabral, A.C.; Stark, J.S.; Kolm, H.E.; Martins, C.C. An integrated evaluation of some faecal indicator bacteria (FIB) and chemical markers as potential tools for monitoring sewage contamination in subtropical estuaries. Environ. Pollut. 2018, 235, 739–749. [Google Scholar] [CrossRef]
  61. Liu, L.Y.; Wang, J.Z.; Wong, C.S.; Qiu, J.W.; Zeng, E.Y. Application of multiplegeochemical markers to investigate organic pollution in a dynamic coastal zone. Environ. Toxicol. Chem. 2013, 32, 312–319. [Google Scholar] [CrossRef]
  62. Abu Samah, B.; Yassin, S.M.; Shaffril, H.A.M.; Hassan, M.S.; Othman, M.S.; Abu Samah, A.; Ramli, S.A. Relationship to the river: The case of the Muar River community. Am. J. Environ. Sci. 2011, 7, 362–369. [Google Scholar] [CrossRef]
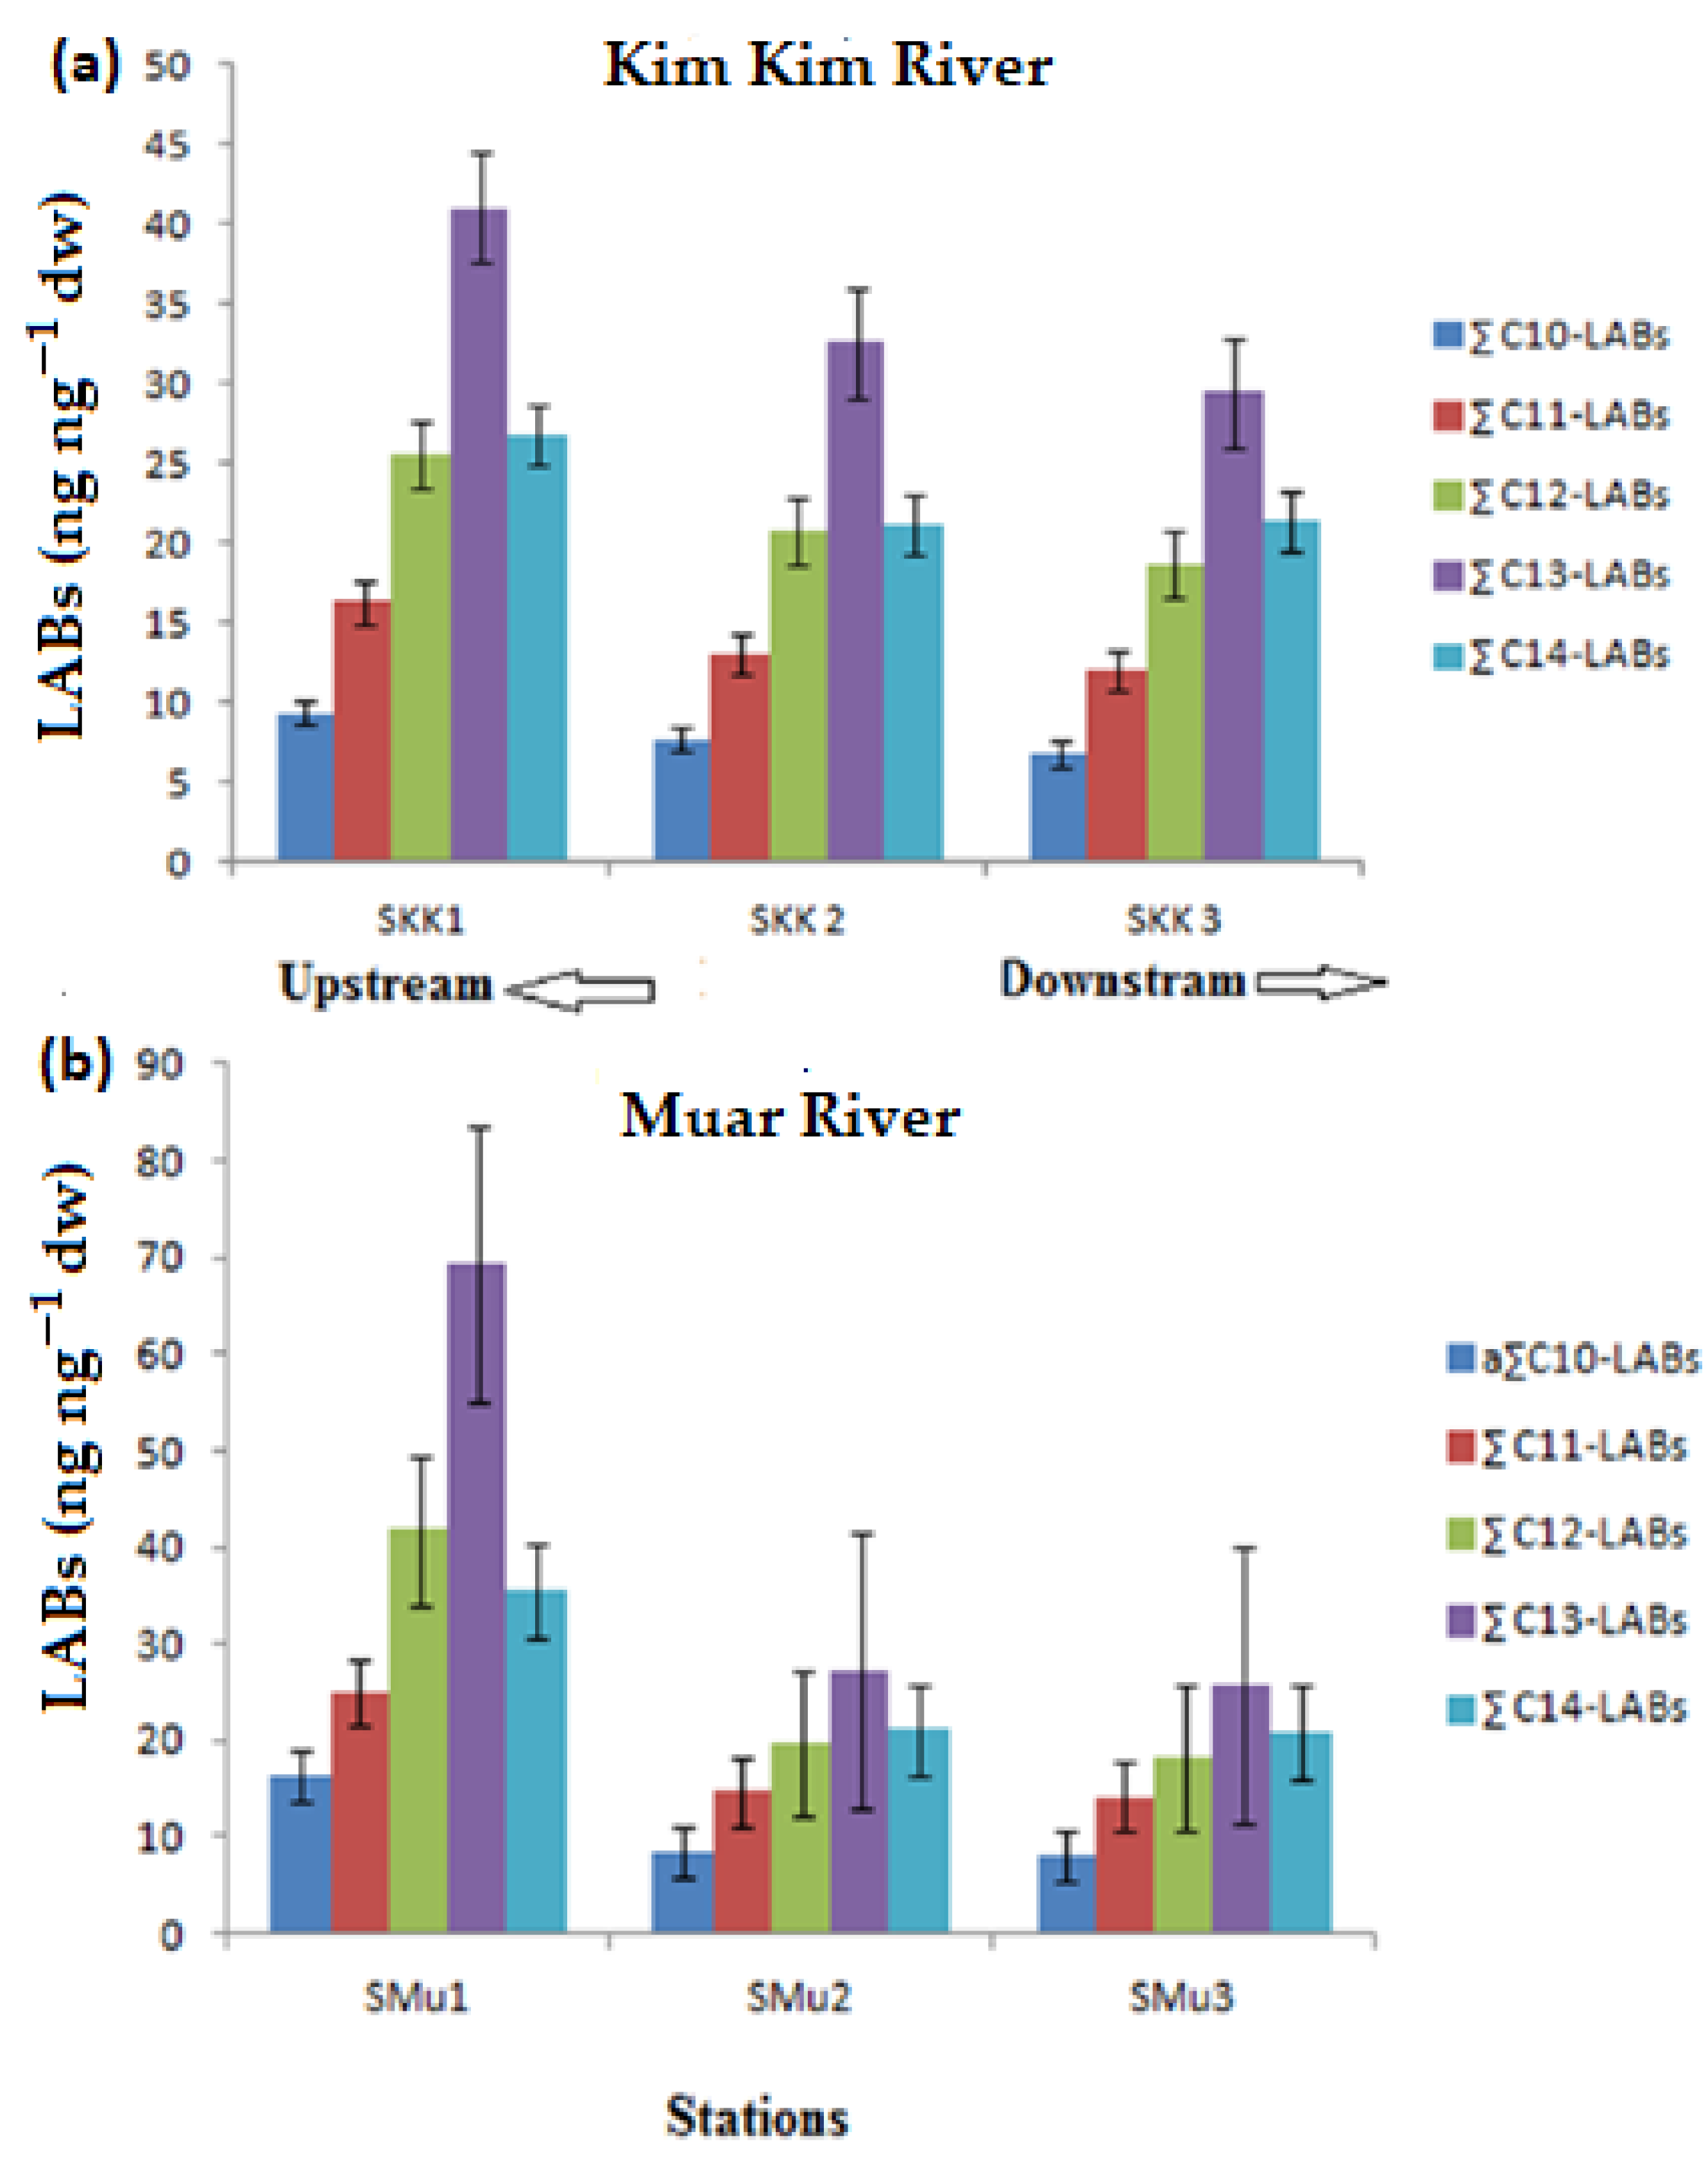
Figure 1. Compositional profile of LABs in (a) Kim Kim River sediments, and (b) the Muar River.
Water 15 02216 g001
Figure 2. Concentration of LABs in the Muar and Kim Kim river sediments. Standard error bars are shown. * Concentration is highly significant.
Water 15 02216 g002
Figure 3. Relationship between F1 and F2 components for measurement data.
Water 15 02216 g003
Figure 4. Dendrogram for data including organic fraction measurements for the Muar and Kim Kim rivers.
Water 15 02216 g004
Figure 5. Scatter plots of LABs and TOC in sediment samples of the Muar and Kim Kim river sediments.
Water 15 02216 g005
Figure 6. Relationship of (a) the C10 with (I/E), (b) the C11 with (I/E) (c) the C12 with (I/E), (d) the C13 with (I/E), and (e) the C14 with (I/E) (where: C10 = C10 − Labs; C11 = C11 − Labs; C12 = C12 − Labs; C13 = C13 − Labs; C14 = C14 − Labs).
Water 15 02216 g006
Figure 7. Values of the C13/C12, L/S, and I/E ratios in the samples of the Muar and Kim Kim rivers.
Water 15 02216 g007
Table 1. Sampling sites along the Muar and Kim Kim rivers.
Sample NameGeographical CoordinationLocation TypeWeather ConditionSite Description
SMu1N 02°04′06.0″ E 102°33′18.1″RiverCloudyUrban and industry area
SMu 2N 02°03′34.9″ E 102°34′27.0″RiverCloudyUrban and industry area
SMu 3N 02°03′18.0″ E 102°32′23.9″RiverCloudyUrban and industry area
SKK1N 01°27′28.2″ E 103°57′76.2″RiverRainyUrban and industry area
SKK2N 01°26′77.6″ E 103°58′04.6″RiverRainyUrban and industry area
SKK3N 01°25′09.6″ E 103°58′3.31″RiverRainyUrban and industry area
Table 2. LABs concentration (ng·g−1·dw) and relative ratios in the Muar and Kim Kim Rivers.
Compoundb SMu1SMu2SMu3SKK1SKK2SKK3
a C10-LABs (ng·g−1dw)16.48.48.29.47.76.8
C11-LABs (ng·g−1dw)25.014.814.216.313.012.0
C12-LABs (ng·g−1dw)41.819.718.325.620.718.6
C13-LABs (ng·g−1dw)69.427.225.841.032.629.5
C14-LABs (ng·g−1dw)35.521.120.926.821.121.3
LABs (ng.g−1dw)188.191.287.411995.288.3
c I/E2.21.71.72.01.81.7
d L/S2.672.021.992.42.52.6
e C13/C126.714.184.155.15.25.2
f LAB Degradation (%)433333383533
g TOC(%)2.52.21.41.21.08.1
TOC (mg/g)25.422.213.811.59.081
Note(s): a C10-LAB. Sum of the 26LAB congeners ranging from 5-C10 to 2-C10; b SMu1, the first letter indicates the station, the second and third letters represent the first letters of location name, the numbers 1,2,3,4, indicate the sample number; c I/E (C12-LABs), ratio of (6-C12LAB + 5-C12LAB) relative to (4-C12LAB + 3-C12LAB + 2-C12LAB); d L/S, ratio of (5-C13LAB + 5-C12LAB) relative to (5-C11LAB + 5-C10LAB); e C13/C12, ratio of (6-,5-,4-,3- and 2-C13/(6-, 5-, 4-, 3-, and 2-C12LAB); f LAB Degradation (%), LAB deg = 81 × log (I/E ratio) + 15 (r2 = 0.96); g TOC (%), Total organic carbon.
Table 3. Correlation coefficients (R) between measurement data.
C11C12C13C14LabsI/EL/SC13/C12LabdegrTOC
C101.0000.7140.5430.5510.7140.6980.0860.1160.6980.029
C11 0.7140.5430.5510.7140.6980.0860.1160.6980.029
C12 0.9430.8121.0000.9410.6000.6670.9410.143
C13 0.8950.9430.9410.7710.8120.9410.029
C14R 0.8120.7700.7830.7500.7700.348
Labs>0.9very strong 0.9410.6000.6670.9410.143
I/E0.7–0.9strong 0.5770.6471.0000.213
L/S<0.7medium 0.9860.5770.429
C13/C122 0.6470.290
Labdegr 0.213
Table 4. Overall analysis of variance for surface sediments of the Muar and Kim Kim rivers.
SourceDFSum of SquareMean SquareF ValueSig *
Side192,278.399227.3910.11<0.05
Locations2114,597.322291.4650.20<0.05
Error250.000.00
Corrected Total6143,098.47
Note(s): * Correlation is significant at the 0.05 level.
Table 5. Total concentrations of LABs from different areas around Malaysia and the world.
LocationNMaximum LABs (ng/g) aI/E Ratio bDegradation c (%)Reference
South Atlantic Estuary152102.547[44]
Southern Brazil315.31.427[43]
Humber Estuary and Wash, UK1884.82.141[45]
Anzali Wetland, Iran167109,0001.324[41]
Malacca, Malaysia110802.039[42]
Muar River, Malaysia1322.851[42]
Penang Estuary, Malaysia130001.529[42]
Prai River, Malaysia1253.458[42]
Kim Kim River, Malaysia11221.836[42]
Kim Kim Estuary, Malaysia161.221[42]
Nibong Tebal, Malaysia11682.141[42]
Indonesia2042,6002.141[42]
Sarawak River, Malaysia973901.015[29]
SembulanRiver, Malaysia655701.836[29]
Zhujiang River1123301.529[40]
Dongjiang River105661.938[40]
Xijiang River869.4115[40]
Pearl River Estuary8261.529[40]
South China Sea28230.911[40]
The Pearl River Delta9611,2001.734[46]
Santos Bay, Brazil141172.955[47]
Dongjiang River454101.427[48]
Outfalls of paper mills332701.324[48]
Jakarta Bay786,8000.912[49]
Tokyo Bay211102.851[49]
Detergents105,300,0001.734[45]
Note(s): a LAB = sum of concentrations of all secondary LAB congeners having C10–C14 alkyl chain; b I/E = (6_C12 + 5_C12)/4_C12 + 3_C12 + 2_C12); c LAB deg = 81 × log (I/E ratio) + 15 (r2 = 0.96); N The number of samples.
Disclaimer/Publisher’s Note: The statements, opinions and data contained in all publications are solely those of the individual author(s) and contributor(s) and not of MDPI and/or the editor(s). MDPI and/or the editor(s) disclaim responsibility for any injury to people or property resulting from any ideas, methods, instructions or products referred to in the content.