Article

Investigating the Reliability of Stationary Design Rainfall in a Mediterranean Region under a Changing Climate

by
Dario Treppiedi
,
Giuseppe Cipolla
*,
Antonio Francipane
,
Marcella Cannarozzo
and
Leonardo Valerio Noto
Department of Engineering, University of Palermo, 90128 Palermo, Italy
*
Author to whom correspondence should be addressed.
Water 2023, 15(12), 2245; https://doi.org/10.3390/w15122245
Submission received: 10 May 2023 / Revised: 7 June 2023 / Accepted: 13 June 2023 / Published: 15 June 2023
(This article belongs to the Section Hydrology)

Abstract

:
Extreme rainfall events have been more frequent in recent decades, potentially as a climate change effect. This has been leading to a higher risk of the failure of existing hydraulic infrastructures, and to a higher awareness regarding the unreliability of design rainfall calculated with reference to historical data recorded in the last century. With this in mind, the present study questions the stationary assumption of the rainfall Depth–Duration–Frequency curves commonly used in Sicily, the biggest island of the Mediterranean Sea. Quantiles derived from the most up-to-date regional method, regarding Sicily, based on observations in the period 1928–2010, have been compared with those extracted from a high-resolution dataset related to the period 2002–2022, provided by the SIAS agency. The results showed a remarkable underestimation of the rainfall quantiles calculated with the regional approach, especially at the shortest durations and low return periods. This means that new hydraulic works should be designed with reference to longer return periods than in the recent past, and those that currently exist may experience a higher risk of failure. Future investigation of this aspect is crucial for enhancing the effectiveness of water management and detecting hydrological risks under a changing climate.

1. Introduction

The study of extreme precipitation events and the subsequent estimation of rainfall volumes that may fall on a given area are fundamental for different purposes, involving both research and the engineering profession. In recent years, the growing occurrence and severity of such events have increased the occurrence of natural disasters, such as floods and landslides, and exposed the susceptibility of infrastructures towards a state of “physiological insufficiency” [1,2]. In addition, the determination of hydraulic and geomorphological risk, which is fundamental for proper land-use planning, cannot disregard the knowledge of the pressure induced on the territory precisely by the extreme weather events [3,4].
The consequent need for accuracy in predicting extreme events often clashes with the complexity in modeling the physical processes that generate such events, mainly due to the difficulty in knowing and predicting the spatial and temporal distribution of meteoclimatic variables and their mutual interactions, as well as the influence of other factors such as orography and distance from the sea. Moreover, in terms of hydrological risk, the rise in the frequency of the most intense phenomena implies considering the non-stationarity of their occurrence and, in turn, of the classical frequency distribution parameters with which these events are interpreted [5]. This means that the concept of the return period should be revised to something that can no longer be considered a fixed entity but instead must vary over time.
Rainfall Depth–Duration–Frequency (DDF) curves, which provide precipitation quantiles for specific durations and return periods, are widely used in hydrology to estimate the design storm for urban drainage systems, water resources management, and flood risk assessment [6,7]. These curves are obtained by carrying out a statistical analysis of historical rainfall data (e.g., annual maxima or precipitation exceeding a fixed threshold) to identify the relationship between the depth (or intensity), duration, and frequency (or exceedance probability) of rainfall events. Traditionally, the design of hydraulic infrastructure and the management of water supply, irrigation systems, and hydropower have relied on conventional frequency analyses. These analyses estimate statistical parameters for a time series of a hydrological variable by assuming that the recorded series is stationary, which means that its statistical properties do not exhibit any trends, shifts, or periodicity [8]. Constructing accurate and reliable DDF curves is impossible without a sufficiently extensive rainfall dataset. Indeed, the probability distribution functions commonly used to rely on high-order sample statistic parameters can be estimated with confidence only if the available sample series has a significant length and the data source is reliable. Furthermore, DDF curves, typically derived from measurements taken at a specific location, such as a rain gauge, may not be applicable to other sites without rainfall data. To address this issue, a regional analysis approach is often employed [9,10], which divides the study area into different levels of regionalization based on geographic and hydrological homogeneity. This hierarchical procedure is designed to capture the spatial variability of various parameter statistics and is calibrated using available data from the entire study region, even for ungauged areas or those sites that do not have long enough records. For Sicily, the most up-to-date and valid regionalization analysis of heavy rainfall available is the one developed by [11]. This study used data recorded in the period 1928–2010 by the rain gauge network of the Autorità di Bacino (AdB) del Distretto Idrografico della Sicilia (Basin Authority of the Sicilian River Basin District), consisting of about 300 rain gauges uniformly distributed throughout the island. Specifically, the study started from a subdivision of the region into homogeneous zones through the selection of some supporting variables, such as meteo-climatic variables and site characteristics, followed by the identification of the probability distribution that best describes the precipitation quantiles for fixed duration, the analysis and modeling of the spatial variability of regional parameters, and, lastly, the creation of quantile maps for fixed return period and duration.
Regardless of whether they are at-site or regional DDF curves, recent studies have shown that the traditional approach of using stationary DDF curves may not be adequate for the design of hydraulic works or assessing hydrological risk in the context of possible climate change signals [12,13,14]. Changes in climate are altering weather circulation patterns, which are connected to precipitation fields [15] and may potentially lead to an increase in the frequency of occurrence and intensity of extreme rainfall events [16,17] and extend to other components of the hydrological balance, such as evapotranspiration and runoff [18,19]. Among the different regions of the globe, the Mediterranean area is particularly vulnerable to the impacts of climate change [20]; today it is considered a climate change hot spot [21] since it is expected to experience more frequent and severe droughts, floods, and heatwaves in the future. For instance, [22] reports that the highest summer temperature increase in Europe occurs in the Mediterranean Basin. Moreover, it is characterized by a complex topography and a high spatial and temporal variability of precipitation, which makes it challenging to estimate the intensity, duration, and frequency of rainfall events accurately [23]. In the past ten years, many studies concerning the Mediterranean region have indicated a widespread reduction in the mean annual precipitation (MAP) and winter precipitation [24,25], with an increase in the occurrence of intense rainfall events, both in frequency and severity, particularly at shorter time scales such as hourly and sub-hourly [26,27], especially during the late summer and autumn [28].
The main objective of this work is to verify if quantiles (or DDFs) obtained through a stationary approach (e.g., [11]) can be suitable to describe the precipitation regime of the last two decades in the Mediterranean area and, moreover, to understand if and how the stationary DDFs obtained with the regionalization proposed by [11] may be adjusted to take into account the climate change signals on intense rainfall. The analyses focus on Sicily, the largest island of the Mediterranean Sea, for which [29] first and [26] later proved an increase in precipitation intensity, especially for short durations, in the last two decades, potentially linked to climate change. This study presents a comparative analysis for different durations and return periods between the rainfall quantiles calculated with the regional approach by [11] and those estimated with an at-site analysis conducted on a rainfall dataset (i.e., annual maxima) obtained from the rain gauge network of the SIAS (Servizio Informativo Agrometeorologico Siciliano—Agrometeorological Information Service of Sicily), which has fewer rain gauges (about 100) than the AdB network, but acquires data with a higher temporal resolution (i.e., 10 min) since 2002. The analyses provide a useful benchmark to verify the influence of the last two decades on the rainfall regime of this area. Indeed, given that the SIAS data cover the last 20 years, which are also the years when climate change effects are more evident [18,19], any change in the DDF curves may be potentially related to it. To achieve this, the work aims to answer the following research questions: how representative of today’s climate can DDFs determined with regionalization and considering a stationary approach be?; and what are the implications of not considering non-stationarity in rainfall forcings for climate change adaptation plans in a region of the Mediterranean area?

2. Materials and Methods

This section reports the data and the methodology employed in the present study. After presenting the main characteristics of the study area (i.e., Sicily), we briefly describe the SIAS datasets and the regionalized DDF curves developed by [11] and used in this study. Then, the algorithms applied to carry out the comparative analysis between the two differently derived DDF curves are presented.

2.1. Study Area

Sicily (Italy) is the largest island in the Mediterranean Sea, with a surface of approximately 25,000 km2. The island’s topography ranges from sea level to over 3000 m a.s.l. at the Etna volcano. Precipitation exhibits notable spatial and temporal fluctuations. The MAP ranges from approximately 360 mm in the southeastern part of the island to roughly 1300 mm in the northeast region [30], with an overall mean of approximately 700 mm. In terms of temporal variation, rainfall is predominantly concentrated in the winter season, with the summer months (i.e., June, July, and August) mostly dry.

2.2. SIAS Rainfall Dataset and Regional DDFs

The precipitation dataset utilized in this research has been provided by the SIAS and is composed of precipitation time series recorded by about 100 rain gauges evenly distributed throughout the island. Rain gauge network meets the requirements established by the World Meteorological Organization (WMO) regarding site selection, data detection, management, and validation criteria. These factors ensure a high degree of uniformity in the rainfall time series. The gauges have been collecting rainfall data continuously at a 10 min resolution for approximately 20 years. Specifically, the data utilized in this study are related to the period from January 2002 to December 2022 (i.e., 21 years) only for 72 stations that have continuously acquired data in the selected time window. The gauges providing data for shorter periods have been discarded from all the analyses. Figure 1 depicts the location of all the rain gauges considered in this study, overlaid with the Digital Elevation Model (DEM) of the region.
The regional approach proposed by [11] defines precipitation quantiles for different durations and return periods for either gauged or ungauged areas of Sicily. Data collected by the rain gauge network of the AdB, in the period 1928–2010, were analyzed using a regional frequency analysis approach, which involves pooling data from multiple locations to estimate a spatial view of the probability of rare events. In particular, the quantile expression is:
H i , r d , T = μ i d h r d , T ,
where H i , r d , T represents the precipitation quantile for a certain duration and return period related to the i-th location belonging to a homogeneous region r. Hereafter, this will be referred to as h r e g for the sake of simplicity. The term μ i d in Equation (1) represents a scale factor identified for fixed duration at each location of the region, and h r d , T indicates the regional growth curve, evaluated as a function of the return period and depending on the homogeneous zone where the area of interest falls. In [11], Sicily is divided into six homogeneous regions, which were obtained by means of a cluster analysis aiming to group areas characterized by similar precipitation features (e.g., the average annual maxima rainfall depth with duration d, or the mean annual number of dry days) together. To derive the growth curve, for each homogeneous region, different statistical distributions were fitted to the annual maxima, such as the three-parameter log-normal distribution (LN3), the generalized extreme value (GEV) distribution, and the two-component extreme value (TCEV) distribution. Among them, the TCEV provided higher accuracies. The scale factor, μ i d was instead evaluated through a power law, as follows:
μ i d = a 24 d 24 n ,
in which a 24 and n are two parameters obtained by means of a linear regression with MAP. The study provided a spatial distribution of these two parameters for the whole of Sicily.

2.3. Methodology

2.3.1. Regional Quantile Exceedance Detection

Original 10 min SIAS time series were initially aggregated by means of a rolling window, which moves in a 10 min step, with an amplitude equal to different reference durations (i.e., 1, 3, 6, 12, and 24 h), thus generating what from now on will be referred as aggregated data series. After that, at the pixel where the SIAS gauges are located, regional rainfall quantiles, hereafter indicated as h r e g , were calculated according to the methodology developed by [11], using the TCEV distribution parameters, for the assessment of the regional growth curve and the spatial distributions of a24 and n for the evaluation of the scale factor. The h r e g have been derived for the reference durations and the return periods of 5, 10, and 20 years. We decided to consider a maximum return period of 20 years since SIAS data length is equal to 21 years, spanning the period from 2002 to 2022, which is not sufficient to apply a reliable probabilistic model for a return period greater than that.
Once the SIAS aggregated data series and the h r e g samples were available, it was possible to assess how many times the former exceeded the corresponding h r e g for each reference duration and return period. In order not to consider exceedances resulting from statistically dependent events of the aggregated data series, we imposed a criterion according to which two events of the aggregated data series are statistically independent if their interarrival time is at least 24 h. It is here noteworthy to highlight that such a condition might be too cautionary for 1 h duration events. Many papers, indeed, agree on the fact that short-duration and high-intensity rainfall events can be associated with convective precipitation [31,32,33], which dissipates very quickly. Therefore, it is likely that more convective cells may develop in the surroundings of the rain gauge within 24 h, forming independent events. For this reason, considering interarrival times less than 24 h, it is likely that results may be even more enhanced (in terms of the number of exceedances of h r e g ) at short durations. Another aspect we investigated is whether to consider more exceedances in the same year or to consider only the maximum exceedance. Since h r e g have been obtained from a set of annual maxima, thus from a sample composed of one single value per year, for a homogeneous comparison we imposed a condition that if more exceedances of h r e g occur in the same year, only the one characterized by the maximum exceedance is considered. This basically corresponds to considering the exceedance of the SIAS annual maxima with respect to h r e g . This at-site comparison has been carried out for all the SIAS rain gauges to obtain a spatial representation of the number of h r e g exceedances.
Once the number of h r e g exceedances is known, it was possible to compare it with the expected number of exceedances that is likely to occur under a stationary occurrence of the extremes. For example, if considering a return period of 5 years in a time window of 20 years, the expected number of exceedances would be equal to 4. In other words, if Y is a random variable denoting the number of exceedances of a fixed rainfall depth in a n-year period, its Probability Density Function (PDF) is given by a binomial distribution as in the following:
P Y = y = n y p y 1 p n y
In Equation (3), p is the exceedance probability, which is equal to the inverse of return period p = T−1. The PDF of the binomial distribution, which is valid only if the probability of more than one occurrence per year is null, provides the probability that y T-year events occur exactly in n successive years. Assuming T = 5, the mode value is 4 in a period of 20 years.

2.3.2. Quantile Comparison and Revision of the Return Periods

After the previous analysis, rainfall annual maxima for the reference durations in the period 2002–2022 have been extracted from the SIAS aggregated data series at the 72 rain gauges considered. Then, for each rain gauge, the Gumbel (Extreme value type I—EV1) distribution [34] has been fitted to the annual maxima sample. The EV1, which is a statistical distribution function simpler than those used by [11], has been applied here due to the limited sample size. The goodness of fitting of the EV1 to the SIAS annual maxima has been verified by means of the Kolmogorov–Smirnov (K–S) test [35], using the one sample version. The null hypothesis affirms that the sample data is drawn from the specified distribution. The test identifies the maximum difference between the empirical and the theoretical Cumulative Distribution Functions (CDFs) and rejects the null hypothesis if this is greater than a critical value, which depends on the significance level (typically 0.05) and the number of data points of the empirical CDF. Alternatively, it calculates a p-value as a function of the maximum difference between the empirical and the theoretical CDFs and compares it with the chosen significance level. The null hypothesis is rejected if the p-value is less than the significance level, and in this situation the sample data is not drawn from the specified distribution. If the p-value is greater than the significance level, the null hypothesis cannot be rejected; thus the sample data is drawn from the selected distribution.
After adapting the EV1 distribution to the SIAS annual maxima, and verifying the goodness of fitting, quantiles have been extracted for reference durations and the return periods of 5, 10, and 20 years as:
h T d = b d a d l n l n T T 1 ,
where a d and b d represent the parameters of the statistical distribution function estimated by means of the Maximum Likelihood Estimation (MLE) at each considered duration and T represents the return period. Since the fitting of the EV1 distribution has been carried out separately for each rain gauge, we have 72 values of the a d and b d parameters for each reference duration, which allowed us to obtain the precipitation quantiles for the three selected return periods and the reference durations. For the sake of simplicity, hereafter h T d are indicated as h S I A S .
A comparison between the two sets of return periods associated to the regional and the SIAS quantiles (i.e., h r e g and h S I A S , respectively) has been carried out. In other words, the return period of h r e g (i.e., the imposed 5, 10, or 20 years for which h r e g is derived), which can be called T r e g , has been compared with the return period, derived by inverting Equation (4) and imposing h T d = h r e g , here referred to as T S I A S . Given that the parameters of the EV1 distribution (i.e., a and b ) are calculated with the SIAS annual maxima, which refer just to the last two decades (i.e., from 2002 to 2022), such a comparison makes it possible to highlight if rainfall events characterized by a certain T r e g , expressed with reference to data mainly recorded in the last century (i.e., from 1928 to 2010), have been occurring more (or less) frequently in the last twenty years. Pooling the T S I A S achieved for all 72 gauges, we derived the corresponding empirical distribution functions for all the reference durations and the three T r e g values. Considering that under the stationary condition of extremes occurrence, the mode of the empirical distribution functions of T S I A S should match the corresponding T r e g , any difference between them can be considered as the result of a different frequency of occurrence of events. In other words, if precipitation extremes have become more frequent in recent decades in the Mediterranean area, as many studies affirm [18,25], potentially as a climate change effect, it is to be expected that their return period (i.e., the mode of T S I A S statistical distribution) is lower than T r e g .

3. Results and Discussion

3.1. Regional Quantile Exceedance

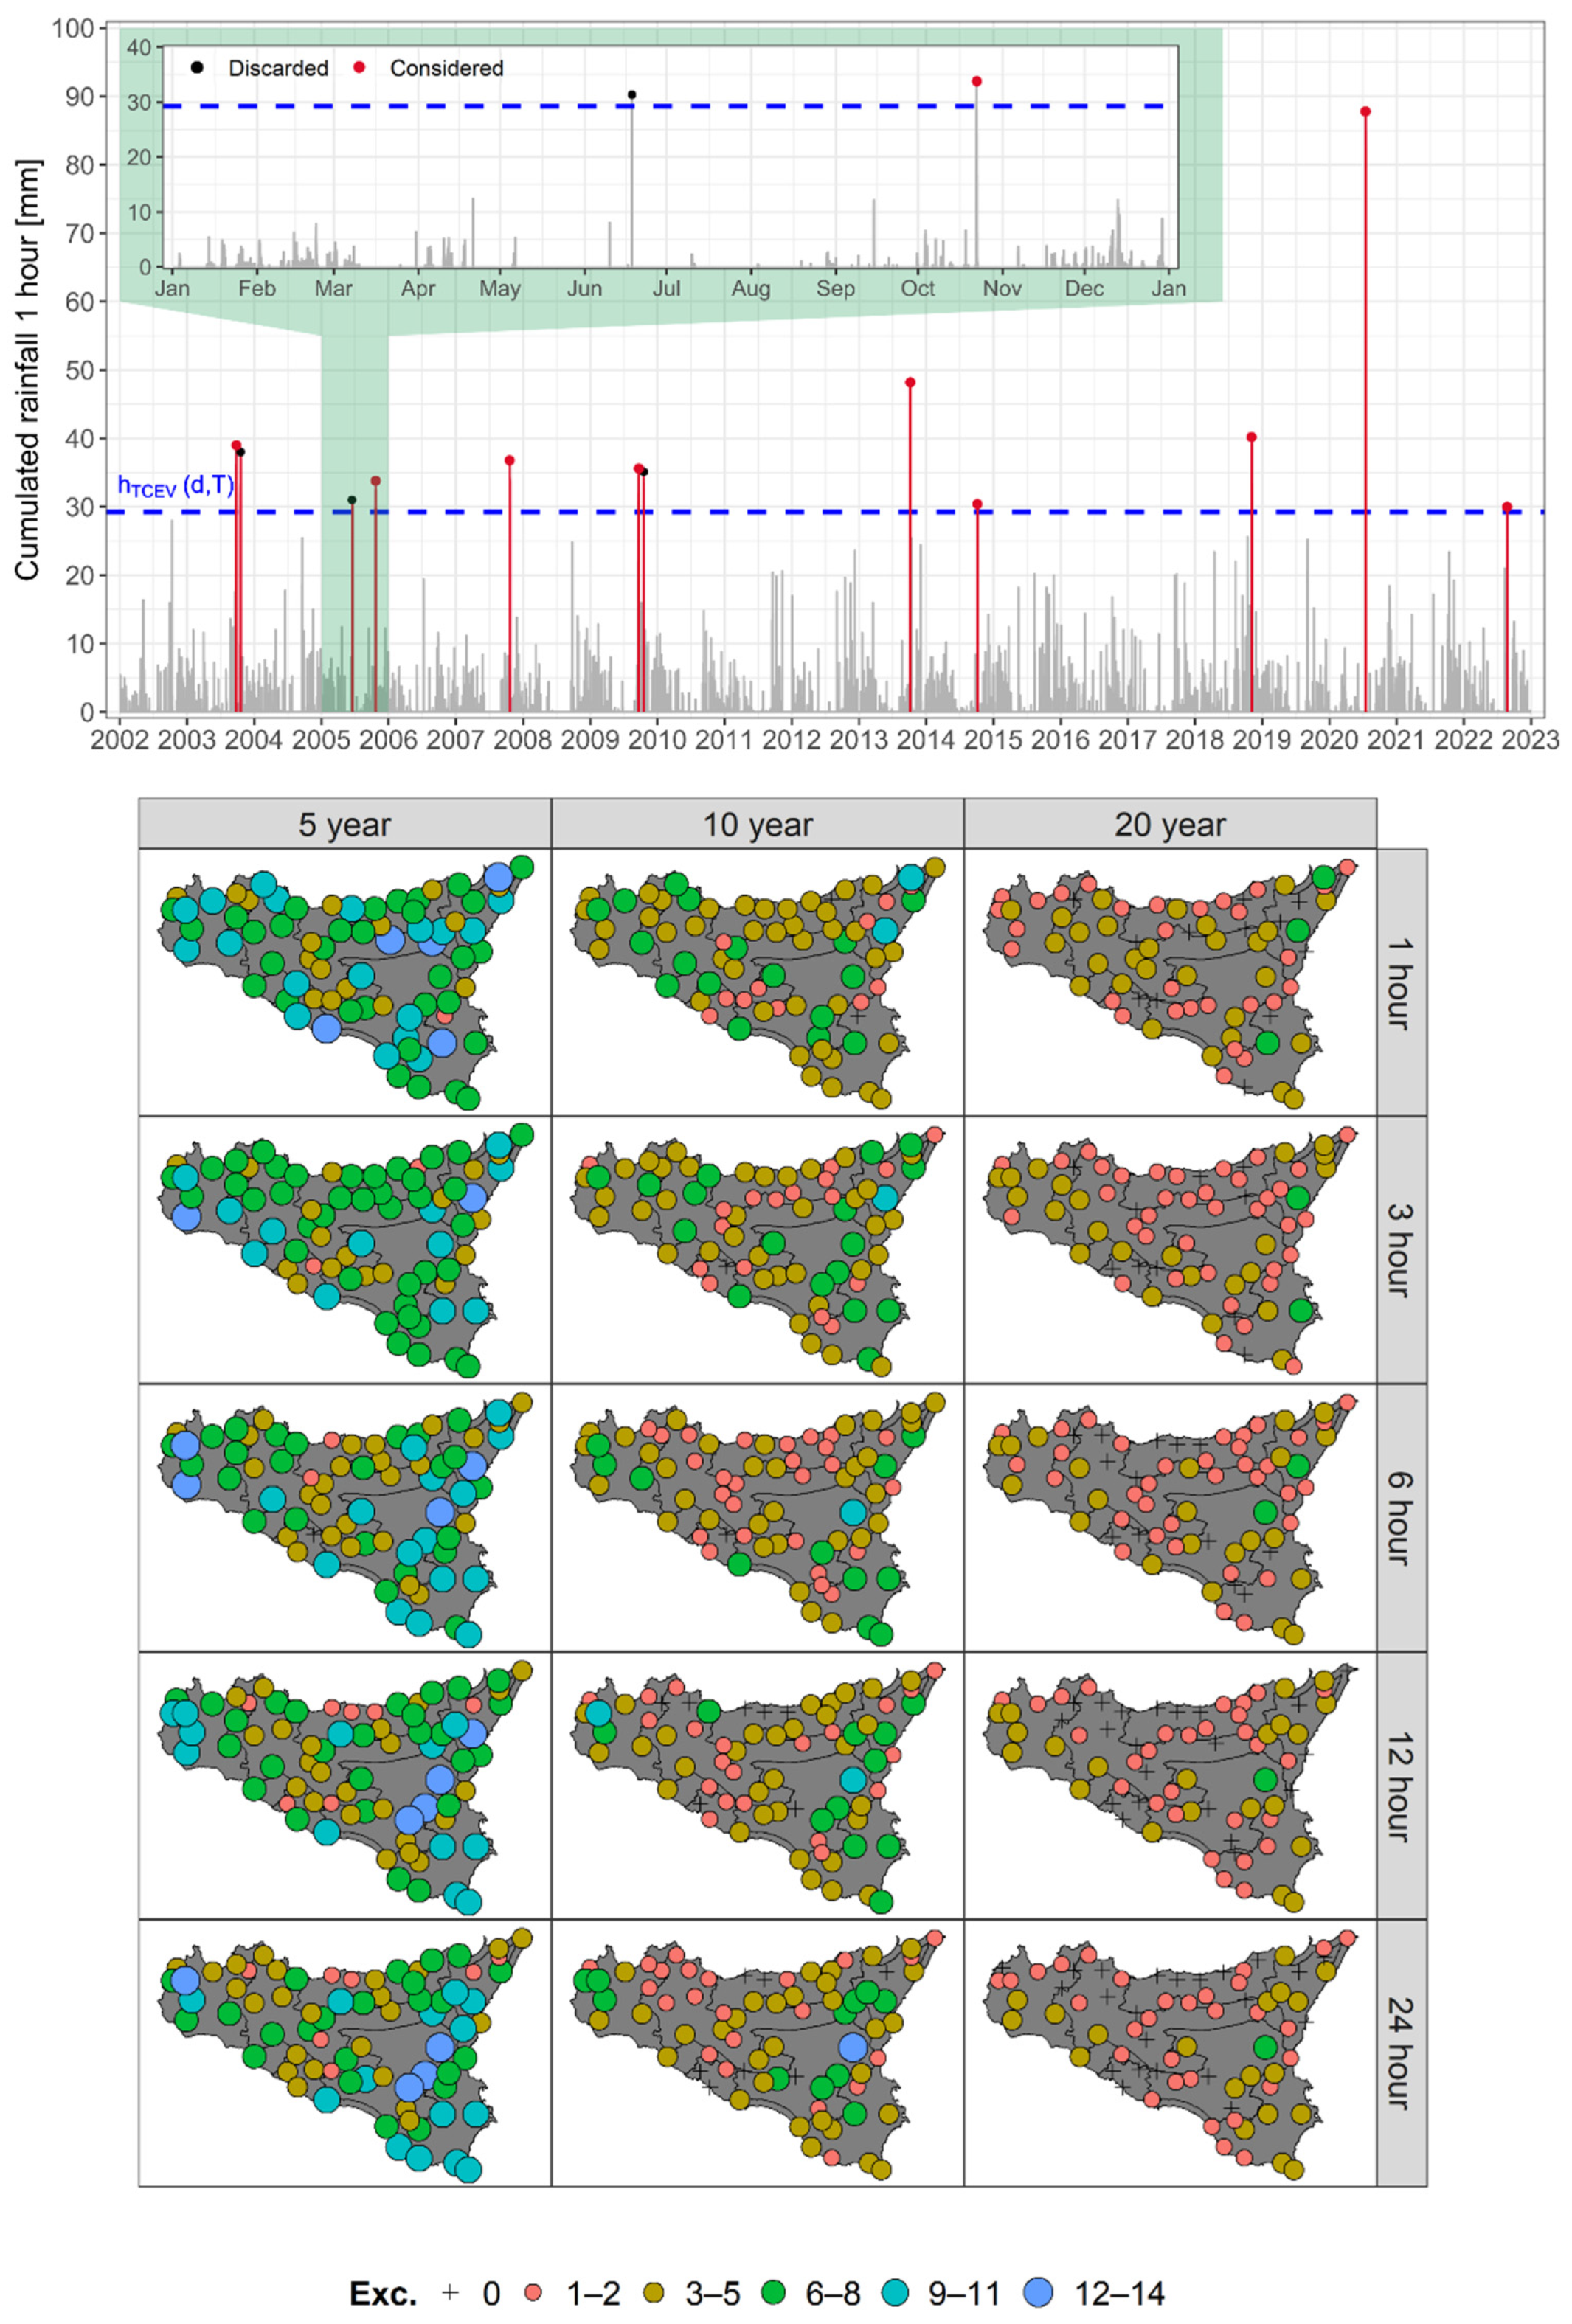
The first analysis concerns the comparison between the SIAS aggregated data series at the reference durations and the h r e g , with the goal of understanding if the latter quantiles, calculated with a stationary approach, are suitable to describe the precipitation regime of the last two decades. The upper panel of Figure 2 shows the at-site comparison between the aggregated data series of the SIAS rain gauge named “Palermo” and the h r e g relative to a 5-year return period and 1 h duration. Looking at the figure, it is possible to highlight that the h r e g (i.e., dashed blue line in the figure) was exceeded nine times. Within a 20-year time window and with reference to a 5-year return period, this value is more than double the expected exceedances relative to stationary conditions, which is equal to 4. Particularly, the focus on the events that occurred during 2005 in Figure 2 shows that if two or more exceedances occur in the same year, only the greatest one, as compared to the h r e g , is considered.
In the lower panel of Figure 2, we show the spatial distribution of the number of exceedances of the SIAS aggregated data series with respect to h r e g for different durations, in the rows, and return periods, in the columns. To different degrees, the outcomes described for the station of “Palermo” are also marked all over the region. With reference to the return period of 5 years (first column), almost all the gauges present an exceedance largely higher than that expected in 20 years, even reaching more than 12 in eastern Sicily. Although this result is remarkable for all the reference durations, it is evident how the number of exceedances is on average higher throughout the lowest durations (e.g., 1 and 3 h). For the 10-year return period, similar conclusions, although in a less evident way, can be drawn, keeping in mind that this time an average of two exceedances of the quantile is expected in the considered 20-year time window. Looking instead at the results related to the 20-year return period, fewer gauges show a few exceedances of h r e g higher than the expected, although this aspect is most likely due to the limited length of the SIAS annual maxima time series (i.e., 21 years from 2002 to 2022), as already stressed in Section 2.3.1.
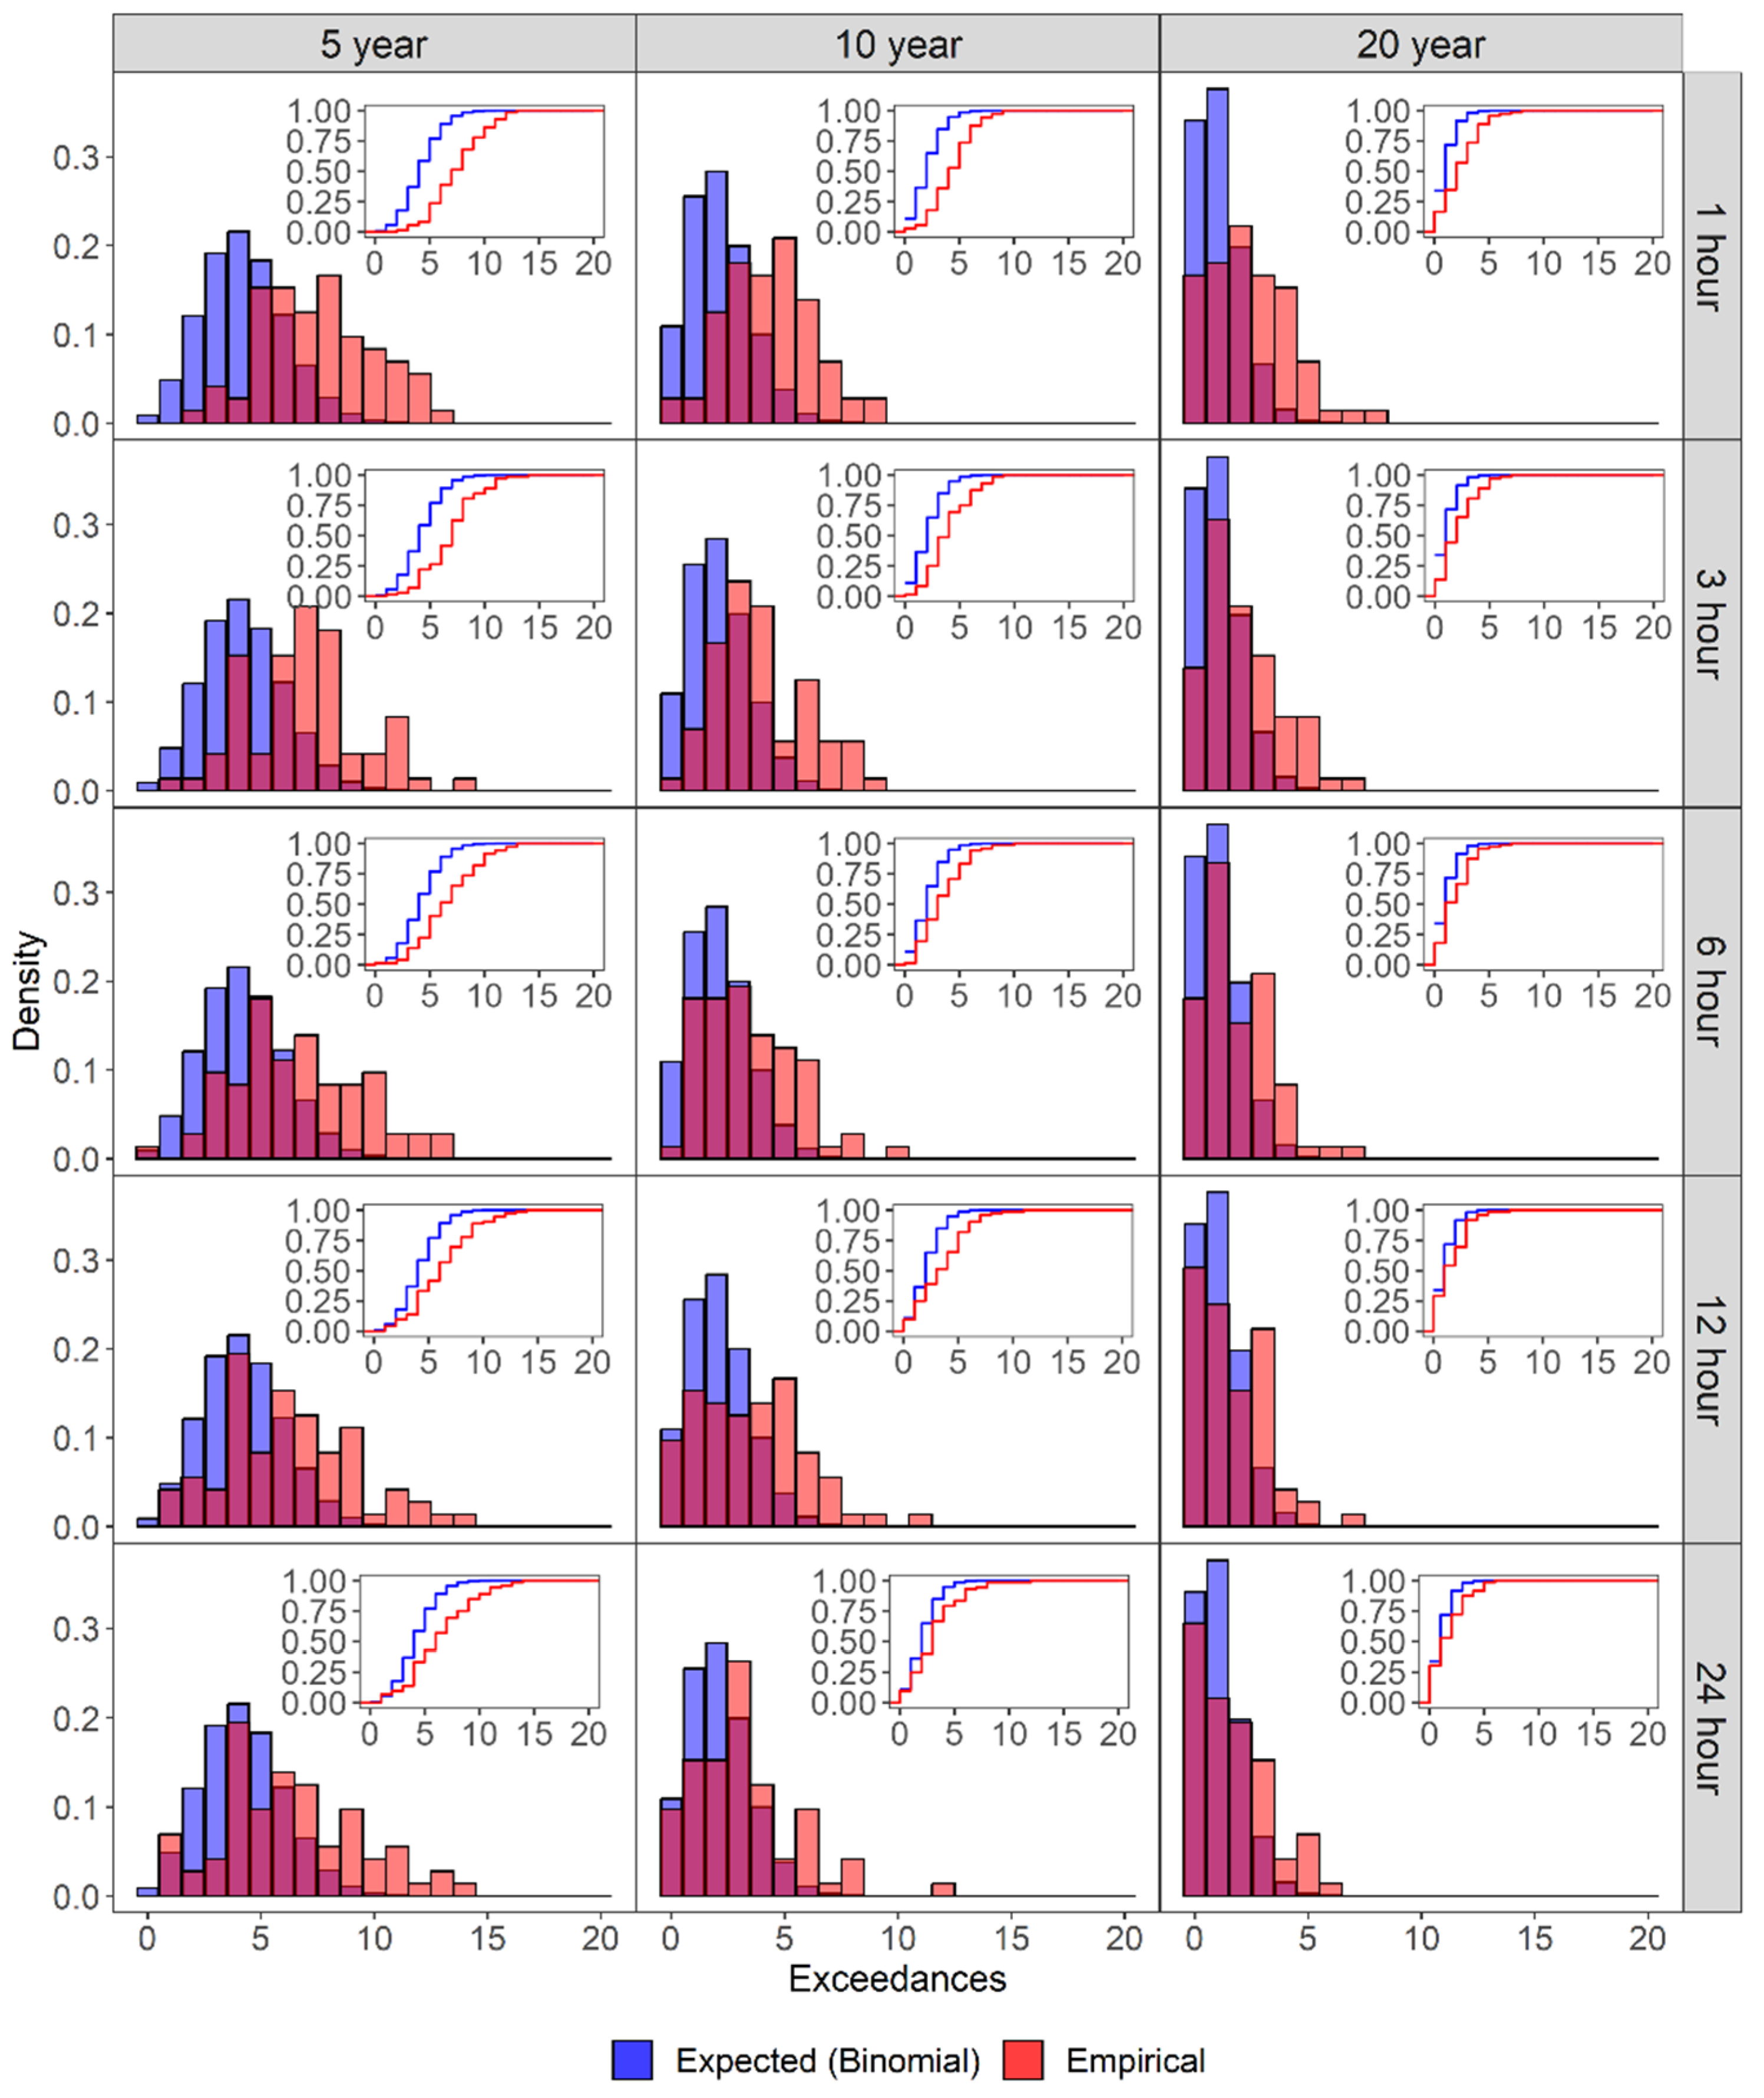
The number of h r e g ’s exceedances has been compared to the expected one, which can be distributed according to the binomial distribution, as explained in Section 2.3.1. Figure 3 shows the PDFs of the binomial statistical distribution (i.e., histogram in blue) and of the number of h r e g ’s exceedances (i.e., histogram in red), for the reference durations, in the rows, and return periods, in the columns. What might look like a third different color in the figure is due to the overlap of the two histograms. In each plot we also add a small panel representing the cumulative distribution functions for the binomial and the empirical distributions, in order to make the comparison easier in terms of probabilities. From the comparison of the two PDFs, it can be observed that, especially at the lower durations and return periods, the peak (e.g., mode values) of the empirical distribution of the h r e g ’s exceedances is shifted towards higher values of exceedances with respect to the mode of the binomial distribution, while for longer durations these differences are less emphasized. To be clearer, considering a 5-year return period within a 20-year time window and under stationary conditions, the mode of the binomial distribution would correspond to 4 exceedances. However, at 1 and 3 h durations, for instance, the peaks of the empirical distribution are, respectively, 6 and 7 exceedances. This means that, over the whole region, for these durations and return period, the SIAS aggregated data series tend to exceed more than expected the corresponding h r e g .

3.2. Revision of the Return Periods Defined with the Regional Approach

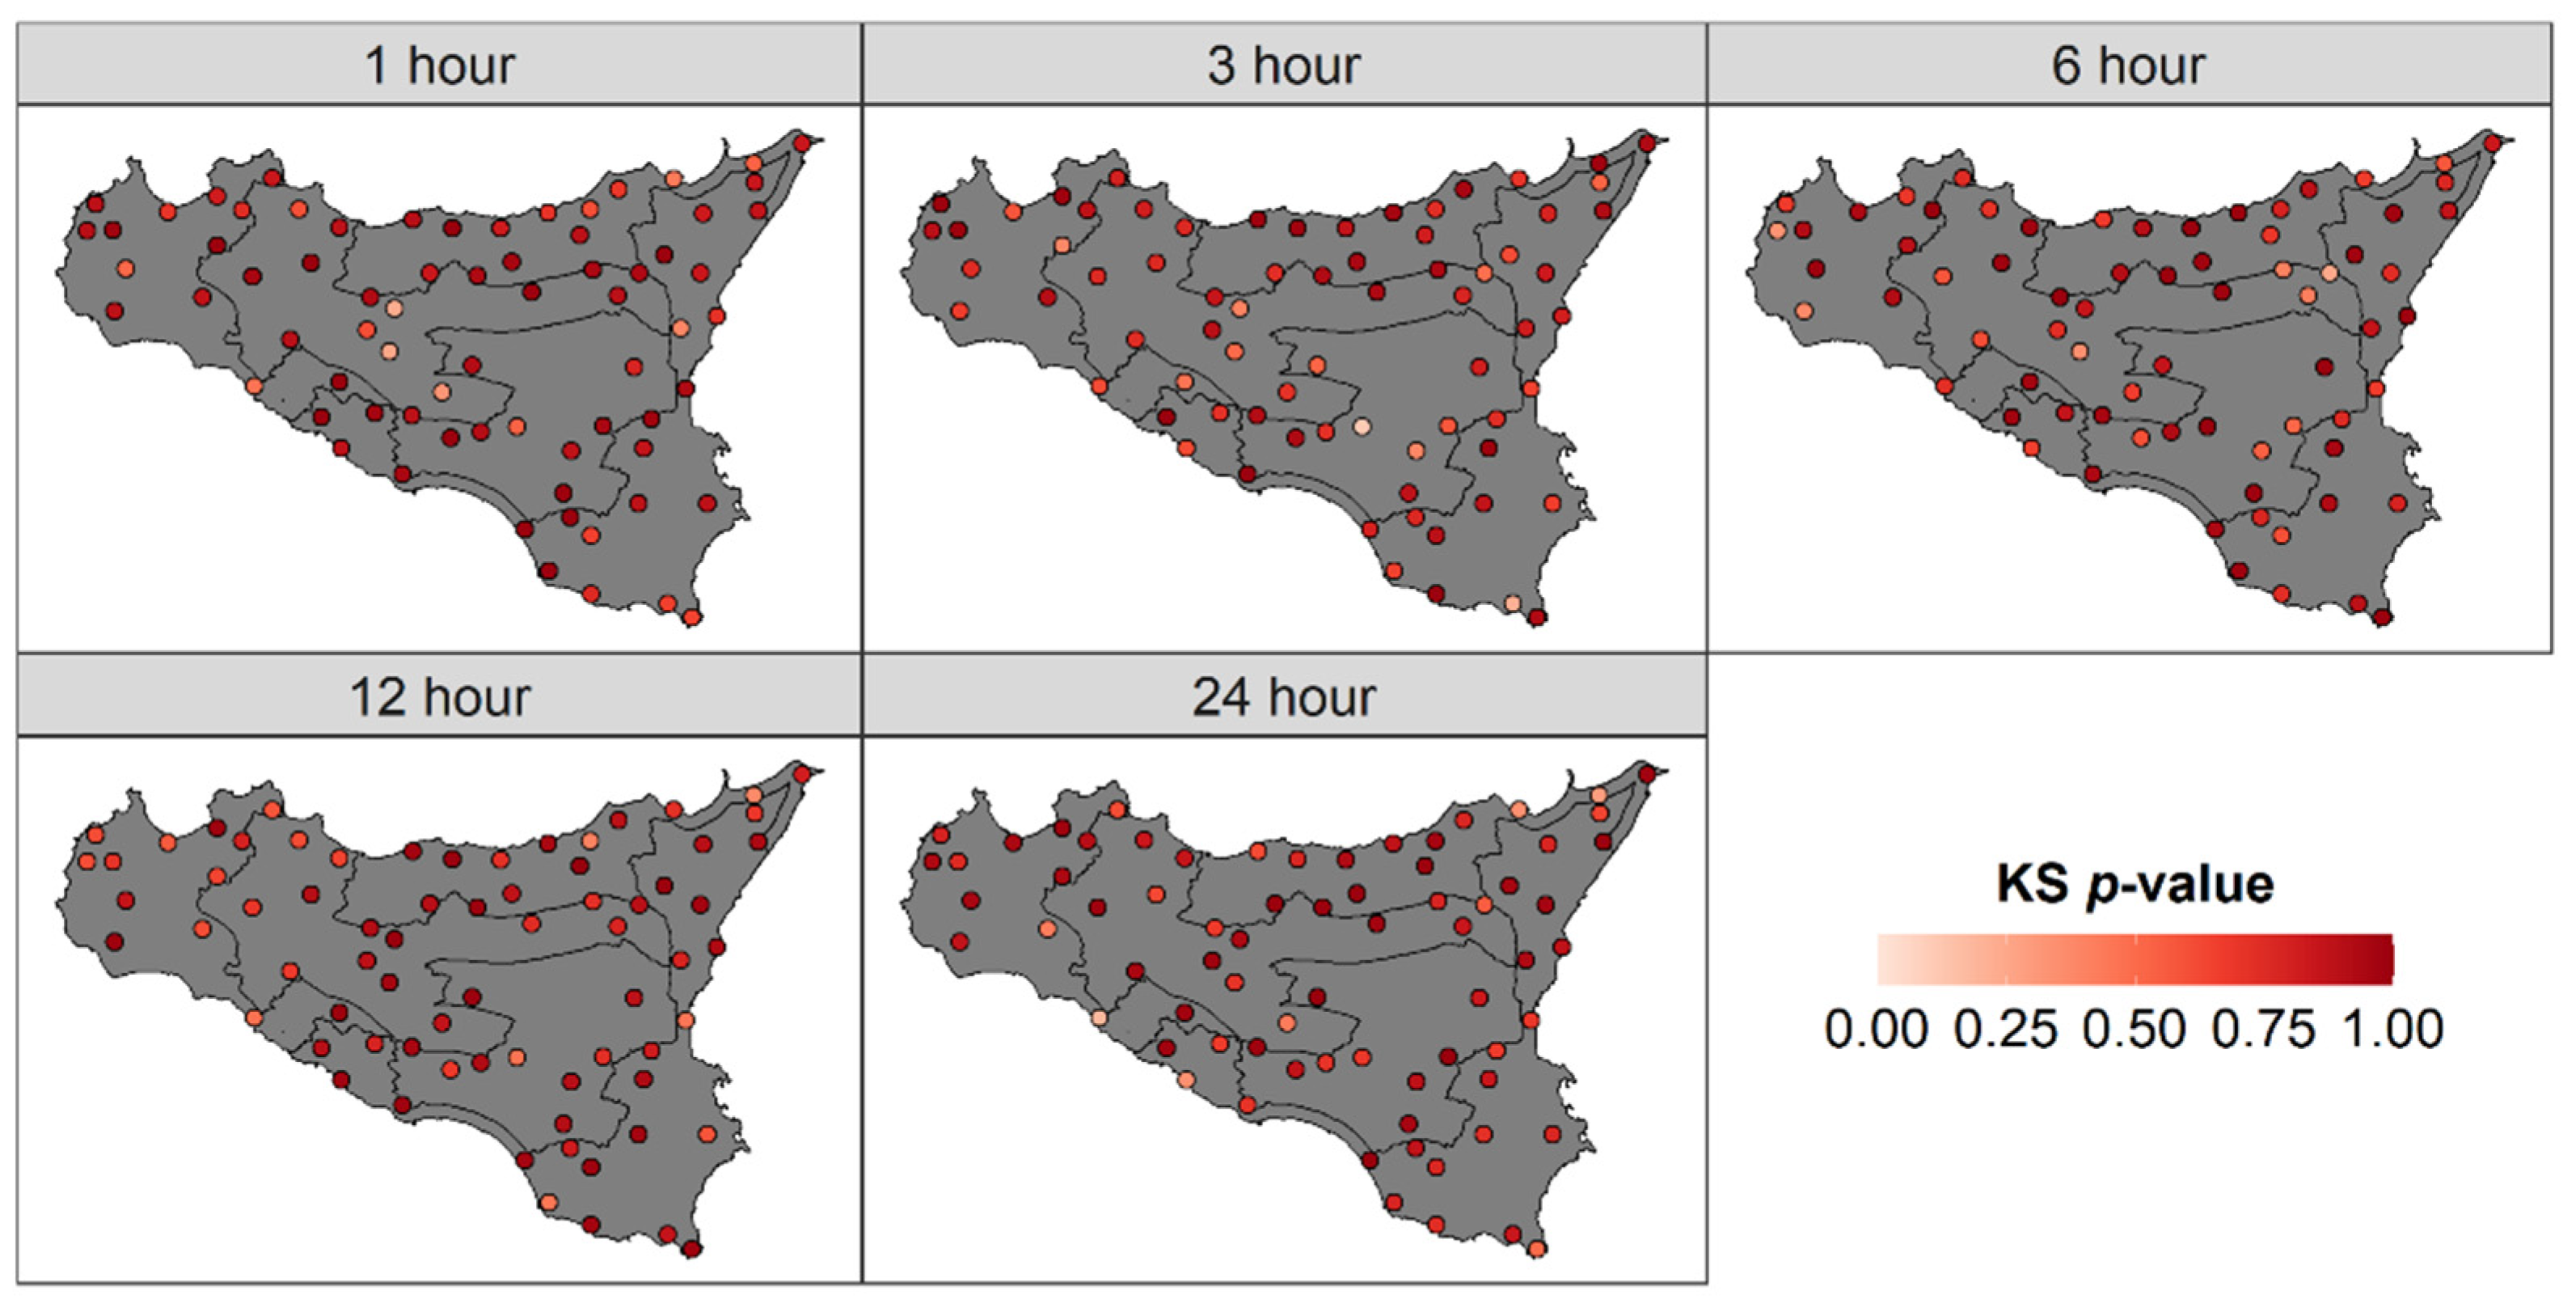
Since the previous analysis resulted in a number of exceedances of the h r e g remarkably higher than the expected value, especially at the lower durations and return periods, we carried out an at-site comparison between h r e g and h S I A S to investigate if quantiles obtained through a stationary approach (e.g., h r e g ) can be suitable to describe the precipitation regime of the last two decades in the Mediterranean area. After extracting the annual maxima from the SIAS aggregated data series, as described in Section 2.3.2, the Gumbel distribution has been fitted with the annual maxima sample referred to each of the 72 considered rain gauges and the goodness of fitting has been performed through the K–S test. Figure 4 shows, for the reference durations, the spatial distribution of the p-value resulting from the application of the K–S test with a significance level of 0.05. As it is possible to note, this resulted in an overall good fitting of the distribution function to the annual maxima. In particular, it can be inferred that for most of the stations it is not possible to reject, with a sufficient degree of significance, the null hypothesis, according to which the data sample belongs to the theoretical distribution used. The high p-values achieved all over the region made it possible to use the Gumbel distribution to estimate theoretical rainfall quantiles from the SIAS annual maxima.
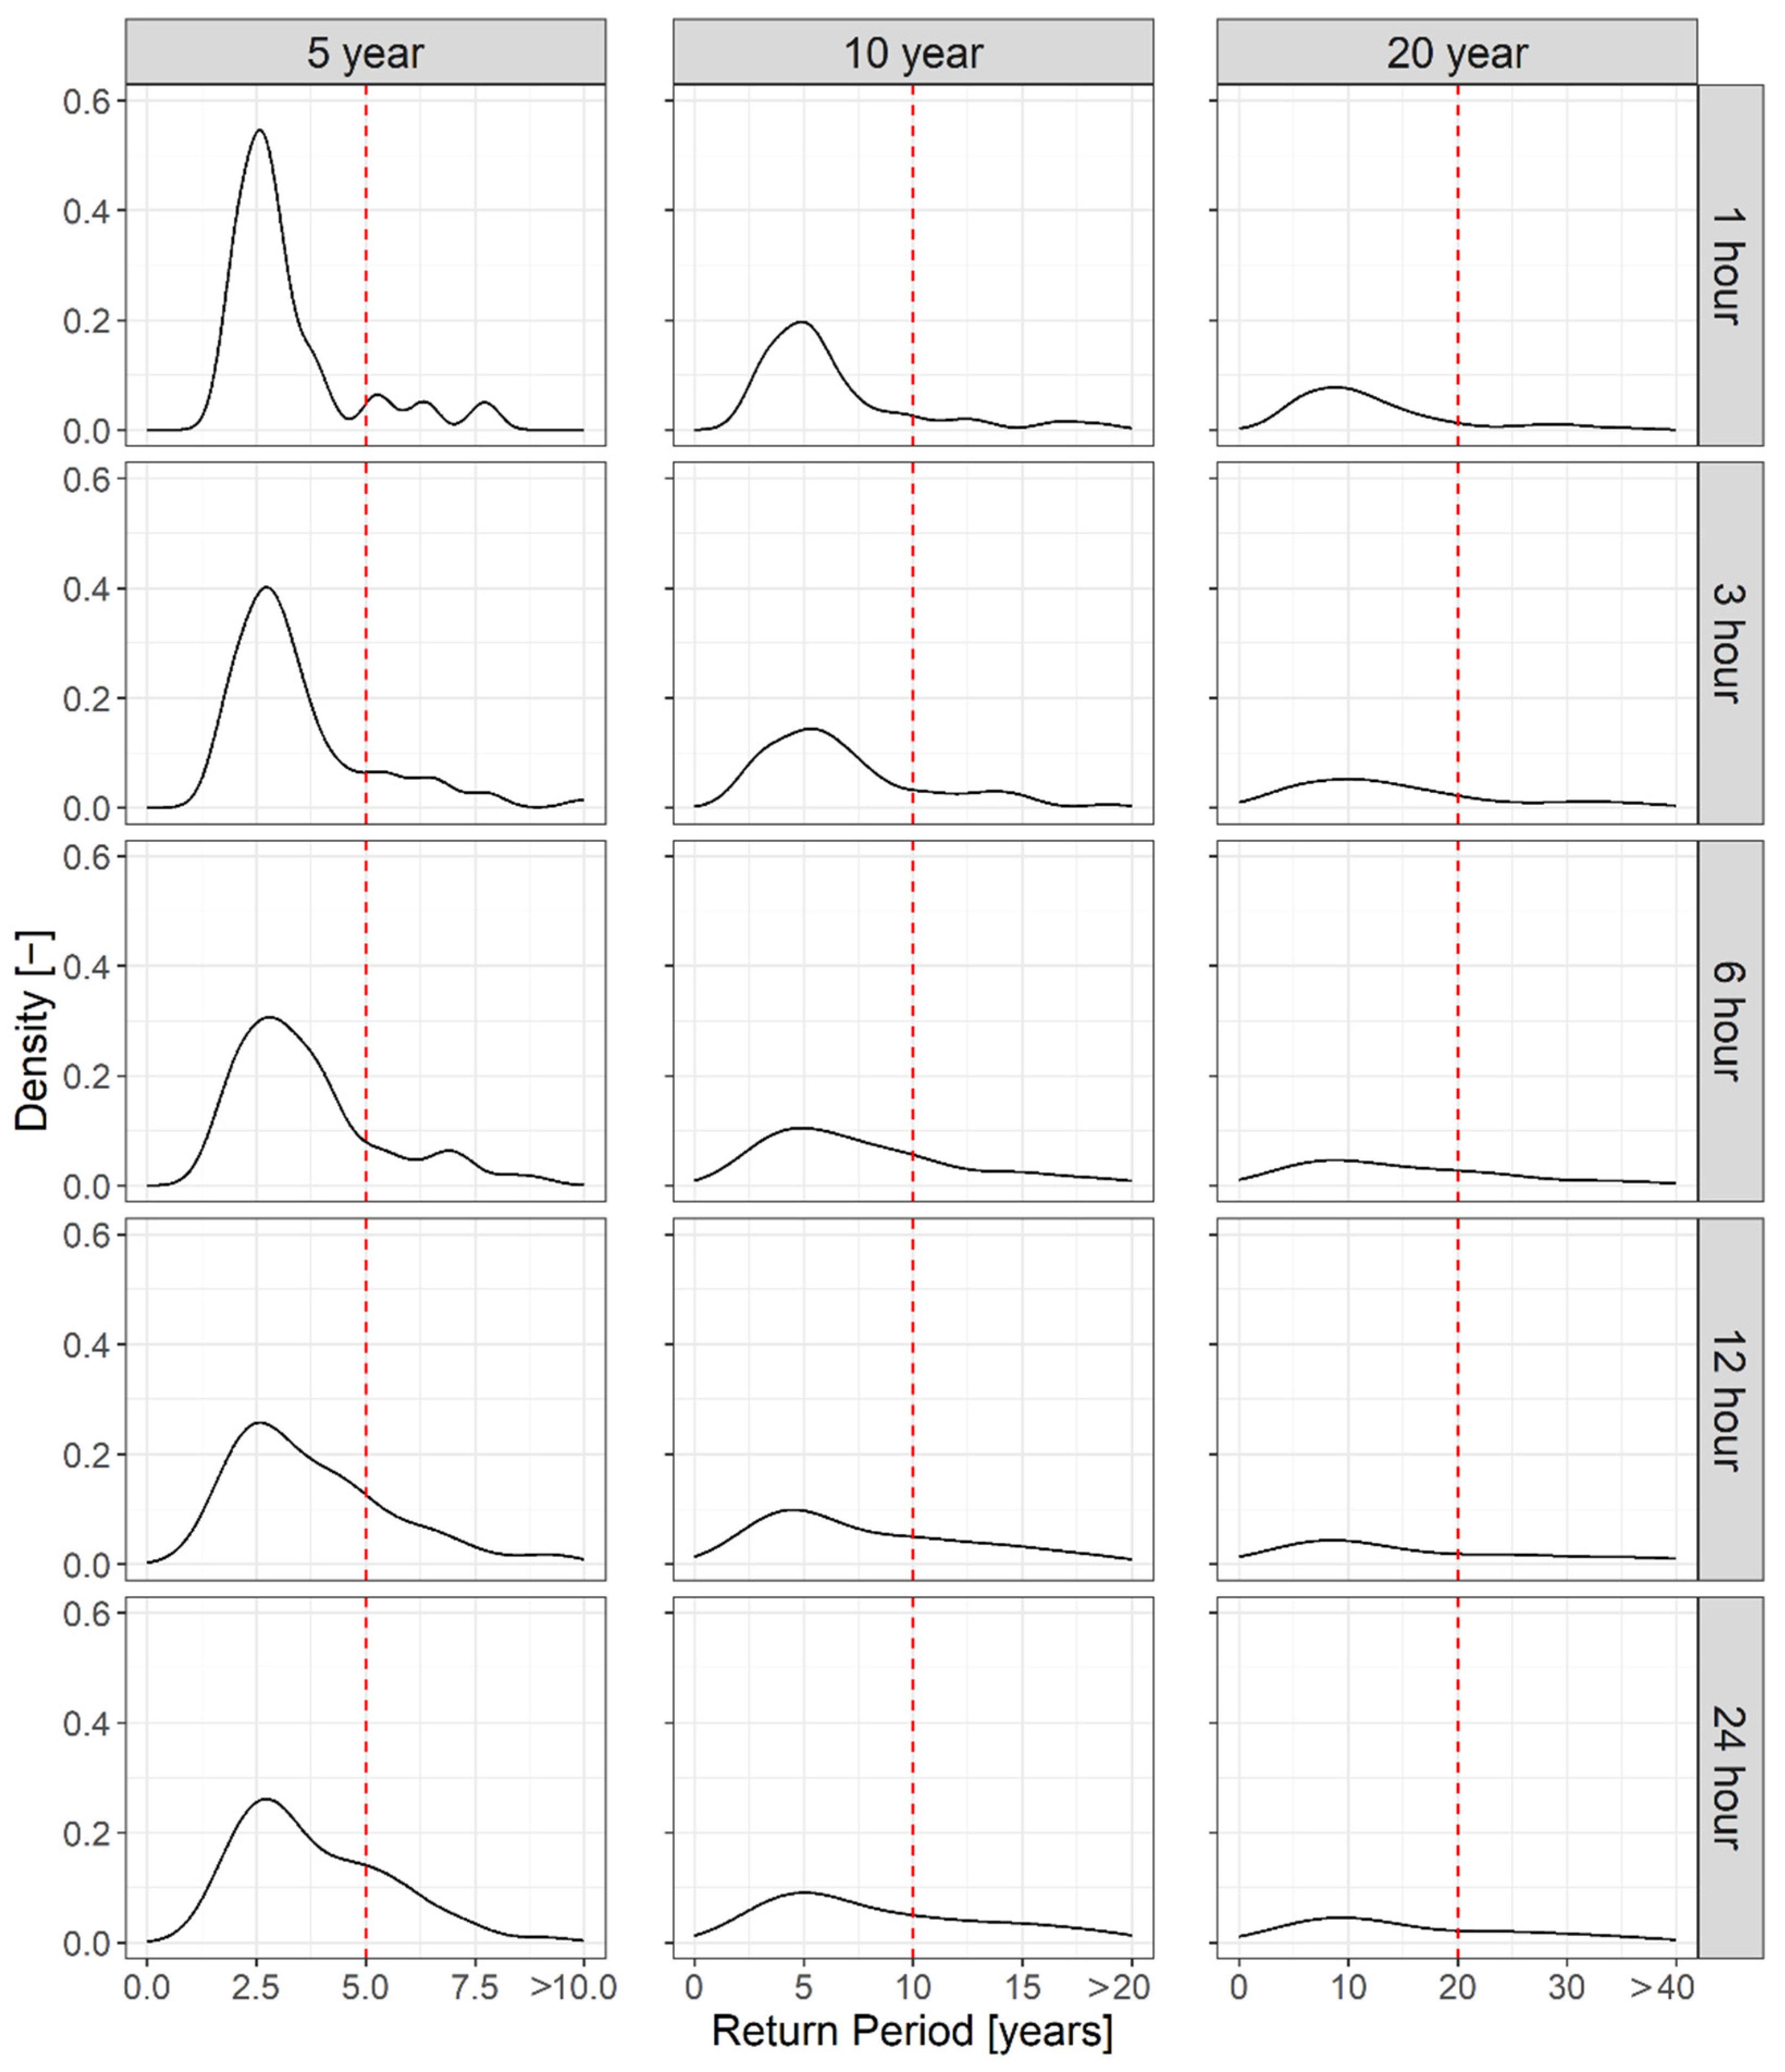
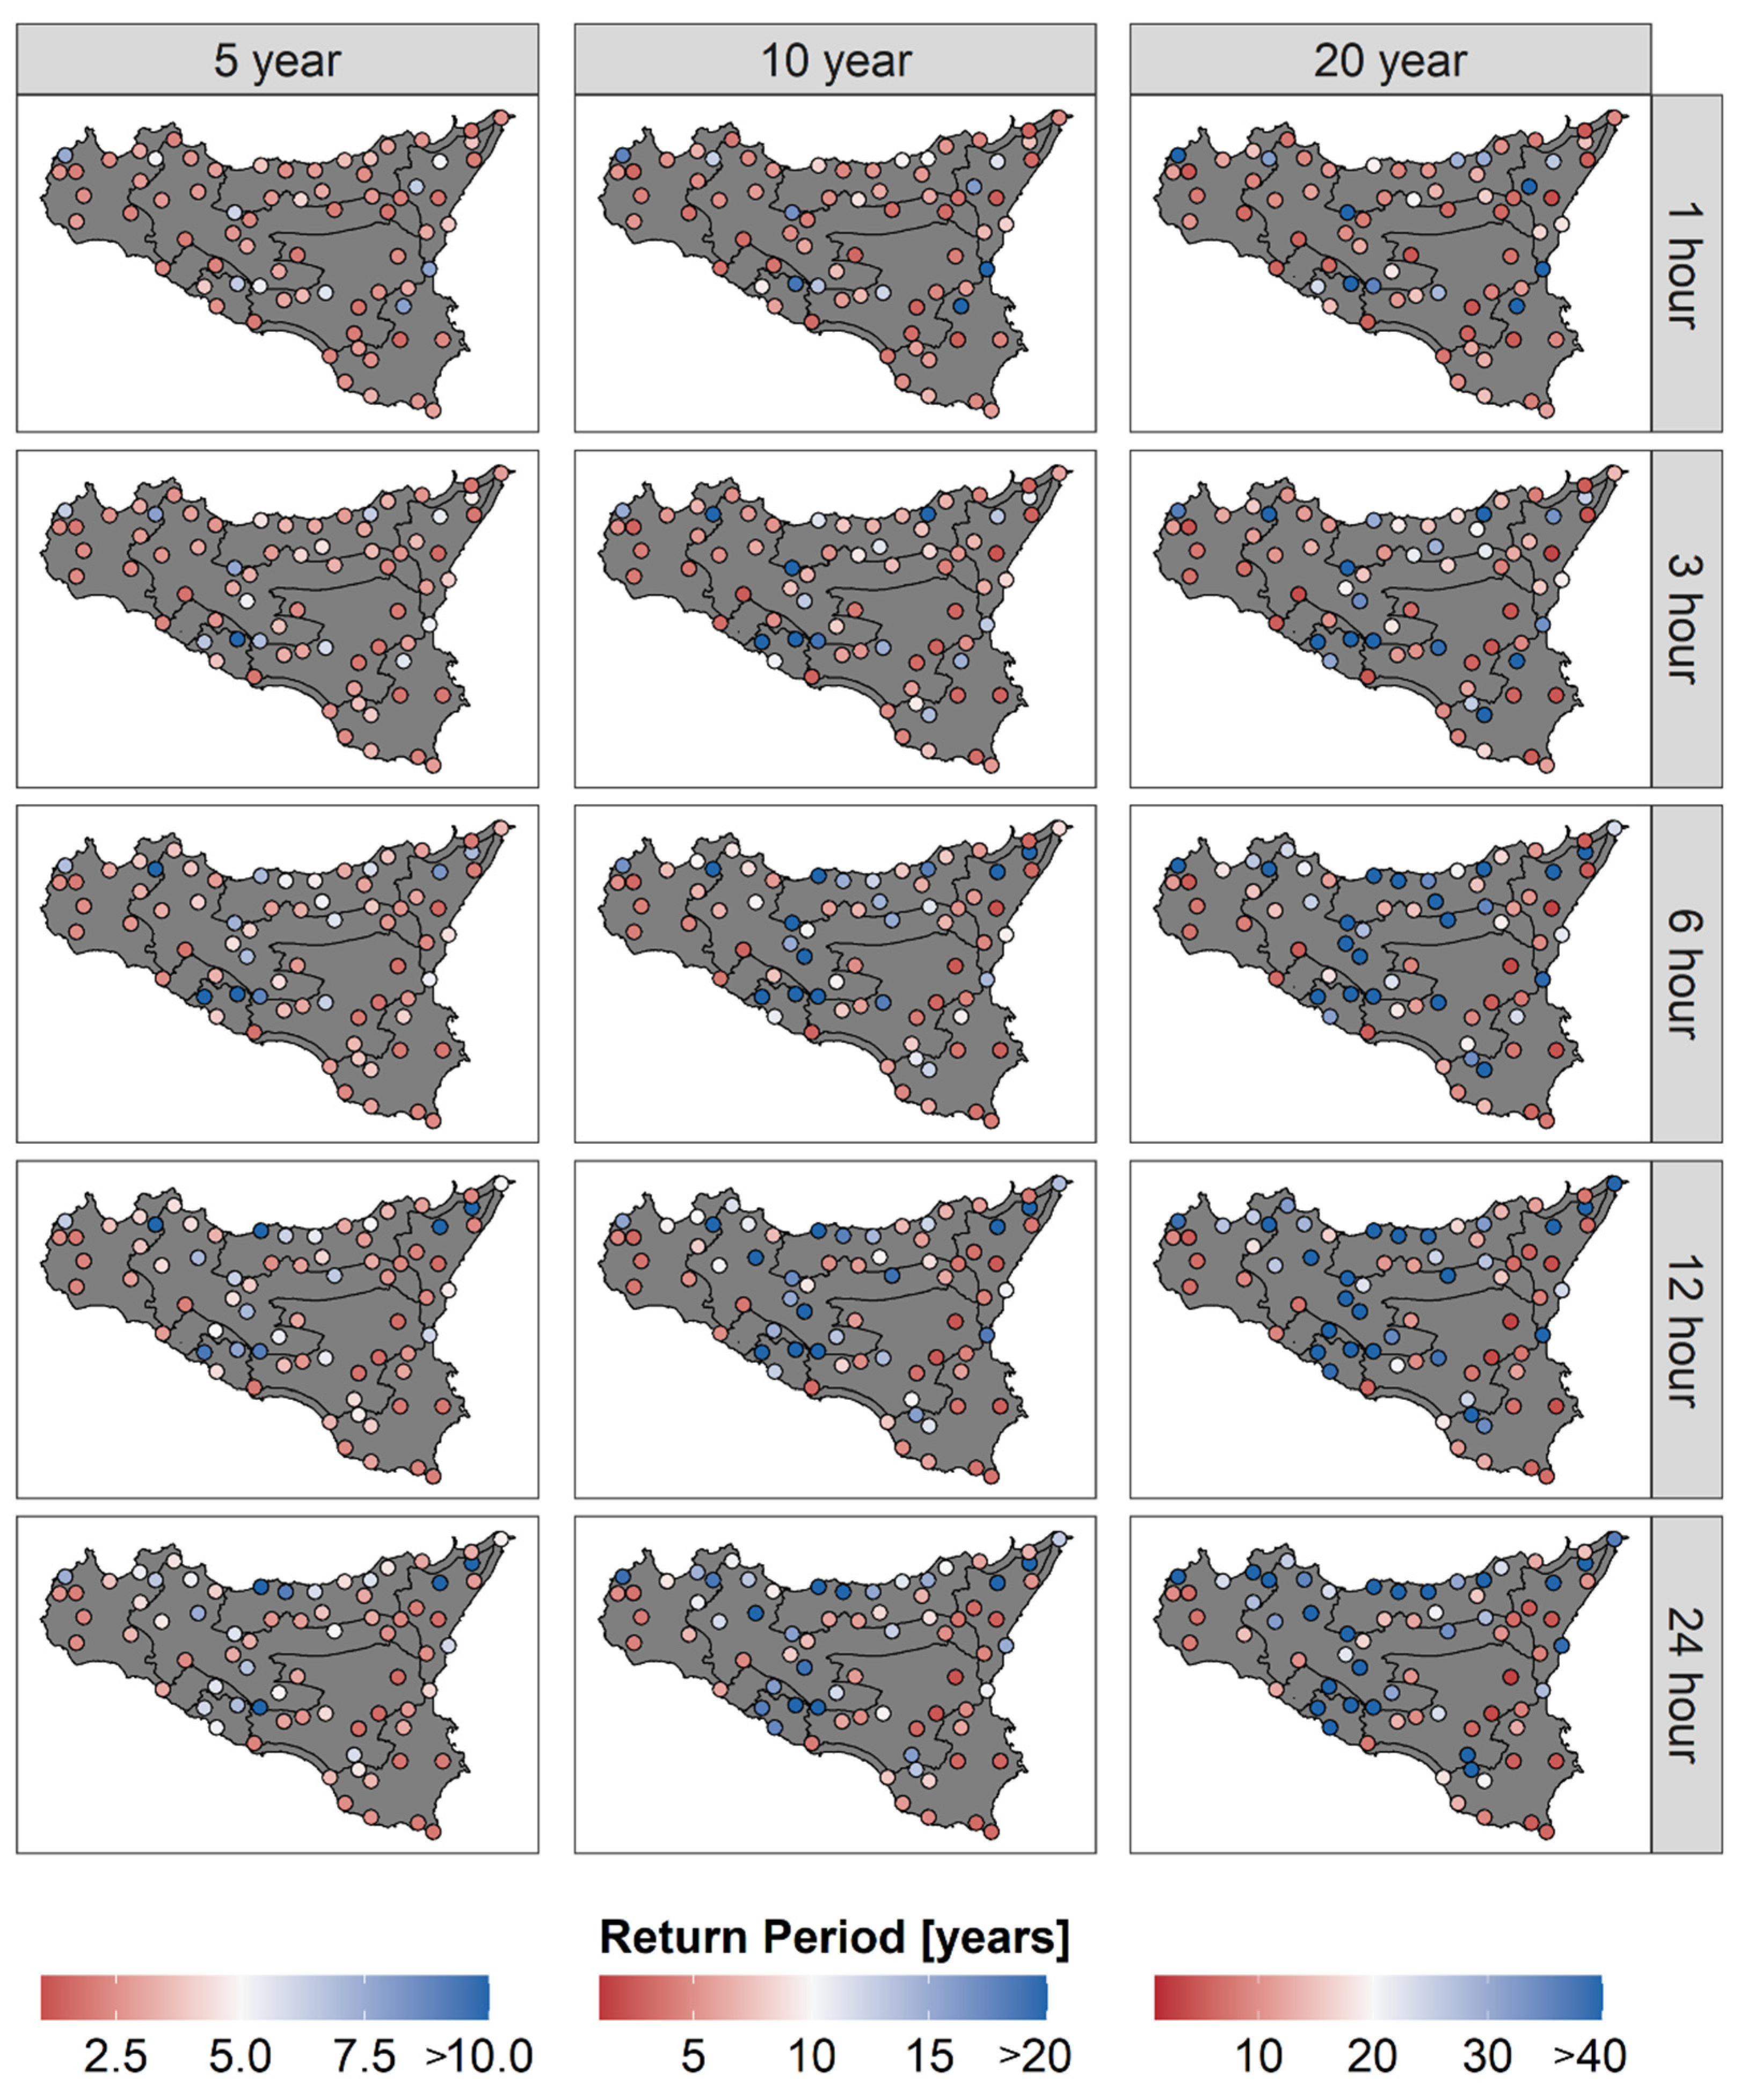
Given the generally positive outcome from the K–S test, we could fit the Gumbel distribution to the SIAS annual maxima and estimate the associated parameters (i.e., a d and b d from Equation (4)). These have been used to assess the sample of T S I A S by considering h r e g as h T d in Equation (4), as described in Section 2.3.2. For all the reference durations and the T r e g of 5, 10, and 20 years, in Figure 5 we mapped the empirical distribution functions of the T S I A S . These distributions refer to all 72 gauges, as explained in Section 2.3.2. The results highlight that, especially for the shortest durations and lower return periods, the peaks of these distributions are sharply shifted toward lower return periods than those expected with the regional approach by [11].
With reference to the last century, in the last 20 years the greatest proportion of events characterized by a T r e g of 5 years occurred more frequently and, consequently, are characterized by a lower return period (i.e., the greatest part of the empirical density distribution falls before the 5-year return period). This result is less evident as the return period increases, since it is most likely affected by the limited length of the SIAS annual maxima series (i.e., 21 years from 2002 to 2022). Figure 6 shows a spatial representation of what is reported in Figure 5. For all the reference durations and return periods, the new return periods of the h r e g calculated with the Gumbel distribution fitted to the SIAS annual maxima (i.e., T S I A S ) are shown in correspondence with each of the SIAS rain gauges. Looking at Figure 6, it is possible to note that, especially at low durations and for the 5-year return period, almost all the gauges show a return period lower than the expected value of 5 years, which is indicated with the red color on the map. This aspect is increasingly being missed as the duration increases. When the return period increases, a similar behavior is less noticeable, although this aspect, as previously specified, most likely depends on the limited length of the SIAS annual maxima series.
Looking at the spatial distribution of these values, the return periods lower than the expected one (i.e., T S I A S < T r e g ) are almost everywhere for the shorter durations and the lower return periods, while they tend to be more localized along the coasts and especially in the southeastern part of the region as the duration and the return period gradually increase.
These results agree with those of several recent studies on the intensification of extreme precipitation in the Mediterranean area, especially for the short durations, i.e., hourly and sub-hourly [26,29]. This could be potentially linked to global warming, as the increase in surface and atmospheric temperature, as well as the frequency of heatwaves, may cause a change in the Clausius–Clapeyron relationship [36]. Indeed, increased temperature enables the air to retain a greater amount of water vapor, consequently leading to the atmosphere becoming more unstable, favoring increasingly frequent intense and short-lived convective phenomena.

4. Conclusions

DDF curves are a fundamental tool for designing hydraulic infrastructures and for aspects connected to hydrological risk. They are used to estimate the intensity of precipitation for a given duration and return period, based on historical rainfall data. The traditional approaches to obtaining DDFs, either single gauge or regionalized, estimate their statistical parameters by assuming that the statistical properties of historical time series do not change over time (i.e., stationarity condition), thus lacking trends, shifts, or periodicity. However, the reliability of this approach has been questioned in recent years due to the non-stationarity of rainfall patterns, potentially linked to climate change. This latter phenomenon, indeed, is responsible for alterations in atmospheric circulation patterns, connected to precipitation fields and, in turn, to evapotranspiration, runoff, and other components of the hydrological balance. These aspects are more evident in the Mediterranean area, given that it is considered as a hot spot for climate change impacts.
The present study analyzes the most up-to-date regional method to obtain the DDF curves [11] in Sicily, the biggest island of the Mediterranean Sea, in a climate change perspective, questioning whether DDFs obtained with this approach can be considered as representative of today’s climate and reliable for their common scopes.
Our analyses aimed to review the concept of stationarity of return periods since, especially in recent decades, climate change has been even more evident. To carry them out, a 10 min rainfall dataset drawn from the rain gauge network of SIAS, referring to the time window 2002–2022, has been employed. A first comparison between rainfall time series at the reference durations (i.e., 1, 3, 6, 12, and 24 h), created by aggregating the 10 min data recorded by 72 SIAS rain gauges through a rolling window and the regional quantiles derived through the approach by [11], has been carried out with reference to 5-, 10-, and 20-year return periods. This highlighted that, especially for the 5-year return period and the shortest duration (e.g., hourly), the expected regional quantiles under the stationarity occurrence of extremes are mostly exceeded.
Since this aspect is widespread throughout the whole region, we performed an at-site comparison between the regional quantiles and those extracted from the SIAS data. To achieve this, annual maxima for the reference durations have been extracted from the SIAS dataset; then, we fitted the Gumbel distribution at each rain gauge and performed the goodness of fitting through the K–S test. Since this latter resulted in a good fitting of the Gumbel distribution across the region, we could extract quantiles for the three selected return periods and the reference durations at each SIAS gauge, and compare them with the regional ones, expressing this comparison in terms of return period variation. The results showed that, especially for lower durations, Sicily is experiencing a consistent underestimation of the design rainfall calculated using the regional method. This can be viewed also in terms of a reduction in return periods associated with rainfall events in the last two decades. To be more specific, an event characterized by a 10-year return period, with reference to the middle of the last century, today might be characterized by a return period that is half of the previous length, which means that its frequency has doubled over the past twenty years. This certainly would lead to (i) a double risk of the failure of hydraulic works designed in the past and (ii) to a redefinition of project return periods for new hydraulic infrastructure design. These results should raise awareness of the need to consider the non-stationarity of the return period in the design of hydraulic works or other purposes related to the hydrological and geological risk. Future research in this area will be crucial for improving the performance of water management and hydrological risk detection in a climate change context, especially considering the not reassuring predictions about the occurrence of extremes in the future.

Author Contributions

Conceptualization, D.T., A.F. and L.V.N.; Methodology, D.T., G.C. and L.V.N.; Software, D.T.; Validation, A.F., M.C. and L.V.N.; Formal analysis, D.T.; Investigation, G.C.; Data curation, D.T.; Writing—original draft, G.C.; Writing—review & editing, G.C., A.F., M.C. and L.V.N.; Supervision, A.F., M.C. and L.V.N.; Project administration, L.V.N. All authors have read and agreed to the published version of the manuscript.

Funding

This research received no external funding.

Data Availability Statement

The SIAS rainfall data are publicly accessible upon registration on the online platform and request to the SIAS agency. Data related to the regionalized procedure presented in [11] can be obtained upon request to the authors of the manuscript.

Conflicts of Interest

The authors declare no conflict of interest.

References

  1. Kumar, N.; Poonia, V.; Gupta, B.B.; Goyal, M.K. A Novel Framework for Risk Assessment and Resilience of Critical Infrastructure towards Climate Change. Technol. Forecast. Soc. Chang. 2021, 165, 120532. [Google Scholar] [CrossRef]
  2. Debortoli, N.S.; Camarinha, P.I.M.; Marengo, J.A.; Rodrigues, R.R. An Index of Brazil’s Vulnerability to Expected Increases in Natural Flash Flooding and Landslide Disasters in the Context of Climate Change. Nat. Hazards 2017, 86, 557–582. [Google Scholar] [CrossRef]
  3. Montrasio, L.; Valentino, R.; Losi, G.L. Towards a Real-Time Susceptibility Assessment of Rainfall-Induced Shallow Landslides on a Regional Scale. Nat. Hazards Earth Syst. Sci. 2011, 11, 1927–1947. [Google Scholar] [CrossRef] [Green Version]
  4. Zellou, B.; Rahali, H. Assessment of the Joint Impact of Extreme Rainfall and Storm Surge on the Risk of Flooding in a Coastal Area. J. Hydrol. 2019, 569, 647–665. [Google Scholar] [CrossRef]
  5. Cheng, L.; AghaKouchak, A. Nonstationary Precipitation Intensity-Duration-Frequency Curves for Infrastructure Design in a Changing Climate. Sci. Rep. 2014, 4, 7093. [Google Scholar] [CrossRef] [PubMed] [Green Version]
  6. Andimuthu, R.; Kandasamy, P.; Mudgal, B.V.; Jeganathan, A.; Balu, A.; Sankar, G. Performance of Urban Storm Drainage Network under Changing Climate Scenarios: Flood Mitigation in Indian Coastal City. Sci. Rep. 2019, 9, 7783. [Google Scholar] [CrossRef] [Green Version]
  7. Yu, J.; Qin, X.; Chiew, Y.M.; Min, R.; Shen, X. Stochastic Optimization Model for Supporting Urban Drainage Design under Complexity. J. Water Resour. Plann. Manag. 2017, 143, 05017008. [Google Scholar] [CrossRef]
  8. Scala, P.; Cipolla, G.; Treppiedi, D.; Noto, L.V. The Use of GAMLSS Framework for a Non-Stationary Frequency Analysis of Annual Runoff Data over a Mediterranean Area. Water 2022, 14, 2848. [Google Scholar] [CrossRef]
  9. Madsen, H.; Arnbjerg-Nielsen, K.; Mikkelsen, P.S. Update of Regional Intensity–Duration–Frequency Curves in Denmark: Tendency towards Increased Storm Intensities. Atmos. Res. 2009, 92, 343–349. [Google Scholar] [CrossRef]
  10. Borga, M.; Vezzani, C.; Fontana, G.D. Regional Rainfall Depth–Duration–Frequency Equations for an Alpine Region. Nat. Hazards 2005, 36, 221–235. [Google Scholar] [CrossRef]
  11. Forestieri, A.; Lo Conti, F.; Blenkinsop, S.; Cannarozzo, M.; Fowler, H.J.; Noto, L.V. Regional Frequency Analysis of Extreme Rainfall in Sicily (Italy): Regional Frequency Analysis of Extreme Rainfall, Sicily (Italy). Int. J. Clim. 2018, 38, e698–e716. [Google Scholar] [CrossRef]
  12. Kourtis, I.M.; Tsihrintzis, V.A. Adaptation of Urban Drainage Networks to Climate Change: A Review. Sci. Total. Environ. 2021, 771, 145431. [Google Scholar] [CrossRef]
  13. Kourtis, I.M.; Tsihrintzis, V.A. Update of Intensity-Duration-Frequency (IDF) Curves under Climate Change: A Review. Water Supply 2022, 22, 4951–4974. [Google Scholar] [CrossRef]
  14. Cook, L.M.; McGinnis, S.; Samaras, C. The Effect of Modeling Choices on Updating Intensity-Duration-Frequency Curves and Stormwater Infrastructure Designs for Climate Change. Clim. Chang. 2020, 159, 289–308. [Google Scholar] [CrossRef] [Green Version]
  15. Cipolla, G.; Francipane, A.; Noto, L.V. Classification of Extreme Rainfall for a Mediterranean Region by Means of Atmospheric Circulation Patterns and Reanalysis Data. Water Resour. Manag. 2020, 34, 3219–3235. [Google Scholar] [CrossRef]
  16. Myhre, G.; Alterskjær, K.; Stjern, C.W.; Hodnebrog, Ø.; Marelle, L.; Samset, B.H.; Sillmann, J.; Schaller, N.; Fischer, E.; Schulz, M.; et al. Frequency of Extreme Precipitation Increases Extensively with Event Rareness under Global Warming. Sci. Rep. 2019, 9, 16063. [Google Scholar] [CrossRef] [Green Version]
  17. Nissen, K.M.; Ulbrich, U. Increasing Frequencies and Changing Characteristics of Heavy Precipitation Events Threatening Infrastructure in Europe under Climate Change. Nat. Hazards Earth Syst. Sci. 2017, 17, 1177–1190. [Google Scholar] [CrossRef] [Green Version]
  18. Noto, L.V.; Cipolla, G.; Francipane, A.; Pumo, D. Climate Change in the Mediterranean Basin (Part I): Induced Alterations on Climate Forcings and Hydrological Processes. Water Resour. Manag. 2022, 37, 2287–2305. [Google Scholar] [CrossRef]
  19. Noto, L.V.; Cipolla, G.; Pumo, D.; Francipane, A. Climate Change in the Mediterranean Basin (Part II): A Review of Challenges and Uncertainties in Climate Change Modeling and Impact Analyses. Water Resour. Manag. 2023, 37, 2307–2323. [Google Scholar] [CrossRef]
  20. Lionello, P.; Gacic, M.; Gomis, D.; Garcia-Herrera, R.; Giorgi, F.; Planton, S.; Trigo, R.; Theocharis, A.; Tsimplis, M.N.; Ulbrich, U.; et al. Program Focuses on Climate of the Mediterranean Region. Eos Trans. AGU 2012, 93, 105–106. [Google Scholar] [CrossRef]
  21. Ali, E.; Cramer, W.; Carnicer, J.; Georgopoulou, E.; Hilmi, N.J.M.; Le Cozannet, G.; Lionello, P. Cross-Chapter Paper 4: Mediterranean Region. In Climate Change 2022: Impacts, Adaptation and Vulnerability; Contribution of Working Group II to the Sixth Assessment Report of the Intergovernmental Panel on Climate Change; Intergovernmental Panel on Climate Change: Geneva, Switzerland, 2022. [Google Scholar]
  22. Twardosz, R.; Walanus, A.; Guzik, I. Warming in Europe: Recent Trends in Annual and Seasonal Temperatures. Pure Appl. Geophys. 2021, 178, 4021–4032. [Google Scholar] [CrossRef]
  23. Hatzianastassiou, N.; Papadimas, C.D.; Lolis, C.J.; Bartzokas, A.; Levizzani, V.; Pnevmatikos, J.D.; Katsoulis, B.D. Spatial and Temporal Variability of Precipitation over the Mediterranean Basin Based on 32-Year Satellite Global Precipitation Climatology Project Data, Part I: Evaluation and Climatological Patterns: Satellite Mediterranean Precipitation Climatology. Int. J. Climatol. 2016, 36, 4741–4754. [Google Scholar] [CrossRef]
  24. Achite, M.; Caloiero, T.; Wałęga, A.; Krakauer, N.; Hartani, T. Analysis of the Spatiotemporal Annual Rainfall Variability in the Wadi Cheliff Basin (Algeria) over the Period 1970 to 2018. Water 2021, 13, 1477. [Google Scholar] [CrossRef]
  25. Varouchakis, E.A.; Corzo, G.A.; Karatzas, G.P.; Kotsopoulou, A. Spatio-Temporal Analysis of Annual Rainfall in Crete, Greece. Acta Geophys. 2018, 66, 319–328. [Google Scholar] [CrossRef]
  26. Treppiedi, D.; Cipolla, G.; Francipane, A.; Noto, L.V. Detecting Precipitation Trend Using a Multiscale Approach Based on Quantile Regression over a Mediterranean Area. Int. J. Clim. 2021, 41, 5938–5955. [Google Scholar] [CrossRef]
  27. Blanchet, J.; Molinié, G.; Touati, J. Spatial Analysis of Trend in Extreme Daily Rainfall in Southern France. Clim. Dyn. 2018, 51, 799–812. [Google Scholar] [CrossRef]
  28. Sottile, G.; Francipane, A.; Adelfio, G.; Noto, L.V. A PCA-Based Clustering Algorithm for the Identification of Stratiform and Convective Precipitation at the Event Scale: An Application to the Sub-Hourly Precipitation of Sicily, Italy. Stoch. Env. Res. Risk Assess. 2022, 36, 2303–2317. [Google Scholar] [CrossRef]
  29. Arnone, E.; Pumo, D.; Viola, F.; Noto, L.V.; La Loggia, G. Rainfall Statistics Changes in Sicily. Hydrol. Earth Syst. Sci. 2013, 17, 2449–2458. [Google Scholar] [CrossRef] [Green Version]
  30. Di Piazza, A.; Conti, F.L.; Noto, L.V.; Viola, F.; La Loggia, G. Comparative Analysis of Different Techniques for Spatial Interpolation of Rainfall Data to Create a Serially Complete Monthly Time Series of Precipitation for Sicily, Italy. Int. J. Appl. Earth Obs. Geoinf. 2011, 13, 396–408. [Google Scholar] [CrossRef]
  31. Treppiedi, D.; Cipolla, G.; Noto, L.V. Convective Precipitation over a Mediterranean Area: From Identification to Trend Analysis Starting from High-resolution Rain Gauges Data. Int. J. Climatol. 2023, 43, 293–313. [Google Scholar] [CrossRef]
  32. Feloni, E.G.; Baltas, E.A.; Nastos, P.T.; Matsangouras, I.T. Implementation and Evaluation of a Convective/Stratiform Precipitation Scheme in Attica Region, Greece. Atmos. Res. 2019, 220, 109–119. [Google Scholar] [CrossRef]
  33. Westra, S.; Fowler, H.J.; Evans, J.P.; Alexander, L.V.; Berg, P.; Johnson, F.; Kendon, E.J.; Lenderink, G.; Roberts, N.M. Future Changes to the Intensity and Frequency of Short-Duration Extreme Rainfall. Rev. Geophys. 2014, 52, 522–555. [Google Scholar] [CrossRef] [Green Version]
  34. Harris, R.I. Gumbel Re-Visited—A New Look at Extreme Value Statistics Applied to Wind Speeds. J. Wind. Eng. Ind. Aerodyn. 1996, 59, 1–22. [Google Scholar] [CrossRef]
  35. Massey, F.J. The Kolmogorov-Smirnov Test for Goodness of Fit. J. Am. Stat. Assoc. 1951, 46, 68–78. [Google Scholar] [CrossRef]
  36. Pumo, D.; Carlino, G.; Blenkinsop, S.; Arnone, E.; Fowler, H.; Noto, L.V. Sensitivity of Extreme Rainfall to Temperature in Semi-Arid Mediterranean Regions. Atmos. Res. 2019, 225, 30–44. [Google Scholar] [CrossRef]
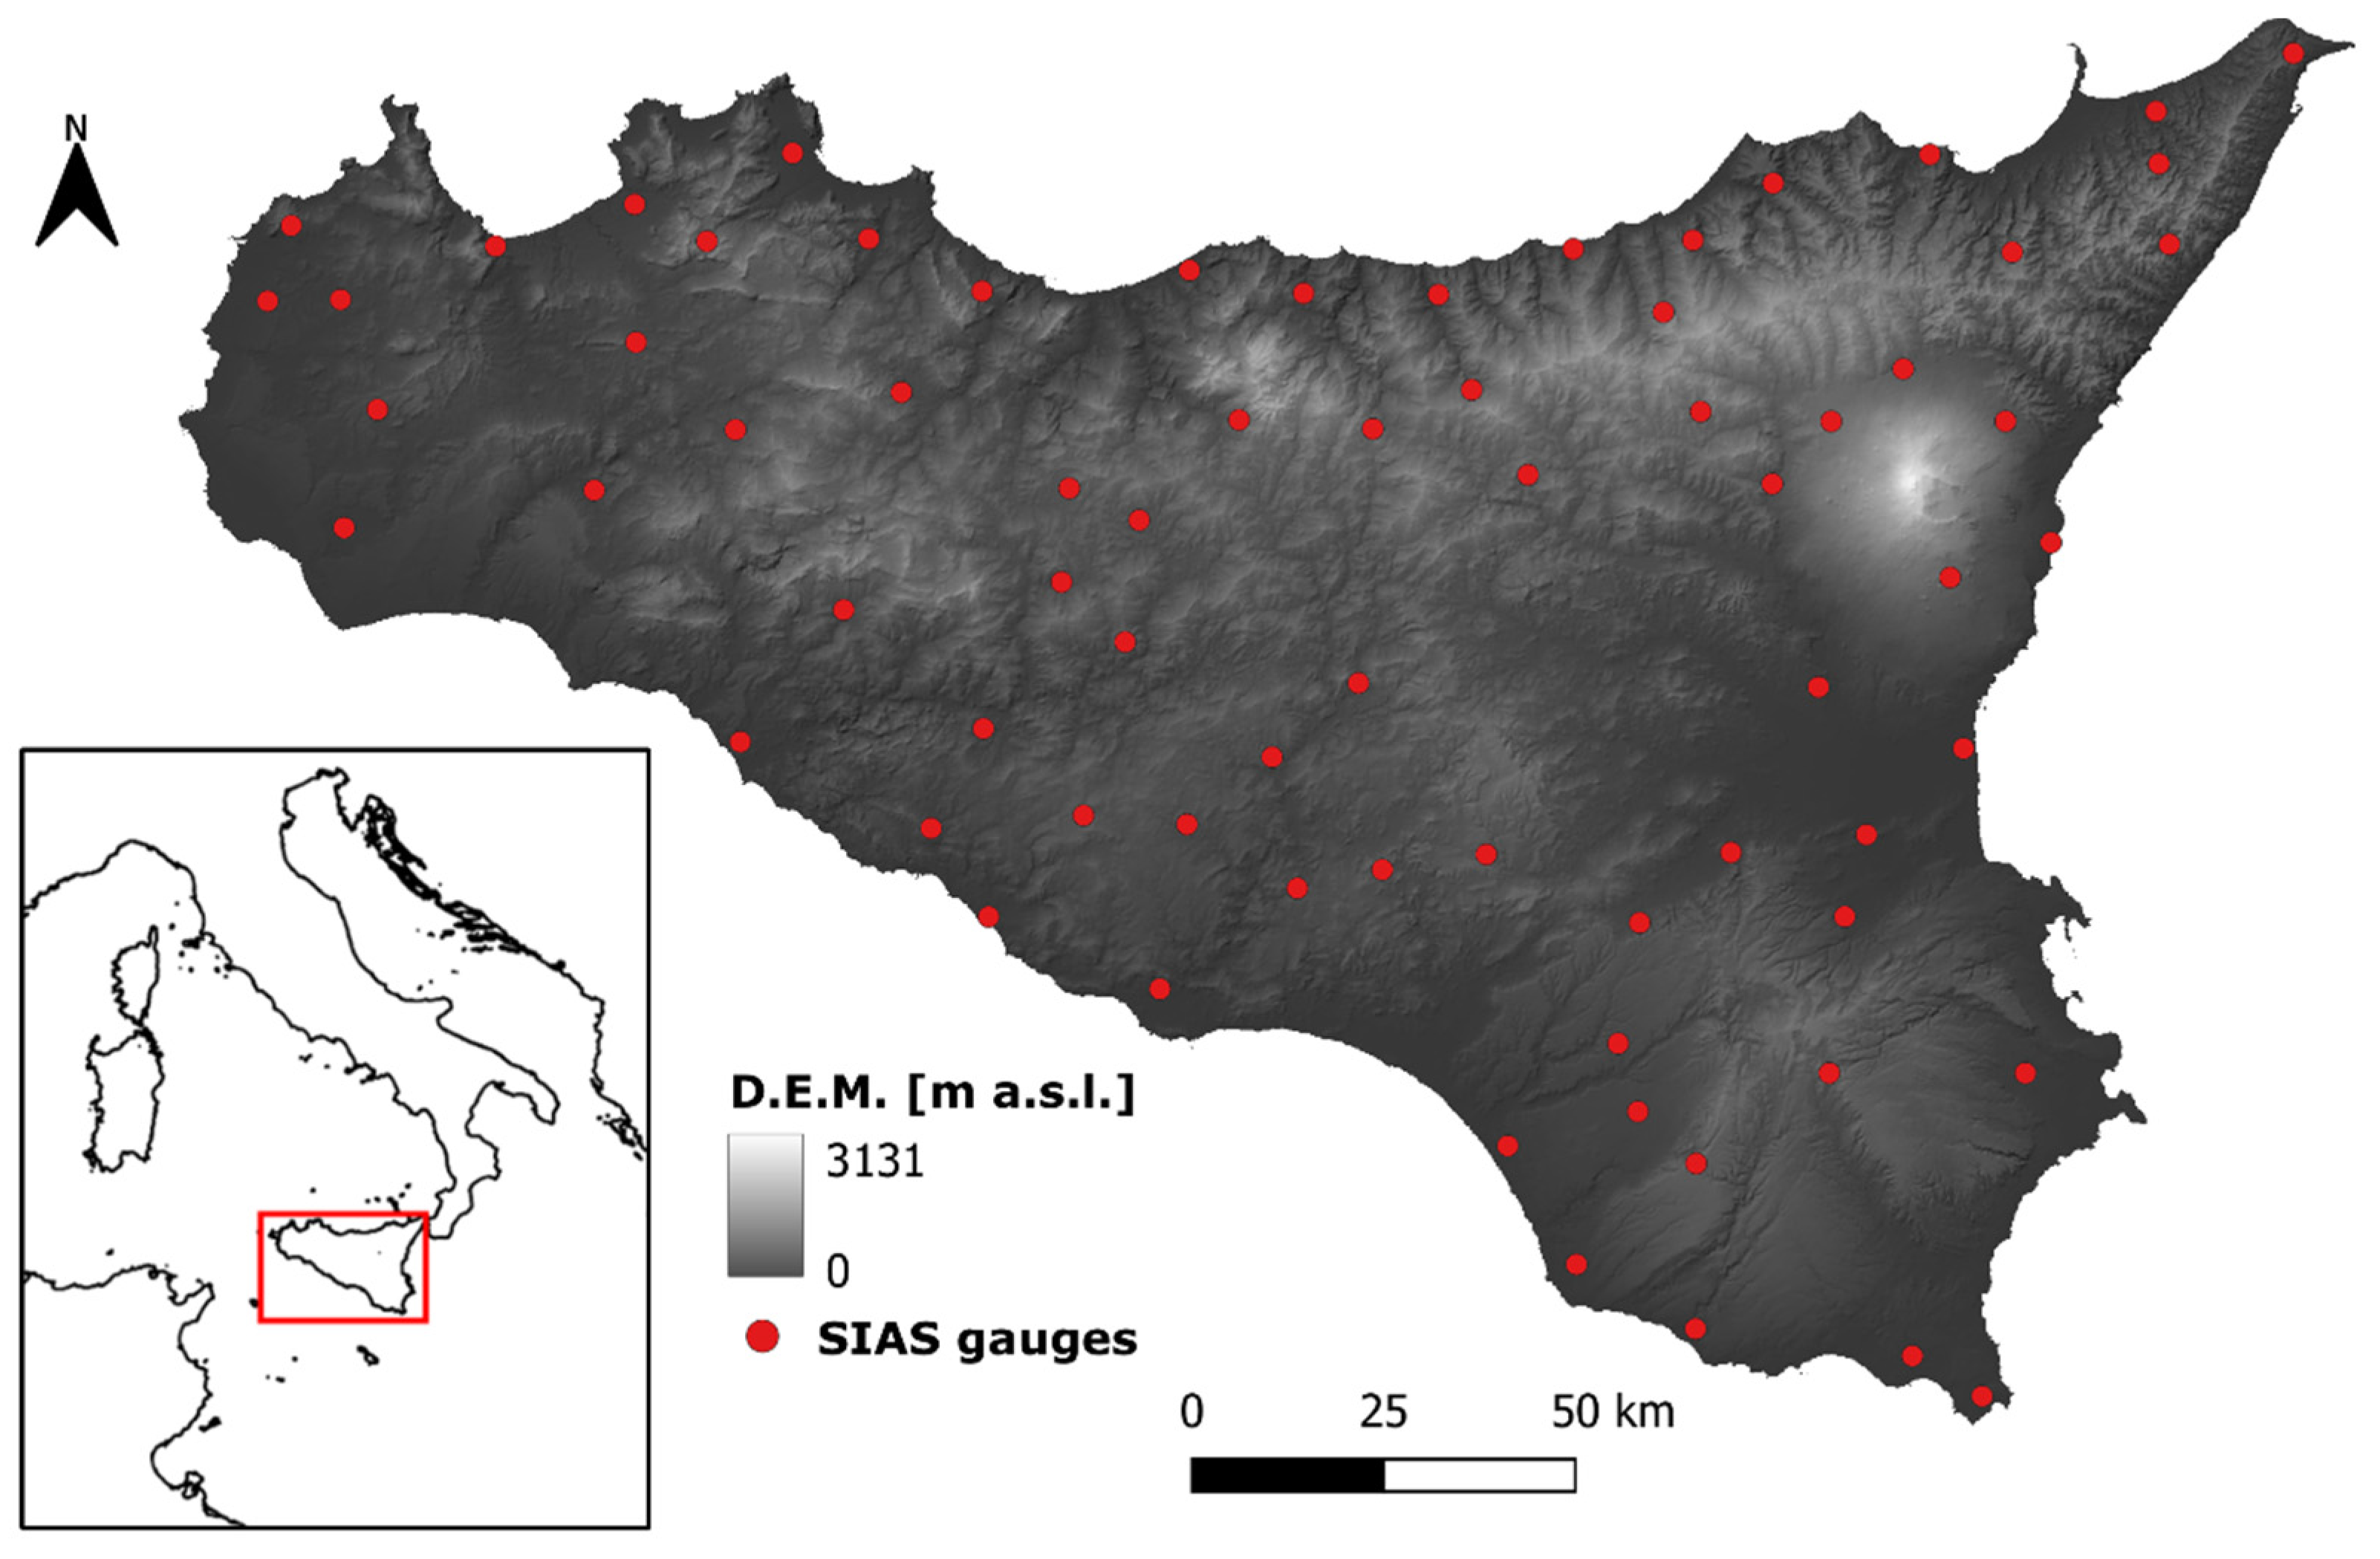
Figure 1. Location of the gauges of the Servizio Informativo Agrometeorologico Siciliano (SIAS) used for the presented analyses, overlaid onto the DEM of Sicily.
Water 15 02245 g001
Figure 2. At-site comparison between the hreg for the 1 h duration and the 5-year return period and the aggregated data series of the SIAS rain gauge named “Palermo” (upper panel) and spatial distribution of the number of exceedances for different durations (rows) and return periods (columns) over the entire region (lower panel).
Water 15 02245 g002
Figure 3. Probability density functions of the binomial statistical distribution, in blue, and of the number of hreg exceedances, in red, for the reference durations (rows) and return periods (columns). What might look like a third different color in the figure is due to the overlap of the two histograms. The small panels represent the respective cumulative distribution function.
Water 15 02245 g003
Figure 4. Spatial distribution of p-value for the K–S test for the reference durations. High p-values indicate greater significance in not rejecting the null hypothesis that the sample belongs to the theoretical Gumbel distribution.
Water 15 02245 g004
Figure 5. Empirical density distribution of the TSIAS of all 72 considered SIAS rain gauges, compared to the corresponding Treg (red dashed line). Results are expressed for all the reference durations (rows) and the return periods of 5, 10, and 20 years (columns).
Water 15 02245 g005
Figure 6. Spatial representations of the TSIAS for the 72 considered SIAS rain gauges. Results are expressed for all reference durations (rows) and the Treg of 5, 10, and 20 years (columns).
Water 15 02245 g006
Disclaimer/Publisher’s Note: The statements, opinions and data contained in all publications are solely those of the individual author(s) and contributor(s) and not of MDPI and/or the editor(s). MDPI and/or the editor(s) disclaim responsibility for any injury to people or property resulting from any ideas, methods, instructions or products referred to in the content.