Article

Photocatalytic Degradation of Methylene Blue Dye from Wastewater by Using Doped Zinc Oxide Nanoparticles

by
Shreya Modi
1,2,*,
Virendra Kumar Yadav
1,3,*,
Abdelfattah Amari
4,*,
Abeer Yousef Alyami
5,
Amel Gacem
6,
Hamed N. Harharah
4 and
Madhusudan Hiraman Fulekar
7
1
School of Nanosciences, Central University of Gujarat, Gandhinagar 382030, India
2
Department of Microbiology, Shri Sarvajanik Science College, Hemchandracharya North Gujarat University, Mehsana 384001, India
3
Department of Life Sciences, Hemchandracharya North Gujarat University, Patan 384265, India
4
Department of Chemical Engineering, College of Engineering, King Khalid University, Abha 61411, Saudi Arabia
5
Department of Chemistry, College of Science and Arts, Najran University, Najran 11001, Saudi Arabia
6
Department of Physics, Faculty of Sciences, University 20 Août 1955, Skikda 21000, Algeria
7
Center of Research for Development, Parul University, Vadodara 391760, India
*
Authors to whom correspondence should be addressed.
Water 2023, 15(12), 2275; https://doi.org/10.3390/w15122275
Submission received: 5 May 2023 / Revised: 9 June 2023 / Accepted: 14 June 2023 / Published: 17 June 2023

Abstract

:
ZnO is a semiconductor material that has important physical and chemical properties, which are frequently and significantly enhanced by the addition of impurities, such as doping. A study of the structural properties of pristine and functionalized (i.e., doped with Antimony and Tungsten) ZnO nanoparticles has been conducted for the photocatalyst-based degradation of methylene blue (MB) dye under both Ultraviolet (UV) and solar light. Authors have used a 1% concentration of dopant for doping purposes. The synthesized materials were characterized for structural analysis, functional group identification, spectroscopic measurements, and morphological examination using X-ray diffraction (XRD), Fourier transform-infrared (FTIR), UV-Vis spectroscopy (UV-Vis), and Field emission scanning electron microscope (FESEM) techniques. XRD analysis confirmed that the synthesized-doped materials retained the wurtzite hexagonal structure with a purity of 99%. Transmission electron microscope (TEM) analysis data reveals the average size of pure ZnO-NPs was found to be 7 nm; after doping the size was found to be increased to 18 nm and 9.55 nm, respectively, for ZnO-W and ZnO-Sb. As per FESEM analysis results, minor morphological changes were observed after doping. The Ultraviolet Differential reflectance spectroscopy UV-DRS study revealed the confirmation of ZnO doping with antimony and tungsten, which exhibited a blue shift. The decrease in the band-gap on doping makes the ZnO-NPs more efficient for photocatalytic applications. The photocatalytic efficiency of pristine and doped ZnO-NPs catalysts for methylene blue photocatalytic degradation (PCD) was analyzed under both UV and solar irradiation. This study analyzed the effect of pH, nano-photocatalyst dose, and initial dye concentration (ICD) on the PCD of MB. The obtained analytical results showed that the ideal conditions for the PCD of MB dye are as follows: pH = 9, the quantity of the nano-photocatalyst used was 300 mg/L, and an initial MB dye dose of 10 ppm. These conditions lead to a PCD of about 91% of the MB dye by using ZnO-Sb nano-photocatalyst on exposure to solar radiation. The reusability study also revealed the stability of nano-photocatalysts. The current research may pave the way for the removal of hazardous dyes from wastewater discharged by many industries.

1. Introduction

The engineering of the photocatalysts for the enhancement of their efficiency is an area of contemporary research in semiconductor photocatalysts. A number of effects have been made to overcome the problems associated with the enhancement of the efficiency of semiconductor photocatalysts. The development of an effective semiconductor-based photocatalyst that can work in visible or solar-light irradiation is a big challenge [1]. Zinc oxide has a semiconducting property which is a hexagonal, wurtzite-type structure and a band-gap energy (BGE) near that of titanium dioxide (TiO2) [2]. ZnO has various distinctive features which make it an ideal nanomaterial for a broad range of applications, for instance, wide scope for surface modifications, low-temperature regeneration ability, feasible price, easy processing at lower temperatures, higher lattice defects and vacancy of O2 in the crystalline structures [3]. Unfortunately, ZnO has several drawbacks, and because of its large band gap (BG) of 3.37 eV, exhibits photocatalytic properties exclusively under ultraviolet (UV) light excitation wavelength range. This indicates that, of the total solar radiation striking the surface of the earth, only about 3–5% is usable. Prior to the commercialization of ZnO-NPs as photocatalysts, its property must be improved because the recombination rate of light-generated electron-hole pairs (LGEH) is quite high. So, it is very important to extend the photocatalytic effect of ZnO-NPs in the visible light region (VLR) in order to inhibit the recombination of LGEH [4]. Doping is one of the extensively used methods for surface modification of nanoparticles (NPs) for improving their optical, biological, and electrical features [5]. Doping is an approach to modify the nanomaterials and it can substantially enhance the stability of the nanoparticles against aggregation and agglomeration. Basically, doping is a local manipulation of the ‘charge-carrier density’ and ‘material conductivity’ by allowing the incorporation of external impurities as dopants with specific characteristics and properties [6].
The electronic structure of ZnO has an electron-filled valence band (VB) and a vacant conduction band (CB) which can serve as a sensitizer for light-induced reduction-oxidation reactions. Nano-ZnO could absorb a little section of the solar spectrum in the ultraviolet region, which implies that it cannot efficiently utilize visible light [7,8]. Undoped ZnO-NPs represent an n-type conductivity because of the presence of native defects for instance vacancy of O2, hydrogen, and Zn interstitials in the lattice of ZnO [9]. The narrow BG semiconductors (such as CuO: 1.7 eV CdO 2.2–2.7 eV) display low photocatalytic efficacy by reason of their rapid recombination rate for LGEH pairs [8]. While ZnO and TiO2 are wide BG-semiconductor photocatalysts, the main disadvantage is that they can only be excited under UV light irradiation for photocatalysis reactions [10]. Thus, it is of great interest to enhance the photocatalytic efficiency for practical applications of photocatalysis under the irradiation of visible light [11]. Doping semiconductors with either elemental metals or their oxide forms is a profitable method to augment the separation of charge, reduce the BGE and, hence, shift the absorbance band to the VLR and inhibit the recombination of photo-generated electrons (e-) and holes in the semiconductor system. In order to increase the photocatalytic activity (PCA) of semiconductor ZnO, several dopants’ ions, for instance, metal, nonmetals, and transition metallic elements, were doped [12]. The doping of semiconductor oxides with transition elements has revealed a significant decrease in BGE and improved the electron–holes charge separation. Since transition elements have 4f and 5d electronic configuration and spectral properties, they could efficiently trap charge carriers and successfully minimize the recombination of electron–hole pairs (EHP), which could modify the crystalline and electronic configuration and the reduction of the optical BGE [13]. The conductivity, as well as the location of the VB of ZnO, is altered by doping, and forms an intra-band energy level which makes ZnO effective in the spectrum’s VLR. The O2 is not substituted by the large-sized dopant ions in the ZnO, due to their high difference in ionic radii (1.38 Å for O, 2.45 Å for Sb). It is believed that the vacancies near extended defects, such as stacking faults and dislocations in ZnO films, could show a significant role in incorporating the larger-sized dopants in ZnO films [14].
A team, led by Celik in 2020, reported the enhanced-optical BGE of ZnO by doping it with Sb. The BGE of the ZnO-NPs was changed from 3.26 eV to 2.92 eV after doping [15]. Recently, Sinornate et al. 2021 synthesized ZnO thin films doped with Sb by a sol-gel spin-coating method. The decline in the crystalline property of the ZnO thin film was hugely impacted by the Sb-dopant and annealing conditions, unveiling the reduction in the NPs’ size after annealing in an N, Ar environment, and upon doping [16]. The electrical resistance in the ZnO thin film can be reduced by doping it with Sb and annealing it in an N environment [17]. Jamshaid and their team synthesized a nanocrystalline M-type hexaferrite of empirical formula (Ca0.5Pb0.5−xYbxZnyFe12−yO19) by applying a sol-gel auto-combustion process. From the analysis, the magnetoplumbite phase of the nanocrystalline hexaferrite was revealed. Here, the investigators reported that the band gap (BG) could be tuned by the intervention of Yb and Zn ions, which enhance the photocatalytic activity of the developed material. Finally, the investigators used this material for the remediation of methylene blue dye (MB) from textile wastewater, and achieved about 96.1 removal percentage at 7 pH and followed first-order kinetics [18]. A team led by Shahzad reported the synthesis of organic (3-methacryloxypropyltrimethoxysilane) and inorganic (sodium silicate) silicon precursors to create template-supported nano-adsorbents made of mesoporous organosilica (MPOS) to remove methylene blue and methyl orange dye contamination. The MPOS nano-adsorbent demonstrates MB and MO adsorptions of 93.1% and 66.7%, respectively, due to its simple handling and effective adsorption capacity. Using the multilayered sorption process, the MPOS demonstrated adsorption capabilities of 57.58 mg/g for MB and 56.62 mg/g for MO due to high-surface contacts of the adsorbate on the active sites of the adsorbent [19]. A team led by Nazir developed a surface-induced growth of ZIF-67 at co-layered double hydroxide which had a sand-like structure. Further, the investigators have used this developed material for the adsorption of MB and methyl orange dye from the wastewater. The developed materials exhibited better adsorption capacity for both dyes [20].
Recently Modi and their colleagues also provided detailed information about recent approaches for the remediation of MB dye from wastewater by using these zinc oxide NPs and their nanocomposites [21]. Another approach by Modi and their colleagues showed that when ZnO-NPs and bacterial consortium are used together, there is a possibility for obtaining a higher photocatalytic degradation efficiency for the methylene blue dye [22].
In the present research work, investigators have synthesized tungsten and antimony-doped zinc oxide nanoparticles by a chemical method. Both dopants were used due to their noble dopant properties. The confirmation of doping and other materials properties of the synthesized doped nanomaterials was performed by various analytical instruments. Generally, ZnO-NP alone does not have much effect on the photocatalytic degradation of the dyes. The first objective was to develop a noble and efficient photocatalyst for dye removal from the aqueous solution. Another objective was to assess the morphological and chemical properties of the developed photocatalyst material. One more objective was to assess the potential of the developed photocatalyst for the photocatalytic degradation of dye. One final objective of this study was to evaluate the effect of various parameters such as pH, the dosage of nano photocatalyst, and time on the photocatalytic degradation of dye.

2. Materials and Methods

2.1. Materials

Tungsten oxide (WO3) (Rankem, Ahmedabad, Gujarat, India), ammonium solution (NH4OH) (Rankem, Ahmedabad, Gujarat, India), sodium hydroxide or NaOH (SRL, Ahmedabad, Gujarat, India); antimony chloride (SbCl2) (Rankem, Pune, Maharashtra, India); Zinc nitrate or Zn(NO3)2 (Rankem, Pune, Maharashtra, India). All the chemicals used were AR grade having 99.99% purity and used as received.

2.2. Synthesis of ZnO-NPs

ZnO-NPs were developed by the direct precipitation technique using Zn(NO3)2 and NaOH as precursors. About 0.2 M of Zn(NO3)2 and 0.4 M NaOH aqueous solution were prepared in double distilled water (ddw), separately. An aqueous solution of Zn(NO3)2 was taken in a round bottom flask (RBF). The sodium hydroxide solution prepared above was continuously added dropwise into the RBF-containing precursor solution. The reaction mixture (RM) was vigorously stirred on a magnetic stirrer at room temperature (RT), until there was a formation of white-colored suspension. The centrifugation of the reaction mixture was carried out at 6000 rpm for 15 min to obtain the precipitate; the latter was firstly washed 2–3 times with ddw, and the final washing was performed by using ethanol followed by drying at 105 °C in an oven for 6 h [23,24].
Reaction scheme of the chemical synthesis of ZnO-NPs is shown in Equations (1) and (2).
Zn ( NO 3 ) 2   · 6 H 2 O   ( aq ) + 2 NaOH   ( aq ) Zn ( OH ) 2 ( aq ) + 2 NaNO 3 + 6 H 2 O
Zn ( OH ) 2 Drying   at   105   ° C   ZnO + H 2 O

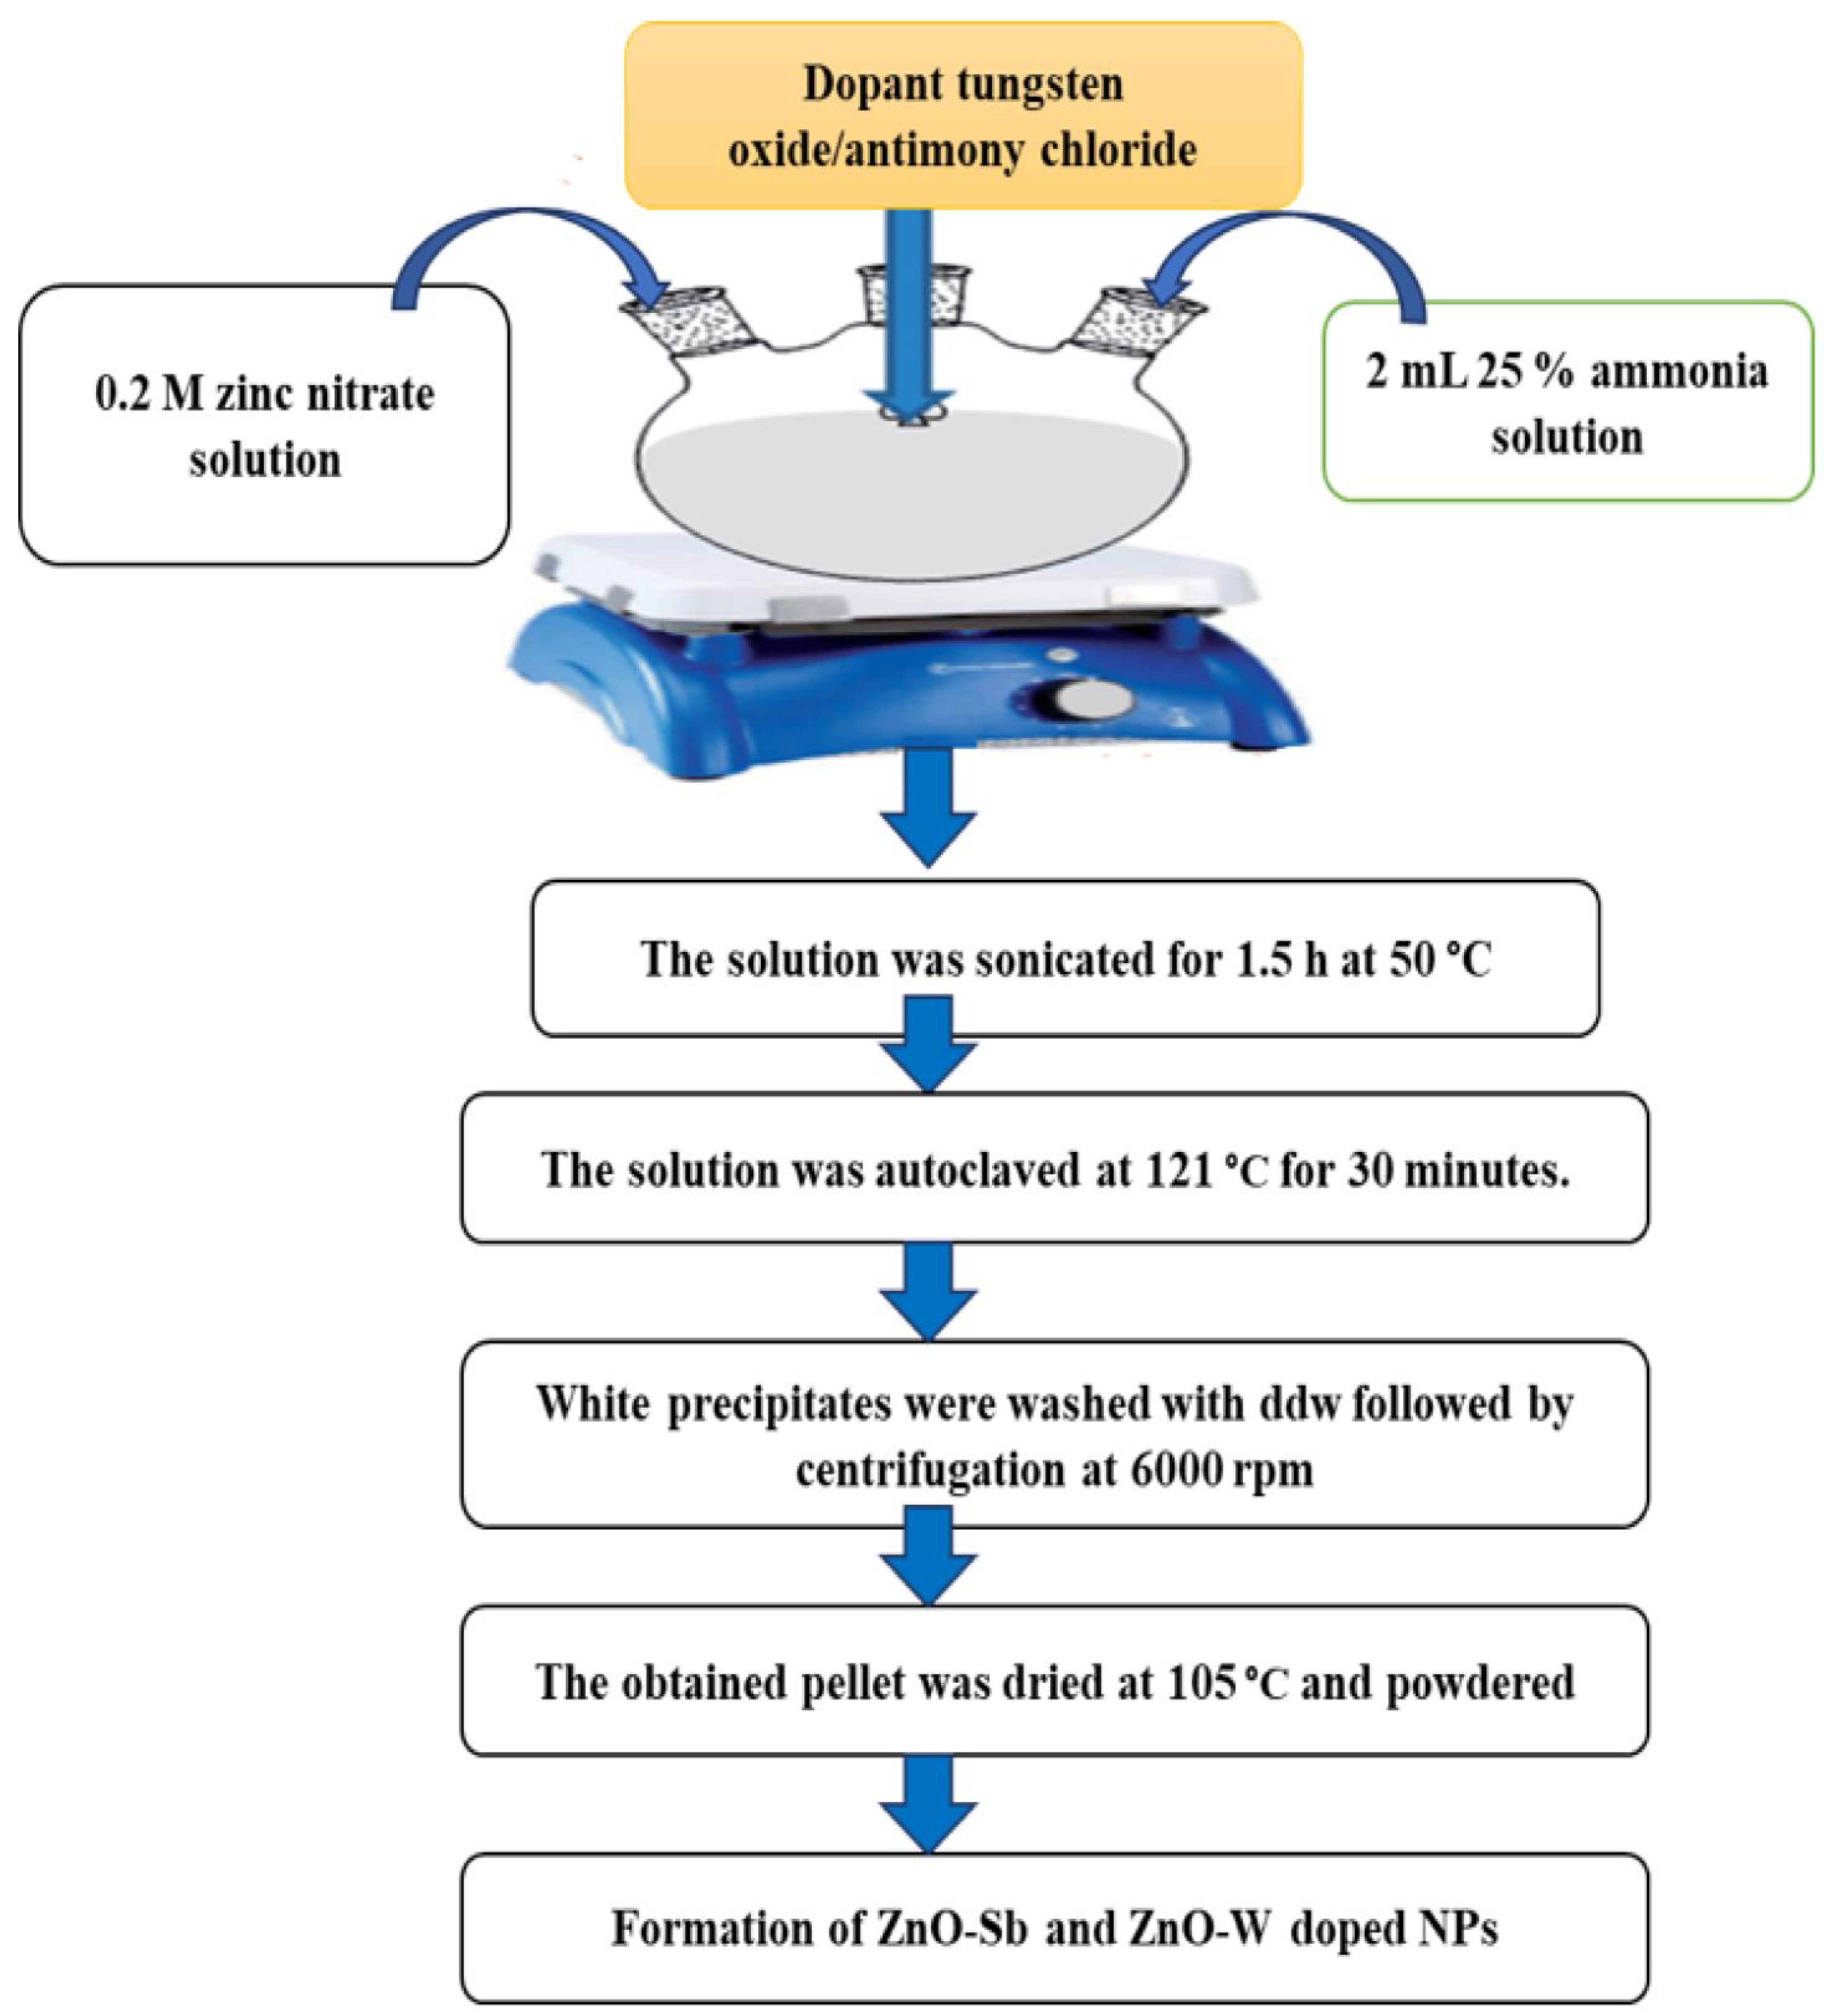
2.3. Synthesis Procedure for Doped ZnO

The doped ZnO-NPs were developed by a sonochemical-assisted precipitation approach. The sonication process modifies the distribution of particles by ultrasonic waves that increases the available surface area (SA) which may exhibit a similar impact on photocatalyst activity [25]. The main benefit of using a sonochemical is that it collapses the bubble through acoustic waves. Sonication is responsible for creating defects in the material’s internal structure, leading to enhanced pores in the material. As a result of the formation of pores in the material, the accessibility of dopant ions into the lattice becomes easier. Tungsten oxide and antimony chloride were used as the dopant material precursors for the development of tungsten-doped ZnO (ZnO-W) and antimony-doped ZnO-NPs (ZnO-Sb). About 0.2 M Zn(NO3)2 and 0.001 M tungsten oxide (WO3) were taken in 50 mL ddw. Until the formation of a precipitate, there was the addition of ammoniacal solution (25% strength), dropwise. Moreover, there is an additional 10 drops of the solution to obtain a clear solution. Further, the RM was transferred to an RB flask and kept in an ultrasonicator for 1.5 h at 50 °C. After the completion of the sonication, the RM turned clear white and, gradually, the solid suspension in the RB flask began to settle. The solution was autoclaved at 121 °C for 30 min, after which RM was brought to RT. Additionally, the centrifugation of RM was performed at 6000 rpm for 10 min, followed by washing 2–3 times with ddw. The final precipitate was oven dried at 105 °C. The precipitating agent used here was an ammoniacal solution in order to facilitate the reaction between ZnCl2 and WO3 [26]. A similar procedure was used for the development of antimony-doped ZnO-NPs. The overall procedure is depicted in Figure 1.

2.4. Photocatalytic Degradation of MB Dye

The photo degradability of MB was analyzed by challenging the MB solution to solar and UV irradiation [6W UV A lamp (2 Nos), Philips, Amsterdam, Germany]. The photodegradation experiments were carried out by pristine and doped ZnO-NPs. From the literature, it is evident that there are several parameters that could affect PCD efficiency, for instance, synthesis technique, dopant concentration, the distribution of dopants inside the lattice structure, and the energy level of the dopant within the lattice structure [27]. For the examination of photocatalytic efficiency of the pristine and doped ZnO-NPs, 100 mL of varying concentrations of MB dye (10, 25, 50 ppm) was shifted in a beaker, and 30 mg of the photocatalyst was obtained. Sample collection was performed at regular intervals and then centrifuged. Firstly, the suspension was allowed to stir under a completely dark environment for half an hour prior to photocatalytic degradation (PCD), to reach the adsorption–desorption equilibrium. The agitation speed was about 600 rpm throughout the experimental conditions. For the activation of the nano-photocatalyst, the reaction mixture was kept under sunlight at a fixed rpm. Once the irradiation under the sunlight was over, centrifugation of all the samples was performed at 5000 rpm (15 min) to ensure the elimination of the NPC from the sample. The analysis of the leftover, MB dye in the solution was performed by UV-Vis at 665 nm [21,28,29,30,31]. The schematic diagram for UV light irradiation and the experimental setup is represented in Figure 2. The confirmation of PCD of MB dye was also performed by measuring the percent removal in chemical oxygen demand (COD), as per Equation (3):
Percent   reduction   ( COD ) = ( C 0 C t ) C 0 × 100                      
where,
C0 = initial concentration of MB dye,
Ct = final concentration of MB after PCD
Figure 2. Schematic, experimental set-up for MB dye degradation under UV light.
Water 15 02275 g002

3. Characterization of Pristine and Doped Zinc Oxide Nanoparticles

A pinch of pristine ZnO-NPs, and both the doped ZnO-NPs, was taken in a sample vial and sonicated for 10 min in an ultrasonicator (Sonar, 40 kHz, Ahmedabad, Gujarat, India) to obtain a dispersed solution. This dispersed solution was divided into three portions out of which 4 mL was taken for UV-Vis measurement, the second portion was loaded on a carbon-coated Cu grid for transmission electron (TEM) analysis, and the third portion was utilized for loading the sample on a glass slide for atomic force microscopy (AFM) analysis. Firstly, 2 mL samples were taken and UV-Vis measurement was carried out from 200–800 nm at a resolution of one nm. The UV-Vis measurement was performed by using a Double beam spectrophotometer (Shimadzu DB-200, Kita-ku, Okayama, Japan). The sample for TEM was prepared by using the drop-casting technique, as mentioned above, after which the sample-loaded grids were dried in a hot-air oven followed by imaging using FEI, Model Technai G2-Twin (200 kV, FEI, Lexington, KY, USA). In order to reveal the various molecules along with their groups on the surface of all three samples, Fourier transform infrared spectroscopy (FTIR) measurement was conducted. For FTIR analysis, a solid pellet was prepared by mixing KBr and each sample separately. The FTIR measurement was performed in the IR regions of 400–4000 cm−1 at a resolution of one nm by using the SP-65 (Perkin Elmer, Waltham, MA, USA), instrument. For the surface morphology, Field emission scanning electron microscope (FESEM) analysis was conducted; samples were placed on a tape (carbon) with the help of a fine spatula. The carbon tape was in turn placed on an aluminum stub which was placed in the sample holder. The imaging of the samples was performed at different magnifications by using Novo Nanosem, 450 FEI (Eindhoven, The Netherlands). The elemental composition of all the materials was revealed by using an EDS analyzer (Oxford) attached to the FESEM. The identification of the crystalline phase in the synthesized NPs was analyzed by using powder X-ray diffraction (XRD). The analysis of all the powder samples was conducted using the D8 Advance Bruker (Bremen, Germany) instrument. The scanning of all three samples was performed under the following parameters; scanning range of 2-theta = 10–80, step size = 0.02 with time = 5 s per step, voltage applied = 40 kV, and current = 30 mA. The porosity and surface area of all three synthesized ZnO-NPs were performed by using Brunauer–Emmett–Teller (BET) and Barret–Joyner–Halenda (BJH) models. Pore volume size distribution was assessed by using the BJH model through the N2 adsorption–desorption isotherms measurements. The calculations of SSA value were performed by using a liner arrangement, and measurement was carried out by using the Micromeritics ASAP 2000 type instrument (Norcross, GA, USA). BG was analyzed by the UV-Diffuse Reflectance Spectroscopy (DRS) of all three samples. The DRS spectra of all three ZnO-NPs were assessed by using the Kubelka–Munk theory. The calculation of the BG was performed by the Kubelka–Munk formula as shown (4),
K = ( 1 R ) 2 2 R
where K = transformed reflectance as per Kubelka–Munk
R = % Reflectance

4. Results and Discussion

It is very necessary to correlate the physical, structural, and chemical features and PCA of the developed, doped and bare ZnO material. The formed ZnO nanomaterials were analyzed by numerous sophisticated analytical devices to reveal the dopant ions’ influence on the features of ZnO-NPs.

4.1. UV-Visible Spectroscopic Analysis

By using the UV-Vis spectroscopy optical properties, both doped and undoped ZnO-NPs were studied, which is shown in Figure 3. The absorbance peak was obtained at ~370 nm, which indicates the trademark band for hexagonal wurtzite ZnO. In comparison to undoped ZnO-NPs, doped ZnO exhibited a red shift in the absorbance peak, which could be assigned to the development of shallow levels inside the BG. These shallow gaps formed because of the presence of outside atoms in the lattice. The optical BG became decreased, which is indicated by the shifting of the absorbance peak at a higher wavelength [32,33]. Recently, Modi and Fulekar (2020) and (2021) [34,35,36] also obtained similar results for pristine ZnO-NPs, while their team also worked with the doped ZnO-NPs and the results were in close agreement. Jaychandran et al. also obtained bands for ZnO-NPs at 320 nm, which were synthesized by the leaf extracts of Cayratia pedate [37], while Ghamsari et al. obtained peaks at 310 and 380 nm [38].

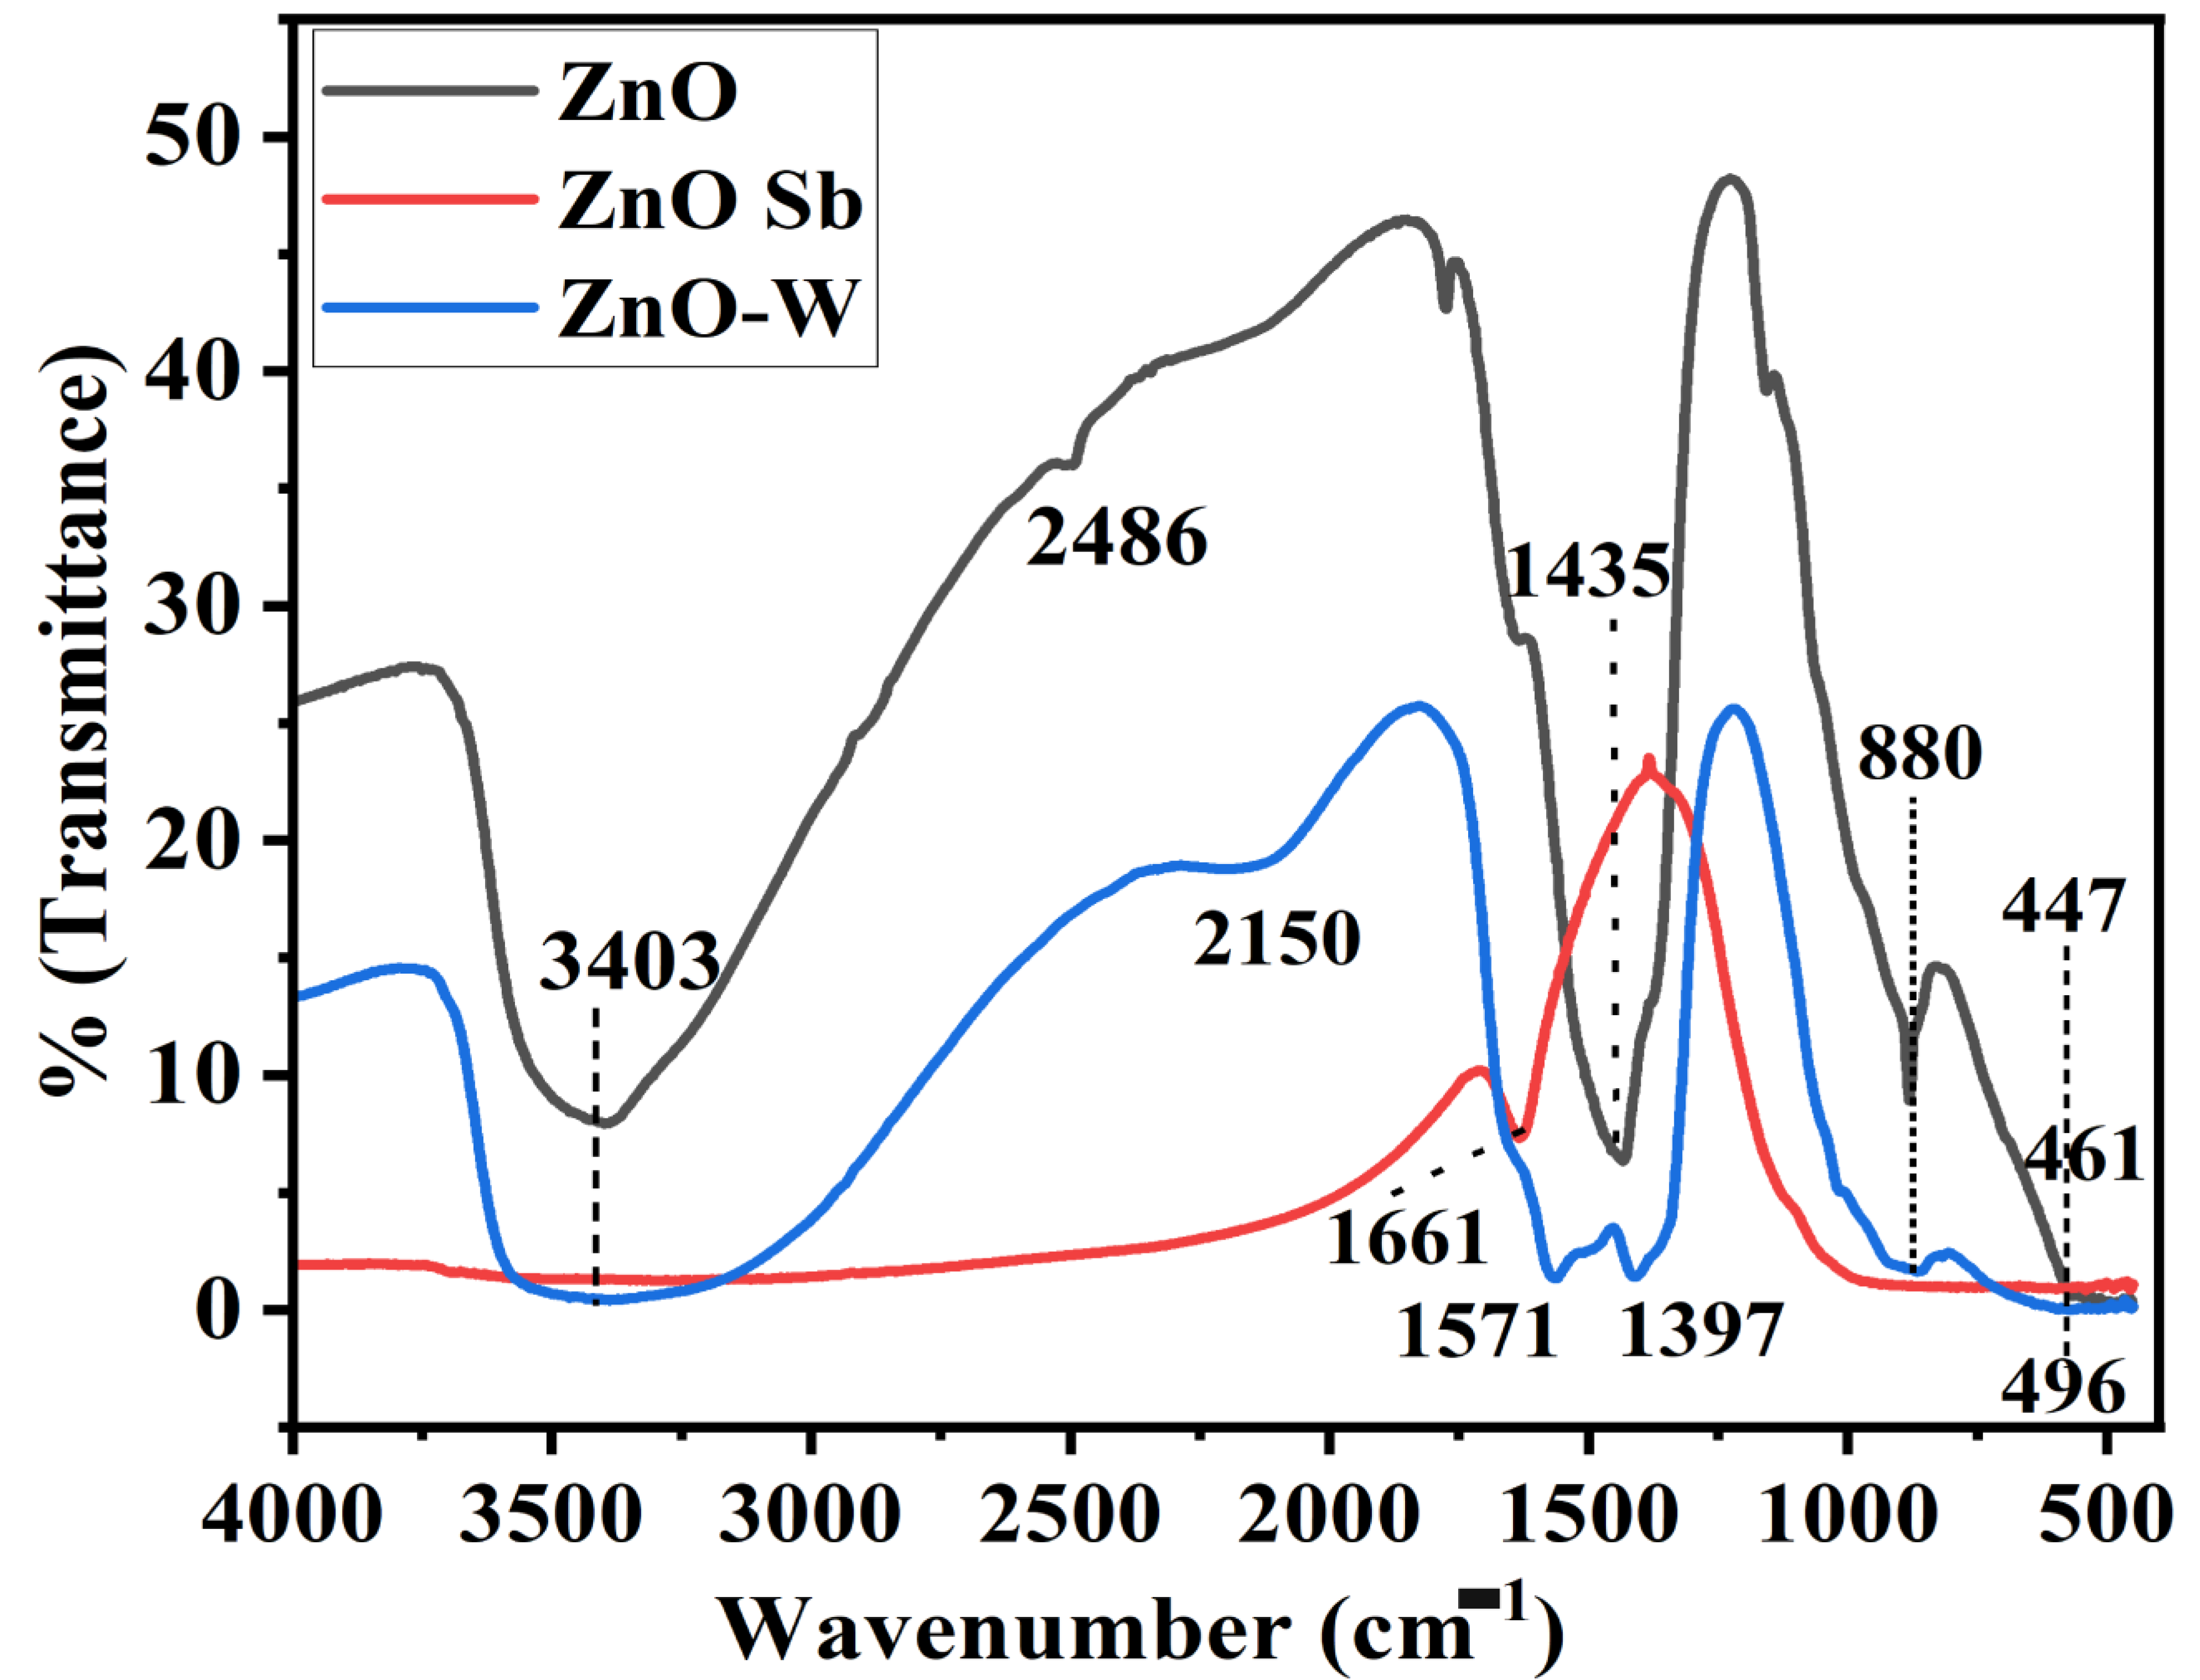
4.2. Identification of Functional Groups by FT-IR

A typical IR spectrum of both doped and undoped ZnO-NPs is depicted in Figure 4. The characteristic band of ZnO is in the region of 400–900 cm−1. A band at 447, 461 and 496 cm−1 are attributed to the ZnO stretching vibration in pristine ZnO, ZnO-Sb and ZnO-W, respectively [39]. It is similarly observed in a pristine and doped ZnO with slight shifting in peak position, depending on the frequency of the dopant. ZnO stretching of the doped ZnO-NPs was observed at 496 cm−1 in ZnO-W and 461 cm−1 for the ZnO-Sb. The typical bending and stretching of the doped nanomaterials were shifted due to the incorporation of dopant-ZnO. The band in the region 1430–1460 cm−1 is mainly attributed to the C-C bond, which confirms the presence of organic molecules in the samples. A broadband observed in all three samples in the region of 3750–3000 cm−1 is attributed to the O-H stretching of H2O and ZnOH molecules [40,41]. The majority of the bands for the ZnO-NPs were in close agreement with the previously obtained results by Modi et al. and Soltani et al., where Soltani et al. obtained the bands for the scallion peel-mediated synthesized ZnO-NPs at 510.3, 603.9, and 790.1 cm−1 [42]. Modi et al. also obtained the bands for onion peel-mediated synthesized ZnO-NPs in the range of 500 to 800 cm−1 [36]. Jaychandran et al. also obtained bands for Cayratia pedata leaf extract-mediated synthesized ZnO-NPs, at 435.4 and 491.41 cm−1 for ZnO bonds [37].

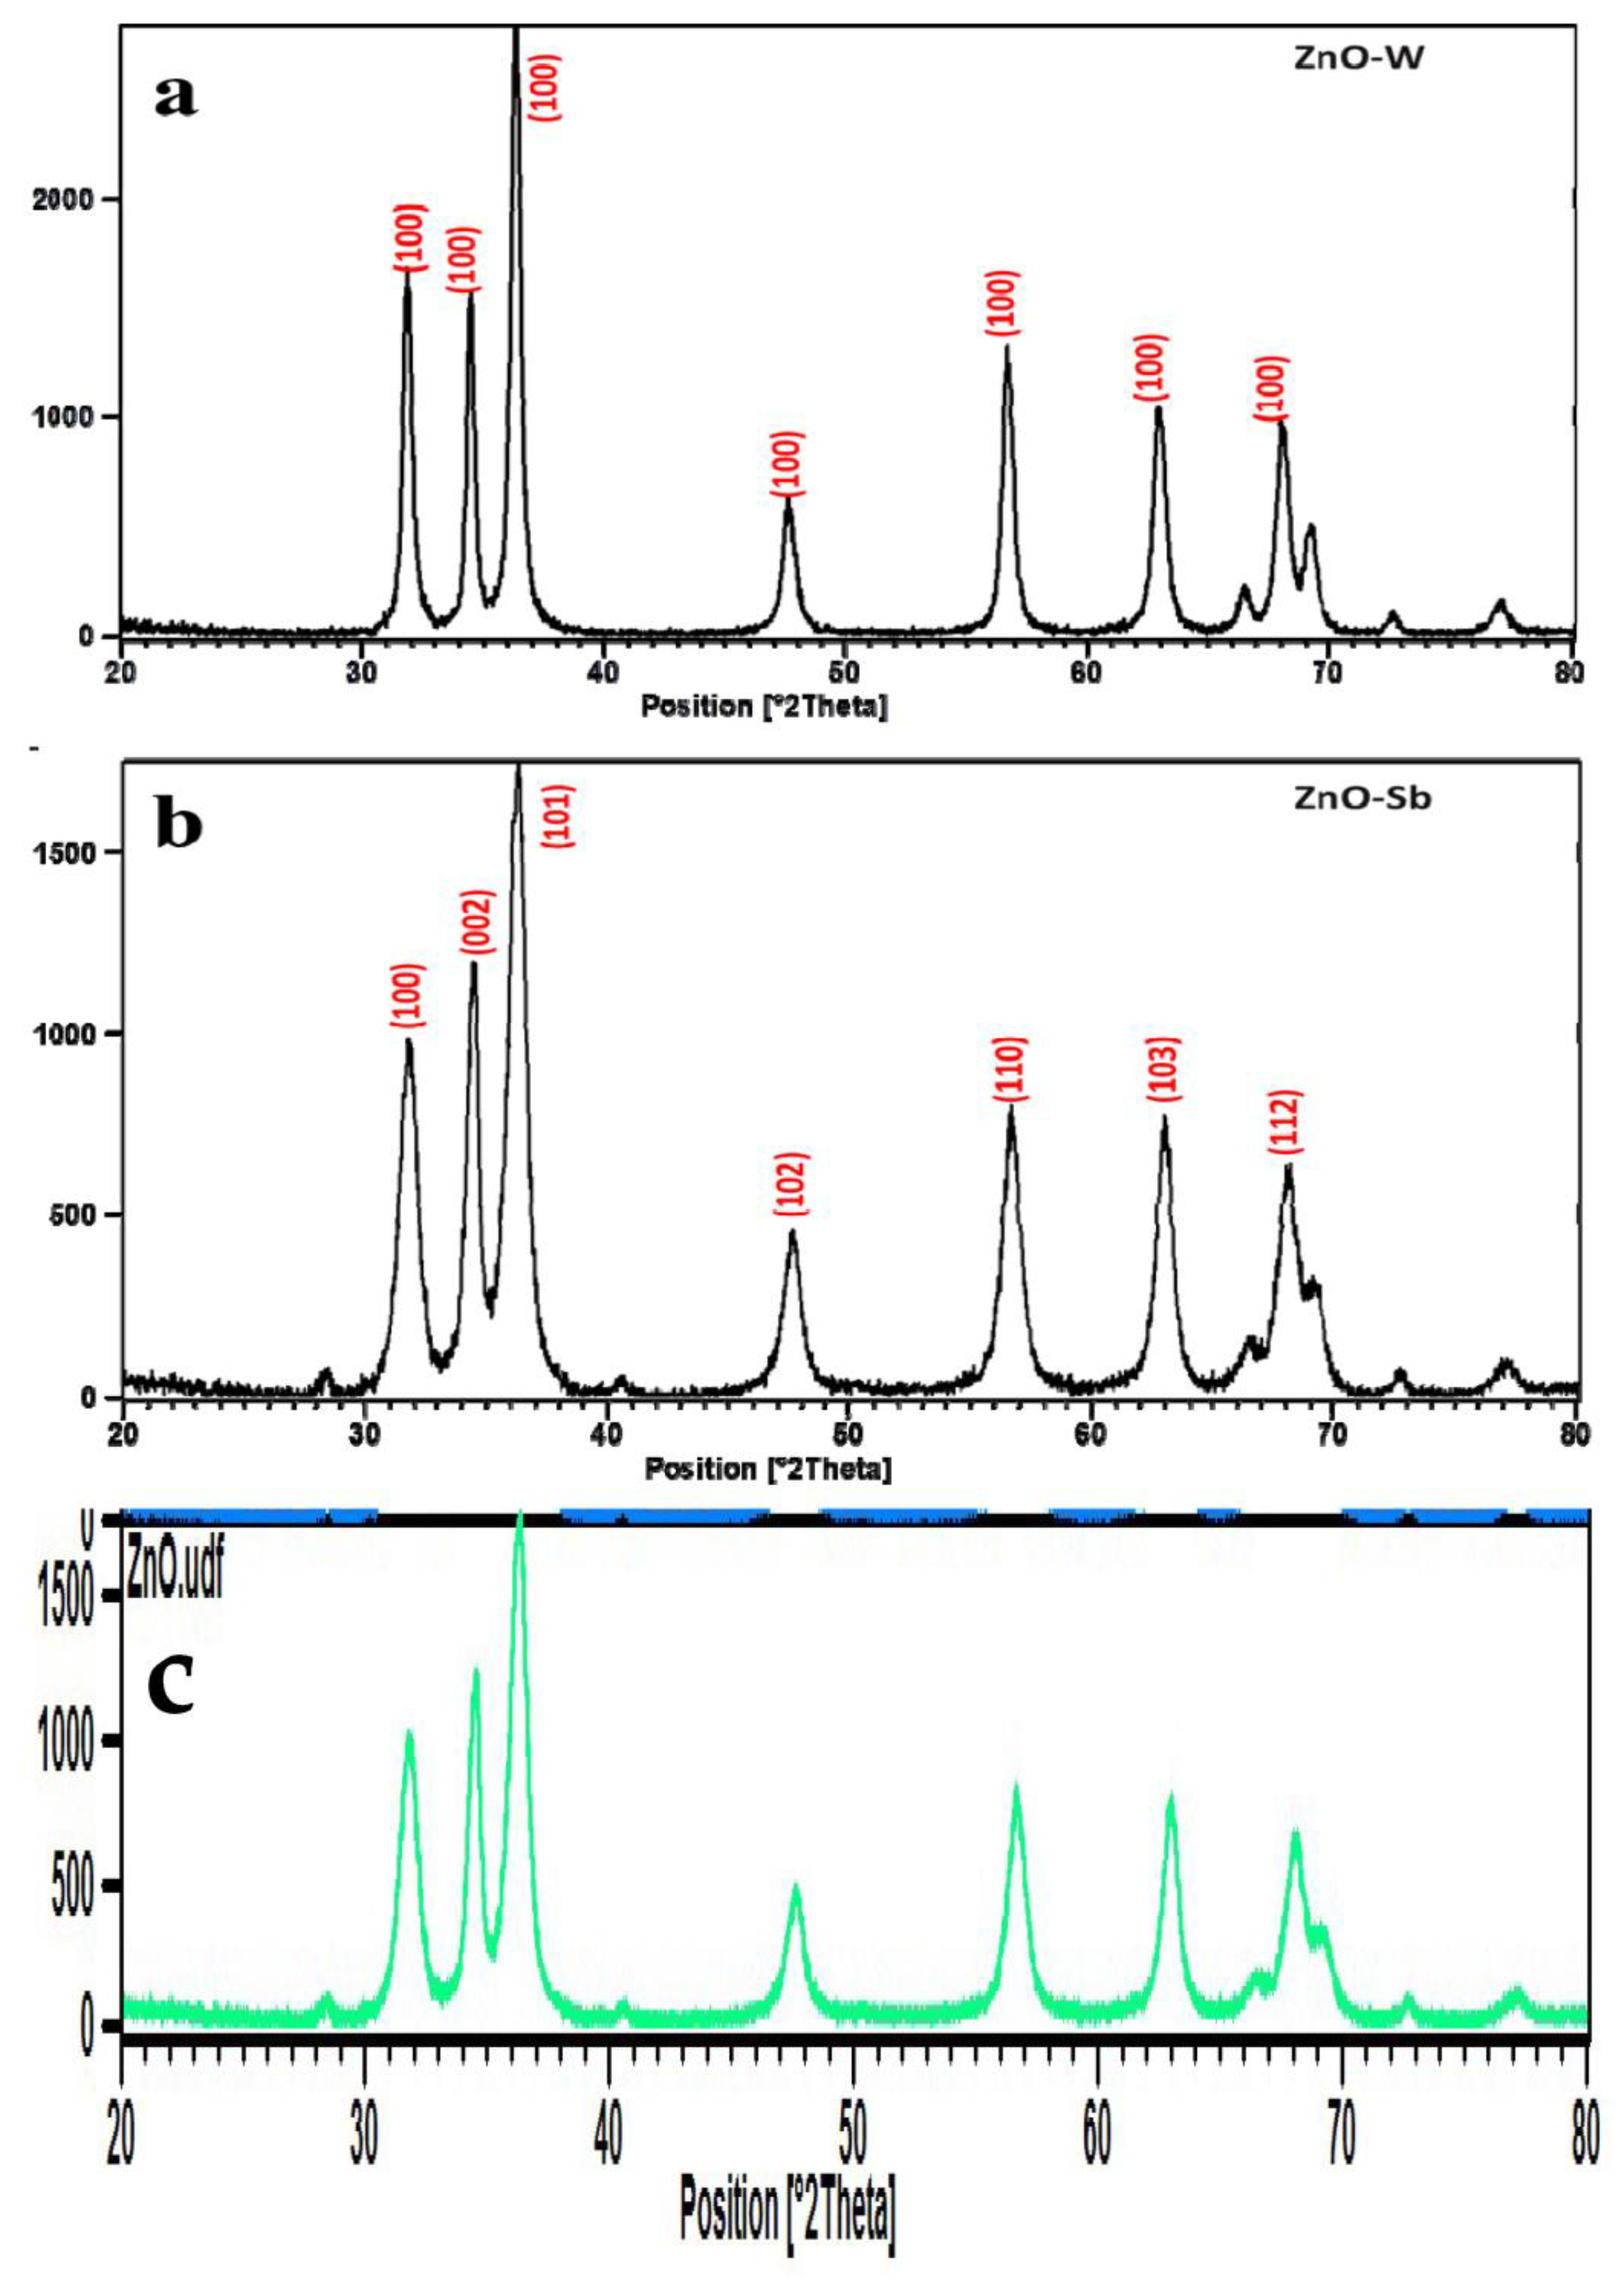
4.3. Phase Identification by X-ray Diffraction (XRD)

A typical XRD pattern of ZnO-NPs and doped ZnO-NPs is depicted in Figure 5, which exhibits a sharp, narrow, and strong diffraction peak. This exhibits better crystalline nature of doped ZnO-NPs. The obtained results were compared with standard JCPDS data [26]. XRD diffractogram showed that the synthesized-doped nanomaterials are single-phase, crystalline nanoparticles, and peaks were matched with the standard JCPDS, and it was observed that all the diffraction peaks in close agreement with the standard JCPDS data (JCPDS-ICDD Card no 36-1451) were of ZnO [43,44]. Figure 5c is showing a comparative XRD pattern for all three types of ZnO-NPs. The obtained results confirm that the ions of the dopant material were successfully incorporated into the crystal lattice of the host ZnO-NPs. As a result of doping, it has been observed that the peak intensity shifted toward a slight angle. Not much difference was found, which could be assigned to the successful incorporation of dopant material into the ZnO lattice [17,45]. From these results, it was found that both crystal structure and peak-intensity determination are strongly affected by the ionic radii. Table 1 is showing major peaks of as-synthesized ZnO-NPs and both the doped ZnO-NPs (ZnO-Sb and ZnO-W). Jayachandran et al. synthesized ZnO-NPs by using leaf extracts of Cayratia pedata and obtained peaks for XRD at 31.57° (100), 34.24° (002), 36.07° (101), 47.36° (102), 56.42° (110), 62.69° (103), 67.77° (112) and 68.91° (201), which are in close agreement with the current synthesized ZnO-NPs [37].

4.4. Morphological Analysis by Microscopic Techniques

4.4.1. Size Analysis of As-Synthesized and Doped ZnO-NPs by TEM

The TEM micrographs reveal the morphology of the as-synthesized and both the doped ZnO-NPs. Figure 6a–c depicts the TEM micrographs and particle size distribution (histogram) of ZnO-NPs respectively. Figure 6d,e is the TEM micrographs of ZnO-W NPs while Figure 6f is the histogram of ZnO-W NPs. Figure 6g,h is the TEM micrographs of ZnO-Sb NPs while Figure 6i is the histogram of ZnO-Sb NPs. It was observed that doped ZnO-NPs were found comparatively larger than the pure ZnO-NPs which could be due to doping. Moreover, ZnO-W exhibited a hexagonal shape while ZnO-Sb showed a spherical shape. From this, it was concluded that the changes in the surface morphology are governed by the doping of the material. For undoped ZnO-NPs, the average size was (16.57 nm), while doped ZnO-NPs-W was (18 nm) and ZnO-Sb was (10 nm), respectively. So, in comparison to undoped ZnO-NPs, a slight increase was noticed when doped with W, while a sharp decrease in the size of ZnO was observed when doped with Sb. ZnO-NPs doped with Sb appear in a uniform and consistent shape with a marginally constricted size distribution. For the Sb-doped ZnO-NPs, sizes continue decreasing because of even or homogeneous diffusion of Sb in the different sites [46,47]. Modi and their team obtained spherical-shaped ZnO-NPs with sizes varying from 20–80 nm.

4.4.2. Morphological Analysis of As-Synthesized and Doped ZnO-NPs by FESEM

FESEM analysis was used for the primary investigation and identification of the surface morphology of doped ZnO nanomaterials. The FESEM images were recorded at different magnifications for all three ZnO-NPs samples. FESEM micrographs of undoped ZnO-NPs (Figure 7a), while Figure 7b shows doped ZnO where the ZnO nanospheres were observed. Soltani et al. and Modi et al. also observed similar morphology for the onion peel and scallion-mediated synthesized ZnO-NPs, respectively. Soltani and their team also reported spherical-shaped particles of size 40–100 nm along with aggregation of the ZnO-NPs [42]. Modi and their colleagues also obtained spherical particles whose size varied from 40–120 nm along with aggregation of the particles [36]. The changes in the morphological features of the ZnO-NPs after doping could be because of the ultrasonication method. Figure 7c shows the FESEM micrograph of ZnO-Sb.
EDS examination was carried out to confirm the elemental composition and purity of doping in pristine and doped ZnO-NPs, respectively. EDS spectra revealed that the doped ZnO-NPs were present in significant amounts along with minute carbon impurities found in ZnO and ZnO-W. All the EDS spectra showed peaks for O and Zn at 0.5 and 1 KeV, respectively. The EDS analysis confirms the presence of the dopant which is represented in Figure 7b,d,f).

4.5. Band-Gap Study by UV-DRS

This study was conducted to calculate the energy BG, which is shown in Figure 8. The undoped ZnO exhibited a BG energy of 3.39 eV, ZnO-W exhibited 3.13 eV and ZnO-Sb exhibited 2.95 eV. The decrease in the BG values might be due to the shrinkage effect of the optical band. The variation in the optical BG might be because of the broadening of the CB and VB present with the interaction among s, p, and d electrons of host and dopant atoms [48,49]. The lower BG value enables the photocatalysts active in visible light irradiation.

4.6. Surface Area Analysis by BET

As photocatalytic events take place at the surface of the photocatalyst, it is very crucial to calculate the surface area. The photocatalytic phenomenon of metal oxides is greatly influenced by the two parameters, i.e., surface area and surface defects. So here, both these factors, in addition to BG, were caused due to the incorporation of dopant ions [2,36,50]. The synthesized ZnO nanomaterials follow the classical type IV adsorption isotherm, which is a trademark feature of mesoporous materials (2–50 nm). BET surface area and BJH pore diameter of undoped ZnO-NPs and doped ZnO-NPs are shown in Figure 9 and briefed in Table 2.

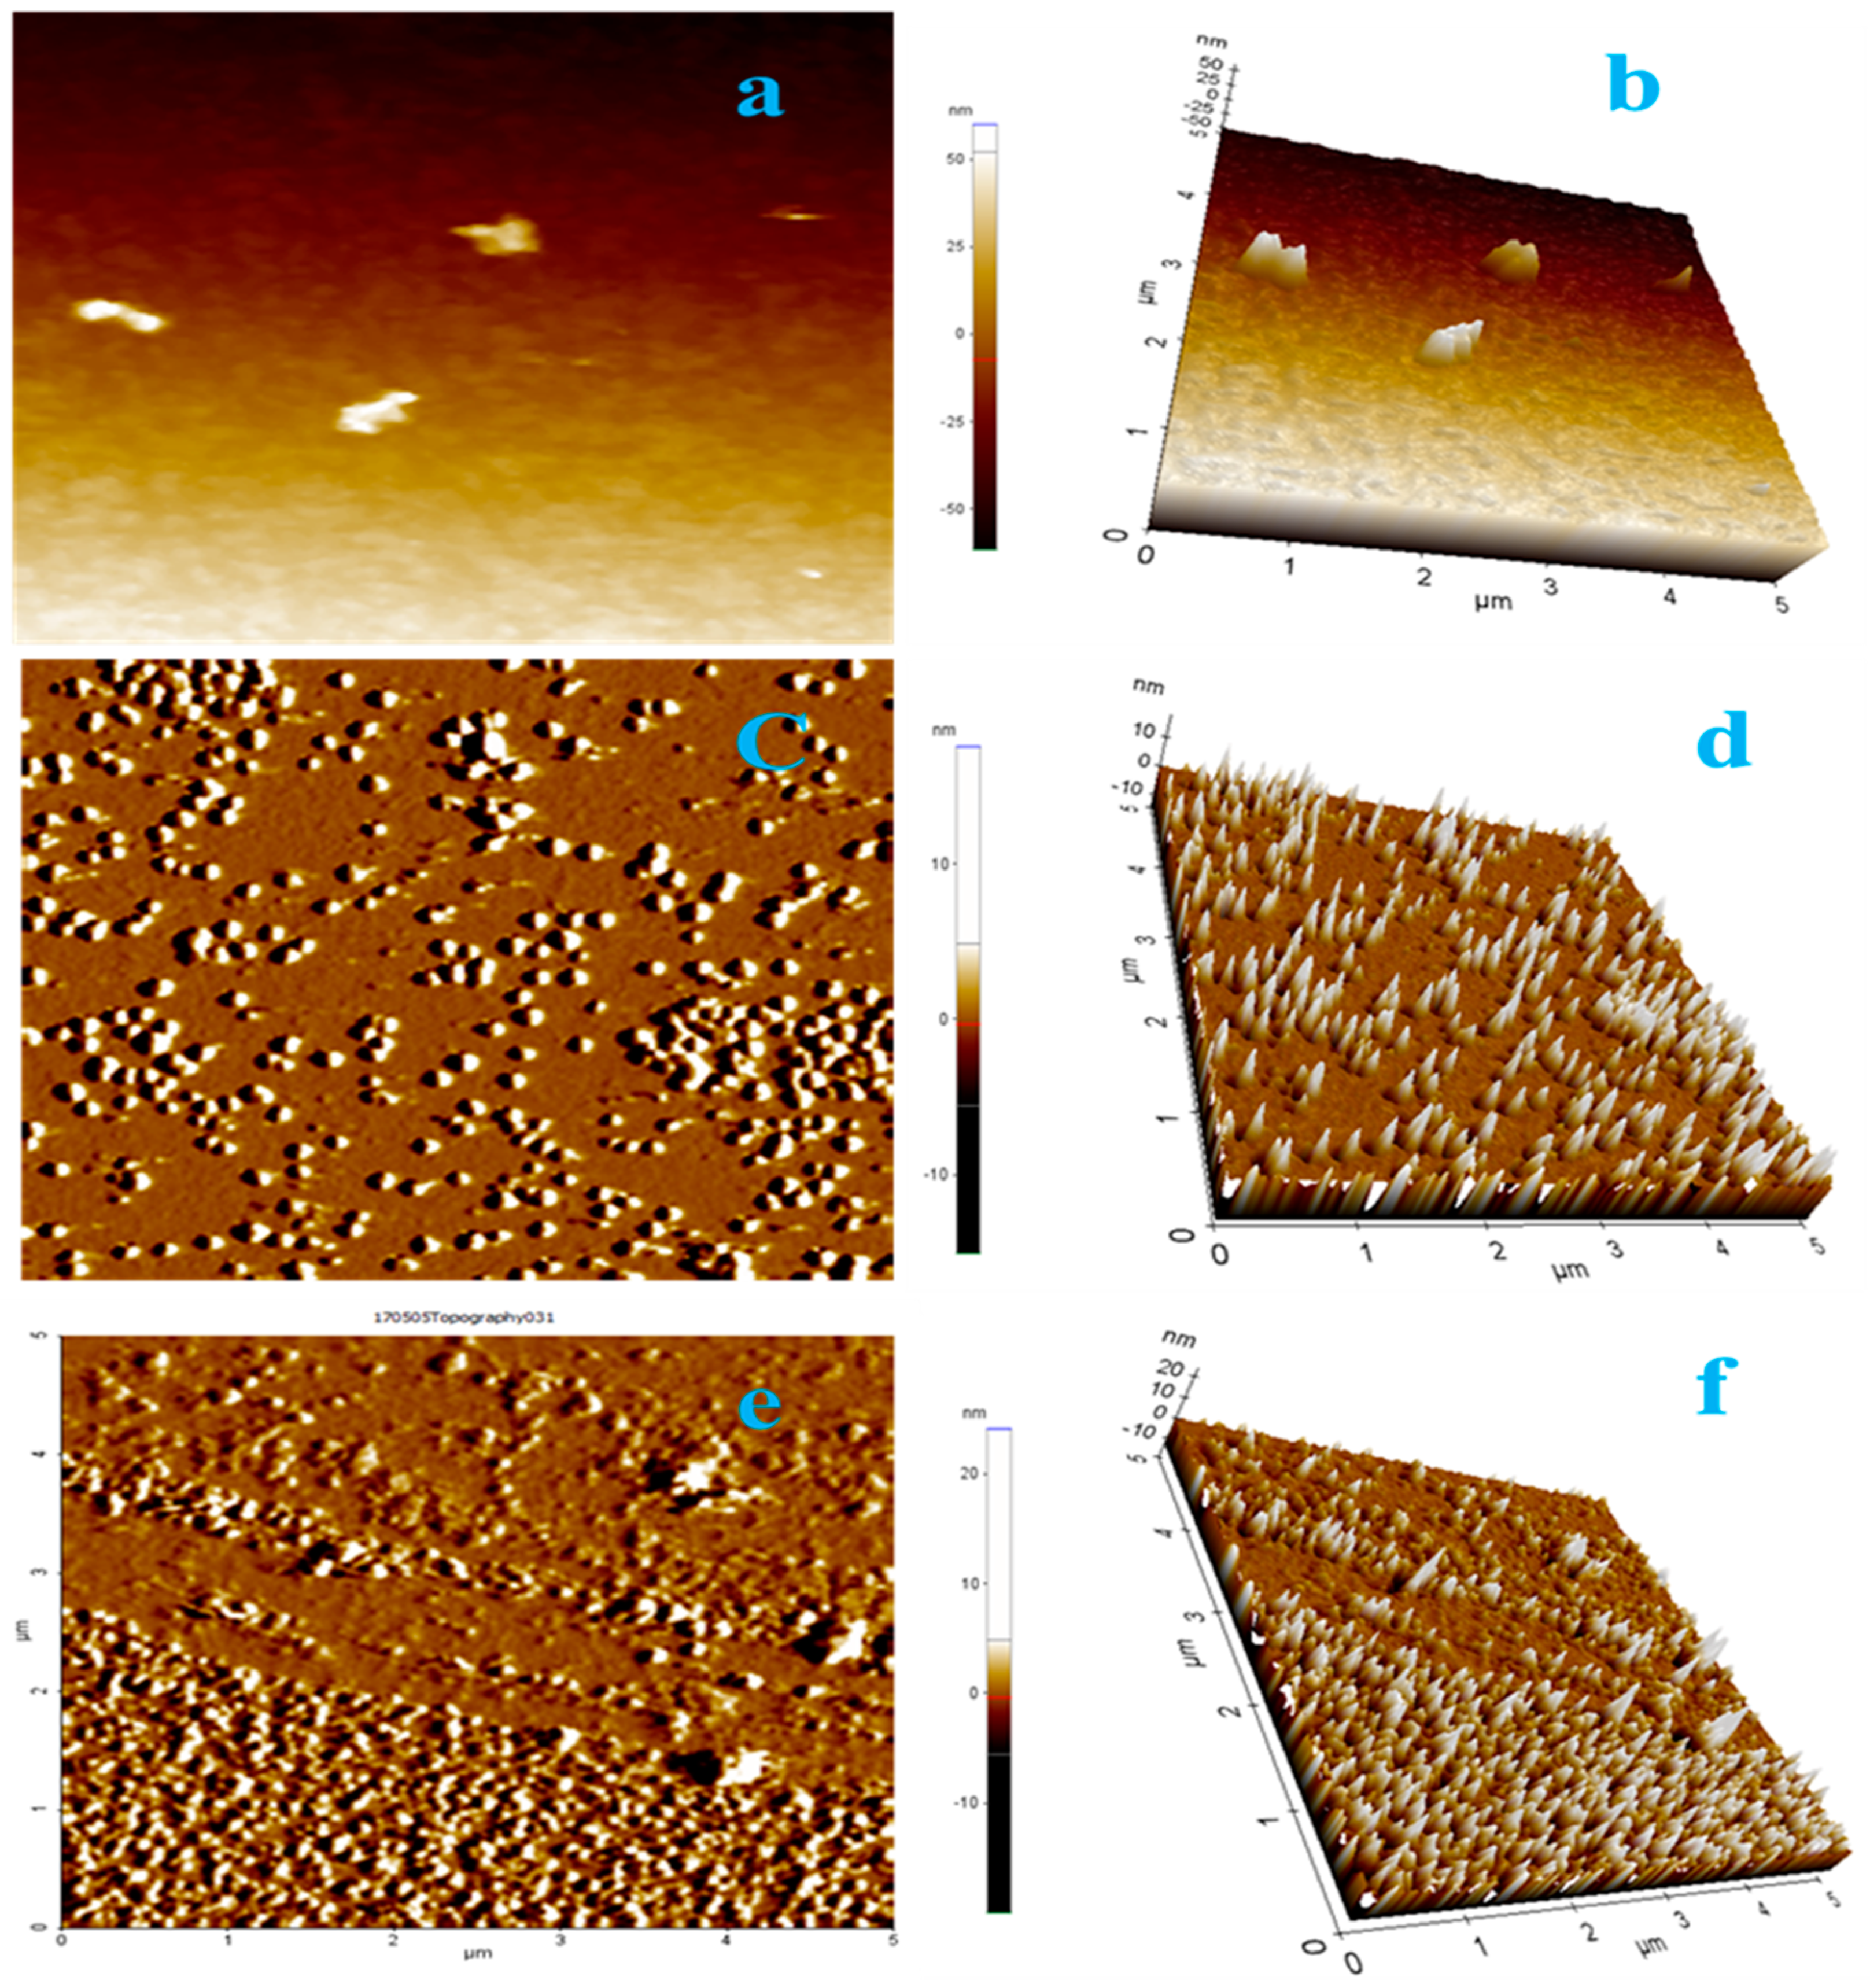
4.7. AFM for 3D Structure and Surface Topography

The surface topography of all three types of ZnO-NPs was analyzed by AFM. The brightness of AFM plots for ZnO-Sb confirms its purity, and the well distribution of nanoparticles was observed. Figure 10a,c,e show the two-dimensional images of ZnO-NPs, ZnO-W, and ZnO-Sb, respectively, whereas Figure 10b,d,f show three-dimensional micrographs at 5 × 5 µm2 of ZnO-NPs, ZnO-W, and ZnO-Sb, respectively.

5. Degradation Study of MB Dye
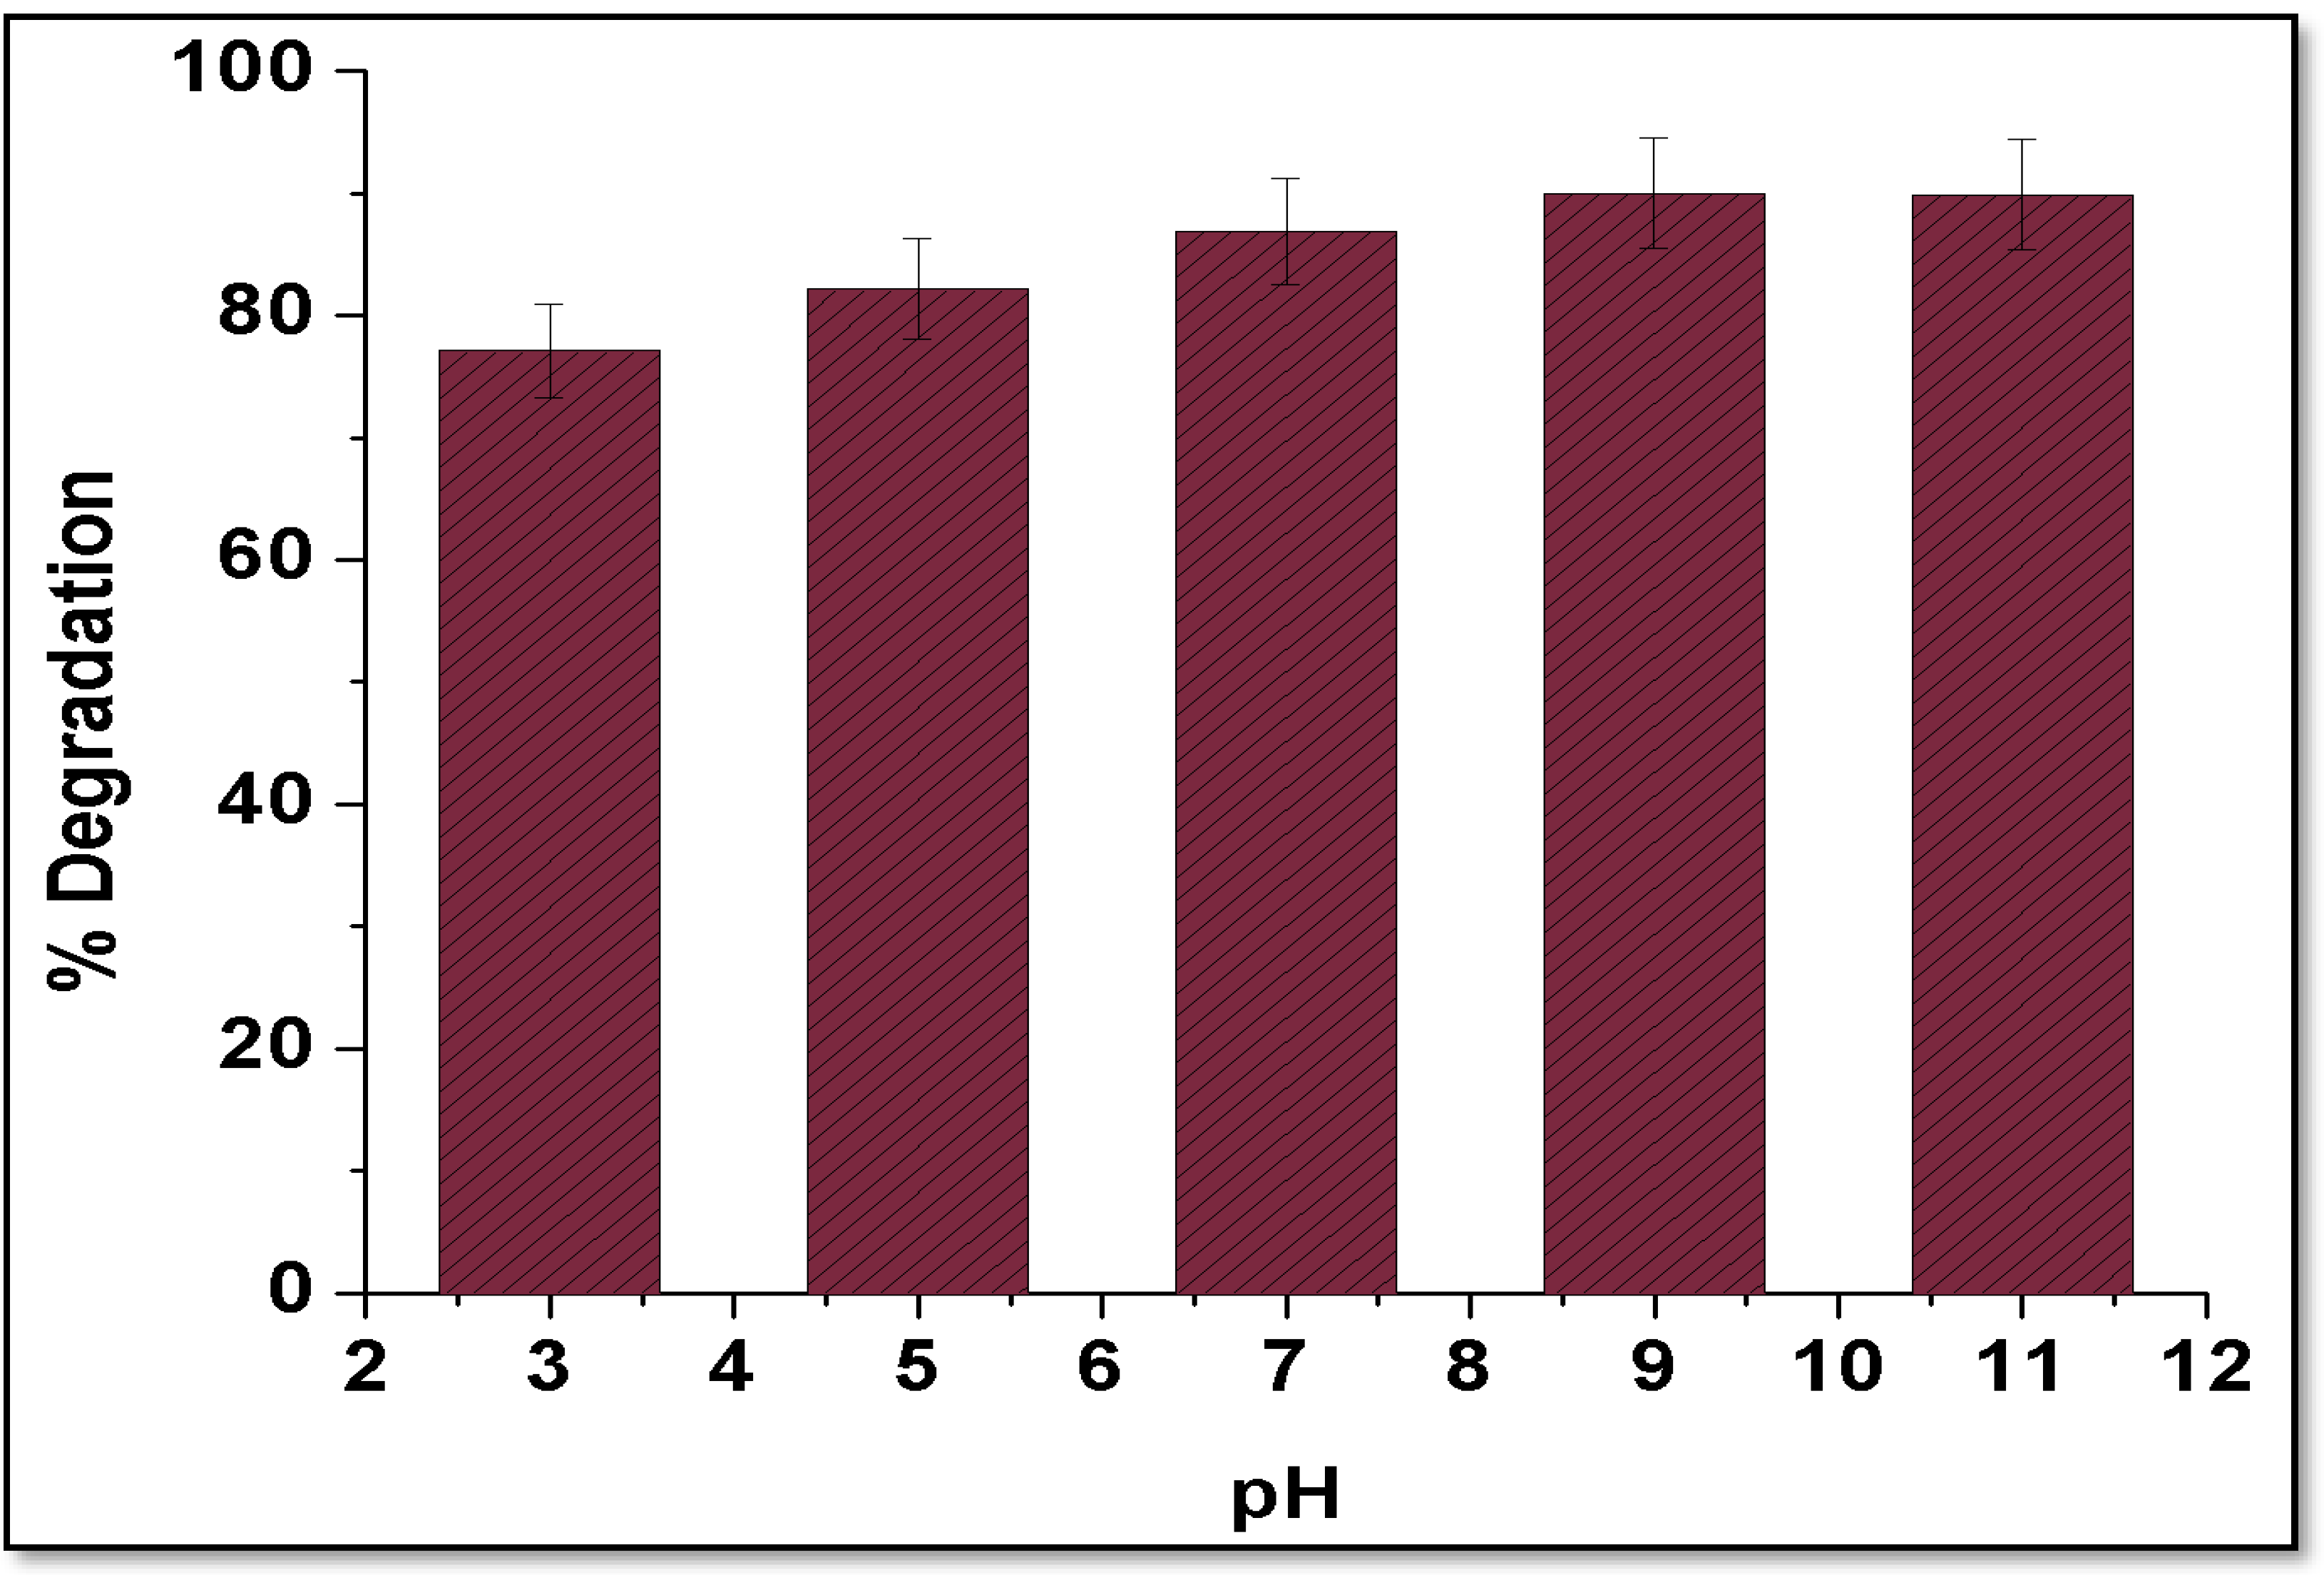
5.1. Effect of pH

pH is considered to have an important role in any PCD study. From the various pieces of literature, it has been evident that pH controls their reaction during the removal of organic and inorganic pollutants from the contaminated water. Several investigators have also concluded that pH generates several hydroxyl radicals during the PCD of dye or pollutants. The MB dye remediation percentage increased along with the increase in the pH of the medium. The maximum dye removal percentage was observed at pH 9 (Figure 11), which was about 90%, and could be attributed to factors such as more hydroxyl ions generation at a higher pH, which may react with holds for the formation of (-OH) radicals, which ultimately, may increase the rate of dye decolorization.

5.2. Dosage Effect of Nano Photocatalyst

The effect of the dose of nano-photocatalyst (NPC) on the PCD of MB dye from the wastewater was observed. Here, investigators have taken NPC at the following experimental conditions; 100 mg/L to 500 mg/L of 10 ppm dye solution, pH 9, irradiation source = solar light, and time: 2 h. The effect of the dose of NPC on MB dye remediation is depicted in Figure 12. From Figure 12, it can be concluded that, firstly, there was an increase in the MB dye degradation percentage from 100 mg/L to 300 mg/L.
Secondly, an increase in the dye concentration failed to increase the MB dye removal percentage. At a higher dosage of NPC, there could be agglomeration and precipitation of the nano-photocatalyst, which might have increased the size of the NPC leading to a reduction in the specific SA and, ultimately, lowered the number of surface-active sites [2,50]. Due to all these factors, whether the percentage removal of MB dye was reduced or not increased with a higher dose of NPC.

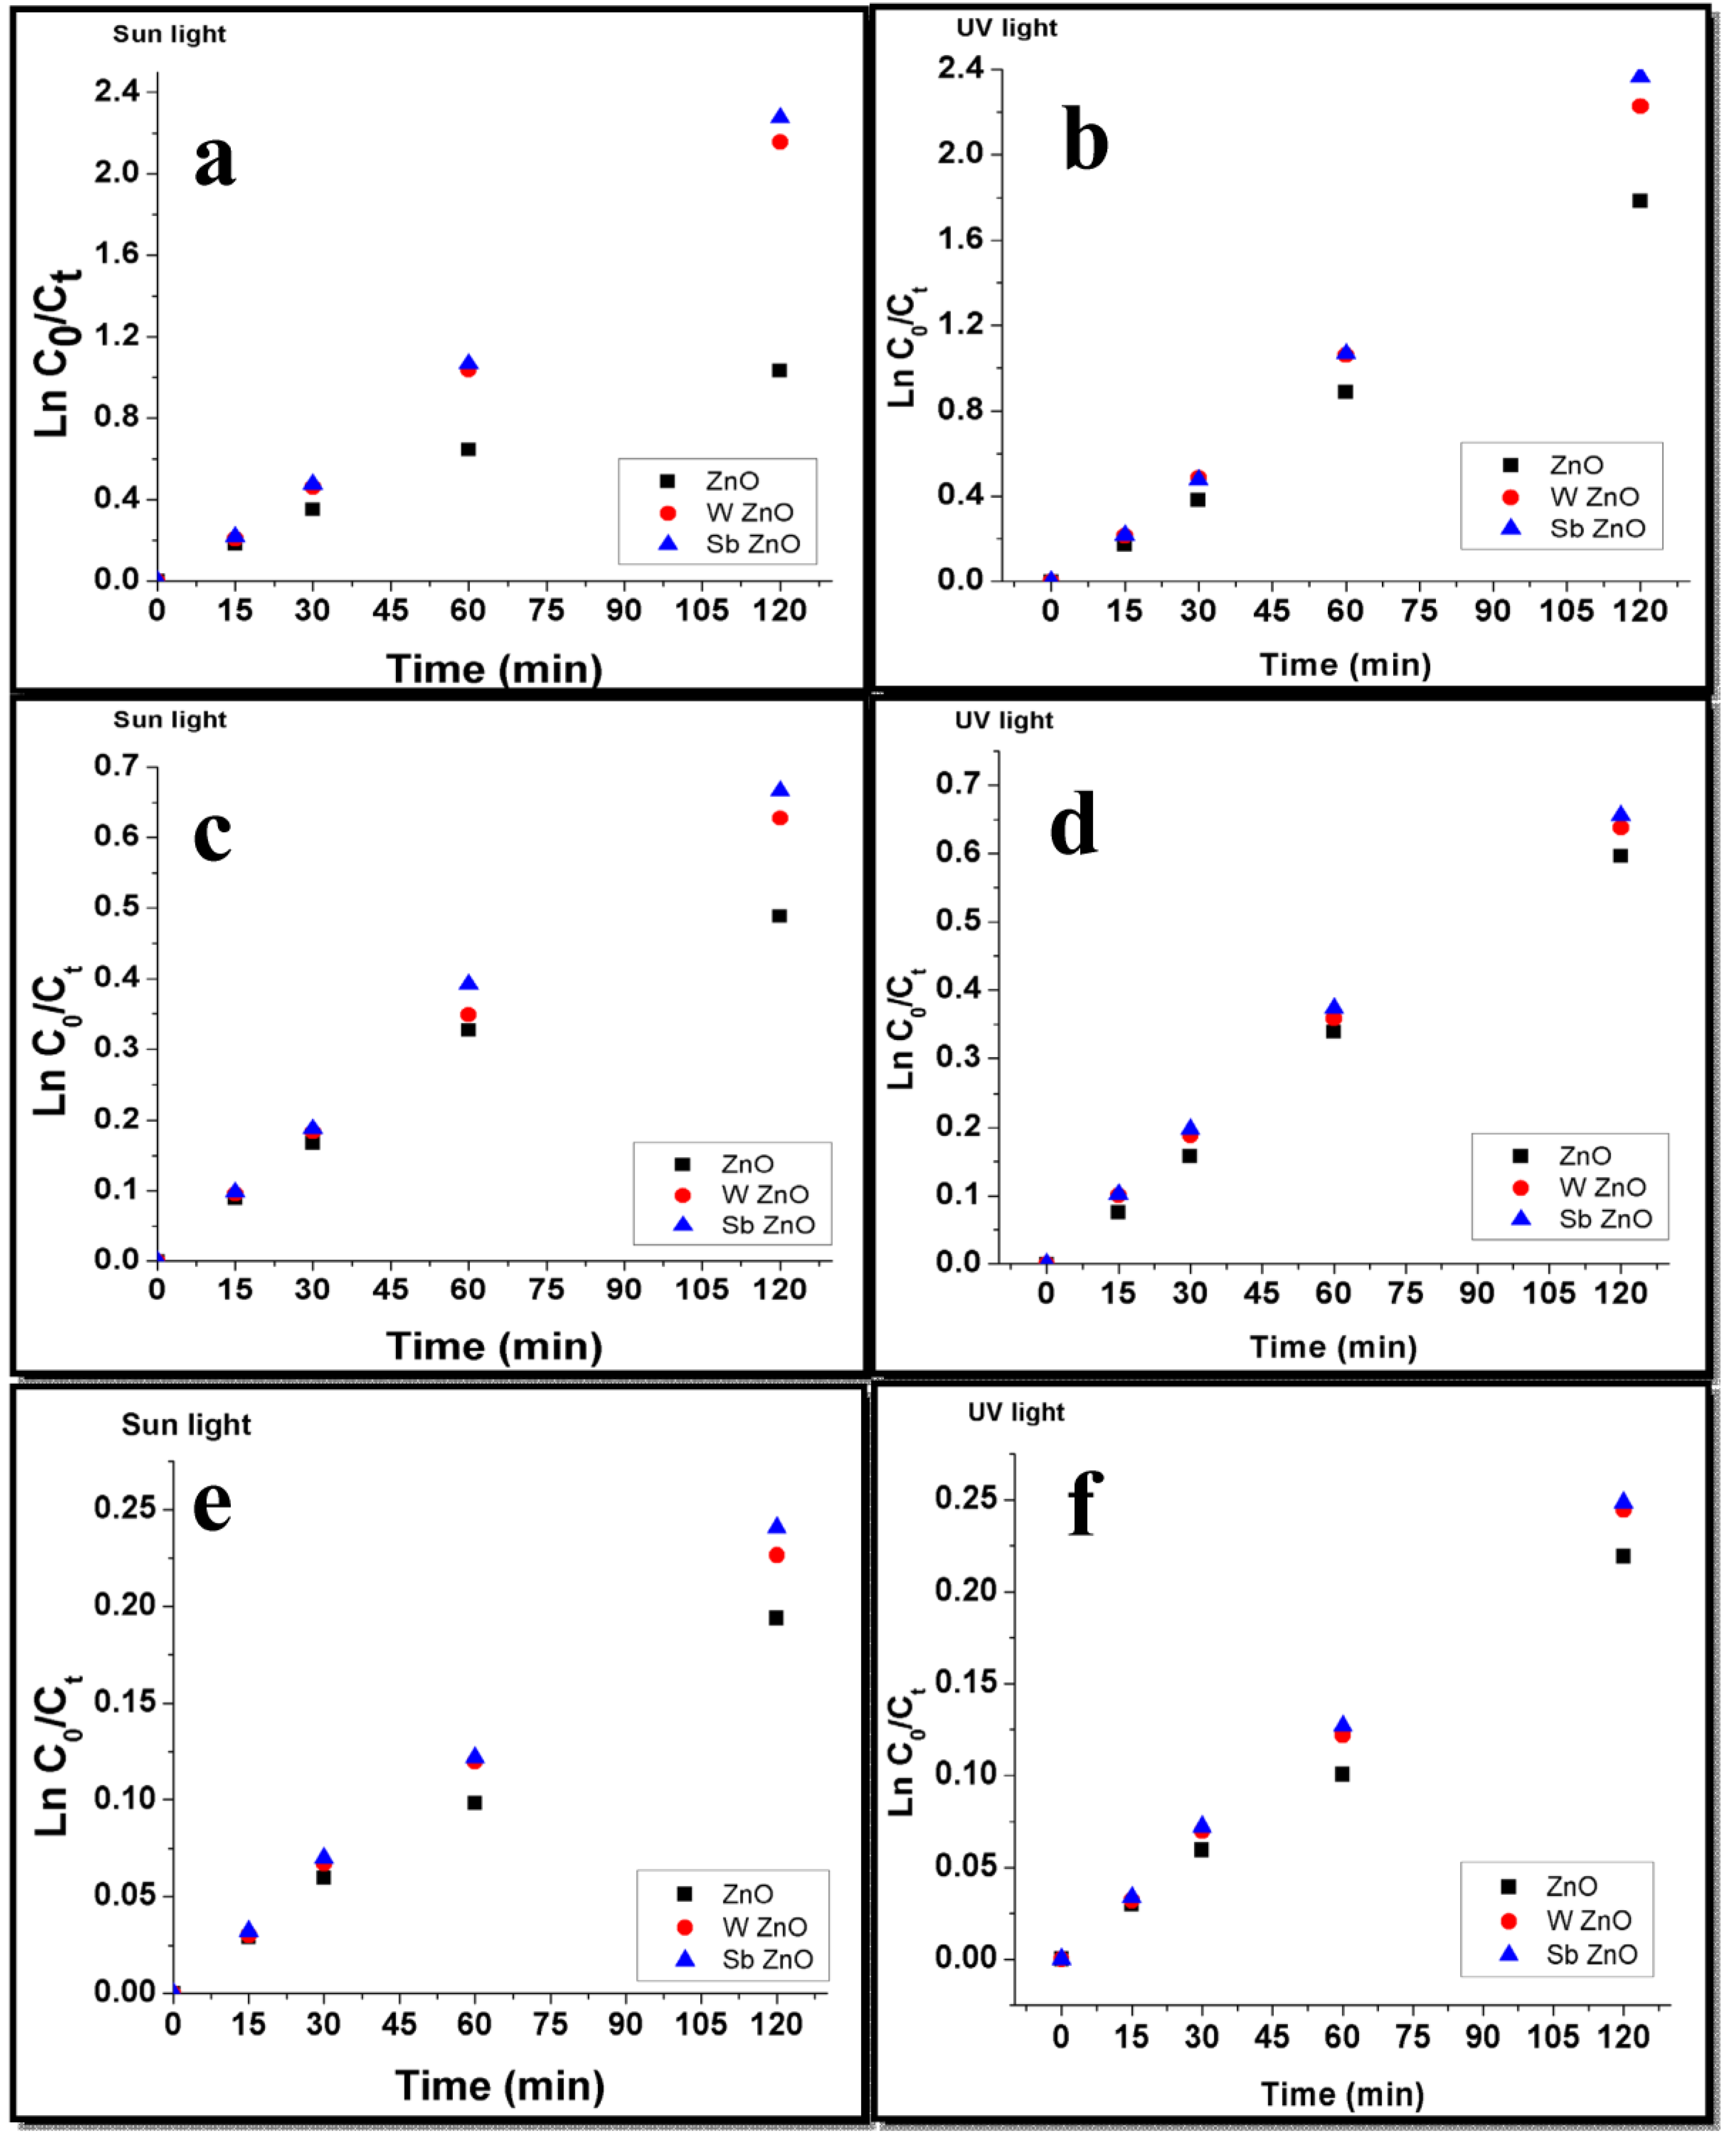
5.3. Dye Degradation Kinetics

The effect of different NPC was observed on the MB dye removal percentage. The effect of various NPC was observed for the PCD of MB dye. Here, the dye removal percentage by the NPC was observed by applying a Pseudo-first-order (PFO) kinetic reaction [50], which is shown in Equation (5):
l n C 0 C t   = k · t  
where
k = reaction rate constant,
C0 = initial dye concentration (IDC), and
Ct = dye concentration at the reaction time t.
By utilizing an NPC load of 300 mg/L and different MB dye concentrations, plots of ln(C0/Ct) against time were plotted and shown in Figure 13a (for 10 ppm), Figure 13b (25 ppm) and Figure 13c (50 ppm). The obtained plots from the above values were found linear with R2 (correlation coefficient) values. For most of the plots, values were mainly 0.95. This assured the applicability of the PFO kinetic model for the PCD of MB dye. Figure 13 is showing the rate constant of dye degradation kinetics (k) and R2 obtained from the slope of the straight line [50].
Figure 13 and Table 3 shows the removal percentage of different concentrations of MB dye (10, 25, and 50 ppm), plotted against the reaction time. Figure 13a is showing PO of 10 ppm MB dye under solar light by ZnO-NPs, ZnO-Wb and ZnO-W. Figure 13b is showing PO of 10 ppm MB dye under UV light by ZnO-NPs, ZnO-Wb and ZnO-W. Figure 13c exhibits the PO of 25 ppm MB dye under solar light by ZnO-NPs, ZnO-Wb and ZnO-W. Figure 13d shows the PO of 25 ppm MB dye under UV light by ZnO-NPs, ZnO-Wb and ZnO-W. Figure 13e shows the PO of 50 ppm MB dye under solar light by ZnO-NPs, ZnO-Wb and ZnO-W, and Figure 13f shows the PO of 50 ppm MB dye under UV light by ZnO-NPs, ZnO-Wb and ZnO-W. From the above result, it was found that ZnO-Sb exhibited an enhanced PCD of MB dye under solar radiation, whereas the pure ZnO and doped ZnO-W doped showed an enhanced PCD under UV light irradiation. A much smaller amount of MB dye was degraded under photocatalysis and dark conditions. The maximum photocatalytic MB dye degradation was obtained with ZnO-Sb (90.06% in 2 h at pH 9). The PCD result of MB dye showed that the PCD rate was faster when the MB concentration was less (10 ppm), while at a higher MB concentration (50 ppm), PCD rate was the least. This could be attributed to the influence of the initial MB dye concentration, i.e., at a higher concentration of MB dye there might be more adsorption of MB dye particles onto the surface of the NPC. Consequently, there will be lesser adsorption sites available on the surface of NPC, creating lesser opportunity for MB dye molecules to adsorb leading to inhibition of the photodegradation activity [51]. The PCD pattern showed that the efficiency of MB dye degradation could be increased by increasing the doses of the NPC. The MB degradation pattern indicates that PCD efficiency can be increased by increasing the NPC amount. To assess the PCD and mineralization of MB dye, COD and TOC analysis were carried out; percent reduction was calculated. Doped ZnO-NPs exhibited an enhanced percent of COD and TOC remediation efficiency, in comparison to ZnO-NPs (Figure 13).
Effects of the IDC were studied by conducting a series of experiments with IDC (10, 25, and 50 ppm) with constant catalyst loading. It was observed that the photodegradation of MB dye by ZnO and doped ZnO nanomaterials followed first-order kinetics with high R2 values. Comparative degradation and the kinetic study are summarized in Table 3. Figure 14 shows the FTIR spectra of MB dye before and after degradation by applying a nano-photocatalyst. The FTIR spectra is exhibiting that all the peaks corresponding to MB dye have disappeared after the photocatalytic degradation. A new band was found in the decolorized sample near 3400 cm−1, which is attributed to the hydroxyl group from the water molecule.

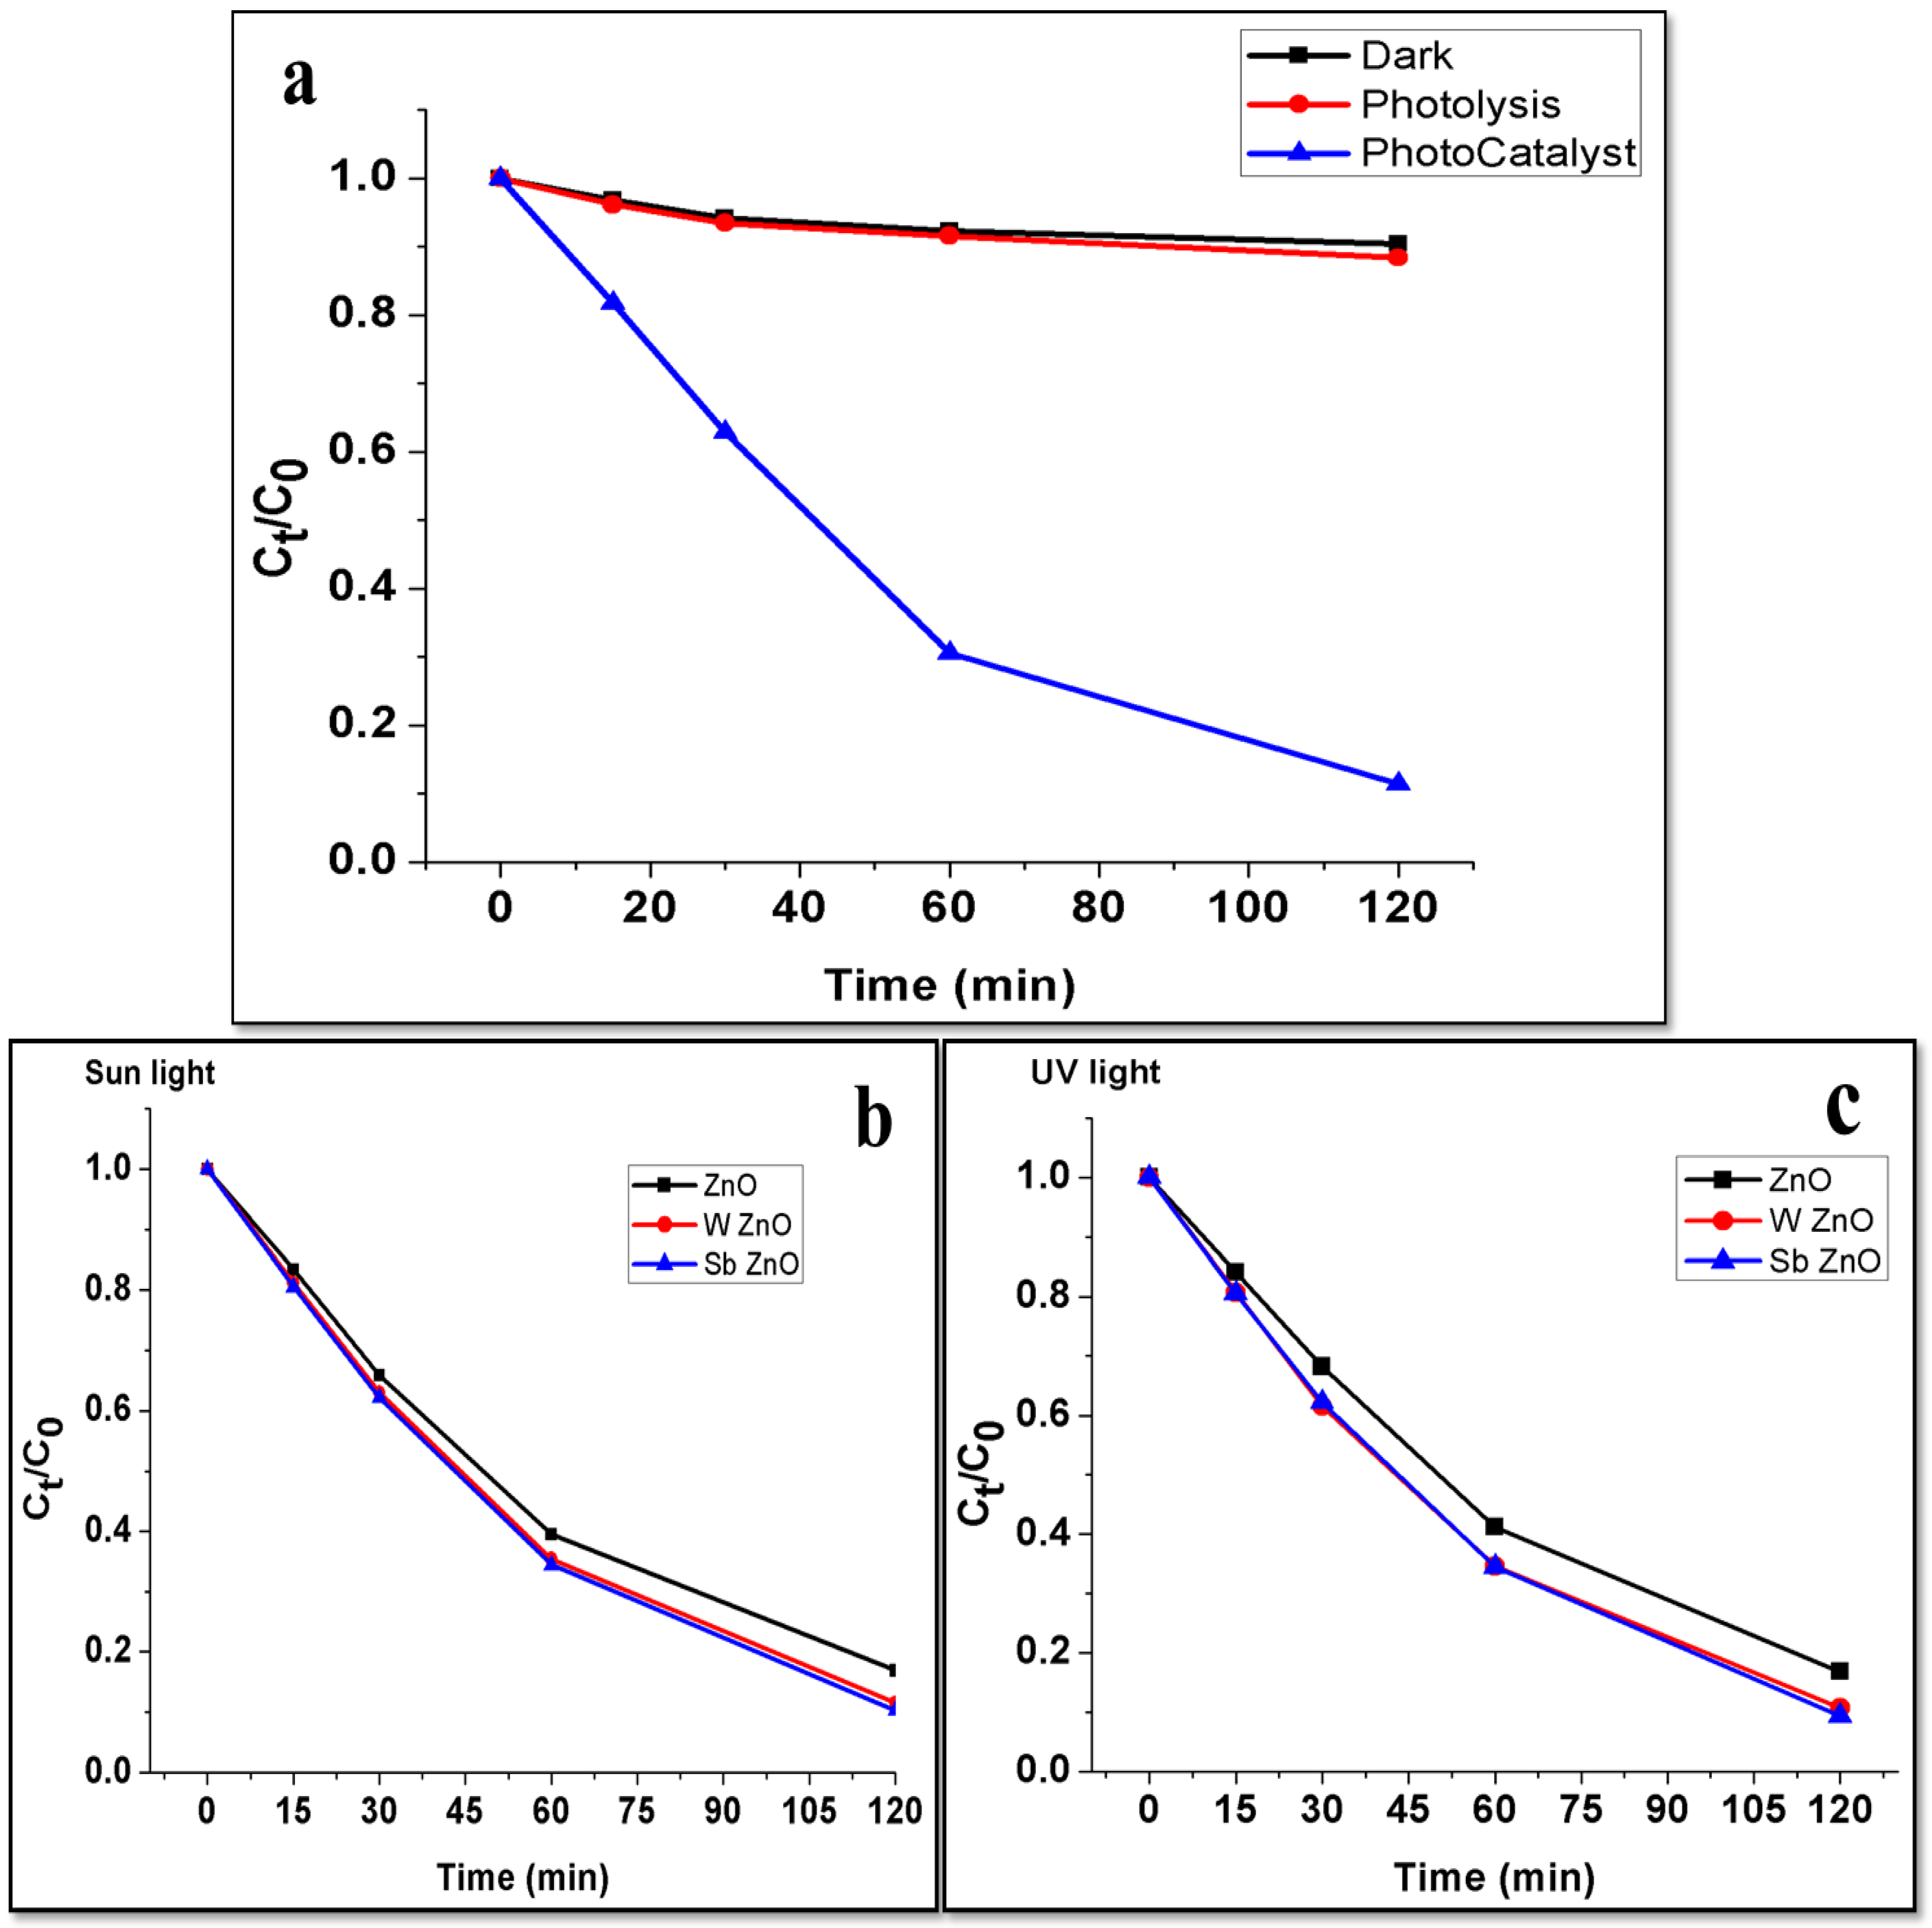
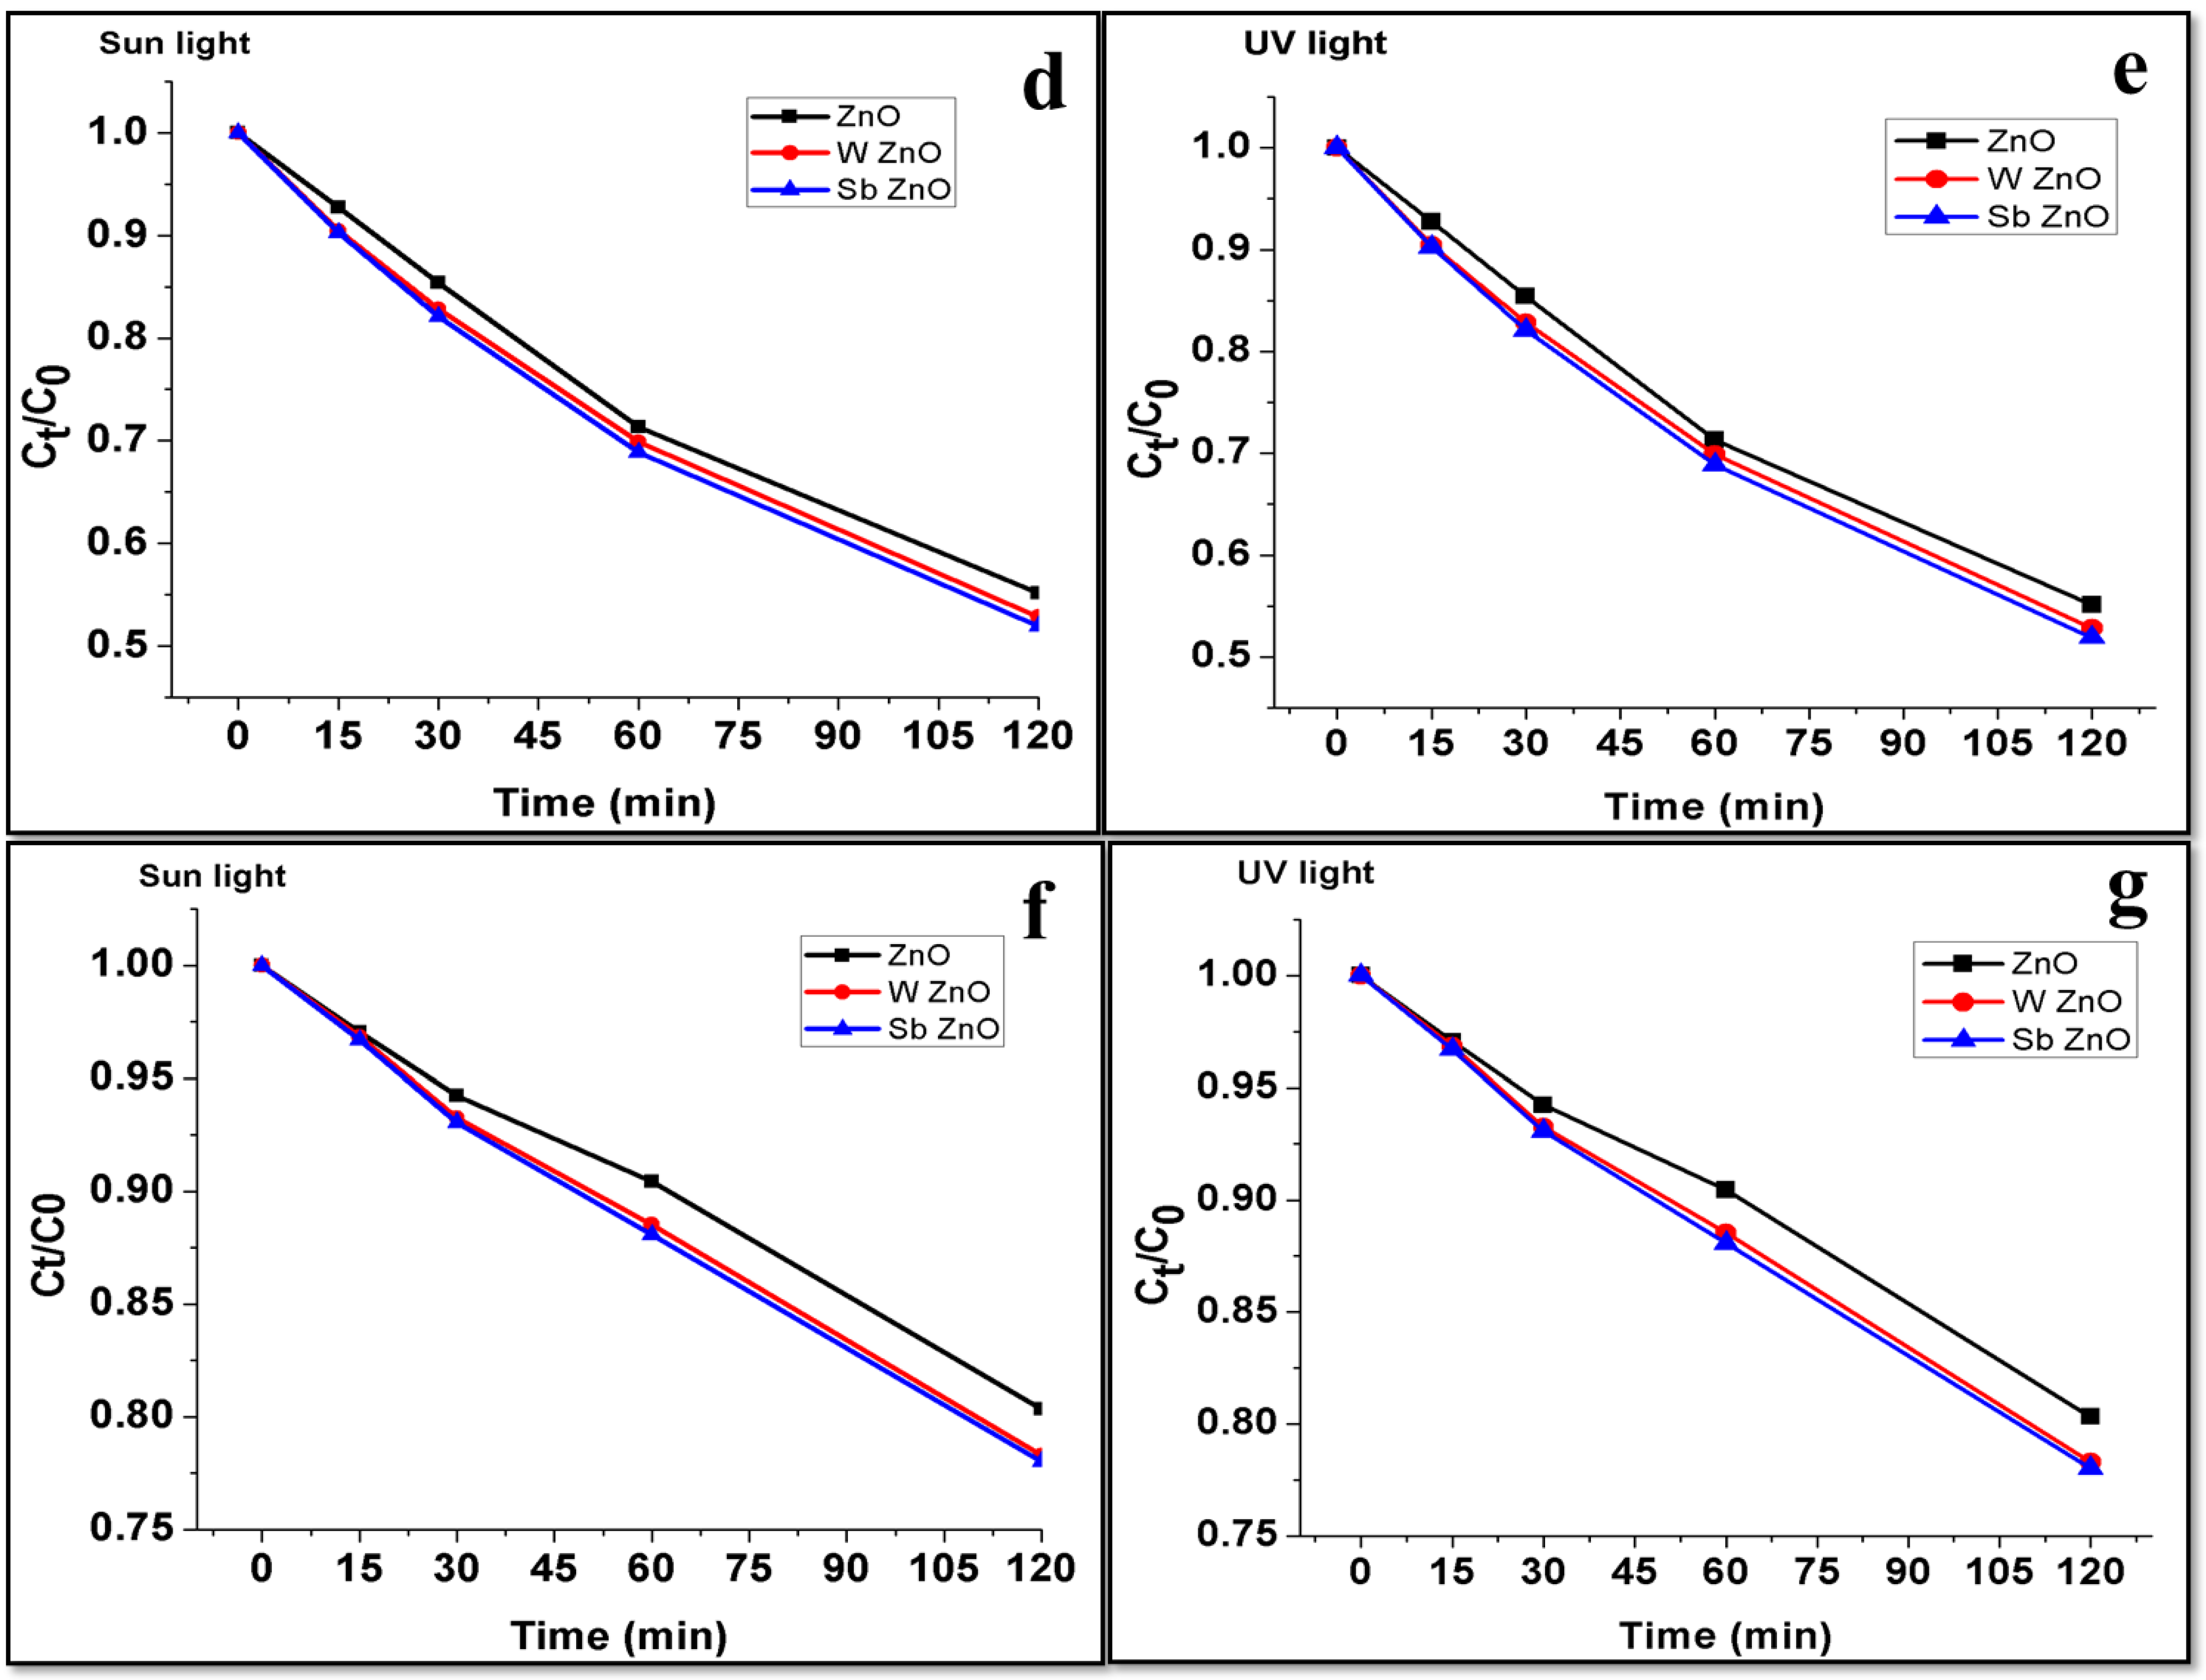
5.4. Photocatalytic Degradation of Methylene Blue Dye

Table 3 presents the comparative kinetic parameters and the corresponding coefficients of determination for the PCD of MB dye by ZnO and doped ZnO. The obtained results show that ZnO-Sb shows a strong efficiency under sunlight irradiation, while pristine ZnO and ZnO-W represent an enhanced photocatalytic efficiency under UV light irradiation.

5.5. Degradation Mechanism of MB Dye

The mechanism involved in the PCD [52] of MB dye with solar light irradiation, by using by ZnO-Sb, is depicted in Figure 15. Figure 16 shows the Earth’s surface where the experimental study was carried out (Central University of Gujarat, Gandhinagar, Gujarat, India). When solar light was irradiated, the ZnO-Sb was shown to absorb the light energy, which resulted in the excitation of an e- from the VB to the CB, and created the CB electrons (eCB−) and VB holes (hVB+) [53]. Schmitt and Heib (2014) presented a simple calculation for calculating the illuminance from the sun [54]. These photoexcited e−s interact with dissolved O2 to produce superoxide radicals (·O2). These photogenerated holes could directly oxidize MB dye to produce simple degradable products. Moreover, such photogenerated holes may also react with the H2O to form hydroxide radicals (·OH). Both types of radicals formed in the previous step could act as good oxidizing agents that can react with dye molecules to produce simple end products [55]. The plausible degradation reactions of ZnO-Sb nano-catalyst with MB dye, in the presence of sunlight, are shown as follows [56,57]:
Z nO + hv ( solar   light ) ZnO   ( e CB ) + h VB +
e CB +   O 2 · O 2
h VB + + OH · OH
· OH   +   Dye Degradation   products
· O 2 +   Dye Degradation   products  
  h VB + +   Dye Degradation   products
Equation (11) is known as the photo-Kolbe reaction, where the dye molecule interacts with the photons and forms CO2 and other degradation products [58].
Figure 17 shows the concentration decay curve of MB dye solution under solar and UV light by all three developed materials. Figure 17a shows the decay curve of MB in dark conditions, sunlight and in the presence of the photocatalyst, along with UV light. The dark and photolysis conditions exhibit an almost similar decay curve, while for photocatalyst, it is too high. Figure 17b shows the decay curve of 10 ppm MB dye under solar light by ZnO-NPs, ZnO-Wb and ZnO-W. Figure 17c shows the decay curve of 10 ppm MB dye under UV light by ZnO-NPs, ZnO-Wb and ZnO-W. Figure 17d shows the decay curve of 25 ppm MB dye under solar light by ZnO-NPs, ZnO-Wb and ZnO-W. Figure 17e shows the decay curve of 25 ppm MB dye under UV light by ZnO-NPs, ZnO-Wb and ZnO-W. Figure 17f shows the decay curve of 50 ppm MB dye under solar light by ZnO-NPs, ZnO-Wb and ZnO-W. Figure 17g shows the decay curve of 50 ppm MB dye under UV light by ZnO-NPs, ZnO-Wb and ZnO-W. Figure 17 shows that, as the time of incubation increases, the concentration of dye decreases. From, this analysis shows that the maximum decrease in the concentration of MB was found for ZnO-Sb, followed by ZnO-W and ZnO.

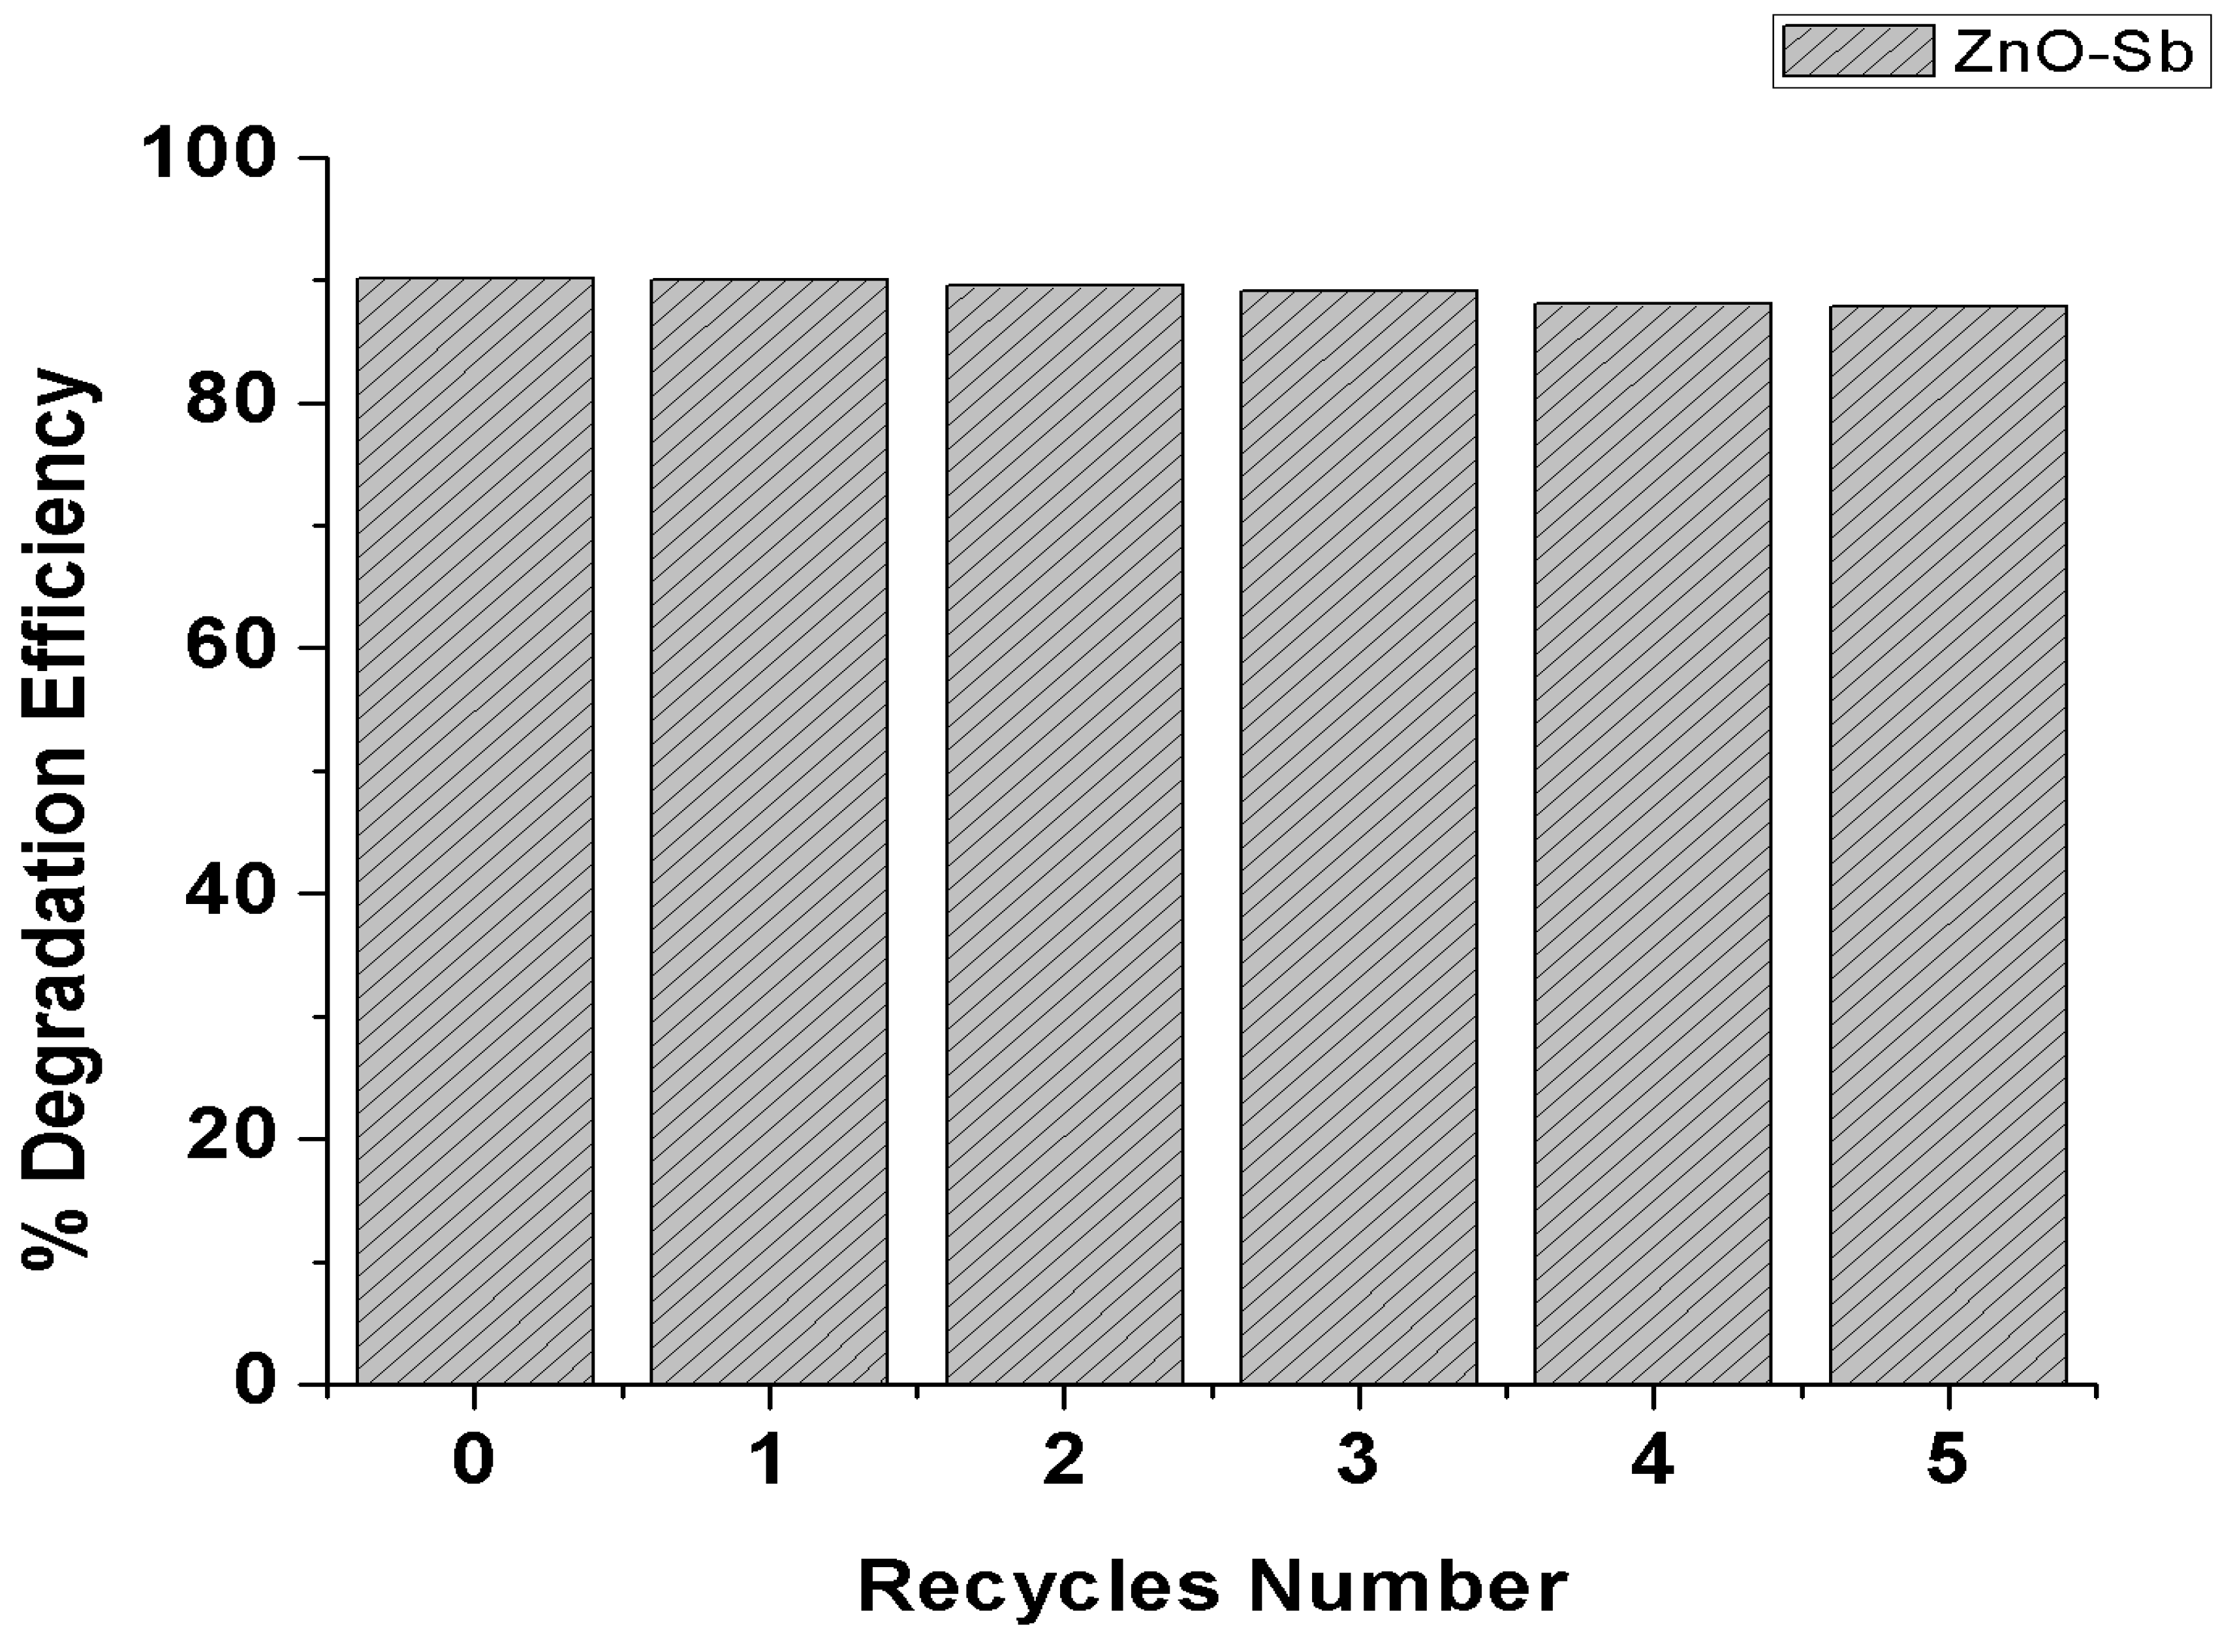
5.6. Reusability Study of NPC

Figure 18 shows the recyclability and reusability results of the ZnO and ZnO-Sb photocatalysts under solar-light irradiation. This study was performed under the following conditions: MB dye concentration 100 mg/L; dosage of nanocatalyst 300 mg/L; reaction time: two hours; solvent used: ddw. The obtained results exhibited a 3% decrease in the PCA after five uses of the nano-catalyst, which suggests that the developed photocatalytic material is stable in the PCD of MB dye.

6. Conclusions

It is possible to synthesize doped ZnO-NPs by 1% via antimony and tungsten by using the sonochemical method, and are subsequently used for the PCD of MB dye under solar and UV light. The obtained XRD, FESEM, and EDS data confirm the successful incorporation of dopant ions into the lattice of ZnO-NPs. The dosage of ZnO-NPs and pH of the wastewater sample highly affects the dye degradation efficiency. Doped ZnO-NPs showed an enhanced MB dye degradation efficiency, compared to pure ZnO-NPs. ZnO-Sb is proven as a highly efficient doped nano-material, due to its lower BG value and higher surface area than ZnO-W and ZnO, respectively, under solar light irradiation. ZnO-W represented an enhanced PCD efficiency of MB under UV-light irradiation. The IDC affects the rate of dye degradation. COD and TOC data also confirm the mineralization of MB dye. All of the doped and undoped ZnO-NPs followed PFO kinetics. The reusability assessment confirms the stability of doped ZnO nanoparticles. Therefore, photocatalysts could be easily recovered and recycled by maintaining their stability, which makes them promising materials for the removal of environmental contaminants. The sunlight-based photocatalytic degradation method could also be a very effective technique for the remediation of organic pollutants from contaminated water.

Author Contributions

Conceptualization, S.M., V.K.Y., A.A. and H.N.H.; data curation, S.M., H.N.H., M.H.F. and V.K.Y.; methodology, V.K.Y., A.A. and S.M.; validation, V.K.Y., A.A., A.Y.A. and H.N.H.; formal analysis, V.K.Y., A.A. and M.H.F.; resources, A.A., M.H.F. and S.M.; writing—original draft preparation, H.N.H., V.K.Y. and A.Y.A.; writing—review and editing, V.K.Y., A.A., A.Y.A., A.G. and M.H.F.; supervision, S.M., V.K.Y., A.A. and M.H.F.; project administration V.K.Y., A.A., A.G. and H.N.H.; funding acquisition, S.M., A.Y.A. and A.A.; investigation, V.K.Y., A.A. and H.N.H.; software’s, V.K.Y., A.A., M.H.F. and S.M.; visualization, V.K.Y., A.A. and M.H.F. All authors have read and agreed to the published version of the manuscript.

Funding

This research was funded by the Deanship of Scientific Research at King Khalid University under the grant number R.G.P. 2/133/44.

Acknowledgments

The authors extend their appreciation to the Deanship of Scientific Research at King Khalid University for funding this work through the Research Groups Program under grant number RGP.2/133/44. The authors thank the Central University of Gujarat for providing the infrastructural facilities for conducting this experiment.

Conflicts of Interest

The authors declare no conflict of interest associated with the publication of this manuscript.

References

  1. González-González, R.B.; Parra-Saldívar, R.; Alsanie, W.F.; Iqbal, H.M.N. Nanohybrid catalysts with porous structures for environmental remediation through photocatalytic degradation of emerging pollutants. Environ. Res. 2022, 214, 113955. [Google Scholar] [CrossRef] [PubMed]
  2. Ramírez, A.E.; Montero-Muñoz, M.; López, L.L.; Ramos-Ibarra, J.E.; Coaquira, J.A.H.; Heinrichs, B.; Paez, C.A. Significantly enhancement of sunlight photocatalytic performance of ZnO by doping with transition metal oxides. Sci. Rep. 2021, 11, 2804. [Google Scholar] [CrossRef] [PubMed]
  3. Fakhari, S.; Jamzad, M.; Kabiri Fard, H. Green synthesis of zinc oxide nanoparticles: A comparison. Green Chem. Lett. Rev. 2019, 12, 19–24. [Google Scholar] [CrossRef] [Green Version]
  4. Ansari, S.A.; Khan, M.M.; Ansari, M.O.; Cho, M.H. Nitrogen-doped titanium dioxide (N-doped TiO2) for visible light photocatalysis. New J. Chem. 2016, 40, 3000–3009. [Google Scholar] [CrossRef]
  5. Shenoy, R.U.K.; Rama, A.; Govindan, I.; Naha, A. The purview of doped nanoparticles: Insights into their biomedical applications. OpenNano 2022, 8, 100070. [Google Scholar] [CrossRef]
  6. Zhou, J.; Zhu, H.; Song, Q.; Ding, Z.; Mao, J.; Ren, Z.; Chen, G. Mobility enhancement in heavily doped semiconductors via electron cloaking. Nat. Commun. 2022, 13, 2482. [Google Scholar] [CrossRef] [PubMed]
  7. Rai, H.; Prashant Kondal, N. A review on defect related emissions in undoped ZnO nanostructures. Mater. Today Proc. 2022, 48, 1320–1324. [Google Scholar] [CrossRef]
  8. Gurylev, V.; Perng, T.P. Defect engineering of ZnO: Review on oxygen and zinc vacancies. J. Eur. Ceram. Soc. 2021, 41, 4977–4996. [Google Scholar] [CrossRef]
  9. Panžić, I.; Capan, I.; Brodar, T.; Bafti, A.; Mandić, V. Structural and electrical characterization of pure and al-doped zno nanorods. Materials 2021, 14, 7454. [Google Scholar] [CrossRef]
  10. Xu, Y.; Hu, J.; Zhang, X.; Yuan, D.; Duan, G.; Li, Y. Robust and multifunctional natural polyphenolic composites for water remediation. Mater. Horiz. 2022, 9, 2496–2517. [Google Scholar] [CrossRef]
  11. Wang, L.; Zhao, J.; Liu, H.; Huang, J. Design, modification and application of semiconductor photocatalysts. J. Taiwan Inst. Chem. Eng. 2018, 93, 590–602. [Google Scholar] [CrossRef]
  12. Yang, P.; Bai, W.; Zou, Y.; Zhang, X.; Yang, Y.; Duan, G.; Wu, J.; Xu, Y.; Li, Y. A melanin-inspired robust aerogel for multifunctional water remediation. Mater. Horiz. 2023, 10, 1020–1029. [Google Scholar] [CrossRef]
  13. Stefaniuk, I.; Cieniek, B.; Rogalska, I.; Virt, I.S.; Kosciak, A. Magnetic properties of ZnO:Co layers obtained by pulsed laser deposition method. Mater. Sci. Pol. 2018, 36, 439–444. [Google Scholar] [CrossRef] [Green Version]
  14. Khan, S.B.; Khan, M.I.; Nisar, J. Microwave-Assisted Green Synthesis of Pure and Mn-Doped ZnO Nanocomposites: In Vitro Antibacterial Assay and Photodegradation of Methylene Blue. Front. Mater. 2022, 8, 710155. [Google Scholar] [CrossRef]
  15. Celik, O.; Baturay, Ş.; Ocak, Y.S. Sb doping influence on structural properties of ZnO thin films. Mater. Res. Express. 2020, 7, 3574–3577. [Google Scholar] [CrossRef]
  16. Sinornate, W.; Mimura, H.; Pecharapa, W. Structural, Morphological, Optical, and Electrical Properties of Sol–Gel Derived Sb-Doped ZnO Thin Films Annealed under Different Atmospheres. Phys. Status Solidi (A) 2021, 218, 2000233. [Google Scholar] [CrossRef]
  17. Khan, S.H.; R, S.; Pathak, B.; Fulekar, M.H. Development of zinc oxide nanoparticle by sonochemical method and study of their physical and optical properties. AIP Conf. Proc. 2016, 1724, 020108. [Google Scholar] [CrossRef]
  18. Jamshaid, M.; Nazir, M.A.; Najam, T.; Shah, S.S.A.; Khan, H.M.; Rehman, A.U. Facile synthesis of Yb3+-Zn2+ substituted M type hexaferrites: Structural, electric and photocatalytic properties under visible light for methylene blue removal. Chem. Phys. Lett. 2022, 805, 139939. [Google Scholar] [CrossRef]
  19. Shahzad, K.; Nazir, M.A.; Jamshaid, M.; Kumar, O.P.; Najam, T.; Shah, S.S.A.; Rehman, A.U. Synthesis of nanoadsorbent entailed mesoporous organosilica for decontamination of methylene blue and methyl orange from water. Int. J. Environ. Anal. Chem. 2021, 1–14. [Google Scholar] [CrossRef]
  20. Nazir, M.A.; Khan, N.A.; Cheng, C.; Shah, S.S.A.; Najam, T.; Arshad, M.; Sharif, A.; Akhtar, S.; Rehman, A.U. Surface induced growth of ZIF-67 at Co-layered double hydroxide: Removal of methylene blue and methyl orange from water. Appl. Clay Sci. 2020, 190, 105564. [Google Scholar] [CrossRef]
  21. Modi, S.; Yadav, V.K.; Gacem, A.; Ali, I.H.; Dave, D.; Khan, S.H.; Yadav, K.K.; Rather, S.-U.; Ahn, Y.; Son, C.T.; et al. Recent and Emerging Trends in Remediation of Methylene Blue Dye from Wastewater by Using Zinc Oxide Nanoparticles. Water 2022, 14, 1749. [Google Scholar] [CrossRef]
  22. Modi, S.; Yadav, V.K.; Amari, A.; Osman, H.; Igwegbe, C.A.; Fulekar, M.H. Nanobioremediation: A bacterial consortium-zinc oxide nanoparticle-based approach for the removal of methylene blue dye from wastewater. Environ. Sci. Pollut. Res. 2023, 30, 72641–72651. [Google Scholar] [CrossRef] [PubMed]
  23. Salih, A.M.; Al-Qurainy, F.; Khan, S.; Tarroum, M.; Nadeem, M.; Shaikhaldein, H.O.; Gaafar, A.-R.Z.; Alfarraj, N.S. Biosynthesis of zinc oxide nanoparticles using Phoenix dactylifera and their effect on biomass and phytochemical compounds in Juniperus procera. Sci. Rep. 2021, 11, 19136. [Google Scholar] [CrossRef] [PubMed]
  24. Naseer, M.; Aslam, U.; Khalid, B.; Chen, B. Green route to synthesize Zinc Oxide Nanoparticles using leaf extracts of Cassia fistula and Melia azadarach and their antibacterial potential. Sci. Rep. 2020, 10, 9055. [Google Scholar] [CrossRef]
  25. Syahir, A.; Sulaiman, S.; Mel, M.; Othman, M.; Zubaidah Sulaiman, S. An Overview: Analysis of ultrasonic-assisted extraction’s parameters and its process. IOP Conf. Ser. Mater. Sci. Eng. 2020, 778. [Google Scholar] [CrossRef]
  26. Niazi, S.; Olsen, E.; Nygård, H.S. Hydrolysis of eutectic compositions in the ZnCl2, KCl:NaCl ternary system and effect of adding ZnO. J. Mol. Liq. 2020, 317, 114069. [Google Scholar] [CrossRef]
  27. Ozdemir, Z.; Hernandez-Nava, E.; Tyas, A.; Warren, J.A.; Fay, S.D.; Goodall, R.; Todd, I.; Askes, H. Energy absorption in lattice structures in dynamics: Experiments. Int. J. Impact Eng. 2016, 89, 49–61. [Google Scholar] [CrossRef] [Green Version]
  28. Bonetto, L.R.; Crespo, J.S.; Guégan, R.; Esteves, V.I.; Giovanela, M. Removal of methylene blue from aqueous solutions using a solid residue of the apple juice industry: Full factorial design, equilibrium, thermodynamics and kinetics aspects. J. Mol. Struct. 2021, 1224, 129296. [Google Scholar] [CrossRef]
  29. Yadav, V.K.; Choudhary, N.; Ali, D.; Kumar, G.; Gnanamoorthy, G.; Khan, A.U.; Kumar, P.; Kumar, S.H.; Tizazu, B.Z. Determination of Adsorption of Methylene Blue Dye by Incense Stick Ash Waste and Its Toxicity on RTG-2 Cells. Adsorpt. Sci. Technol. 2022, 2022, 8565151. [Google Scholar] [CrossRef]
  30. Gnanamoorthy, G.; Karthikeyan, V.; Ali, D.; Kumar, G.; Yadav, V.K.; Narayanan, V. Global popularization of CuNiO2 and their rGO nanocomposite loveabled to the photocatalytic properties of methylene blue. Environ. Res. 2022, 204, 112338. [Google Scholar] [CrossRef]
  31. Choudhary, N.; Yadav, V.K.; Yadav, K.K.; Almohana, A.I.; Almojil, S.F.; Gnanamoorthy, G.; Kim, D.-H.; Islam, S.; Kumar, P.; Jeon, B.-H. Application of green synthesized mmt/ag nanocomposite for removal of methylene blue from aqueous solution. Water 2021, 13, 3206. [Google Scholar] [CrossRef]
  32. Amari, A.; Yadav, V.K.; Pathan, S.K.; Singh, B.; Osman, H.; Choudhary, N.; Khedher, K.M.; Basnet, A. Remediation of Methyl Red Dye from Aqueous Solutions by Using Biosorbents Developed from Floral Waste. Adsorpt. Sci. Technol. 2023, 2023, 1532660. [Google Scholar] [CrossRef]
  33. Haque, M.J.; Bellah, M.M.; Hassan, M.R.; Rahman, S. Synthesis of ZnO nanoparticles by two different methods & comparison of their structural, antibacterial, photocatalytic and optical properties. Nano Express. 2020, 1, 010007. [Google Scholar] [CrossRef]
  34. Modi, S.; Fulekar, M.H. Synthesis and characterization of zinc oxide nanoparticles and zinc oxide/cellulose nanocrystals nanocomposite for photocatalytic degradation of Methylene blue dye under solar light irradiation. Nanotechnol. Environ. Eng. 2020, 5, 18. [Google Scholar] [CrossRef]
  35. Modi Shreya Fulekar, M.H. Green synthesis of zinc oxide nanoparticles using garlic skin extract and its characterization. J. Nanostructures 2020, 10, 20–27. [Google Scholar] [CrossRef]
  36. Modi, S.; Yadav, V.K.; Choudhary, N.; Alswieleh, A.M.; Sharma, A.K.; Bhardwaj, A.K.; Khan, S.H.; Yadav, K.K.; Cheon, J.K.; Jeon, B.H. Onion Peel Waste Mediated-Green Synthesis of Zinc Oxide Nanoparticles and Their Phytotoxicity on Mung Bean and Wheat Plant Growth. Materials 2022, 15, 2393. [Google Scholar] [CrossRef]
  37. Jayachandran, A.; T R, A.; Nair, A.S. Green synthesis and characterization of zinc oxide nanoparticles using Cayratia pedata leaf extract. Biochem. Biophys. Rep. 2021, 26, 100995. [Google Scholar] [CrossRef] [PubMed]
  38. Ghamsari, M.S.; Alamdari, S.; Han, W.; Park, H.H. Impact of nanostructured thin ZnO film in ultraviolet protection. Int. J. Nanomed. 2017, 12, 207–216. [Google Scholar] [CrossRef] [Green Version]
  39. Sadak, M.S.; Bakry, B.A. Zinc-oxide and nano ZnO oxide effects on growth, some biochemical aspects, yield quantity, and quality of flax (Linum uitatissimum L.) in absence and presence of compost under sandy soil. Bull. Natl. Res. Cent. 2020, 44, 98. [Google Scholar] [CrossRef]
  40. Aldalbahi, A.; Alterary, S.; Almoghim, R.A.A.; Awad, M.A.; Aldosari, N.S.; Alghannam, S.F.; Alabdan, A.N.; Alharbi, S.; Alateeq, B.A.M.; Al Mohsen, A.A.; et al. Greener Synthesis of Zinc Oxide Nanoparticles: Characterization and Multifaceted Applications. Molecules 2020, 25, 4198. [Google Scholar] [CrossRef]
  41. Carofiglio, M.; Barui, S.; Cauda, V.; Laurenti, M. Doped zinc oxide nanoparticles: Synthesis, characterization and potential use in nanomedicine. Appl. Sci. 2020, 10, 5194. [Google Scholar] [CrossRef]
  42. Soltani, S.; Gacem, A.; Choudhary, N.; Yadav, V.K.; Alsaeedi, H.; Modi, S.; Patel, A.; Khan, S.H.; Cabral-Pinto, M.M.S.; Yadav, K.K.; et al. Scallion Peel Mediated Synthesis of Zinc Oxide Nanoparticles and Their Applications as Nano fertilizer and Photocatalyst for Removal of Organic Pollutants from Wastewater. Water 2023, 15, 1672. [Google Scholar] [CrossRef]
  43. Shamhari, N.M.; Wee, B.S.; Chin, S.F.; Kok, K.Y. Synthesis and characterization of zinc oxide nanoparticles with small particle size distribution. Acta Chim. Slov. 2018, 65, 578–585. [Google Scholar] [CrossRef]
  44. Alamdari, S.; Ghamsari, M.S.; Lee, C.; Han, W.; Park, H.-H.; Tafreshi, M.J.; Afarideh, H.; Ara, M.H.M. Preparation and characterization of zinc oxide nanoparticles using leaf extract of sambucus ebulus. Appl. Sci. 2020, 10, 3620. [Google Scholar] [CrossRef]
  45. Rajendran, N.K.; George, B.P.; Houreld, N.N.; Abrahamse, H. Synthesis of zinc oxide nanoparticles using rubus fairholmianus root extract and their activity against pathogenic bacteria. Molecules 2021, 26, 3029. [Google Scholar] [CrossRef]
  46. El-Belely, E.F.; Farag, M.M.S.; Said, H.A.; Amin, A.S.; Azab, E.; Gobouri, A.A.; Fouda, A. Green Synthesis of Zinc Oxide Nanoparticles (ZnO-NPs) Using Arthrospira platensis (Class: Cyanophyceae) and Evaluation of their Biomedical Activities. Nanomaterials 2021, 11, 95. [Google Scholar] [CrossRef] [PubMed]
  47. Thangapandiyan, S.; Monika, S. Green Synthesized Zinc Oxide Nanoparticles as Feed Additives to Improve Growth, Biochemical, and Hematological Parameters in Freshwater Fish Labeo rohita. Biol. Trace Elem. Res. 2020, 195, 636–647. [Google Scholar] [CrossRef] [PubMed]
  48. Ebrahimi, R.; Hossienzadeh, K.; Maleki, A.; Ghanbari, R.; Rezaee, R.; Safari, M.; Shahmoradi, B.; Daraei, H.; Jafari, A.; Yetilmezsoy, K. Effects of doping zinc oxide nanoparticles with transition metals (Ag, Cu, Mn) on photocatalytic degradation of Direct Blue 15 dye under UV and visible light irradiation. J. Environ. Health Sci. Eng. 2019, 17, 479–492. [Google Scholar] [CrossRef] [PubMed]
  49. Adrees, M.; Khan, Z.S.; Hafeez, M.; Rizwan, M.; Hussain, K.; Asrar, M.; Alyemeni, M.N.; Wijaya, L.; Ali, S. Foliar exposure of zinc oxide nanoparticles improved the growth of wheat (Triticum aestivum L.) and decreased cadmium concentration in grains under simultaneous Cd and water deficient stress. Ecotoxicol. Environ. Saf. 2021, 208, 111627. [Google Scholar] [CrossRef]
  50. Degefa, A.; Bekele, B.; Jule, L.T.; Fikadu, B.; Ramaswamy, S.; Dwarampudi, L.P.; Nagaprasad, N.; Ramaswamy, K. Green Synthesis, Characterization of Zinc Oxide Nanoparticles, and Examination of Properties for Dye-Sensitive Solar Cells Using Various Vegetable Extracts. J. Nanomater. 2021, 2021, 3941923. [Google Scholar] [CrossRef]
  51. Mallikarjunaswamy, C.; Parameswara, P.; Pramila, S.; Nagaraju, G.; Deepakumari, H.N.; Lakshmi Ranganatha, V. Green and facile synthesis of zinc oxide nanoparticles for enhanced photocatalytic organic pollutant degradation. J. Mater. Sci. Mater. Electron. 2022, 33, 20361–20372. [Google Scholar] [CrossRef]
  52. Kabir, R.; Saifullah, M.A.K.; Ahmed, A.Z.; Masum, S.M.; Molla, M.A.I. Synthesis of n-doped zno nanocomposites for sunlight photocatalytic degradation of textile dye pollutants. J. Compos. Sci. 2020, 4, 49. [Google Scholar] [CrossRef]
  53. Khalafi, T.; Buazar, F.; Ghanemi, K. Phycosynthesis and Enhanced Photocatalytic Activity of Zinc Oxide Nanoparticles Toward Organosulfur Pollutants. Sci. Rep. 2019, 9, 43368. [Google Scholar] [CrossRef] [PubMed] [Green Version]
  54. Schmitt, M.; Heib, F. About the possibility of calibrating optical detectors by solar radiation. RSC Adv. 2014, 4, 17639–17647. [Google Scholar] [CrossRef]
  55. Nguyen, N.T.; Nguyen, V.A. Synthesis, Characterization, and Photocatalytic Activity of ZnO Nanomaterials Prepared by a Green, Nonchemical Route. J. Nanomater. 2020, 2020, 1768371. [Google Scholar] [CrossRef]
  56. Chijioke-Okere, M.O.; Okorocha, N.J.; Anukam, B.N.; Oguzie, E.E. Photocatalytic Degradation of a Basic Dye Using Zinc Oxide Nanocatalyst. Int. Lett. Chem. Phys. Astron. 2019, 81, 18–26. [Google Scholar] [CrossRef]
  57. Balcha, A.; Yadav, O.P.; Dey, T. Photocatalytic degradation of methylene blue dye by zinc oxide nanoparticles obtained from precipitation and sol-gel methods. Environ. Sci. Pollut. Res. 2016, 23, 25485–25493. [Google Scholar] [CrossRef]
  58. Yang, D.; Ni, X.; Chen, W.; Weng, Z. The observation of photo-Kolbe reaction as a novel pathway to initiate photocatalytic polymerization over oxide semiconductor nanoparticles. J. Photochem. Photobiol. A Chem. 2008, 195, 323–329. [Google Scholar] [CrossRef]
Figure 1. Schematic approach for the synthesis of doped-ZnO-NPs.
Water 15 02275 g001
Figure 3. UV-Vis spectra for ZnO-NPs and doped ZnO-NPs.
Water 15 02275 g003
Figure 4. FTIR spectra of ZnO-NPs and antimony and tungsten-doped ZnO-NPs.
Water 15 02275 g004
Figure 5. XRD pattern of Tungsten-doped ZnO-NPs and (a) Antimony-doped ZnO-NPs (b) and as-synthesized ZnO-NPs (c).
Water 15 02275 g005
Figure 6. TEM micrographs of ZnO-NPs (a,b) histogram of ZnO-NPs (c), TEM micrographs of ZnO-W (d,e) histogram of ZnO-W (f) and TEM micrographs of ZnO-Sb (g,h) histogram of ZnO-Sb (i).
Water 15 02275 g006
Figure 7. FESEM micrograph of (a) ZnO-NPs (b) EDS spectrum of ZnO-NPs (c) FESEM micrographs of ZnO-W (d) EDS spectrum of ZnO-W and (e) FESEM micrograph of ZnO-Sb and (f) EDS spectrum of ZnO Sb.
Water 15 02275 g007
Figure 8. UV-DRS band-gap analysis plot of ZnO-NPs (a), Tungsten-doped ZnO-NPs (b), and antimony-doped ZnO-NPs (c).
Water 15 02275 g008
Figure 9. (a) N2 Adsorption–desorption isotherm (b) pore-size distribution for (A) ZnO-NPs (B) ZnO-W and (C) ZnO-Sb.
Water 15 02275 g009
Figure 10. Two-dimensional AFM images of ZnO-NPs (a), Zno-W (c) and ZnO-Sb (e), three-dimensional AFM images of ZnO-NPs (b), Zno-W (d) and ZnO-Sb (f).
Water 15 02275 g010
Figure 11. Effect of pH on the photocatalytic degradation of MB dye.
Water 15 02275 g011
Figure 12. Effect of dosage of nano-photocatalyst on the photocatalytic degradation of MB dye.
Water 15 02275 g012
Figure 13. Photo-oxidation of MB dye by the synthesized nano-photocatalyst first-order reaction kinetics at varying concentrations: (a) PO of 10 ppm MB dye under solar light by ZnO-NPs, ZnO-Wb and ZnO-W, (b) PO of 10 ppm MB dye under UV- light by ZnO-NPs, ZnO-Wb and ZnO-W, (c) PO of 25 ppm MB dye under solar light by ZnO-NPs, ZnO-Wb and ZnO-W, (d) PO of 25 ppm MB dye under UV light by ZnO-NPs, ZnO-Wb and ZnO-W (e) PO of 50 ppm MB dye under solar light by ZnO-NPs, ZnO-Wb and ZnO-W, and (f) PO of 50 ppm MB dye under UV-light by ZnO-NPs, ZnO-Wb and ZnO-W.
Water 15 02275 g013
Figure 14. FTIR spectra of the initial MB dye (before degradation) and final sample (after degradation).
Water 15 02275 g014
Figure 15. Schematic diagram for the Mechanism involved in the photocatalytic degradation of MB dye under sunlight and UV light.
Water 15 02275 g015
Figure 16. Earth surface showing the location of the experimental area.
Water 15 02275 g016
Figure 17. Concentration decay curve of MB dye solution: (a) Decay curve of MB in dark conditions, photolysis and in the presence of photocatalyst, (b) Decay curve of 10 ppm MB dye under solar light by ZnO-NPs, ZnO-Wb and ZnO-W, (c) decay curve of 10 ppm MB dye under UV light by ZnO-NPs, ZnO-Wb and ZnO-W, (d) decay curve of 25 ppm MB dye under solar light by ZnO-NPs, ZnO-Wb and ZnO-W, (e) decay curve of 25 ppm MB dye under UV light by ZnO-NPs, ZnO-Wb and ZnO-W, (f) decay curve of 50 ppm MB dye under solar light by ZnO-NPs, ZnO-Wb and ZnO-W, and (g) decay curve of 50 ppm MB dye under UV light by ZnO-NPs, ZnO-Wb and ZnO-W.
Water 15 02275 g017aWater 15 02275 g017b
Figure 18. Reusability study of nano-photocatalysts under solar-light irradiation.
Water 15 02275 g018
Table 1. Major XRD peaks along with FWHM, D-value, size, and lattice strain of ZnO-NPs, ZnO-Sb, and ZnO-W.
2 Theta DegreehklFWHMD-ValueSize (nm)Lattice Strain
ZnO NPs
31.51000.5012.8317.220.0077
34.180020.3132.6127.750.0044
36.031010.4962.4817.60.0066
47.341020.4561.9119.880.0045
56.411100.4981.6218.910.004
62.681030.51.4818.840.0041
66.211120.471.3821.280.0031
ZnO-W
31.81000.4672.811418.480.0072
34.440020.2722.601831.950.0038
36.281010.4862.473817.970.0065
47.331020.6141.198914.760.0061
56.61100.5671.624817.490.0042
62.851030.5891.624816.50.0042
ZnO-Sb
31.741000.8172.816310.550.0125
34.431020.5562.602615.630.0078
36.231010.7722.477011.300.0103
47.551020.8111.910511.180.008
56.591100.8131.824811.590.0066
62.881030.7131.478613.640.0051
67.991120.5131.378712.110.0072
Table 2. BET surface area (SA) and BJH pore diameter (PD) of ZnO-NPs, Antimony-doped ZnO-NPs, and Tungsten doped ZnO-NPs.
NanomaterialSA (m2 g−1)BJH
PD (Å)Pore Volume
ZnO-NPs13.01415.200.023
ZnO-W18.99980.670.039
ZnO-Sb22.8381.630.049
Table 3. Summarized Kinetic Parameters for ZnO-NPs and Tungsten-doped ZnO-NPs and Antimony-doped ZnO-NPs.
NanomaterialConcentration of Dye
(ppm)
R2Final % Degradation% COD Reduction% TOC Reduction
Sun LightUV LightSun LightUV LightSunlight
ZnO100.9800.98864.3982.0152.2 ± 0.0274.12 ± 0.023
250.9680.94638. 6344.0230.59 ± 0.4850.87 ± 0.22
500.9920.94118.218.9214.99 ± 0.2931.1 ± 0.04
ZnO-Sb100.9870.96291.2290.0688.5 ± 0.1295. 34 ± 0.22
250.9930.99448.6146.4948.92 ± 0.2169.22 ± 0.08
500.9920.99522.1220.727.03 ± 0.3348.32 ± 0.4
ZnO-W100.9930.98886.0488.2185.12 ± 0.2292.04 ± 0.09
250.9940.99345.648.144.99 ± 0.0866.98 ± 0.06
500.9980.92120.1227.9825.02 ± 0.3046.5 ± 0.33
Disclaimer/Publisher’s Note: The statements, opinions and data contained in all publications are solely those of the individual author(s) and contributor(s) and not of MDPI and/or the editor(s). MDPI and/or the editor(s) disclaim responsibility for any injury to people or property resulting from any ideas, methods, instructions or products referred to in the content.

