Article

Performance Assessment of Household Water Treatment and Safe Storage in Kathmandu Valley, Nepal

1
Department of Urban Engineering, Graduate School of Engineering, The University of Tokyo, 7-3-1 Hongo, Bunkyo-ku 113-8654, Tokyo, Japan
2
Department of Socio-Cultural Environmental Studies, Graduate School of Frontier Sciences, The University of Tokyo, 5-1-5 Kashiwanoha, Kashiwa 277-8563, Chiba, Japan
*
Author to whom correspondence should be addressed.
Water 2023, 15(12), 2305; https://doi.org/10.3390/w15122305
Submission received: 27 May 2023 / Revised: 14 June 2023 / Accepted: 19 June 2023 / Published: 20 June 2023
(This article belongs to the Special Issue Sustainable Water Supply, Sanitation and Wastewater Systems)

Abstract

:
Although many households in the Kathmandu Valley rely on household water treatment and safe storage (HWTS) to obtain drinking water, the safety of treated water has not been evaluated in actual usage. Therefore, we assessed the performance and maintenance of five HWTS methods used in 101 households. The choice of HWTS methods by households was primarily influenced by the raw water source, that is, jarred water users opted for boiling and groundwater users selected reverse osmosis with ultraviolet irradiation (RO-UV). While boiling and electric dispensers (ED) did not remove inorganic contaminants (ammonia nitrogen, arsenic, and manganese), ceramic candle filters (CCF) and RO-UV reduced them moderately. The HWTS methods reduced E. coli and total coliforms (TC) by 95.8 and 84.1%, respectively, but 11.8 and 69.3% of treated water samples remained positive for these two bacteria. Combined methods (CM) and RO-UV showed an inferior TC reduction compared to the simpler HWTS methods, boiling, CCF, and ED, possibly due to difficulties with regular maintenance and storage contamination. Therefore, it is recommended to choose simpler HWTS methods that meet the requirements of the household’s water sources rather than more expensive and difficult-to-maintain methods, which should be chosen only if the raw water contains high concentrations of inorganic contaminants.

1. Introduction

The fundamental human right to access safe drinking water and sanitation, declared by the United Nations in 2010, remains unattainable for over a third of the global population [1,2]. The rapid population expansion and urbanization in developing countries have caused water scarcity and hindered the provision of adequate piped water and sanitation services, leading to poor health, low quality of life, and social unrest [3]. Poor management and noncompliance with drinking water standards exacerbate the risk of waterborne diseases, while unsafe drinking water, insufficient sanitation, and poor hygiene are significant contributors to diarrheal disease-related deaths. In 2016, there were an estimated 1.4 million deaths from diarrheal disease, of which 60% were attributed to inadequate water, sanitation, and hygiene, and 45% of those were specifically associated with unsafe and inadequate drinking water [4,5].
The World Health Organization (WHO) asserts that safe drinking water, adequate sanitation, and hygiene can significantly prevent diarrheal diseases [6]. However, fecal contamination often compromises the safety of drinking water even from improved sources, such as protected wells and communal stand posts, in areas with poor sanitation [7]. Furthermore, microbiologically safe water at the source or at other points of distribution is subject to frequent and extensive fecal contamination during collection, transport, and home storage [8]. Similarly, when centralized water treatment systems are unavailable or nonfunctional, households must treat and purify water from contaminated sources [9]. Recognizing these challenges, WHO and other organizations have advocated for alternative methods to accelerate the improvement of contaminated water sources, particularly for rural populations at a higher risk of waterborne diseases. One alternative method is household water treatment and safe storage (HWTS) [10]. Accordingly, various household water treatment devices/systems have been developed in recent decades to treat water at the household level. Many of these devices are currently being used in developing countries as cost-effective means to produce safe drinking water by purifying microbially contaminated water [11]. Recently, the utilization of HWTS has been growing globally [12,13]. In 67 low- and middle-income countries, more than 1.1 billion people treat their water before drinking; additional data from China places the figure at over 1.8 billion [14]. In addition, growing concerns about water quality and safety have driven demands for improved HWTS methods, resulting in an increased use of point-of-use (POU) and point-of-entry (POE) filters [15]. However, operational conditions and storage and handling practices can reduce the effectiveness of HWTS [16]. The effectiveness of boiling can be compromised by contaminated containers and poor domestic hygiene at the point of consumption [17]. Similarly, water quality can deteriorate due to a lack of proper maintenance and replacement of filters and other parts, which will accumulate chemical and microbial impurities [18].
The use of HWTS has also increased in the Kathmandu Valley, Nepal, rising to 75% of households in 2018 from 67% in 2013 [19,20]. This is due to the intermittent and low-quality piped water that has caused long-lasting water scarcity in the valley for decades [21,22,23,24]. Even though about 70% of the households are connected to the piped water supply, they obtain water only for a few hours a day from the intermittent system, in which negative pressure and chronic contamination occur [25]. Therefore, households use other water sources for drinking purposes, such as jarred water, groundwater, and tanker water [26,27]. However, it was reported that these water sources are also contaminated with total coliforms (TC), exceeding Nepal’s National Drinking Water Quality Standards (NDWQS) [28,29,30,31]. The Nepal Burden of Disease Report in 2017 identified unsafe drinking water as one of the high-risk factors for mortality across all ages and genders [32].
Therefore, valley residents use various HWTS methods to obtain safe drinking water [19,26]. Recently, sophisticated and high-cost HWTS methods have emerged, and residents often use more than one method [19]. However, despite the widespread use of these methods, there is still limited information available on the appropriate procedures to ensure the chemical and microbial safety of drinking water [33], as evidenced by the fact that 69% of HWTS-treated samples collected from households in the valley were contaminated with TC [29]. Although HWTS can improve drinking water quality and prevent disease when used correctly and consistently [34], a systematic study of their usage, maintenance, and efficiency has yet to be conducted in the valley. Although there have been some studies on types of HWTS and the associated costs [19,26], previous studies on the performance of HWTS in the valley only examined treated water samples and did not assess the efficiency of water quality improvements through HWTS methods in actual usage [29,35]. Furthermore, the literature does not provide information on the HWTS methods used in households. Therefore, the aim of this study is to evaluate the treatment performance of different HWTS methods in actual usage and the effects of maintenance conditions on their treatment performance. The study also examines the factors influencing the microbial quality of treated water by HWTS methods through a questionnaire survey of users and explores the reasons behind the selection of specific methods by households.

2. Materials and Methods
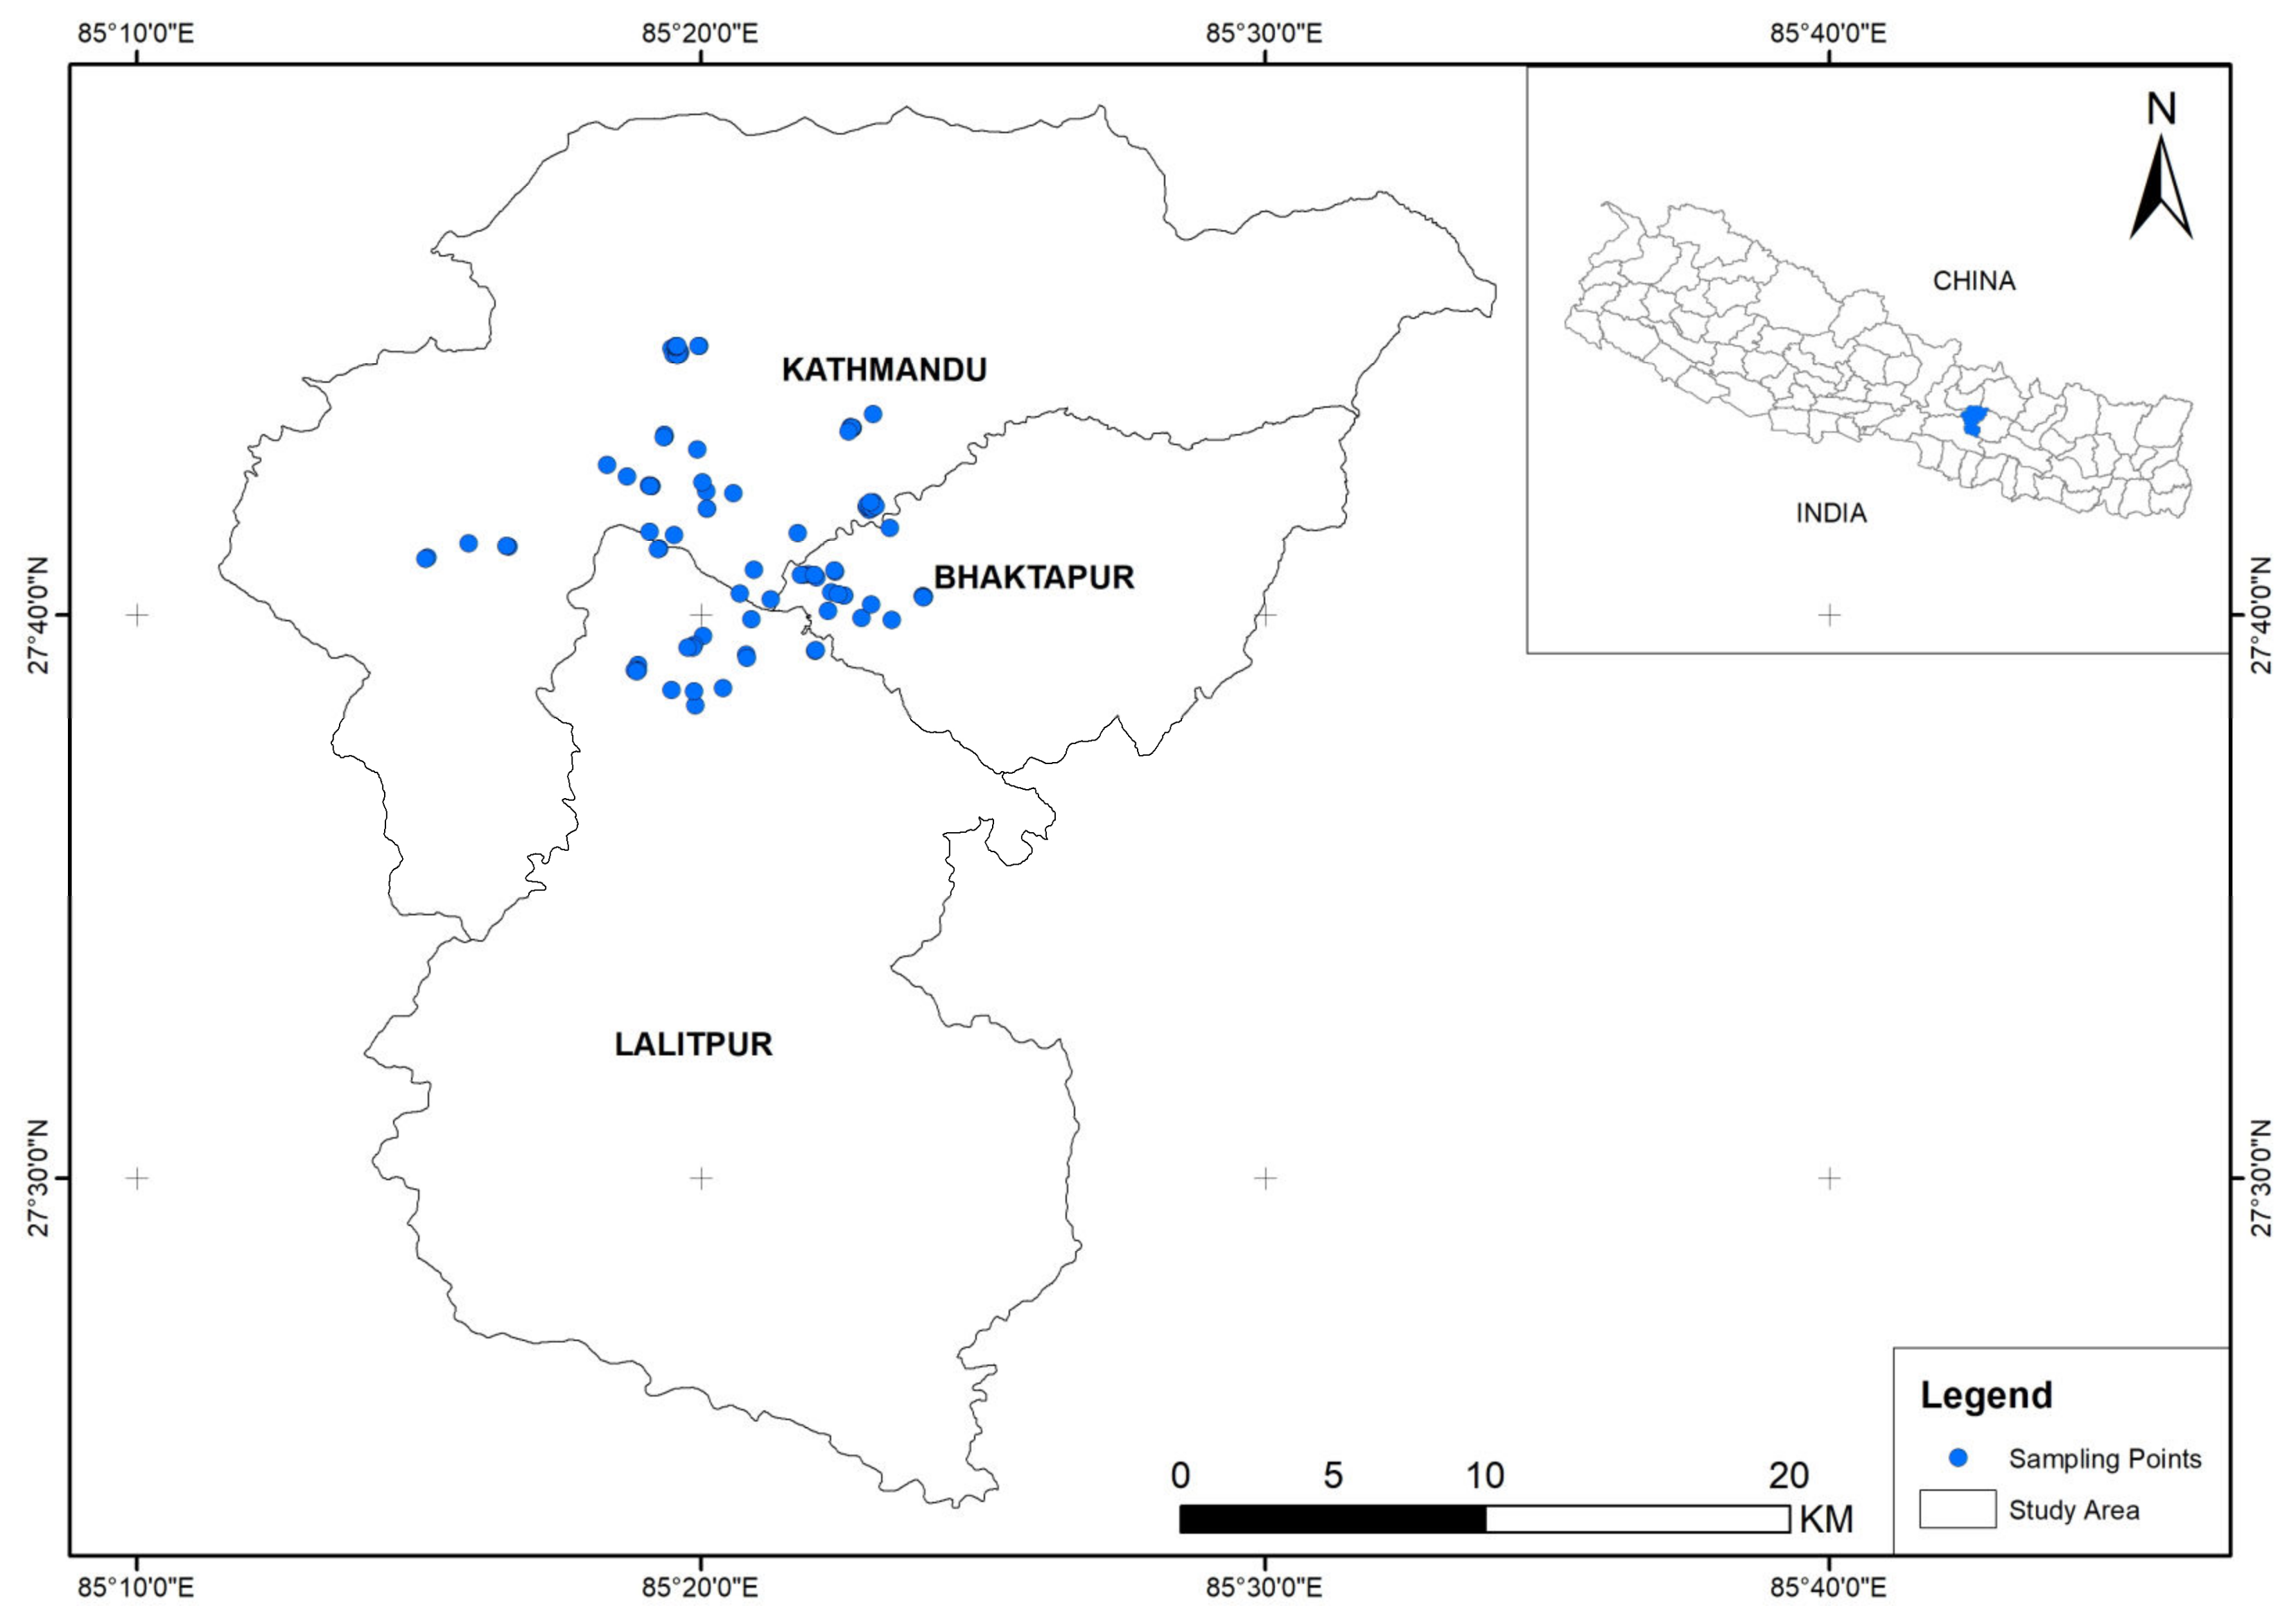
2.1. Study Area

The Kathmandu Valley is located in the Bagmati River Basin, Nepal (Figure 1). It has an area of 665 km2 and encompasses the entire area of Bhaktapur District, 85% of Kathmandu District, and 50% of Lalitpur District [36]. The oval intermontane valley is approximately 30 km in the east–west direction and 25 km in the north–south direction [37]. The central part of the valley is 1300–1400 m above mean sea level, with a gentle, flat landscape, and has an annual precipitation of 1400 mm [36,37]. Geologically, the valley is an intermountain bowl-shaped basin comprising both shallow and deep aquifers composed of fluvial–lacustrine sediments [38].
Households in the valley have several water sources: (1) the traditional water system, consisting of public water sources (stone spouts, dug wells, tanks, and ponds); (2) the piped water supply system, provided by utilities; (3) groundwater wells within household premises; and (4) various types of water-vending arrangements [39]. Kathmandu Upatyaka Khanepani Limited (KUKL) is the authorized public agency responsible for supplying potable water to the valley’s residents. Currently, the piped water supply system can meet only 21.5% of the total water demand [40]. The valley population grew rapidly at an annual rate of 4.63% between 2001 and 2011 [41], which created haphazard urbanization, resulting in various water supply challenges, including intermittent supply.

2.2. Sampling Points

In August and September 2022, raw and treated water samples from the HWTS methods were collected from 101 households in the 3 districts of the valley (Figure 1). The households were selected proportionally to the population of each district, and also by their water sources and HWTS methods. There were 4 water sources—piped water, jarred water, groundwater, and tanker water—and 5 HWTS methods were used in the households: boiling, ceramic candle filter (CCF), electric dispenser (ED), combined methods (CM), and reverse osmosis combined with ultraviolet irradiation (RO-UV) (Table 1). Table A1 showcases the price ranges (in Nepalese Rupee) of different HWTS devices analyzed in this study (based on market analysis), along with the average monthly cost per method for treating 9 L of water per day [19].
Piped water is the municipal water supply provided by the KUKL or community- managed schemes. Jarred water is processed drinking water that is sold in 20 L jars. In the valley, numerous private and commercial enterprises extract water from underground sources. Each supplier typically has their own distinct water source, which is treated and then distributed in 20 L jars. The water provided by these private suppliers is primarily sourced from underground (with deep boring of over 100 m) and some surface (spring) water, which is considered unsafe for drinking [42]. Private vendors also market tanker water, which is transported in tankers with an average capacity of 8000 L. These vendors have their own water sources and can distribute jar water, tanker water, or a combination of both to consumers. The sources of tanker water in the valley vary from surface water to shallow or deep borings. Treatment procedures at tanker filter stations include aeration, sedimentation, filtration (often using pressurized sand filters), and the use of bleaching powders [43].
Groundwater in this study refers to partially treated groundwater obtained from private wells by aeration, sand filtration, or other types of filters. Figure 2 shows the different HWTS methods: boiling, CCF, ED, CM, and RO-UV. The ED functions as an electric water heater that dispenses hot water at approximately 94 °C, while the CM employs various combinations of treatment methods.
Samples of jarred, piped, and boiled water were taken from storage vessels, while samples from CCF, ED, and RO-UV treatment were collected directly from the outlets of these methods after flushing standing water for 20–30 s, as there was no storage tank attached to them. Water samples were collected in 250 mL sterilized plastic bags and examined on site or in the laboratory on sampling days.

2.3. Water Quality Analysis

The water quality was tested for 8 parameters: 6 physicochemical and 2 microbial. The physicochemical parameters of temperature, total dissolved solids (TDS), and pH were measured on site using a compact pH and conductivity meter (LAQUAtwin, HORIBA, Kyoto, Japan). The testers were calibrated on each sampling day using the respective calibration standards. The chemical parameters of manganese and ammonia nitrogen (NH3-N) content were analyzed in the lab using a portable calorimeter (DR 900, HACH LANGE®, Loveland, CO, USA) and powdered reagents following the USEPA periodate oxidation and salicylate methods, respectively. Arsenic (As (III) + As (V)) was analyzed using the SPK-As (D) Pack Test (Kyoritsu Laboratories, Kanagawa, Japan) along with a digital arsenic meter for cross-verification. E. coli and TC were counted using the membrane filtration method (Method 10029, USEPA), with 100 mL water samples filtered through a disposable monitor unit (37 mm unit, mixed cellulose ester, pore size 0.45 µm; Advantech, Tokyo, Japan). The culture medium (m-Coli Blue 24 Broth; Hach, Loveland, CO, USA) was added to the monitor unit and incubated in a portable incubator at 37 °C under aerobic conditions for 24 h. The detection limits and sensitivity of the methods are shown in Table A2. The results of water quality analysis were compared with the NDWQS [44] to ascertain the compliance, efficacy, and reliability of the HWTS methods.

2.4. Questionnaire Survey

In March 2023, a questionnaire survey was conducted in Nepali and English among the 101 sampled households to obtain information about the usage and maintenance status of HWTS methods, as well as the reasons for selecting a particular HWTS method. This study was approved by the Research Ethics Committee of the University of Tokyo (Approval No. KE22-25).

2.5. Statistical Analysis

The Kruskal–Wallis H test was used to analyze the differences among more than two sample groups, whereas the Wilcoxon rank-sum test was used to compare two independent groups with unequal sample sizes. To evaluate the treatment efficiency of the HWTS methods, the physicochemical and microbiological water quality parameters before and after HWTS were illustrated by boxplots. The significance of water quality changes before and after the use of HWTS methods was examined by paired t-tests. The results were considered significant at p < 0.05 for all statistical tests. These statistical analyses were performed using R v. 4.3.0 [45] and Microsoft® Excel® v. 2303.

3. Results

3.1. Raw Water Quality

3.1.1. Physicochemical Parameters

Table 2 shows the mean values and ranges for the physicochemical water quality of raw water and the NDWQS limits. The compliance status is shown in Table 3. The water temperature was in the range of 23.2–28.8 °C, with average values of 25.7, 25.6, 25.4, and 25.0 °C for piped water, groundwater, jarred water, and tanker water, respectively. The pH value varied in the range of 5.88–8.54, with jarred water showing the highest variation. The average pH values for piped water, groundwater, jarred water, and tanker water were 7.38, 7.14, 6.77, and 7.89, respectively. The NDWQS mandates a pH of 6.50–8.50; 13.0% of samples failed to meet this standard, and all noncompliant samples were jarred water. Low pH values were associated with the geological location of the water source and the treatment method before delivery to the households [46]. The average TDS for piped water, groundwater, jarred water, and tanker water was 130.1, 269.1, 16.0, and 172.3 mg/L, respectively, with groundwater having the highest TDS (481.0 mg/L) and jarred water having the lowest (6.0 mg/L). The TDS of all samples was lower than the standard of 1000 mg/L. There was no significant difference in water temperature between water sources (Kruskal–Wallis H test, p > 0.05), while pH and TDS exhibited significant differences (p < 0.05).
Ammonia nitrogen was detected in 22 of 69 samples, with mean values of 0.54, 1.43, 0.56, and 1.00 mg/L for piped water, groundwater, jarred water, and tanker water, respectively. Groundwater had the highest ammonia nitrogen concentration at 26 mg/L; in total, 14.5% of samples exceeded the NDWQS limit of 1.5 mg/L, although the average values met the limit. Manganese was detected in 76 of 101 samples, with groundwater having the highest concentration at 1.6 mg/L. The mean concentration of manganese was 0.26, 0.46, 0.24, and 0.38 mg/L for piped water, groundwater, jarred water, and tanker water, respectively. In total, 42.5% of water sources exceeded the NDWQS limit of 0.2 mg/L, most frequently groundwater and tanker water. The arsenic concentration ranged from <0.009 mg/L (35 samples) to >0.2 mg/L (1 sample). The average concentration of arsenic was 0.022, 0.043, 0.019, and 0.041 mg/L for piped water, groundwater, jarred water, and tanker water, respectively. Although the average arsenic concentration in all water sources was below the NDWQS limit of 0.05 mg/L, some groundwater, tanker water, and piped water samples exceeded the limit, while all jarred water samples were below the limit. It was found that 32.2% of groundwater sources (10/31) exceeded the arsenic standard by NDWQS, affecting 10 wells (6 deep tube wells and 4 shallow dug wells), which was similar to a report by Emerman et al. [47]. The results of our study also show that higher levels of arsenic were present in 5.4% of piped water samples (2/37) and 25.0% of tanker water samples (2/8) compared to the NDWQS limit, which was not reported in previous studies [48,49]. Arsenic may be detected in piped water because some households use multiple water sources; their raw water samples could have been mixed with groundwater, but they reported it as piped water during the sampling, as evidenced by the elevated TDS. Similarly, tanker water may contain arsenic since it comes from deep groundwater; a prior study [50] discovered that 47.6% of deep groundwater in the valley had arsenic levels exceeding 0.05 mg/L. Nevertheless, there was no significant difference in chemical parameters among the various water sources (Kruskal–Wallis H test, p > 0.05).

3.1.2. Microbial Parameters

Table 4 shows the concentrations and positive percentages of E. coli and TC in raw water samples. The concentrations ranged from 0 to “too many to count” (TMTC), with 4 E. coli samples and 43 TC samples having TMTC. While it is possible to determine colony counts (colony-forming units, CFU) greater than 300 CFU/100 mL by the quadrant count method, microbial counts above that level were reported as TMTC in this study. The raw water samples were found to be positive for E. coli and TC at 64.3% (65/101) and 98.1% (99/101), respectively, exceeding the NDWQS limit of 0 CFU/100 mL (Table 4). To calculate the geometric means, samples with TMTC were assumed to have 300 CFU/100 mL and samples with no bacterial concentration to have 0.5 CFU/100 mL. Accordingly, the mean E. coli concentration was the lowest in jarred water at 1 CFU/100 mL, with a detection ratio of 32%, while the highest was in tanker water, with a geometric mean of 20 CFU/100 mL and a detection ratio of 87.5%. However, raw water from all sources was equally contaminated with TC. Therefore, E. coli concentrations differed significantly among the raw water sources (Kruskal–Wallis H test, p < 0.05), whereas TC concentrations did not (p > 0.05). Overall, coliform levels, TMTC cases, and detection ratios were higher for TC than for E. coli for all sources (Table 4).
Figure 3 illustrates the microbial contamination levels in different water sources. The highest percentage of negative E. coli (i.e., zero CFU) was observed in jarred water samples, which contained lower levels of E. coli than the other water sources, even in the positive samples (Figure 3a). Tanker water was the most contaminated with E. coli, followed by groundwater and piped water. These results align with a prior study [27] that reported an increased risk of diarrhea associated with the consumption of shallow well groundwater and tanker water. However, there was no difference in TC levels among the water sources (Figure 3b). These results regarding E. coli and TC detection rates in water sources align with prior research [28,29,30,31,43,48,49]. Groundwater was slightly less contaminated than tanker water (Table 4), possibly because homeowners treat groundwater (with aeration, sand filtration, and water treatment vessels) before using it for drinking purposes and tanker water could be contaminated because they obtain water from contaminated sources and store it for long periods (>2 weeks) in basement tanks.

3.2. Treatment Performance of HWTS

3.2.1. Selection of HWTS for Different Water Sources

Of the 101 households, 30 used boiling, 3 used CCF, 3 used ED, 14 used CM, and 51 used RO-UV to treat their water. CM included seven boiling + CCF (boiling followed by CCF), four CCF + boiling, two CCF + chemicals, and one RO-UV + boiling. Table 5 shows the HWTS methods selected by the households for different water sources. Most households (>90%) using groundwater as their main source chose RO-UV, due to high TDS and chemical contaminants in the groundwater, as shown in Table 2. In contrast, among households that used jarred water, 68.0% adopted boiling, followed by CCF (12.0%), ED (12.0%), and CM (8%), because of the low TDS levels in jarred water (Table 2). For piped water and tanker water, approximately half of the households selected RO-UV, while the others selected boiling and CM, depending on perceived contamination risk.

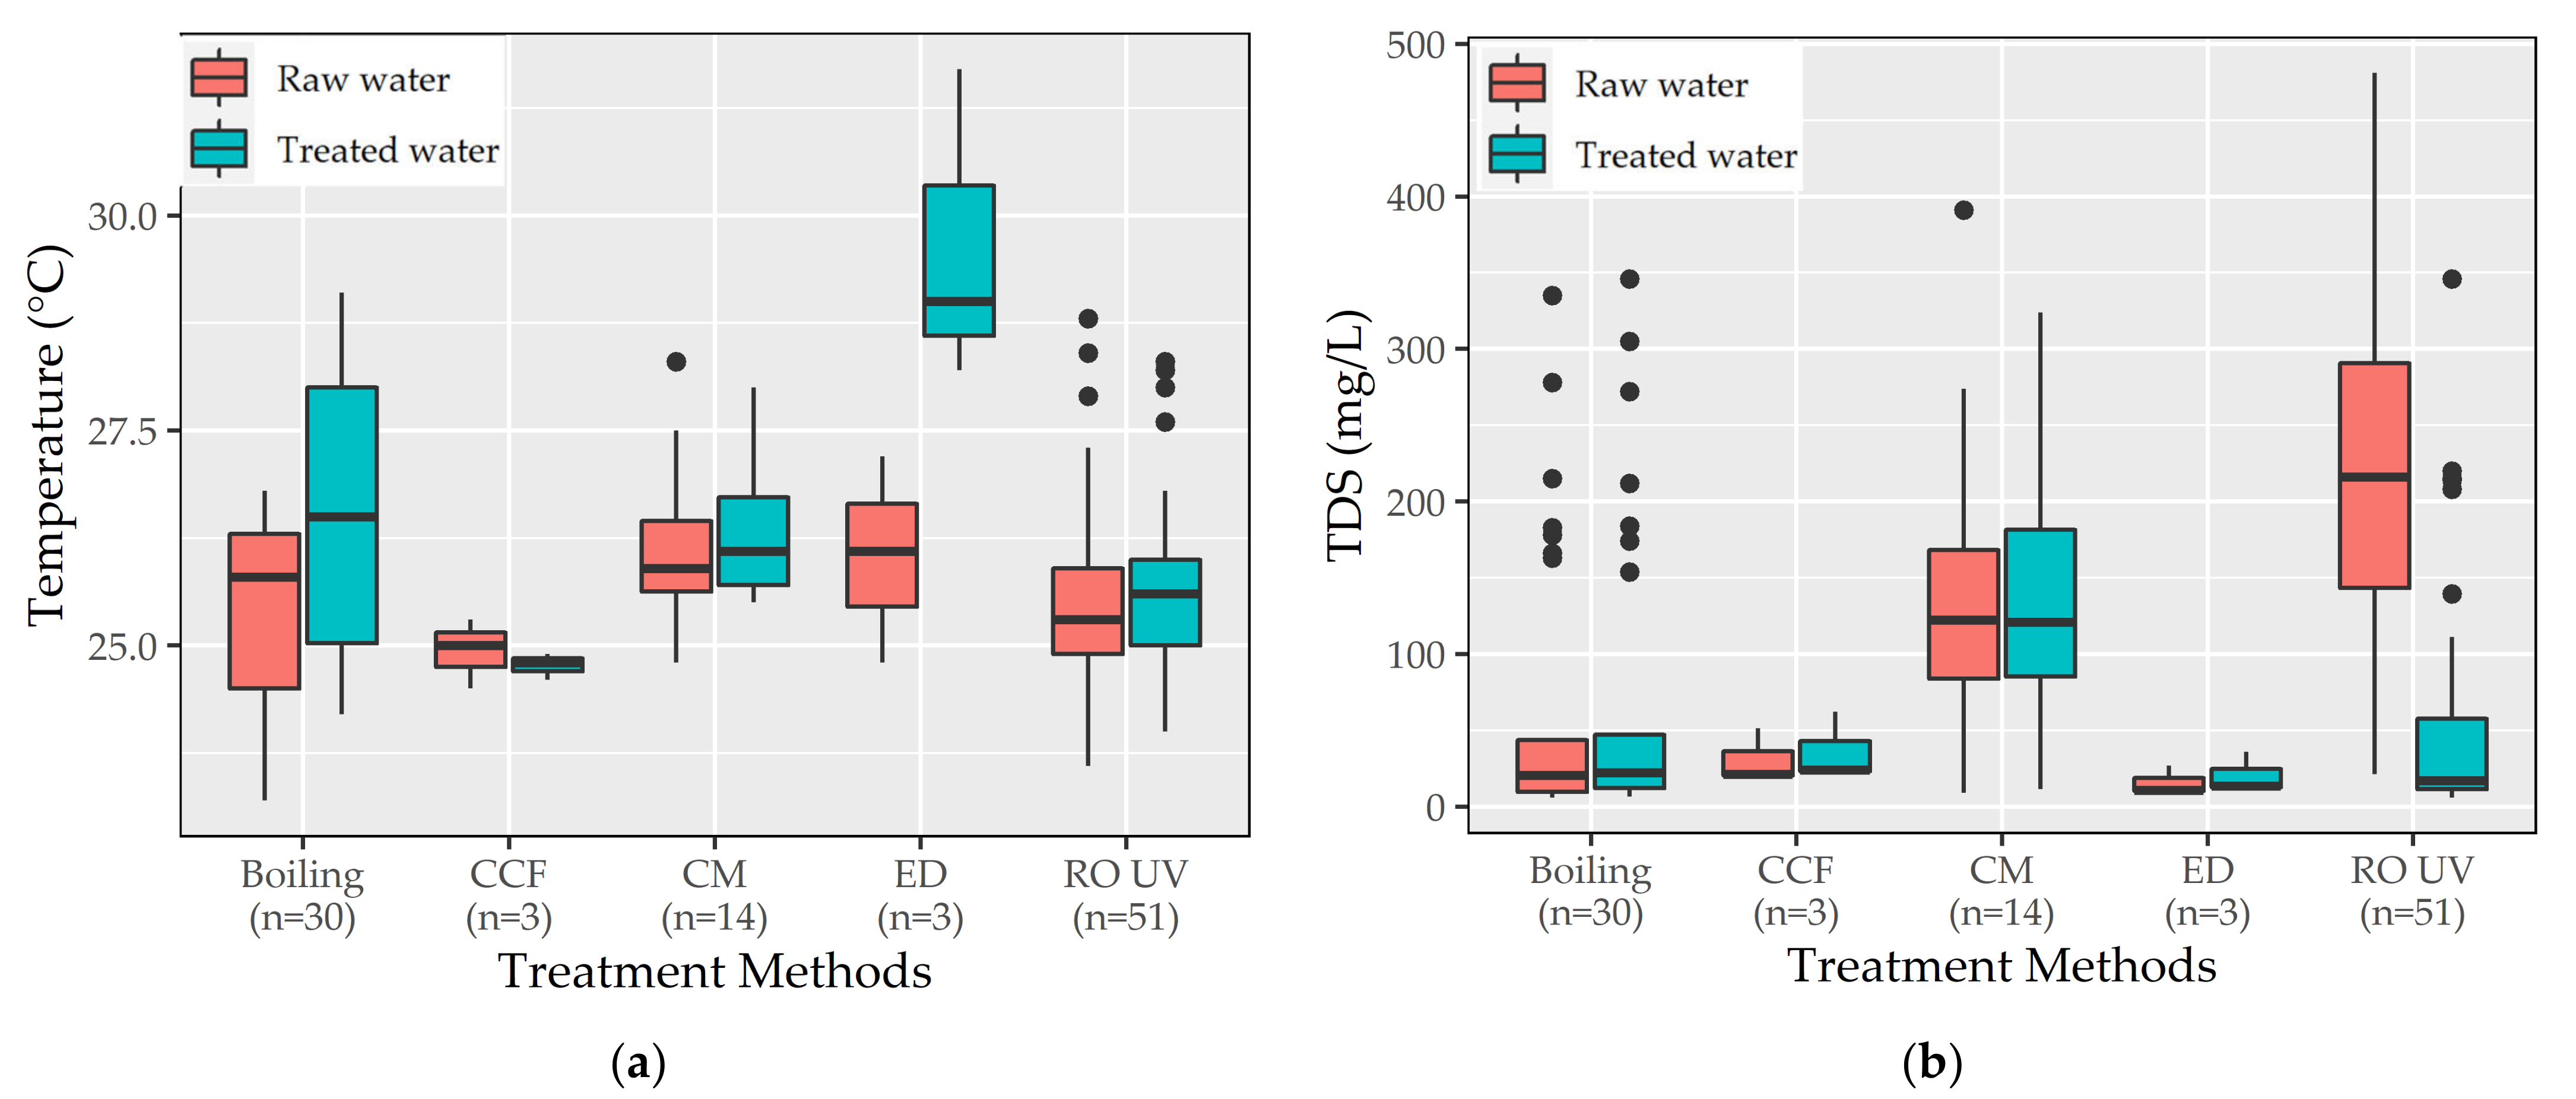
3.2.2. Physicochemical Parameters

Figure A1 shows the temperature and TDS of raw water and water treated by HWTS. The water temperature increased slightly from 25.6 °C for raw water to 26.1 °C after the boiling and RO-UV methods. Only RO-UV decreased TDS levels significantly, with average and maximum removal rates of 73.8 and 97.8%, respectively. Some households had lower TDS removal rates because they manually adjusted the TDS control valves, mixing in raw water that bypassed the RO unit (Figure A2). Boiling increases TDS due to evaporation [51], and ceramic filters can increase TDS in treated water due to mineral dissolution [52]. However, all raw and treated water samples met the NDWQS limit for TDS of 1000 mg/L. Figure 4 shows the physicochemical water quality parameters in raw water and water treated by various HWTS methods. With all HWTS methods, except for RO-UV, the pH increased slightly after treatment (Figure 4a). RO-UV reduced the pH in 28 out of 39 samples due to a lower buffering capacity by ion rejection with RO membranes [53], while other RO-UV methods showed a slight increase in the pH due to the alkaline boosters they are equipped with. Temperature (with boiling), pH (with boiling, RO-UV, and CM), and TDS (with boiling and RO-UV) were significantly different before and after the HWTS treatments (paired t-test, p < 0.05).
On average, RO-UV removed 94.5% of ammonia nitrogen, whereas boiling and ED showed a marginal removal, with two cases of an increase, possibly caused by the recontamination of the stored water (Figure 4b). However, CCF completely removed ammonia nitrogen, possibly due to the growth of nitrifying bacteria on filter surfaces. For one household that used a combined method (boiling + CCF), there was a rise in the ammonia nitrogen level from 1.0 to 6.0 mg/L, likely due to recontamination. Nevertheless, ammonia nitrogen was completely removed in two other households that used different combinations (RO-UV + boiling and CCF + boiling). Out of 69 treated water samples, 5.8% (4/69) did not meet the NDWQS limit for ammonia nitrogen of 1.5 mg/L, which was slightly reduced from 14.5% (10/69) in raw water. However, the reduction in ammonia nitrogen between treated water and raw water was not significant (paired t-test, p > 0.05).
Both ED and boiling slightly increased arsenic concentrations in the treated samples (Figure 4c), possibly due to evaporation and the concentration of arsenic in the remaining volume of water [54]. Of the 51 samples treated with RO-UV, 11 (23.5%) had arsenic levels below LDL before and after treatment, whereas 28 (55.1%) reduced arsenic by an average of 57.6%, with the highest at 88.1%. However, for the remaining 12 samples, water treated with RO-UV had a higher arsenic concentration than raw water, as shown by the outliers (Figure 4c), possibly due to the detachment of arsenic from the tube walls of the RO-UV. The average arsenic removal rate for CCF and CM was 38.3 and 18.6%, respectively. Among all HWTS-treated water samples, 7.9% failed to meet the NDWQS limit for arsenic, compared to 13.8% of raw water samples. RO-UV reduced manganese by an average of 61.3%, while CCF removed it by 52.7% (Figure 4d). The manganese concentration increased in some samples treated by boiling and ED, probably due to evaporation and concentration. Overall, 33.6% of the treated water samples failed to meet the NDWQS limit for manganese of 0.2 mg/L, compared to 42.5% of raw water samples. Only manganese (with CM and RO-UV) and arsenic (with RO-UV) showed statistically significant differences (paired t-test, p < 0.05) before and after the HWTS treatments.

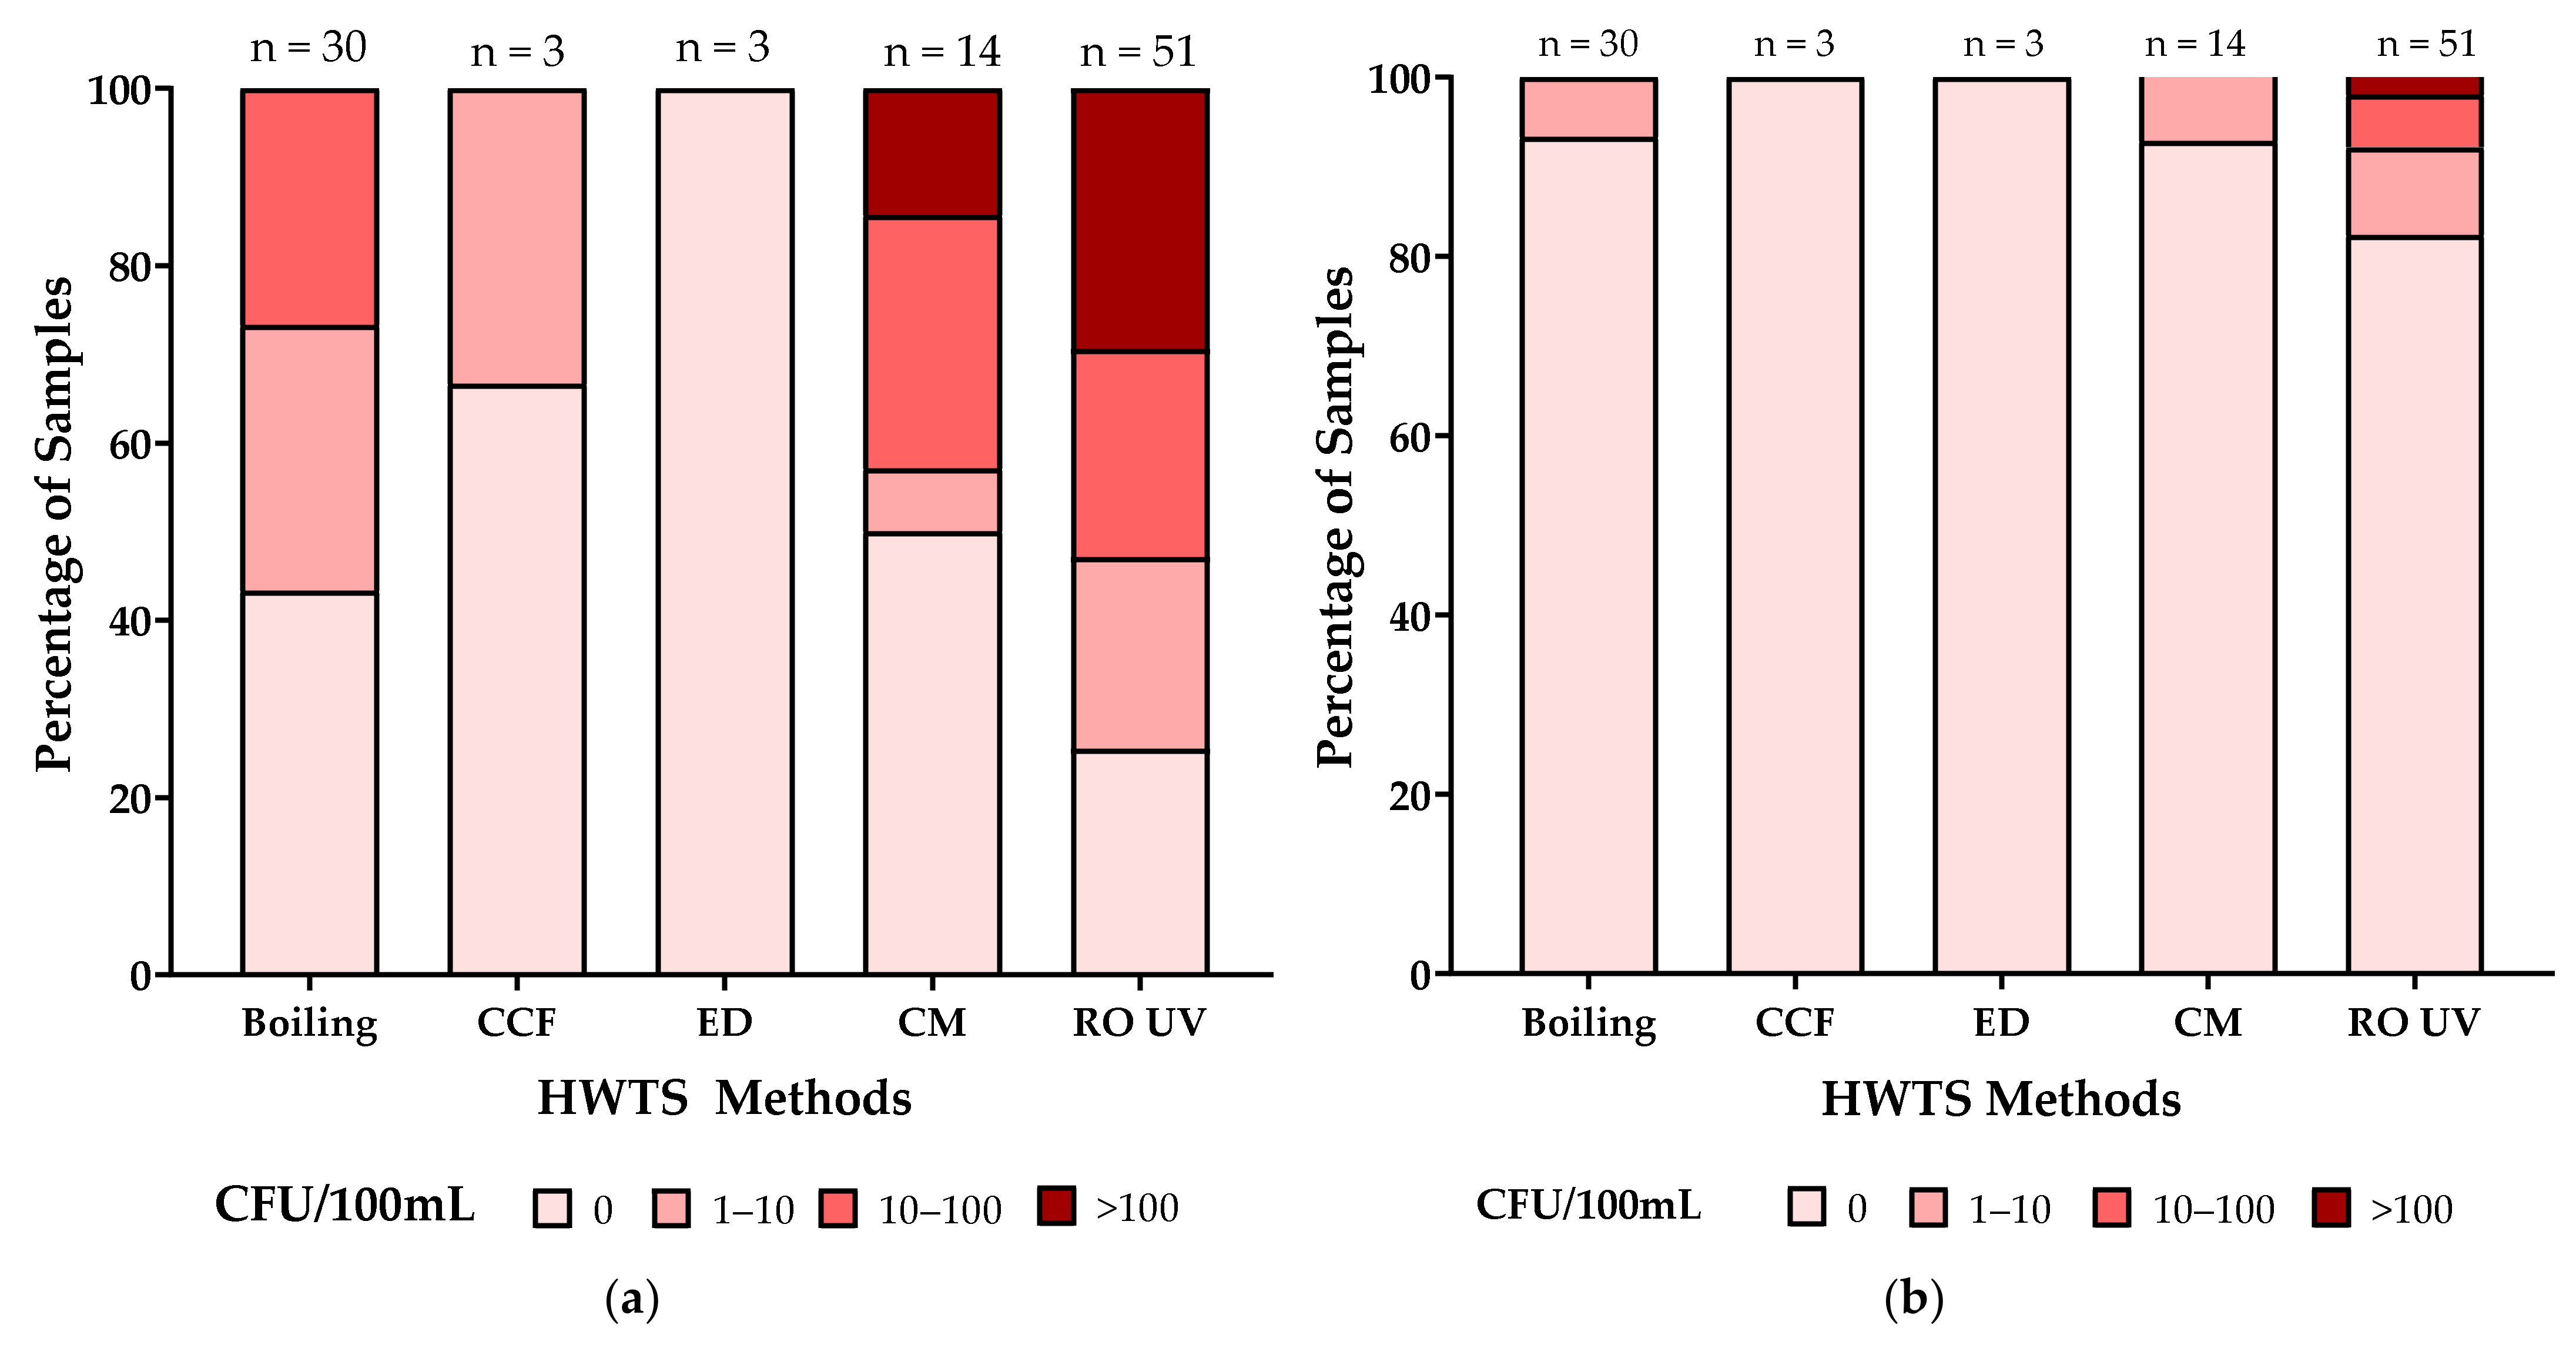
3.2.3. Microbial Parameters

Figure 4e,f show E. coli and TC in raw water and water treated by different HWTS methods. Figure 5 and Figure 6 compare E. coli and TC contamination ranges, respectively, in raw water and water treated by different HWTS methods. HWTS methods reduced E. coli and TC significantly (paired t-test, p < 0.05) by 95.7 and 84.1%, respectively, in 85.1% (86/101) of the samples, while increased TC concentrations were observed in the remaining samples.
Overall, E. coli was not detected in 35.7% of raw water samples, and the proportion increased to 88.2% after the HWTS treatments. No E. coli was detected in the water treated by ED, which might be due to the low levels of E. coli in raw water (Figure 5a) and small number of samples (n = 3). The high levels of E. coli in the RO-UV-treated water (Figure 5b) indicate the vulnerability of this method to high levels of E. coli in the source water.
Only 1.9% of the raw water samples were not contaminated by TC, and the proportion increased to 30.7% after treatment. Even after treatment, TC remained at high concentrations (Figure 6b), and was more prevalent than contamination by E. coli for all HWTS methods (Figure 5b). This was in line with the higher rate of TC in the treated water samples at 69.3%, compared to E. coli at 11.8%, and the higher geometric mean of 9 CFU/100 mL for TC compared to 0.6 CFU/100 mL for E. coli. Overall, the removal rates of E. coli (95.8%) and TC (84.1%) were significantly different (Wilcoxon rank-sum test, p < 0.05).
Table 6 shows the number of raw water samples with TC detected, the number of samples with decreased TC after HWTS, the mean TC concentrations in raw and treated water, the log reduction value (LRV) and percentage of samples with more than 2 LRV, and the overall TC contamination in treated water from each HWTS. The boiling method exhibited the highest mean LRV of 1.8, with 51.8% of samples (14/27) showing an LRV greater than 2, whereas RO-UV had the lowest mean LRV of 1.2, with only 25.5% of samples showing an LRV greater than 2. The combined methods also showed a low mean LRV of 1.5, with only 36.3% of samples having an LRV greater than 2.
While E. coli increased only in 1 sample (boiling + CCF) among all HWTS methods, 13 samples showed higher TC concentrations after the HWTS treatments: boiling (2/29), CCF (1/3), CM (3/14), and RO-UV (7/50) (Table A3). The geometric means of TC concentration before and after the HWTS treatments were also significantly different for these samples (55 vs. 166 CFU/100 mL, respectively; paired t-test, p < 0.05). It was found that the post-treatment regrowth of TC was most likely to occur after RO-UV and CM, as indicated by the negative LRVs (Table A3). Compared to the water treated by boiling, the detection of TC was higher in the RO-UV-treated water (76.5 vs. 56.6%), TC levels were higher (11 vs. 2 CFU/100 mL), and there were more cases of increased TC in the treated water (7 vs. 2). Similarly, compared to water treated by boiling, CM-treated water also showed widespread TC contamination (71.4 vs. 56.6%), a higher average TC level (6 vs. 2 CFU/100 mL), and more cases of increased TC in the treated water (3 vs. 2) (Table 6 and Table A3). These results indicate that water treated by the boiling method is microbially safer than water treated by RO-UV or CM. Nevertheless, among the various HWTS methods, no significant differences were observed in the reduced percentages of E. coli and TC (Kruskal–Wallis H test, p > 0.05). While a moderate correlation was found between the concentration of TC in raw water and TC reduction (Pearson correlation analysis, r = 0.33, p < 0.05), no such correlation was found for E. coli (r = −0.03, p > 0.05).
In terms of TC removal efficiency, two common CMs, CCF + boiling and boiling + CCF, showed comparable proportions of TC-positive samples, 75.1% (n = 4) and 71.4% (n = 3), respectively. The geometric means of TC concentrations in treated water for these methods were 17 and 15 CFU/100 mL, respectively, which are higher than the values for the boiling method. No significant differences in E. coli and TC levels were found in water treated by these two CMs (Wilcoxon rank-sum test, p > 0.05).
Overall, water treated by boiling had a 56.6% TC contamination rate, while the rate for water treated by ED and CCF was 66.6%, and that for CM was 71.4%. RO-UV-treated water had the highest rate, 76.5%. Similarly, the E. coli contamination rate in water treated by boiling was 6.6%, whereas the rate for CCF-treated water was 7.1%, and RO-UV-treated water had the highest rate of 17.6%.

3.3. Reduction in Proportions of Samples Noncompliant with NDWQS by the HWTS Treatments

Figure 7 shows the proportions of raw and treated water samples that were noncompliant with NDWQS. All samples met the NDWQS TDS standard, while noncompliance ratios of pH increased slightly after the HWTS treatments due to a reduced pH by RO-UV. Noncompliance ratios of ammonia nitrogen, manganese, and arsenic decreased moderately after the HWTS treatments. Despite the high noncompliance ratios of raw water in terms of E. coli, it was decreased most significantly by the HWTS treatments. The noncompliance of raw water was the highest for TC, which was only moderately reduced after treatment due to TC regrowth and/or recontamination. Among the 101 samples from four water sources, groundwater and tanker water had the highest proportion of noncompliance, followed by piped water and jarred water, which had the lowest. It is especially noteworthy that the highest proportions of noncompliance for all parameters, except TDS, were found with RO-UV and CM, probably due to difficulties in maintaining these HWTS methods.

3.4. Questionnaire Survey

Most respondents were older than 50 (35.7%) and a few were younger than 30 (22.8%). Among the 101 households, 15 were tenants and 86 were house owners. Notably, 80% of tenants used the more affordable HWTS methods, such as boiling, CCF, and ED, while only 20% used RO-UV. Regarding well types, 64.6% of households used shallow-dug wells and 35.4% used deep tube wells. Although they considered multiple factors when selecting the HWTS methods, such as ease of use, simplicity, safety, effectiveness, portability, TDS removal, affordability, self-assurance, water quality, risk perception, distrust in the piped water supply, recommendations from others, and the pros and cons of each method, similar to previous studies [19,22,55,56], it was found that the water source was the main factor (Table 5). As for microbial safety, 90.1% of respondents indicated that they considered HWTS-treated water to be safe, but 9.9% were unsure. However, only 8.8% of households (7/101) tested the quality of the treated water regularly, 55.8% never tested, 13.3% tested once at the beginning of HWTS installation, and 22.1% tested occasionally.
It was found that, in 90.6% of households using RO-UV and CCF, residents were aware of the importance of regular maintenance, but only 45.3% changed the filters within 6 months. When a combination of RO-UV and CCF methods was used, 75.9% of the treated water samples were contaminated with TC, and seven samples showed an even higher TC in the treated water than in raw water. Similarly, among those who used the boiling method, 33.3% were unaware of safe storage and handling, and thus 58.6% of the treated water samples obtained from boiling were contaminated with TC. All three households that used ED reported that they performed no maintenance, and thus two of them had TC contamination in the treated water. Similarly, among the 14 households that used CM, 9 replaced the filters every 6 months, but the rest replaced them only after 6 months. In addition, while 10 households used water directly from CM, 4 stored their treated water in vessels. As a result, 71.4% of CM samples were contaminated with TC.
Given that boiling, CCF, and RO-UV are known to be efficient at removing pathogens, the compromised performance of bacteria reduction by the HWTS methods observed in this study could be attributed to operational and hygienic factors, as reported in a previous study [16]. The contamination of water in households that relied on boiling or CM, with boiling as the final treatment method, could be attributed to poor hygiene (non-hygienic storage and unsafe handling practices), while in households that used CCF, ED, and RO-UV, microbial contamination could be linked to poor maintenance, such as failing to replace filters regularly or to properly maintain EDs.
Figure 8 shows the detection rates of E. coli and TC in water treated by HWTS, the contribution of each HWTS, and probable factors influencing microbial contamination with E. coli and TC. The detection rate of E. coli (11.9%) was significantly lower than that of TC (69.3%). Among the 11.9% of samples contaminated with E. coli, the majority were from the RO-UV method (75%), followed by boiling (16.7%) and CM (8.3%). The survey results suggest that 75.0% of the E. coli contamination could have been due to inadequate maintenance, while 25.0% was attributed to poor hygienic practices, such as unsafe storage and unsafe handling (Figure 8a). Similarly, out of the 69.3% of samples contaminated with TC, 55.7 and 14.2% were treated by RO-UV and CM, respectively, whereas the rest were treated by boiling (24.3%), CCF (2.9%), and ED (2.9%). The survey indicated that 70.0% of cases of TC contamination might have been due to poor maintenance, while 30.0% were due to poor hygiene (Figure 8b).

4. Discussion

4.1. Selection of HWTS Based on the Removal of Physicochemical Contaminants

RO-UV showed high rates of ammonia nitrogen removal, as reported by Koyuncu et al. [57], while boiling and ED showed limited removal owing to the evaporation of ammonia at high temperatures. CCF removed ammonia nitrogen completely in some households, owing to low initial concentrations and bacterial nitrification. While boiling is not effective for manganese removal [58], CCF showed moderate removal. The average manganese removal rate of 61.3% by RO-UV was lower than that reported in a previous study [59], which could be due to the differences in system design, maintenance, and raw water quality. The HWTS methods that involve boiling (boiling and ED) increased arsenic concentration due to evaporation [54]; thus, boiling is not appropriate for raw water containing arsenic and other dissolved contaminants [60]. Mahlangu et al. [61] reported a 50% reduction in arsenic using CCF, comparable to the 38.7% observed in this study. The low arsenic removal rates in some samples treated by RO-UV might have been due to low arsenic concentrations in raw water, as 70.3% of samples had concentrations below 0.03 mg/L, while the LDL of the test kit was fixed at 0.009 mg/L. Similarly, the increased arsenic concentration in the treated water might be due to the leaching of adsorbed arsenic from the tubing, due to poor maintenance [62]. Although it was reported that point-of-use RO devices reduce arsenic by 70–99% in laboratory tests, the actual removal efficiency might be lower due to poor maintenance, improper setup, filter differences, and water quality variations [63]. However, well-maintained RO devices in Nevada, USA, were reported to have a high arsenic removal rate of 80.2% [64]. Nevertheless, low arsenic removal rates and increased arsenic levels by the RO-UV treatment in this study indicate the need for further investigation into the RO-UV method.
Some treated water samples failed to meet physicochemical parameter standards. It is important to be aware of the limitations of certain techniques, such as boiling, in eliminating physicochemical contaminants.

4.2. Selection of HWTS Based on Bacterial Reduction

All five HWTS methods were effective in reducing E. coli and TC levels, but recontamination persisted in the treated water samples. The recontamination of boiled water by TC was also reported in a study in Uganda [65]. Although 84.8% of those who used the boiling method perceived their water to be safe, E. coli and TC were present in 6.6 and 56.6% of treated samples, respectively, which suggests that storage conditions and hygiene practices are important factors in keeping boiled water free from microbial contamination [66,67]. Considering the lack of awareness among 33.3% of those who used boiling, it is crucial to address re-contamination, especially in the context of the valley, where 60% of households [19] use boiling alone or in combination with other methods.
A high TC recontamination rate of 66.6% in water treated by ED was consistent with prior research [68], which identified the poor maintenance and hygiene of water dispensers. In the present study, we also found that none of the households using ED regularly cleaned or maintained their dispensers. Similarly, TC contamination in 66.7% of water treated by CCF indicates unreliable performance and poor maintenance. According to the survey, two-thirds of CCF users replaced their filters within 6 months to 1 year. A new CCF can remove over 99% of bacteria, but the removal rate could be compromised when there is a lack of regular maintenance [20] or improper cleaning by using a dirty cloth or dirty water [69]. The presence of TC in 76.5% of RO-UV-treated water samples occurred because 56.8% of the households neglected timely filter replacement, which leads to bacterial regrowth and biofilm formation [70]. When a filter has been used for a third of its lifespan, biofilms can form inside, enabling bacteria to grow, which raises the bacterial concentration in the effluent [71]. In addition to the inadequate maintenance of filters or membranes, the ineffective functioning of the UV compartment in certain systems might be a potential cause for the identification of coliforms in RO-UV-treated water. The higher contamination observed in RO-UV-treated samples might also be related to the quality of source water, since households that used RO-UV used groundwater and tanker water, which contain higher E. coli and TC levels compared to piped and jarred water. A prior study warned that household water purifiers could increase microbial risk, highlighting the importance of regular filter changes and backwashing programs for improved performance [33]. It is important to acknowledge that various kinds of RO-UV methods were used in each household, obtained from different manufacturers, with varying durations of usage and maintenance conditions, resulting in varying efficiencies of bacteria reduction. Contrary to previous research that reported the consistent performance of RO-UV with 87.0% of TC removed from groundwater [72], we found in our study that the removal efficiency of RO-UV could be compromised due to difficulties with maintenance in real-life settings and usage, ranging from complete elimination to an increase in coliform levels in the treated water.
Households in the valley chose RO-UV and CM to produce safe water due to perceived insecurity [19]. It was also found that 85.7% of CM users and 94.1% RO-UV users expected the treated water to be safe. However, it was revealed that water treated by simpler HWTS methods (boiling and ED) was microbially safer than RO-UV and CM. Hence, although RO-UV is a top-tier water purification method, it may not always produce microbially safe water due to the difficulty in maintaining it. Over-reliance on RO-UV may put users at risk of being exposed to infectious bacteria; in this study, E. coli was detected in 9 out of 51 samples of RO-UV-treated water. Similarly, the two common CMs (CCF + boiling and boiling + CCF) showed similar efficacy to RO-UV in reducing E. coli and TC, while they were inferior in reducing bacteria compared to boiling alone. Therefore, it is recommended to use simple HTWS methods, such as boiling or CCF, unless the raw water contains dissolved inorganic contaminants, such as high TDS, arsenic, ammonia, iron, or manganese. Likewise, RO-UV displayed very unreliable performance; hence, it is recommended only if the raw water contains high concentrations of dissolved inorganic contaminants; however, users should maintain and replace the filters, RO membranes, and UV lamps regularly to avoid bacterial contamination. Additionally, for households that adopt RO-UV to treat groundwater with high levels of inorganic and/or organic contamination, it is recommended to boil the treated water before consumption to minimize the risk of microbial contamination.
Although 90.6% of households that used RO-UV and CCF systems were aware of regular maintenance, 75.9% of treated water samples contained TC, suggesting that filters were not replaced as needed. This might be because users tend to change HWTS filters based on taste and odor changes [73] rather than on a regular schedule. This highlights the need to guide households on the regular maintenance of HWTS methods. It was also revealed that there is a wide gap between the perceived and actual water quality; while most residents (90.1%) believed their water was safe, 11.8 and 69.3% of treated water samples contained E. coli and TC, respectively. Only 8.8% of households tested the quality of the treated water regularly, indicating a lack of water quality testing and inadequate maintenance/safe storage practices, which could lead to noncompliance with NDWQS. Hence, it is important to raise awareness among households that use boiling, RO-UV, and CM in order to prevent microbial recontamination or regrowth in water treated by these HWTS methods. These results are in line with the suggestions by Labhasetwar and Yadav that poor hygienic practice in households is the cause of water quality deterioration, and thus it is important to maintain POU units regularly, because it is not economically feasible to monitor water quality of POU-treated water continuously [74].
Although the results obtained in this study are useful to understand the treatment efficiencies of different HWTS methods, the sample numbers are limited, especially for CCD and ED (Table 1). Therefore, further studies are recommended to confirm the results for these HWTS methods.

5. Conclusions

Among the 101 household using HWTS in the Kathmandu Valley, it was found that they selected HWTS methods mostly based on their raw water sources, while they also considered other factors, with jarred water users preferring boiling and groundwater users choosing RO-UV. The boiling and ED methods did not remove physicochemical contaminants, and their efficiency in reducing microbial contamination was influenced by storage and hygienic practices. The CCF and RO-UV methods showed a moderate to high removal rates of chemical contaminants, but inadequate maintenance compromised their efficiency in removing E. coli and TC. While all HWTS methods effectively reduced E. coli and TC, concerns about compromised treatment efficiency and bacterial regrowth persisted due to poor maintenance or poor hygienic practices. Many treated water samples showed TC recontamination, and in a few cases, the treated water had even higher TC concentrations than raw water. Hence, in addition to E. coli, this study highlights the importance of monitoring TC as an indicator of compromised treatment efficiency and bacterial regrowth, especially for users of RO-UV and CM.
High-end HWTS methods, such as RO-UV and CM, are not maintenance-free, but rather difficult and expensive to maintain; thus, they should be selected only for the source water highly contaminated with inorganic contaminants. Instead, we recommend a simpler HWTS method, such as boiling or CCF, as a better option if bacteria removal is the only objective. Simple and easy methods for maintaining RO-UV and CM systems to prevent microbial regrowth need to be developed by the manufacturers. Because, in many cities in developing countries, using an efficient and reliable HWTS is the only viable option to secure safe drinking water for households, raising awareness about the selection and proper maintenance of HWTS should be emphasized by governments and the companies that manufacture and sell HWTS methods. Future research needs to focus on the prevention of bacterial regrowth in HWTS methods.

Author Contributions

Conceptualization, S.K. (Shekhar Khanal), S.K. (Shinobu Kazuma) and S.T.; methodology, S.K. (Shinobu Kazuma) and S.T.; data analysis, S.K. (Shekhar Khanal), S.K. (Shinobu Kazuma) and S.T.; investigation, S.K. (Shekhar Khanal); data curation, S.K. (Shekhar Khanal) and S.K. (Shinobu Kazuma); writing—original draft preparation, S.K. (Shekhar Khanal); writing—review and editing, S.T., S.K. (Shinobu Kazuma) and S.B.; visualization, S.K. (Shekhar Khanal); supervision, S.T. and S.K. (Shinobu Kazuma); project administration, S.K. (Shinobu Kazuma) and S.T.; funding acquisition, S.T. All authors have read and agreed to the published version of the manuscript.

Funding

This research was supported by the Japan International Cooperation Agency (JICA) through a collaborative program with the University of Tokyo and a scholarship provided to Shekhar Khanal for his graduate studies. This study was also supported by a Grant-in-Aid for Scientific Research (No. 22H01621) provided by the Japan Society for the Promotion of Sciences (JSPS).

Institutional Review Board Statement

The study protocol was reviewed by the Research Ethics Committee of the University of Tokyo (Approval Number KE22-25) prior to its implementation.

Informed Consent Statement

Respondents were informed of the voluntary nature of the study, assured of anonymity, and given the option to decline to answer any questions. Verbal consent was obtained before sharing the questionnaire. The survey followed all scientific and ethical standards mandated by the Research Ethics Committee of the University of Tokyo (Approval No. KE22-25).

Data Availability Statement

The data presented in this study are available upon request.

Acknowledgments

The authors wish to extend their appreciation to the households that willingly participated in the water sampling and the questionnaire survey. We would also like to acknowledge the laboratory divisions of the Department of Water Supply and Sewerage and KUKL Mahankalchour Branch for their support in conducting the water quality survey.

Conflicts of Interest

The authors declare no conflict of interest.

Abbreviations

HWTS Household water treatment and safe storage
POU Point of use
POE Point of entry
TC Total coliforms
NDWQS National Drinking Water Quality Standards
CCF Ceramic candle filter
ED Electric dispenser
CM Combined methods
RO-UV Reverse osmosis with ultraviolet irradiation
TDSTotal dissolved solids
LDLLower detection limit
UDLUpper detection limit
TMTC Too many to count
CFUColony-forming units

Appendix A

Table A1. Market price range of different HWTS in this study and average monthly costs [19].
No.HWTS MethodsMarket Price Range (NPR)Average Monthly Cost (NPR)
Minimum PriceMaximum Price
1Boiling6003000340
2CCF150013,00056.7
3RO-UV15,00057,000799
4ED22009000340
5Chemicals255522.5
Note: NPR = Nepalese Rupee.
Table A2. Details of water quality parameters and analysis methods.
No.ParameterUnitDevice/MethodLDL *UDL **Sensitivity
1Temperature°CHoriba Compact EC meter: LAQUAtwin EC-33B0500.1
2TDSmg/L099000.1–1
3pH-Horiba Compact pH meter: LAQUAtwin pH-22B0140.1
4Ammonia-nitrogenmg/LHach® DR 900/salicylate method0.4500.3
5Manganesemg/LHach® DR 900/USEPA periodate oxidation method0.1200.1
6Arsenicmg/LPack test and arsenic set
Kyoritsu Laboratories SPK-As(D)
0.0090.20.001
7E. coliCFU/100 mLPortable incubator/USEPA Method 10029NANANA
8Total coliformsCFU/100 mL
Notes: * LDL: lower detection limit. ** UDL: upper detection limit.
Table A3. Increased TC with different HWTS methods.
HWTS MethodNet
Samples
Detected with TC
Samples with Increased TCMean TC
Raw *
Mean TC
Treated *
LRV **
Boiling292116180−0.18
CCF31133275−0.31
ED3000NA
CM14335111−0.49
RO-UV50748180−0.57
Notes:* CFU/100 mL. ** Negative LRV indicates an increased TC concentration after treatment.
Figure A1. Boxplot analysis for (a) temperature and (b) TDS before and after HWTS.
Water 15 02305 g0a1
Figure A2. TDS controller valve function in the POU RO-UV system [75].
Water 15 02305 g0a2

References

  1. United Nations General Assembly. 64/292: The Human Right to Water and Sanitation; United Nations: New York City, NY, USA, 2010; Available online: https://digitallibrary.un.org/record/687002?ln=en (accessed on 28 February 2023).
  2. UNICEF-WHO. 1 in 3 People Globally Do Not Have Access to Safe Drinking Water. 2019. Available online: https://www.who.int/news/item/18-06-2019-1-in-3-people-globally-do-not-have-access-to-safe-drinking-water-unicef-who (accessed on 28 February 2023).
  3. UN-Habitat. Water, A Shared Responsibility: The United Nations World Water Development Report 2; UN-Habitat: Nairobi, Kenya, 2006; Available online: https://unhabitat.org/water-a-shared-responsibility-the-united-nations-world-water-development-report-2-2 (accessed on 28 February 2023).
  4. Mwabi, J.K.; Adeyemo, F.E.; Mahlangu, T.O.; Mamba, B.B.; Brouckaert, B.M.; Swartz, C.D.; Offringa, G.; Mpenyana-Monyatsi, L.; Momba, M.N.B. Household water treatment systems: A solution to the production of safe drinking water by the low-income communities of Southern Africa. Phys. Chem. Earth Parts A/B/C 2011, 36, 1120–1128. [Google Scholar] [CrossRef]
  5. Prüss-Ustün, A.; Wolf, J.; Bartram, J.; Clasen, T.; Cumming, O.; Freeman, M.C.; Gordon, B.; Hunter, P.R.; Medlicott, K.; Johnston, R. Burden of disease from inadequate water, sanitation and hygiene for selected adverse health outcomes: An updated analysis with a focus on low-and middle-income countries. Int. J. Hyg. Environ. Health 2019, 222, 765–777. [Google Scholar] [CrossRef] [PubMed]
  6. WHO. Diarrhoeal Disease. 2017. Available online: https://www.who.int/en/news-room/fact-sheets/detail/diarrhoeal-disease (accessed on 3 April 2023).
  7. Clasen, T.F. Household water treatment and the millennium development goals: Keeping the focus on health. Environ. Sci. Technol. 2010, 44, 7357–7360. [Google Scholar] [CrossRef] [PubMed]
  8. Wright, J.; Gundry, S.; Conroy, R.M. Household drinking water in developing countries: A systematic review of microbiological contamination between source and point-of-use. Trop. Med. Int. Health 2004, 9, 106–117. [Google Scholar] [CrossRef] [Green Version]
  9. Masanyiwa, Z.S.; Zilihona, I.J.; Kilobe, B.M. Users’ perceptions on drinking water quality and household water treatment and storage in small towns in Northwestern Tanzania. Open J. Soc. Sci. 2019, 7, 28. [Google Scholar] [CrossRef] [Green Version]
  10. WHO. Combating Waterborne Disease at the Household Level; World Health Organization: Geneva, Switzerland, 2007; Available online: https://apps.who.int/iris/handle/10665/43621 (accessed on 10 April 2023).
  11. Mwabi, J.K.; Mamba, B.B.; Momba, M.N. Removal of Escherichia coli and faecal coliforms from surface water and groundwater by household water treatment devices/systems: A sustainable solution for improving water quality in rural communities of the Southern African development community region. Int. J. Environ. Res. Public Health 2012, 9, 139–170. [Google Scholar] [CrossRef]
  12. Xiao, R.; Duan, Y.; Chu, W. The effectiveness of household water treatment and safe storage in improving drinking water quality: A disinfection by-product (DBP) perspective. J. Water Supply Res. Technol.-Aqua 2020, 69, 785–806. [Google Scholar] [CrossRef]
  13. Global Water Treatment Systems Market Size, Trends & Growth Opportunity, by Installation, by Technology, by End-Use by Region and Forecast to 2028. 2022. Available online: https://www.reportsanddata.com/report-detail/point-of-use-water-treatment-systems-market (accessed on 1 March 2023).
  14. Rosa, G.; Huaylinos, M.L.; Gil, A.; Lanata, C.; Clasen, T. Assessing the consistency and microbiological effectiveness of household water treatment practices by urban and rural populations claiming to treat their water at home: A case study in Peru. PLoS ONE 2014, 9, e114997. [Google Scholar] [CrossRef] [Green Version]
  15. Alsulaili, A.; Al-Harbi, M.; Elsayed, K. The influence of household filter types on the quality of drinking water. Process Saf. Environ. Prot. 2020, 143, 204–211. [Google Scholar] [CrossRef]
  16. Stubbé, S.M.; Pelgrim-Adams, A.; Szántó, G.L.; Van Halem, D. Household water treatment and safe storage–effectiveness and economics. Drink. Water Eng. Sci. 2016, 9, 9–18. [Google Scholar] [CrossRef] [Green Version]
  17. Oswald, W.E.; Lescano, A.G.; Bern, C.; Calderon, M.M.; Cabrera, L.; Gilman, R.H. Fecal contamination of drinking water within peri-urban households, Lima, Peru. Am. J. Trop. Med. Hyg. 2007, 77, 699–704. [Google Scholar] [CrossRef] [Green Version]
  18. Massieux, B.; Boivin, M.E.; Van Den Ende, F.P.; Langenskiöld, J.; Marvan, P.; Barranguet, C.; Admiraal, W.; Laanbroek, H.J.; Zwart, G. Analysis of structural and physiological profiles to assess the effects of Cu on biofilm microbial communities. Appl. Environ. Microbiol. 2004, 70, 4512–4521. [Google Scholar] [CrossRef] [Green Version]
  19. Shrestha, K.B.; Thapa, B.R.; Aihara, Y.; Shrestha, S.; Bhattarai, A.P.; Bista, N.; Kazama, F.; Shindo, J. Hidden Cost of Drinking Water Treatment and Its Relation with Socioeconomic Status in Nepalese Urban Context. Water 2018, 10, 607. [Google Scholar] [CrossRef] [Green Version]
  20. Shrestha, S.; Haramoto, E.; Malla, R.; Nishida, K. Risk of diarrhoea from shallow groundwater contaminated with enteropathogens in the Kathmandu Valley, Nepal. J. Water Health 2015, 13, 259–269. [Google Scholar] [CrossRef]
  21. Japan International Cooperation Agency. Institutional Framework Assessment of KUKL: Final Report; JICA: Kathmandu, Nepal, 2016. Available online: https://www.jica.go.jp/nepal/english/office/others/c8h0vm0000bjww96-att/publications_04.pdf (accessed on 1 March 2023).
  22. Katuwal, H.; Bohara, A.K. Coping with poor water supplies: Empirical evidence from Kathmandu, Nepal. J. Water Health 2011, 9, 143–158. [Google Scholar] [CrossRef] [Green Version]
  23. Raina, A. Equity in Urban Water Service Delivery and the Role of Informal Water Vendors: The Case of Kathmandu Valley, Nepal; NUS Libraries: Singapore, 2016; Available online: https://scholarbank.nus.edu.sg/handle/10635/135477 (accessed on 2 March 2023).
  24. Molden, O.C.; Khanal, A.; Pradhan, N. The pain of water, a household perspective of water insecurity and inequity in the Kathmandu Valley. Water Policy 2018, 22, 130–145. [Google Scholar] [CrossRef]
  25. Pattanayak, S.K.; Yang, J.C.; Whittington, D.; Balkumar, K.C. Coping with unreliable public water supplies: Averting expenditures by households in Kathmandu, Nepal. Water Resour. Res. 2005, 41, W02012. [Google Scholar] [CrossRef] [Green Version]
  26. Shrestha, S.; Aihara, Y.; Kondo, N.; Rajbhandari, S.; Bhattarai, A.P.; Bista, N.; Kazama, F.; Nishida, K.; Timilsina, H.P.; Shindo, J. Household Water Use in the Kathmandu Valley: A Dry Season Survey; Interdisciplinary Center for River Basin Environment (ICRE): Kofu, Japan, 2016. [Google Scholar] [CrossRef]
  27. Shrestha, S.; Kobayashi, Y.; Ito, Y.; Yokomichi, H.; Nishida, K. Relationship between diarrhea risk and the combinations of drinking water sources in the Kathmandu Valley, Nepal. Int. Health 2022, 14, 195–200. [Google Scholar] [CrossRef]
  28. Malla, B.; Ghaju Shrestha, R.; Tandukar, S.; Bhandari, D.; Inoue, D.; Sei, K.; Tanaka, Y.; Sherchand, J.B.; Haramoto, E. Identification of Human and Animal Fecal Contamination in Drinking Water Sources in the Kathmandu Valley, Nepal, Using Host-Associated Bacteroidales Quantitative PCR Assays. Water 2018, 10, 1796. [Google Scholar] [CrossRef] [Green Version]
  29. Maharjan, S.; Joshi, T.P.; Shrestha, S.M. Poor quality of treated water in Kathmandu: Comparison with Nepal Drinking Water Quality Standards. Tribhuvan Univ. J. Microbiol. 2018, 5, 83–88. [Google Scholar] [CrossRef]
  30. Subedi, M.; Aryal, M. Public perception about drinking jar water and its bacteriological analysis. Nepal Med. Coll. J. 2010, 12, 110–114. Available online: https://europepmc.org/article/med/21222409 (accessed on 2 March 2023). [PubMed]
  31. Guragai, B.; Takizawa, S.; Hashimoto, T.; Oguma, K. Effects of inequality of supply hours on consumers’ coping strategies and perceptions of intermittent water supply in Kathmandu Valley, Nepal. Sci. Total Environ. 2017, 599, 431–441. [Google Scholar] [CrossRef] [PubMed]
  32. Government of Nepal. A Country Report Based on the Global Burden of Disease Study; Ministry of Health and Population: Kathmandu, Nepal, 2017. Available online: https://nhrc.gov.np/wp-content/uploads/2019/04/NBoD-2017_NHRC-MoHP.pdf (accessed on 1 March 2023).
  33. Lin, W.; Ye, C.; Guo, L.; Hu, D.; Yu, X. Analysis of microbial contamination of household water purifiers. Appl. Microbiol. Biotechnol. 2020, 104, 4533–4545. Available online: https://link.springer.com/article/10.1007%2Fs00253-020-10510-5 (accessed on 12 March 2023). [CrossRef] [PubMed]
  34. Rosa, G.; Kelly, P.; Clasen, T. Consistency of use and effectiveness of household water treatment practices among urban and rural populations claiming to treat their drinking water at home: A case study in Zambia. Am. J. Trop. Med. Hyg. 2016, 94, 445. [Google Scholar] [CrossRef]
  35. Koju, N.K.; Prasai, T.; Shrestha, S.M.; Raut, P. Drinking water quality of Kathmandu Valley. Nepal J. Sci. Technol. 2014, 15, 115–120. [Google Scholar] [CrossRef]
  36. Pant, P.R.; Dongo, D. Kathmandu Valley Profile; Governance and Infrastructure Development Challenges in Kathmandu Valley: Kathmandu, Nepal, 2009; Available online: https://silo.tips/download/kathmandu-valley-profile-briefing-paper (accessed on 1 March 2023).
  37. Chinnasamy, P.; Shrestha, S.R. Melamchi Water Supply Project: Potential to replenish Kathmandu’s groundwater status for dry season access. Water Policy 2019, 21, 29–49. [Google Scholar] [CrossRef]
  38. Adhikari, B.R.; Shrestha, S.D.; Shakya, N.M. Future urban water crisis in mountain regions: Example of Kathmandu Valley, Nepal. In Urban Drought: Emerging Water Challenges in Asia; Springer: Singapore, 2019; pp. 169–182. [Google Scholar] [CrossRef]
  39. Raina, A.; Zhao, J.; Wu, X.; Kunwar, L.; Whittington, D. The structure of water vending markets in Kathmandu, Nepal. Water Policy 2019, 21, 50–75. [Google Scholar] [CrossRef]
  40. Government of Nepal. Annual Report (15th Anniversary); Kathmandu Upatyaka Khanepani Limited: Kathmandu, Nepal, 2023; Available online: https://kathmanduwater.org/wp-content/uploads/2023/02/KUKL_Annual_Report_2079.pdf (accessed on 1 April 2023).
  41. Government of Nepal. National Population and Housing Census; Central Bureau of Statistics: Kathmandu, Nepal, 2011; Available online: https://unstats.un.org/unsd/demographic/sources/census/wphc/nepal/nepal-census-2011-vol1.pdf (accessed on 30 April 2023).
  42. Thapa, K.; Shrestha, S.M.; Rawal, D.S.; Pant, B.R. Quality of drinking water in Kathmandu valley, Nepal. Sustain. Water Resour. Manag. 2019, 5, 1995–2000. [Google Scholar] [CrossRef]
  43. Malla, B.; Ghaju Shrestha, R.; Tandukar, S.; Bhandari, D.; Thakali, O.; Sherchand, J.B.; Haramoto, E. Detection of pathogenic viruses, pathogen indicators, and fecal-source markers within tanker water and their sources in the Kathmandu Valley, Nepal. Pathogens 2019, 8, 81. [Google Scholar] [CrossRef] [Green Version]
  44. Government of Nepal. National Drinking Water Quality Standard 2023: Implementation Directive; Department of Water Supply and Sewerage: Kathmandu, Nepal, 2023. Available online: https://dwssm.gov.np/storage/listies/March2023/khanepani-mapdanda-kitab-final.pdf (accessed on 1 April 2023).
  45. R Core Team. R: A Language and Environment for Statistical Computing; R Foundation for Statistical Computing: Vienna, Austria, 2021; Available online: https://www.R-project.org/ (accessed on 22 April 2023).
  46. Gautam, B.; Gyanwali, G.; Ussery, D.W. Assessment of bacterial load in polyethylene terephthalate (PET) bottled water marketed in Kathmandu Valley, Nepal. Int. J. Polym. Sci. 2021, 2021, 6681249. [Google Scholar] [CrossRef]
  47. Emerman, S.H.; Prasai, T.; Anderson, R.B.; Palmer, M.A. Arsenic contamination of groundwater in the Kathmandu Valley, Nepal, as a consequence of rapid erosion. J. Nepal Geol. Soc. 2010, 40, 49–60. [Google Scholar] [CrossRef] [Green Version]
  48. Shakya, S.; Sherstha, P.K.; Pradhanana, A.R.; Shakya, R.K.; Shrestha, M.; Pant, D.R.; Yadav, P.K.; Ghimire, N.G.; Shakya, P. R Assessment of drinking water quality of Kathmandu municipality area in pre-monsoon season. Res. J. Recent Sci. 2019, 8, 54–62. Available online: http://www.isca.in/rjrs/archive/v8/i4/7.ISCA-RJRS-2019-029.php (accessed on 3 March 2023).
  49. Burlakoti, N.; Upadhyaya, J.; Ghimire, N.; Bajgai, T.R.; Chhetri, A.B.; Rawal, D.S.; Koirala, N.; Pant, B.R. Physical, chemical and microbiological characterization of processed drinking water in central Nepal: Current state study. J. Water Sanit. Hyg. Dev. 2020, 10, 157–165. [Google Scholar] [CrossRef]
  50. Gwachha, S.; Acharya, B.N.; Dhakal, A.; Shrestha, S.M.; Joshi, T.P. Assessment of Arsenic Content in Deep Groundwater of Kathmandu Valley, Nepal. Nepal J. Sci. Technol. 2020, 19, 69–77. [Google Scholar] [CrossRef]
  51. Wang, B.B. Research on drinking water purification technologies for household use by reducing total dissolved solids (TDS). PLoS ONE 2021, 16, e0257865. [Google Scholar] [CrossRef]
  52. Murindababisha, D.; Havugimana, V.; Mutezinka, H.; Nimukuze, D. Performance of Locally Produced Ceramic Pot Filters for Drinking Water Treatment in Rwanda. Int. J. Appl. Chem. 2018, 5, 10–14. [Google Scholar] [CrossRef]
  53. Pourjamali, R.; Sadrabad, E.K.; Hashemi, S.A.; Shekofteh, H.; Mokhtari, M.; Heydari, A.; Mohajeri, F.A. Evaluation of Point-of-Use Drinking Water Treatment Systems Efficiency in Reducing or Removing Physicochemical Parameters and Heavy Metals. J. Environ. Health Sustain. Dev. 2019, 4, 717–726. Available online: http://dorl.net/dor/20.1001.1.24766267.2019.4.1.8.6 (accessed on 2 March 2023). [CrossRef]
  54. Bae, M.; Watanabe, C.; Inaoka, T.; Sekiyama, M.; Sudo, N.; Bokul, M.H.; Ohtsuka, R. Arsenic in cooked rice in Bangladesh. Lancet 2002, 360, 1839–1840. [Google Scholar] [CrossRef]
  55. Tamene, A. A qualitative analysis of factors influencing household water treatment practices among consumers of self-supplied water in rural Ethiopia. Risk Manag. Healthc. Policy 2021, 14, 1129–1139. [Google Scholar] [CrossRef]
  56. Figueroa, M.E.; Kincaid, D.L. Social, Cultural and Behavioral Correlates of Household Water Treatment and Storage; Center Publication HCI 2010-1; Johns Hopkins Bloomberg School of Public Health, Center for Communication Programs: Baltimore, MD, USA, 2010; Available online: https://ccp.jhu.edu/wp-content/uploads/2014/11/Household-Water-Treatment-and-Storage-2010.pdf (accessed on 6 April 2023).
  57. Koyuncu, I.; Topacik, D.; Turan, M.; Celik, M.S.; Sarikaya, H.Z. Application of the membrane technology to control ammonia in surface water. Water Sci. Technol. 2001, 1, 117–124. [Google Scholar] [CrossRef]
  58. How To Remove Manganese from Water: Ultimate Guide. 2022. Available online: https://waterfilterguru.com/how-to-remove-manganese-from-water/ (accessed on 1 April 2023).
  59. Barbeau, B.; Carrière, A.; Bouchard, M.F. Spatial and temporal variations of manganese concentrations in drinking water. J. Environ. Sci. Health Part A 2011, 46, 608–616. [Google Scholar] [CrossRef] [PubMed]
  60. Boil Water Response—Information for the Public Health Professional. Department of Health: New York State. Available online: https://www.health.ny.gov/environmental/water/drinking/boilwater/response_information_public_health_professional.htm (accessed on 22 April 2023).
  61. Mahlangu, T.O.; Mamba, B.B.; Momba, M.N. A comparative assessment of chemical contaminant removal by three household water treatment filters. Water SA 2012, 38, 39–48. [Google Scholar] [CrossRef] [Green Version]
  62. Pratson, E.; Vengosh, A.; Dwyer, G.; Pratson, L.; Klein, E. The effectiveness of arsenic remediation from groundwater in a private home. Groundw. Monit. Remediat. 2010, 30, 87–93. [Google Scholar] [CrossRef]
  63. George, C.M.; Smith, A.H.; Kalman, D.A.; Steinmaus, C.M. Reverse osmosis filter use and high arsenic levels in private well water. Arch. Environ. Occup. Health 2006, 61, 171–175. [Google Scholar] [CrossRef]
  64. Walker, M.; Seiler, R.L.; Meinert, M. Effectiveness of household reverse-osmosis systems in a Western US region with high arsenic in groundwater. Sci. Total Environ. 2008, 389, 245–252. [Google Scholar] [CrossRef]
  65. Saturday, A.; Makokha, G.L.; Macharia, A. Performance of household water treatment methods for microbial removal under household conditions in Kabale district, Uganda. J. Environ. Health Sci. 2016, 2, 1–9. [Google Scholar] [CrossRef]
  66. Daniel, D. Factors Influencing the Household Water Treatment Adoption in Rural Areas in Developing Countries. Ph.D. Thesis, Delft University of Technology, Delft, The Netherlands, 2021; p. 6. [Google Scholar] [CrossRef]
  67. Psutka, R.; Peletz, R.; Michelo, S.; Kelly, P.; Clasen, T. Assessing the microbiological performance and potential cost of boiling drinking water in urban Zambia. Environ. Sci. Technol. 2011, 45, 6095–6101. [Google Scholar] [CrossRef] [Green Version]
  68. Al Moosa, M.E.; Khan, M.A.; Alalami, U.; Hussain, A. Microbiological quality of drinking water from water dispenser machines. Int. J. Environ. Sci. Dev. 2015, 6, 710. [Google Scholar] [CrossRef] [Green Version]
  69. Murphy, H.M.; McBean, E.A.; Farahbakhsh, K. A critical evaluation of two point-of-use water treatment technologies: Can they provide water that meets WHO drinking water guidelines? J. Water Health 2010, 8, 611–630. [Google Scholar] [CrossRef] [Green Version]
  70. Al-Haddad, A.; Al-Qallaf, H.; Rashid, T. Effectiveness of domestic water filters. Desalination Water Treat. 2015, 53, 649–657. [Google Scholar] [CrossRef]
  71. Fengyi, S.; Mingfang, L.; Zhang, F.; Peng, L.I.; Kai, L.O.U.; Xing, X. Performance of microbiological control by a point-of-use filter system for drinking water purification. J. Environ. Sci. 2009, 21, 1237–1246. [Google Scholar] [CrossRef]
  72. Malan, A.; Sharma, H.R. Assessment of drinking water quality and various household water treatment practices in rural areas of Northern India. Arab. J. Geosci. 2023, 16, 96. [Google Scholar] [CrossRef]
  73. Fahiminia, M.; Mosaferi, M.; Taadi, R.A.; Pourakbar, M. Evaluation of point-of-use drinking water treatment systems’ performance and problems. Desalin. Water Treat. 2014, 52, 1855–1864. [Google Scholar] [CrossRef]
  74. Labhasetwar, P.K.; Yadav, A. Membrane Based Point-of-Use Drinking Water Systems. IWA Publ. 2023, 35, 131–150. [Google Scholar] [CrossRef]
  75. What is TDS Controller/MTDS and Mineralizer? Which One to Choose? 2023. Available online: https://www.bestrowaterpurifier.in/blog/tds-controller/ (accessed on 7 April 2023).
Figure 1. Study area (Kathmandu Valley) and sampling points.
Water 15 02305 g001
Figure 2. Photos of different HWTS methods installed in households.
Water 15 02305 g002
Figure 3. Percentage of samples with various concentrations of (a) E. coli and (b) TC grouped by raw water sources.
Water 15 02305 g003
Figure 4. Water quality parameters in raw water and water treated by different HWTS methods: (a) pH, (b) ammonia nitrogen, (c) arsenic, (d) manganese, (e) E. coli, and (f) total coliforms.
Water 15 02305 g004
Figure 5. Concentration distribution of E. coli in (a) raw and (b) treated water.
Water 15 02305 g005
Figure 6. Concentration distribution of TC in (a) raw and (b) treated water.
Water 15 02305 g006
Figure 7. Rates of noncompliance with NDWQS for the raw and treated water.
Water 15 02305 g007
Figure 8. Detection rate of microbial contamination, contribution of each HWTS method to microbial contamination, and factors influencing microbial contamination for (a) E. coli and (b) TC.
Water 15 02305 g008
Table 1. Numbers of households, water sources, and HWTS methods.
DistrictWater SourcesHWTSTotal
Piped
Water
Jarred
Water
GroundwaterTanker
Water
BoilingCCFEDCMRO-UV
Kathmandu278203140293358
Lalitpur410458313823
Bhaktapur677080021020
Total372531830331451101
Table 2. Physicochemical water quality of raw water from different sources (mean ± SD).
ParameterDescriptionPiped Water
(n = 37)
Groundwater
(n = 31)
Jarred Water
(n = 25)
Tanker Water
(n = 8)
NDWQS
Temperature
(°C)
Mean ± SD25.7 ± 1.125.6 ± 0.925.4 ± 1.025.0 ± 0.8NA
Range24.2 to 28.823.6 to 28.323.2 to 27.223.8 to 26.1
pH *Mean ± SD7.38 ± 0.337.14 ± 0.366.77 ± 0.757.89 ± 0.466.50–8.50
Range6.82 to 7.956.5 to 8.115.88 to 8.547.00 to 8.29
TDS
(mg/L)
Mean ± SD130.1 ± 93.3269.1 ± 89.116.0 ± 11.4172.3 ± 8.81000
Range19.5 to 322.0115.0 to 481.06.0 to 51.2158.0 to 183.0
Ammonia
Nitrogen *
(mg/L)
Mean ± SD0.54 ± 0.881.43 ± 5.410.56 ± 0.811.00 ± 1.551.50
RangeLDL ** to 3.00LDL to 26.00LDL to 3.00LDL to 3.00
Arsenic
(mg/L)
Mean ± SD0.022 ± 0.0140.043 ± 0.0440.019 ± 0.010.041 ± 0.0480.050
RangeLDL to 0.061LDL to UDL **LDL to 0.039LDL to 0.126
Manganese
(mg/L)
Mean ± SD0.26 ± 0.320.46 ± 0.470.24 ± 0.230.38 ± 0.430.20
RangeLDL to 1.41LDL to 1.60LDL to 1.0LDL to 1.21
Notes: * Only 69 samples were taken for pH and ammonia nitrogen analysis (24 piped, 23 groundwater, 16 jarred, and 6 tanker). ** LDL (lower detection limit) and UDL (upper detection limit) are listed in Table A1.
Table 3. Number (percentage) of raw water samples exceeding NDWQS value.
ParameterPiped Water
(n = 37)
Groundwater
(n = 31)
Jarred Water
(n = 25)
Tanker Water
(n = 8)
Total
(n = 101)
TDS0 (0.0)0 (0.0)0 (0.0)0 (0.0)0 (0.0)
pH0 (0.0)0 (0.0)9 (56.2)0 (0.0)9 (13.0)
Ammonia nitrogen4 (16.7)3 (13.0)1 (6.2)2 (33.3)10 (14.5)
Arsenic2 (5.4)10 (32.2)0 (0.0)2 (25.0)14 (13.8)
Manganese12 (32.4)17 (54.8)10 (40.0)4 (50.0)43 (42.5)
Table 4. E. coli and TC in raw water from different sources.
Raw WaterNo. of SamplesE. coli (CFU/100 mL)TC (CFU/100 mL)
Mean *MinMaxPositive **Mean *MinMaxPositive **
Piped water3770TMTC ***72.9%1356TMTC100.0%
Groundwater31110TMTC67.7%1630TMTC96.7%
Jarred water25105332.0%1500TMTC96.0%
Tanker water820022887.5%17987TMTC100.0%
Total101 64.3% 98.1%
Notes: * Geometric mean. ** Positive at ≥1 CFU/100 mL. *** TMTC, too many to count (>300 CFU/100 mL).
Table 5. Selection of HWTS methods for different water sources.
Raw WaterNumber of
Households
HWTS Methods, n (%)
BoilingCCFEDCMRO-UV
Piped water3710 (27.1)0 (0.0)0 (0.0)8 (21.6)19 (51.3)
Groundwater311 (3.2)0 (0.0)0 (0.0)2 (6.4)28 (90.4)
Jarred water2517 (68.0)3 (12.0)3 (12.0)2 (8.0)0 (0.0)
Tanker water82 (25.0)0 (0.0)0 (0.0)2 (25.0)4 (50.0)
Total10130331451
Table 6. TC removal by the different HWTS methods.
HWTS MethodsNet Samples Detected with TCSamples with Reduced TCMean TC Raw *Mean TC Treated *LRVPercentage of Samples > 2 LRVOverall TC Contamination in Treated Water
(%)
Boiling292719221.851.856.6
CCF3210021.633.366.6
ED3324851.633.366.6
CM141122561.536.371.4
RO UV5043201111.225.576.5
Note: * CFU/100 mL.
Disclaimer/Publisher’s Note: The statements, opinions and data contained in all publications are solely those of the individual author(s) and contributor(s) and not of MDPI and/or the editor(s). MDPI and/or the editor(s) disclaim responsibility for any injury to people or property resulting from any ideas, methods, instructions or products referred to in the content.

