Article

Comparison of Hydraulic Travel Time and Attenuation Inversions, Thermal Tracer Tomography and Geostatistical Inversion for Aquifer Characterization: A Numerical Study

1
School of Earth Science and Engineering, Hohai University, Fo Cheng Xi Road 8, Nanjing 211100, China
2
Geoscience Center, University of Göttingen, 37077 Göttingen, Germany
3
Nanjing Institute of Environmental Sciences, Ministry of Ecology and Environment of China, Nanjing 210042, China
4
Department of Geological Engineering, Kwame Nkrumah University of Science and Technology, Kumasi AK-039-5028, Ghana
*
Author to whom correspondence should be addressed.
Water 2023, 15(13), 2401; https://doi.org/10.3390/w15132401
Submission received: 17 May 2023 / Revised: 16 June 2023 / Accepted: 25 June 2023 / Published: 29 June 2023

Abstract

:
For the characterization of heterogeneous aquifers, transient hydraulic tomography (THT) was proposed as a promising method to obtain the distribution of hydraulic parameters with satisfying spatial resolution using different approaches. These include hydraulic travel time, attenuation inversions, thermal tracer tomography, and geostatistical inversion with successive linear estimator (SLE). For the same hydrogeological test, different inversion methods tend to use different sub-data sets to obtain different hydraulic parameters. Up to now, however, few studies have focused on revealing the respective characteristics of these inversion methods and attempted to improve the accuracy of aquifer characterization by bridging the shortcomings of the inversion methods. The main objective of this study was to evaluate the utility of multiple inversion techniques on aquifer heterogeneity characterization. A series of warm water injection tests were first simulated in a fluvial aquifer analogue outcrop. The calculated head and temperature datasets from these tests were fully utilized to reveal the aquifer heterogeneity by using all of the four above-mentioned inversion methods. The results show that the thermal tracer tomography, hydraulic travel time, and attenuation tomography characterized the high permeability zones more accurately within the well area, whereas the geological statistical method tended to depict the overall distribution of K values for a larger area. By comparison analysis and combinations of the individual inversion results, the scientific and economic complementarity can be studied and some valuable advice for the choice of different inversion methods can be recommended for future practices.

1. Introduction

The reasonable management of groundwater resources requires accurate aquifer characterization with spatial variation of hydraulic properties, such as hydraulic conductivity ( K ) and specific storage ( S s ), which are two key parameters for predicting groundwater behavior. In the past few decades, numerous efforts have been dedicated to estimate the spatial distribution of K and S s . A traditional method is to make geostatistical interpretation of small-scale K or S s estimations which are obtained from core samples, single-hole pumping/injection tests, etc. [1,2]. However, the traditional method sometimes yields biased drawdown data on model validation, especially when the heterogeneity of the hydraulic properties is severe [3,4,5]. Geophysical tomography methods such as radar tomography [6] and electrical resistivity tomography [7] can obtain the heterogeneous distribution of the subsurface; however, the obtained geophysical parameters do not have direct relationships to the hydraulic parameters of the aquifer [8].
Hydraulic tomography (HT) is a promising method to relieve this problem. Over the past few decades, HT has been demonstrated as having advantage through numerical [9,10,11,12], laboratory [13,14,15,16,17,18,19,20], and field [21,22,23,24,25,26] studies. In an HT experiment, the hydraulic tests such as pumping/injection tests or other hydrogeological tests [13,27,28] are implemented sequentially at different locations, and the corresponding response data are recorded simultaneously at multiple locations. The response data capture the heterogeneous information of the aquifer through the tomographic tests. Over the last two decades, many methods have been proposed to interpret the data collected by HT as hydraulic properties of heterogeneous aquifers.
Geostatistical inversion (GI) is one of the common approaches of HT. Kitanidis (1995) [29] while Yeh and Liu, (2000) [11] proposed the algorithm of geostatistical inversion on the preliminary stage. The approach conceptualizes hydraulic parameter fields as spatial stochastic processes and seeks their mean distributions, conditioned on the information from multiple cross-hole hydrogeological tests. Successive linear estimator (SLE) is one approach of GI to estimate the spatial distribution of K and S s . SLE involves the concept of classical cokriging using the sampled parameters and observed heads to estimate the parameter fields. With the estimated parameter fields, the corresponding simulated head field can be obtained by governing the flow equation, boundary, and initial conditions. Additionally, SLE improves the estimated parameter fields by the differences between the observed and simulated heads in an iterative manner in considering the nonlinear relationship between heads and parameters, while making sure that the simulated heads are consistent with the observed heads. According to the order of data use, SLE has been extended to the sequential successive linear estimator (SSLE) and the simultaneous successive linear estimator (SimSLE) [30]. SSLE uses the data sets from the HT survey sequentially; therefore, the order of data included may affect the final estimates. SimSLE uses all the data simultaneously to overcome the influence of the data using order, but one bad data set may affect the estimate quality. Note that when the data set is error-free, SSLE and SimSLE yield the same results. In terms of computational costs, Qiu et al. (2023) [31] mentioned that travel time inversion has an obvious advantage over geostatistical inversion; the travel time inversion converges within several seconds while the geostatistical inversion requires several hours for the same data with the same PC.
Hydraulic travel time inversion is another approach of HT, which is based on the eikonal equation transformed from the groundwater flow equation [13,27,32]. Hydraulic travel time inversion has been used successfully in several studies [23,33,34,35,36]. This approach follows the procedure of seismic tomography to reconstruct spatial variation of hydraulic diffusivity with the ratio of K and S s of the aquifers. Based on the ray tracing technique and the solver of the eikonal equation, hydraulic travel time inversion has the advantage of low computation cost and fast data acquisition. It can be used on field scale HT investigation within a few seconds through a personal computer and the head data required for the inversion can be obtained within minutes, sometimes even seconds, since the inversion only depends on the first arrival of the pressure head responses instead of the whole draw down curve. However, the split of K and S s from diffusivity is a problem for the hydraulic travel time inversion. To solve this problem, based on a similar travel time strategy, Brauchler et al. (2013) [23] proposed attenuation inversion for estimating the spatial variation of S s . With the obtained D from travel time inversion and S s from attenuation inversion, K can be calculated indirectly based on the relationship of K = D × S s .
The above-mentioned HT approaches are based on the inverse calculation of accurate and precise hydraulic pressure heads. It is known that the satisfying pressure head data for inversions, especially in the field, is often hard to obtain due to environmental disturbance and equipment limitations. Compared to pressure, temperature data is a much friendlier parameter that can be obtained with less data noise and observational efforts. Moreover, temperature data has been used to detect the hydraulic connection on the tracer test for a long time [37,38,39]. With the technological advances in temperature monitoring, using heat as a tracer to reveal the hydraulic properties of aquifers, this is attracting more and more attention. Particularly, cross-well thermal tracer tomography, that combines multilevel heat injection tests with imaging methods, has been proposed to investigate aquifer heterogeneity over recent years [40,41,42,43,44]. It has also been used to estimate K profiles in alluvial sediments [45]. Liu et al. (2022) [46] utilized thermal tracer tomography to characterize hydraulic properties in a fractured aquifer. It is worth mentioning that although the temperature signals are easier to obtain, the measurement of the corresponding thermal responses is much more time-consuming than that in hydraulic tests, due to the slow heat transport process. In addition to this, with travel time-based thermal tracer tomography, K is the only parameter that can be achieved, as it is assumed to be the only sensitive parameter to the measured thermal responses. Other parameters are assumed to be known and homogeneous.
All of the above introduced tomography methods are able to reveal the heterogeneous distribution of the key parameters of the aquifer with satisfying resolution. They have different data requirements and time costs for their inversions with different aims of certain parameters. However, one thing in common is that they are based on a certain kind of inversion algorithm, which always faces the problem of non-uniqueness and uncertainty issues. Additionally, most existing studies focus on one certain method with its required specific series of tests, and multiple uses of inversions for a single kind of test series being rare in practice.
In terms of the cost, HT investigation is more expensive than analysis on small scale data [47]. The drilling and instrumentation for data acquisition are important parts of the cost of HT. Considering the complex and unknown field conditions, the arbitrary installation of boreholes is scarce. Hence, it is important to utilize the existing borehole as far as possible to obtain a good estimation of the hydraulic parameters.
The main objective of this study was to evaluate the utility of using multiple techniques on aquifer heterogeneity characterization based on a series of warm water injection tests, simulated in a fluvial aquifer analogue outcrop through numerical modeling. Hydraulic travel time and attenuation inversion, travel time-based heat tomography, as well as geostatistical inversion (SimSLE) were utilized for the same tests to take full advantage of the obtained pressure and temperature data. With the comparisons and combinations of each individual inversion method, the scientific and economic complementarity can be studied while the problem of non-uniqueness and uncertainty can be reduced.

2. Inverse Approach

In this study, four inversions, i.e., hydraulic travel time inversion and head attenuation inversion, travel time-based thermal tracer tomography, and geostatistical inversion were utilized to estimate the hydraulic heterogeneity of a synthetic aquifer.

2.1. Hydraulic Travel Time Inversion and Attenuation Inversion

Similar to the seismic travel time inversion, hydraulic travel time inversion is a computationally efficient inversion method for hydraulic diffusivity estimates. It is based on solving a travel time integral, which relates the travel time of a transient head signal at the observation location to the D -distribution of aquifers when disturbed by a Dirac source [27]:
t α , d = 1 6 f α , d x 1 x 2 d s D s
where t α , d is the hydraulic travel time (arrival time) propagating from a source x 1 to the receiver x 2 , D is the diffusivity as a function of arc-length along the propagation path (s), f α , d   = t p e a k / t α , d is the related transformation factor, t p e a k is the travel time of the peak of a Dirac signal from point x 1 (source) to observation point x 2 (receiver) along the arc-length (s), and t α , d is the respective travel time diagnostic. The subscript d stands for a Dirac source. The derivation of the transformation factor is described in detail by Brauchler et al. (2003) [13].
With respect to the specific storage, a hydraulic attenuation inversion is employed which was proposed by Brauchler et al. (2011) [33]. Similar to the hydraulic travel time inversion method, the attenuation of a head signal originating from a Dirac source is related to the S s distribution which can be expressed as follows:
h x 2 H 0 1 3 = π r c 2 2 π 3 3 exp 3 2 1 3 x 1 x 2 1 S s s 1 3 d s
Here, the attenuation of the head signal is expressed by the initial displacement H 0 and the hydraulic head h x 2 at the observation interval. S S is the specific storage as a function of arc-length along the propagation path (s), and r c is the casing radius.
Due to the similarity with seismic travel time inversion, the above inversion problem can be solved by using the open-source library pyGIMLI developed for inversion in geophysics [48].

2.2. Travel Time-Based Thermal Tracer Tomography

With advances in the technique of temperature measurements, such as the distributed temperature sensing (DTS) system, using heat as a tracer to reveal aquifer parameters in high resolution has become more popular and attractive. The thermal tracer tomography method was proposed based on the travel time inversion method [43]. Like the hydraulic travel time inversion method, thermal travel time ( t t t ) is defined as the propagation time of a thermal tracer front along the path (s) from the injection source x 1 to a receiver x 2 , which is expressed as follows:
t t t = x 1 x 2 ϕ R K s i s d s
where ϕ is the porosity of the aquifer, and i is the hydraulic gradient between the source and receiver ports. R is the thermal retardation factor, with the heat capacity of aquifer matrix ( C m ) and the heat capacity of water ( C w ), which can be defined as below:
R = C m ϕ C w
In Equation (3), compared to the K , the other three parameters, i.e., ϕ , R , and i , generally vary in much smaller ranges. Thus, these three parameters can be approximated by constant values during the K -inversion procedure. The set values for ϕ , R , and i are presented in Table 1.
The above inversion problem can also be solved by using the open-source pyGIMLI package, and for more details on this inversion framework please refer to the paper of Liu et al. (2022) [46].

2.3. Geostatistical Inversion

All geostatistical inversion results were conducted using the simultaneous successive linear estimator (SimSLE) [30]. SimSLE characterizes the heterogeneous K and S s fields of aquifers based on the provided hydraulic heads. This inversion approach provides an efficient way to include all data points from multiple pumping tests simultaneously for estimating the hydraulic parameter.
SimSLE assumes a transient groundwater flow field, and the natural logarithm of K and S s are both treated as multi-Gaussian, second-order stationary, stochastic processes. With given unconditional means, variances, and correlation lengths of K and S s , SimSLE starts with the cokriging of all observation data and the initial K and S s values, to create the first estimate of heterogeneous ln K and ln S s maps. The hydraulic parameter fields are then updated using the successive linear estimator (SLE) [49] built in SimSLE by comparing the differences between the simulated and observed hydraulic heads at observation points, in which, the covariances of hydraulic parameters and the cross-covariances between the head measurements and estimated parameters are evaluated and updated as the inversion progresses.
The iteration stops if: (1) the spatial variance of the estimated parameters stabilizes; (2) the differences between simulated and observed heads are closer than the prescribed tolerance; (3) iteration steps reach a user-defined maximum value.
An attractive characteristic of geostatistical inversion is that it can involve geological information as the prior information. Considering the prior information provided for simSLE, two cases were investigated. First, homogeneous initial K and S s fields were used for the model calibration as for the case without other geological information. Second, initial K and S s fields used for simSLE were treated to be heterogeneous and were obtained from another inversion approach, including hydraulic travel time inversion, attenuation inversion, and travel time-based thermal tracer inversion.
In this study, VSAFT2 provided the function of parameter estimation through the SimSLE algorithm, which can be obtained from “http://tian.hwr.arizona.edu/downloads (accessed on 17 May 2023)”.

3. Numerical Modeling

3.1. Aquifer Analogue Data

This case study is based on an aquifer analogue outcrop which was digitized from an unconsolidated fluvial sediment close by Herten village in southwest Germany. This analogue was performed by observing texture, analyzing sediment grain size, and integrating ground penetrating radar surveys during the aquifer excavation [50]. It can provide a high-resolution characterization of the aquifer heterogeneity and accordingly has been intensively utilized in many hydrogeological modeling studies [31,51]. As Figure 1 shows, this analogue is highly heterogeneous. The K values vary in a range from 5 × 10⁻⁵ to 5 × 10⁻³ m/s, and the S s changes from 1 × 10⁻⁶ to 1 × 10⁻⁴ m−1. A high- K layer embeds in the middle in which the K value is several orders greater than that of the other layers. Correspondingly, the S s value of the middle layer is relatively low. The size of the Herten analogue slice is 16 m × 7 m, with a resolution of 5 cm × 5 cm.
Criteria for the placing of injection points and observation points were considered according to the applications in the real field with comparable area and thickness of the aquifer. The number of injection and observation points were both limited to six in this work to simulate the situation in the common field tests with a limited amount of wells. In addition, due to the duration of the thermal tracer tests in the real field it was necessary to limit the amount of tests and wells to control the total duration and costs of the repeating tests. According to the experience of using a double-packer system and multi-chamber well construction [23], it was realistic to set six injection intervals in the injection well with the double-packer system and observe the response in the multi-chamber well with six individual chambers (each of the chamber has one opening screen at different depths). Additionally, the actual number of injection points needs to be taken into account with the actual engineering situation, time limit and budge.
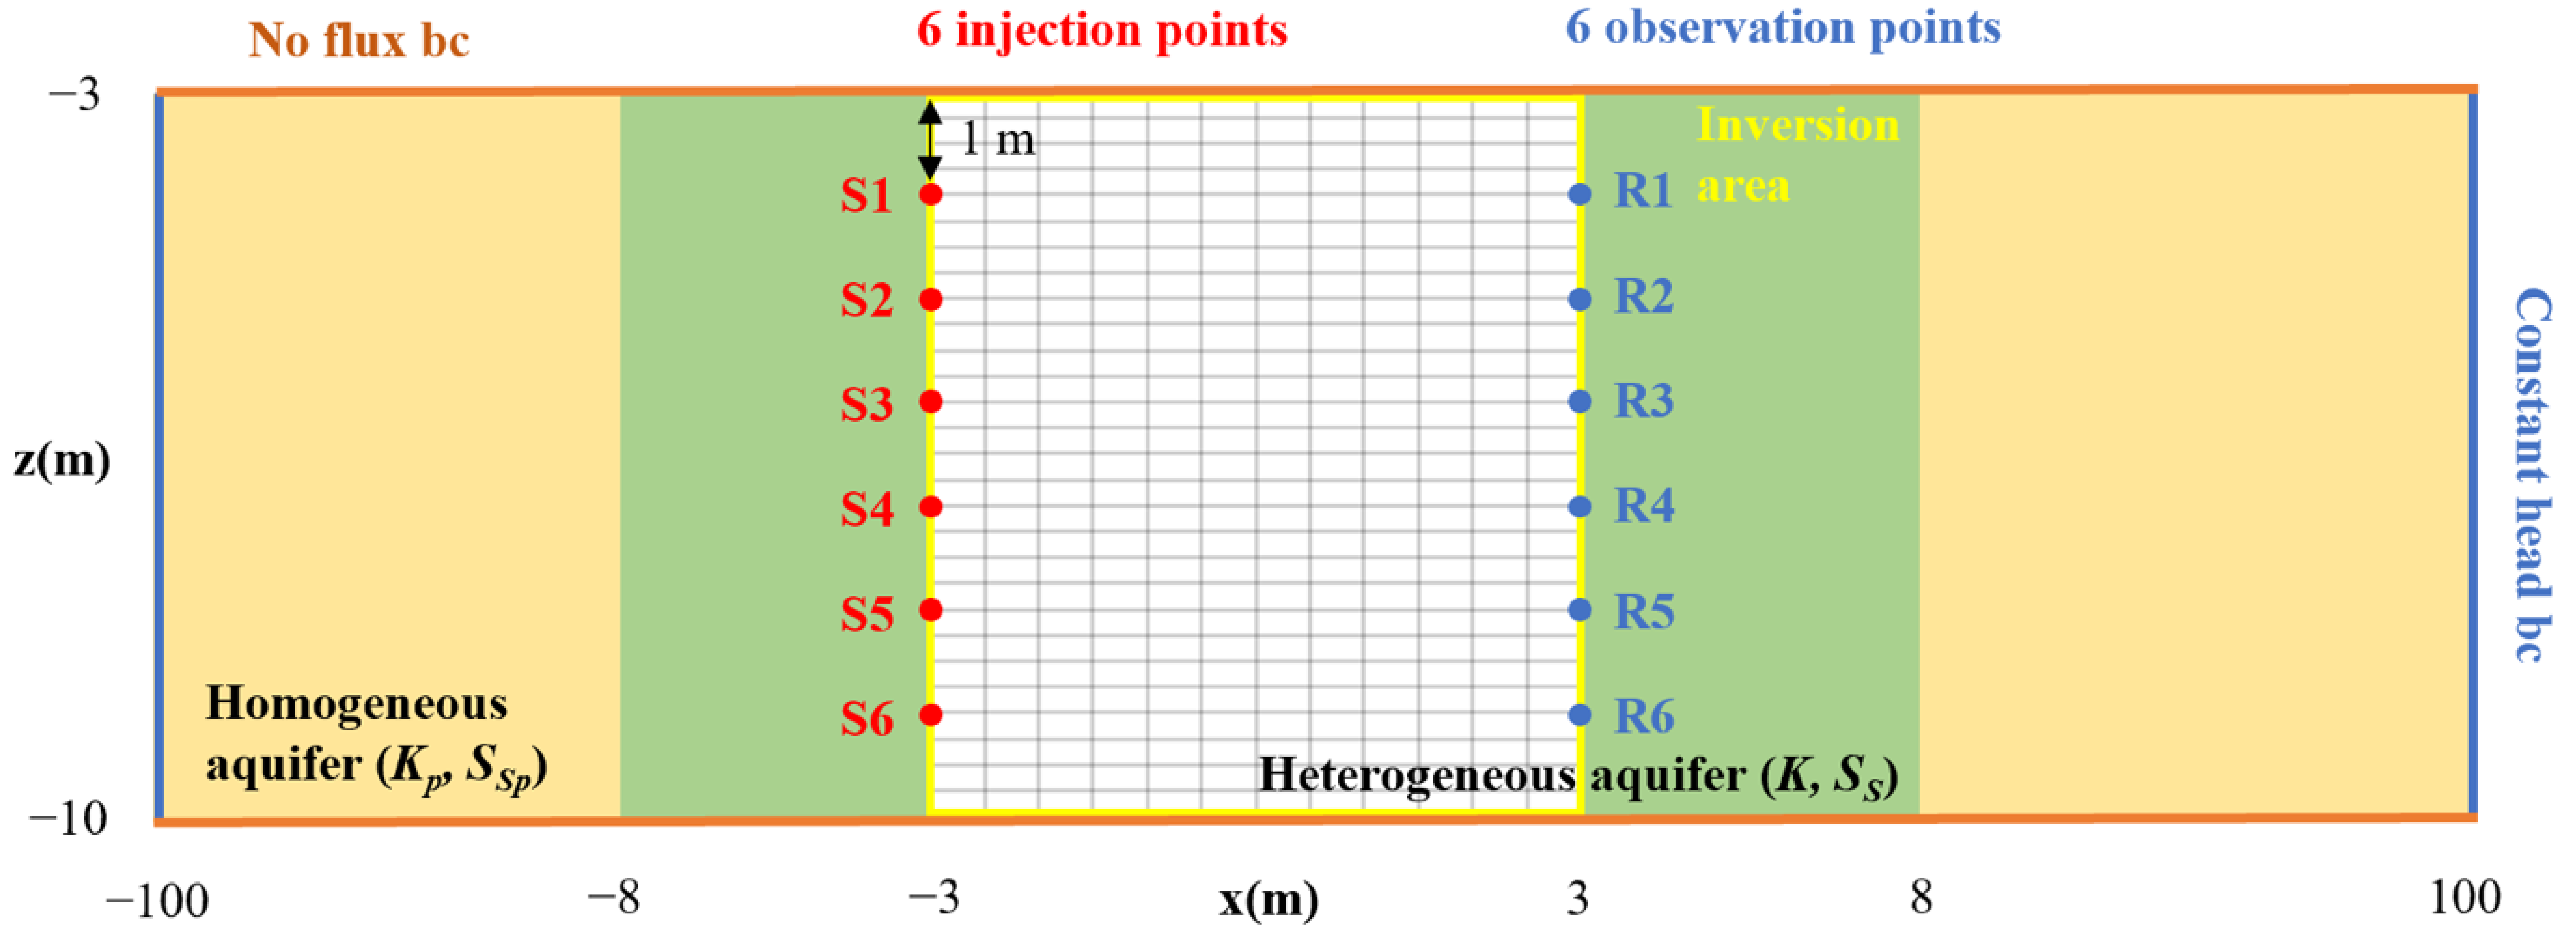
In this experiment, one water injection well and one observation well were set up, and six data collection points at intervals of 1 m were set for each well, as shown by the 12 white dots in Figure 1.

3.2. Modelling Setup

A series of cross-well multilevel heat injection tests was performed on the synthetic Herten aquifer. First, two groundwater wells with a distance of 6 m were installed in the center. Six screen sections were considered in each well for warm water injection or for pressure and temperature observations. The interval between the neighboring screens was 1 m. For the hydraulic process, the injection rate Q was set to 5 L/s, and the initial head H i n i t i a l of the confined aquifer was 0.2 m which was also fixed at the side boundaries. For the thermal process, the temperature of the injected water T a m i b e n t was constant at 30 °C, and the ambient temperature T i n j e c t i o n set to 20 °C. The temperature difference between the warm water and ambient was within 10 °C, thus the buoyancy effects of the groundwater flow can be neglected [52]. To eliminate the boundary effect, the analogue was nested in a homogeneous aquifer with a width of 200 m. The hydraulic parameters of this homogeneous aquifer were assigned by the mean value of the those in the Herten analogue, i.e., the K and S S were 2.1 × 10⁻³ m/s and 6.6 × 10⁻⁵ m−1, respectively. All parameters employed in this study are listed in Table 1. The simulation of hydrothermal processes was implemented by the COMSOL® software version 5.6, which highlights in solving multi-physics problems [53].

3.3. Simulated Tests and Data Utilized

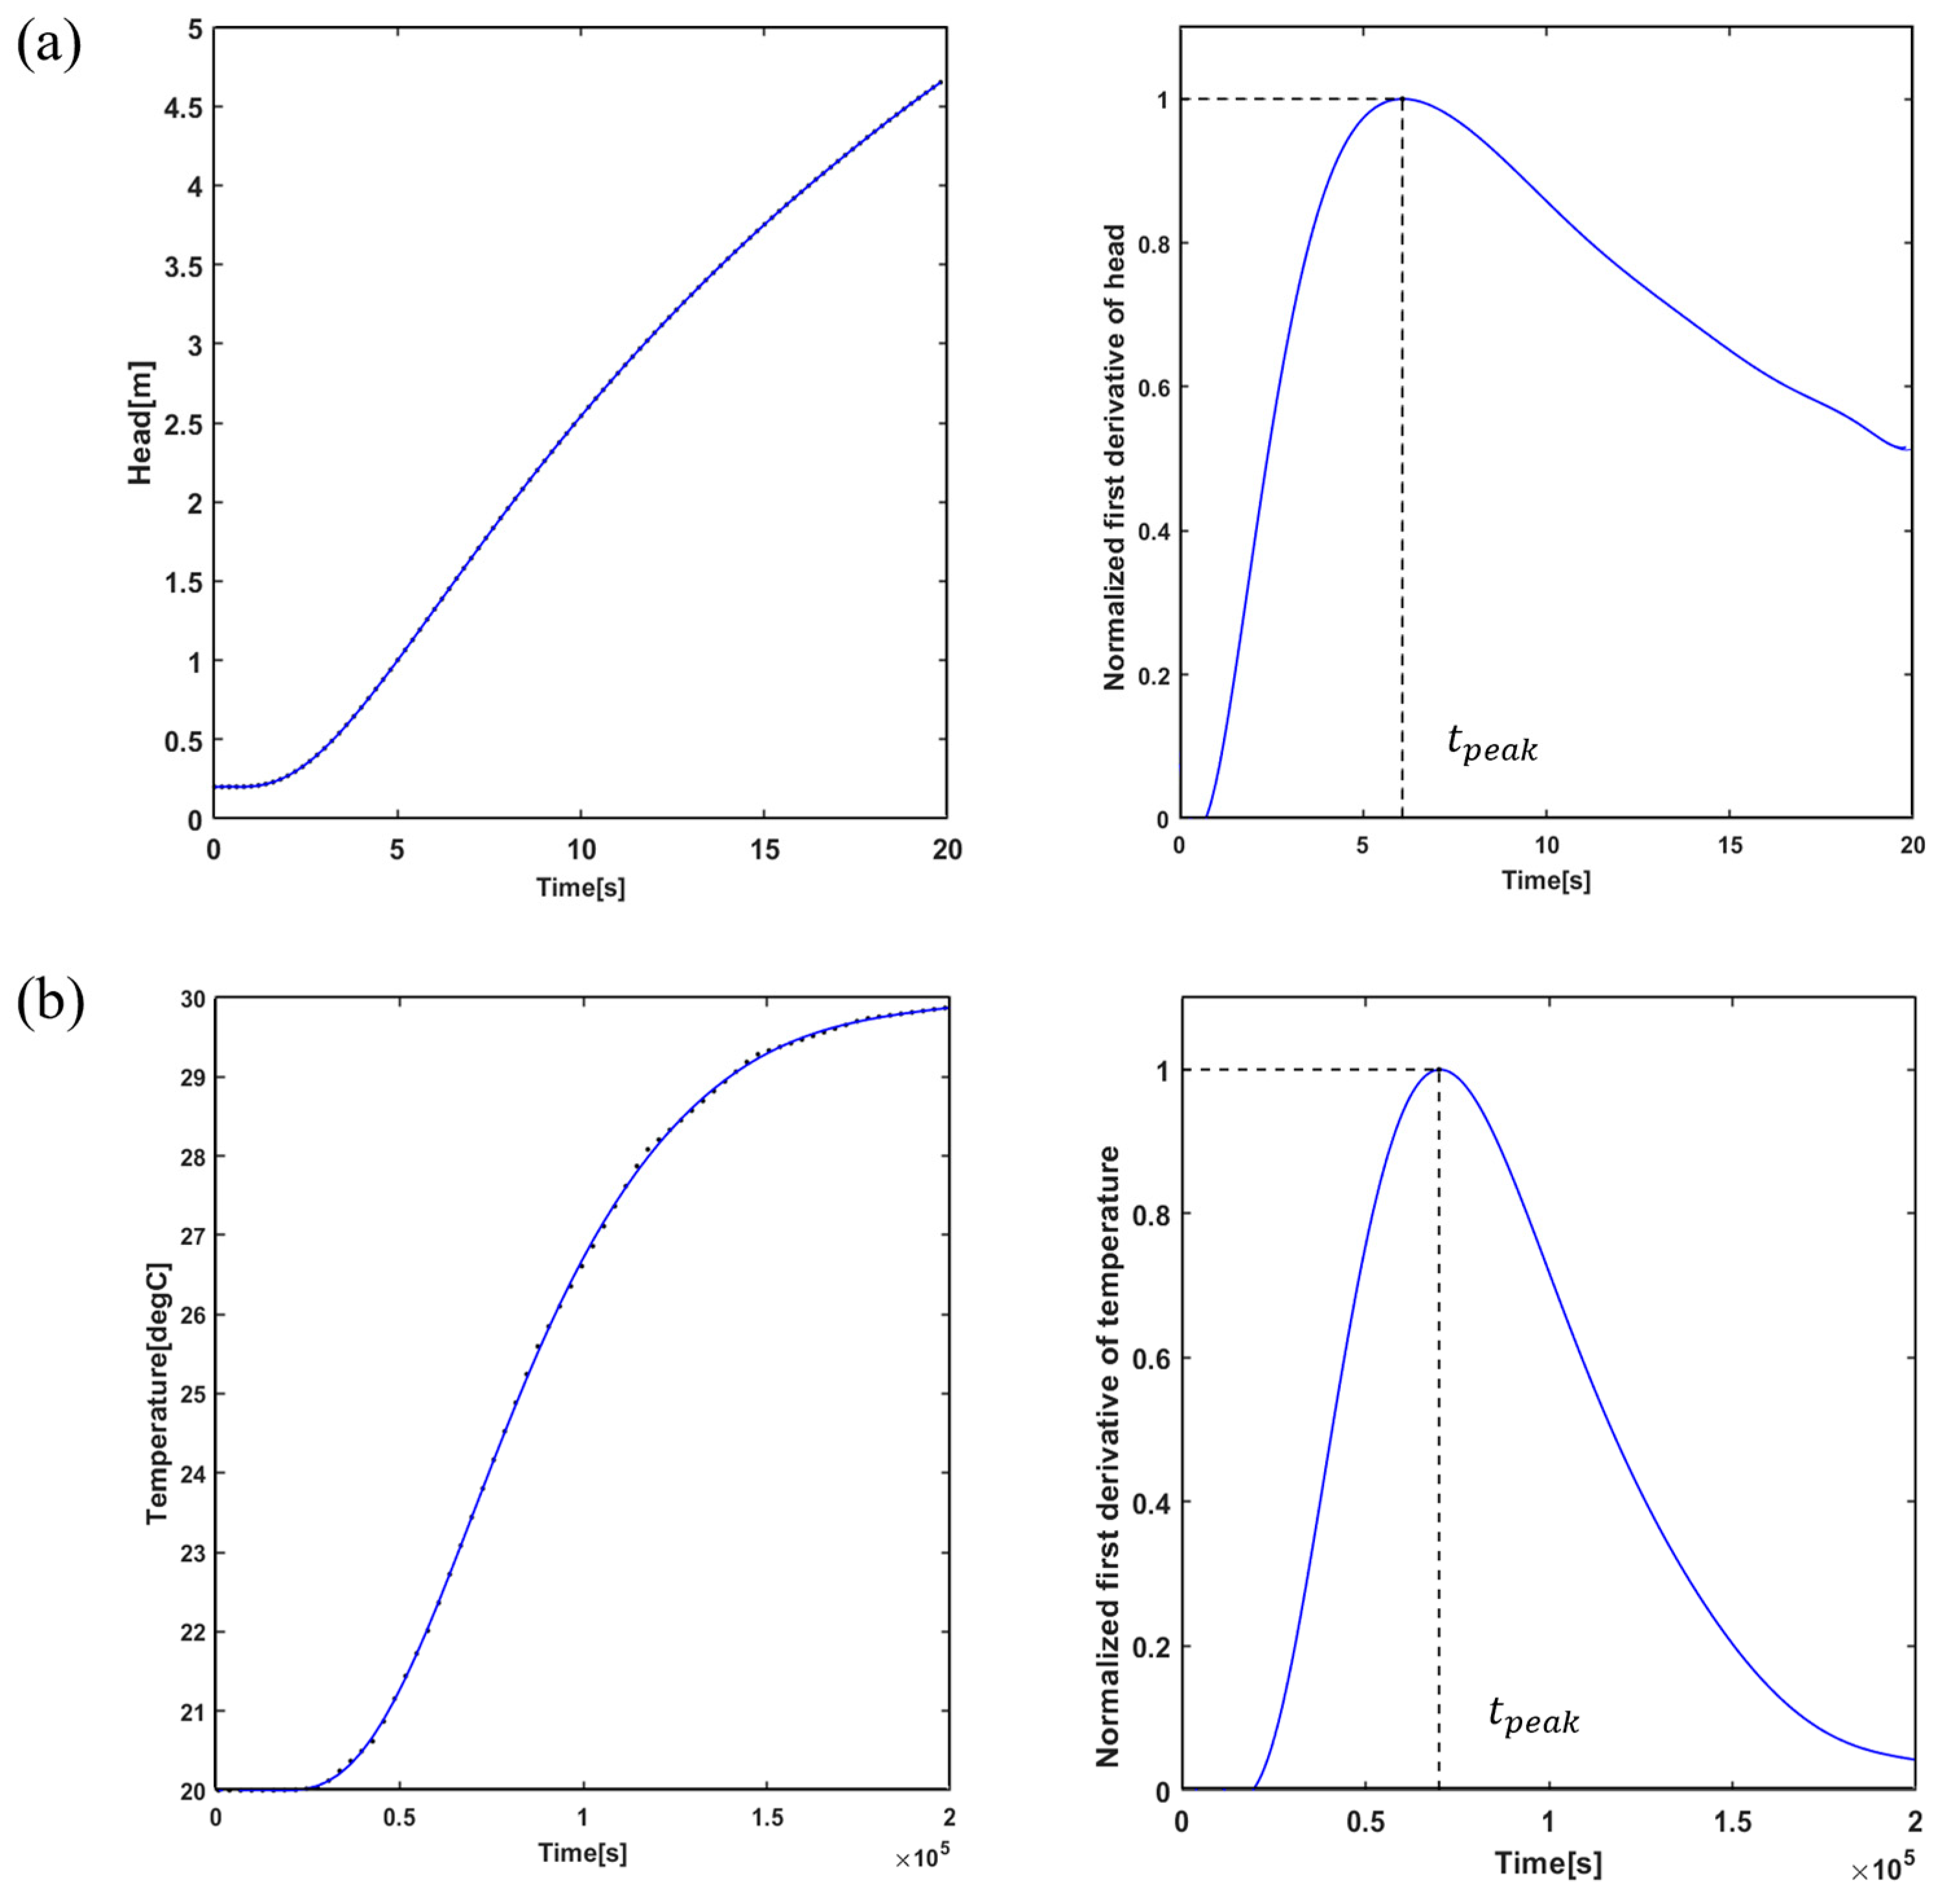
A total of six injection tests were simulated in this study, and the transient head data including that at the recovery stage were collected. For these synthetic experiments, a tomographic configuration of test-observation positions was adopted, that is, the head and temperature changes were collected only at the test interval and six observation ports. The same test configuration was also maintained in geostatistical inversion to ensure that the same amount of data was used as in the other inversion methods. In this work, the duration of one test was about 300 min and the travel time of thermal signal propagation that was utilized for the inversion was about 300 min in each test, while the hydraulic travel time was only about 10 min for the same case.
Hydraulic travel time inversion utilized the early-time head data collected at observation ports, whereas the attenuation inversion utilized the 1st derivative of the head curve collected at the observation port. Hydraulic travel times ( t p e a k ) can be determined from the first derivative of the early-time head curves. As shown in Figure 2 and Figure 3, taking the pressure head collected at R4 when injecting at S1 as an example, the collected head is first fitted by the polynomial function and its first-order derivative derived. The t p e a k is then recognized as the corresponding time of the peak, which is about 6.07 s in this case. A total of 36 travel times were obtained through six injection tests. The maxima ( h m a x ) of the first-order derivative curve in the observation ports can be utilized in the attenuation inversion, in which the head attenuation is calculated as the ratio of the h m a x and steady state head collected at the corresponding injection port with a modification factor of 0.0813 [23]. Similarly, in the travel time-based thermal tracer tomography, the thermal travel time is calculated in a similar way. The only difference is that the thermal t p e a k needs to be corrected using the early-time diagnosis method [43] to remove the thermal conduction effects.
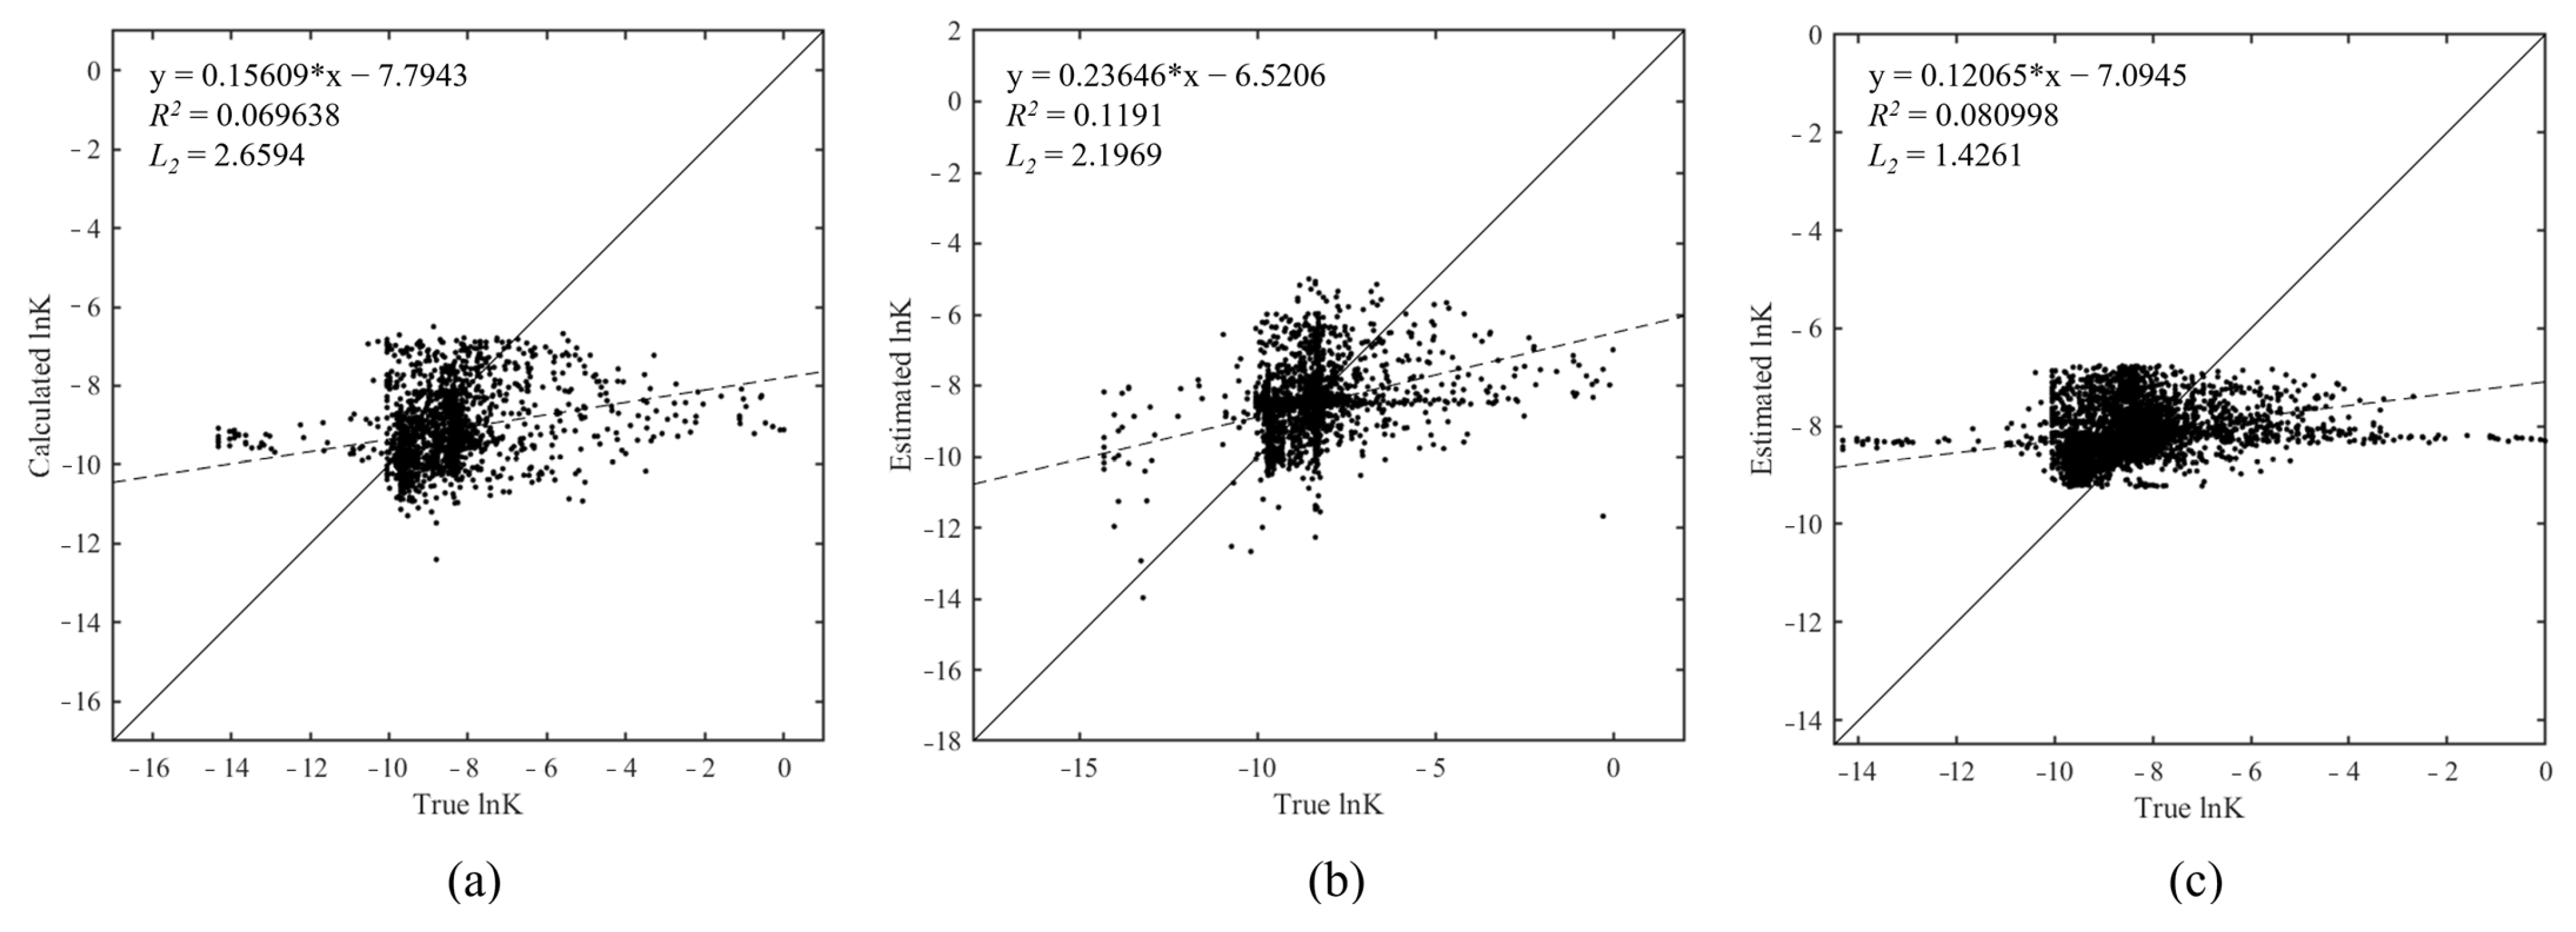
The coefficient of determination ( R 2 ) and the mean squared error ( L 2 ) are used as the performance metrics to evaluate the results of the inverse simulations. The formulas for R 2 and L 2 are as follows:
R 2 = n x i y i x i y i n x i 2 x i 2 n y i 2 y i 2 2
L 2 = 1 n x i y i 2
where n is the total number of elements, i is the element number, x i is the true value of K , D or S S at the element i , and y i is the estimated value at the element i . R 2 suggests the degree of fit between the reference field and the estimated field. L 2 represents the overall deviation of the estimated field from the true field. In general, a higher R 2 and a smaller L 2 indicate a better estimate.

4. Results and Discussion

4.1. Hydraulic Travel Time and Attenuation Inversion

The travel time inversion utilizes the t10, the travel time with a transformation factor of 10%, which is more inclined to reveal high- K layers [34]. A total of 36 travel times t10 were identified. The attenuation inversion was performed independently from the travel-time inversion. According to Equation (2), the maxima of the derived head were divided by the maximum drawdown generated in the test well (H0). With other known parameters, the spatial distribution of the specific storage can be accordingly reconstructed.
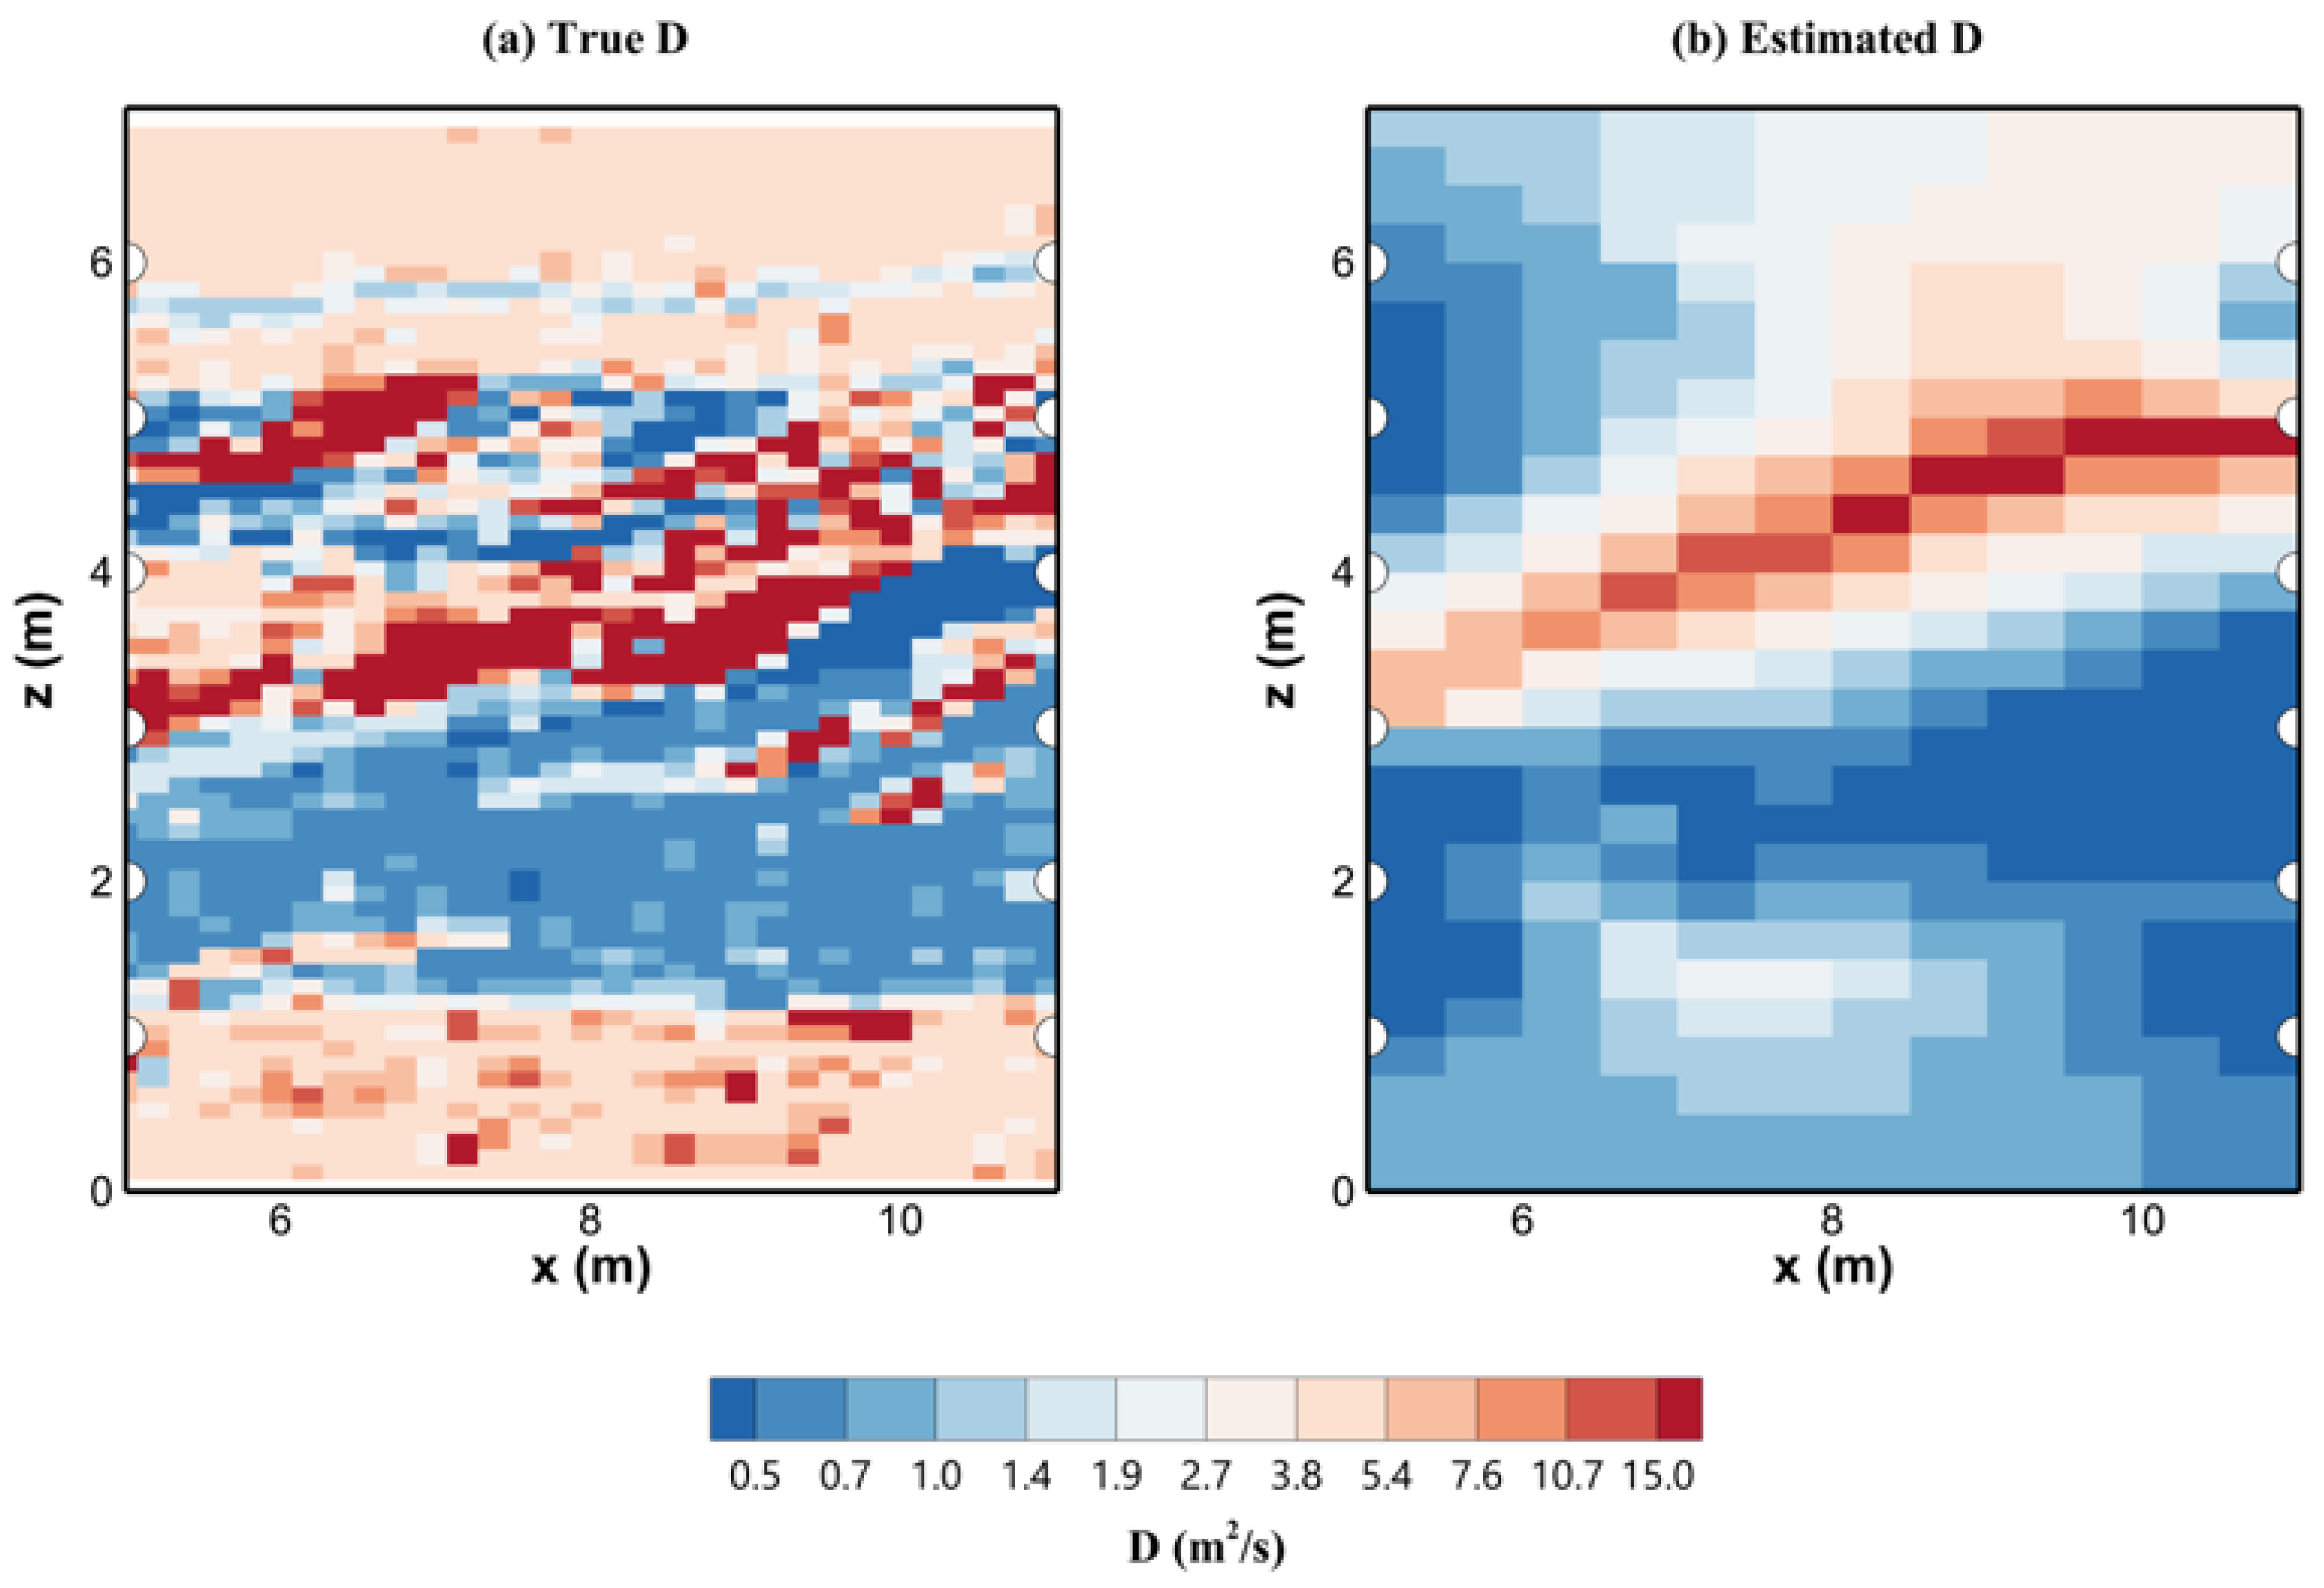
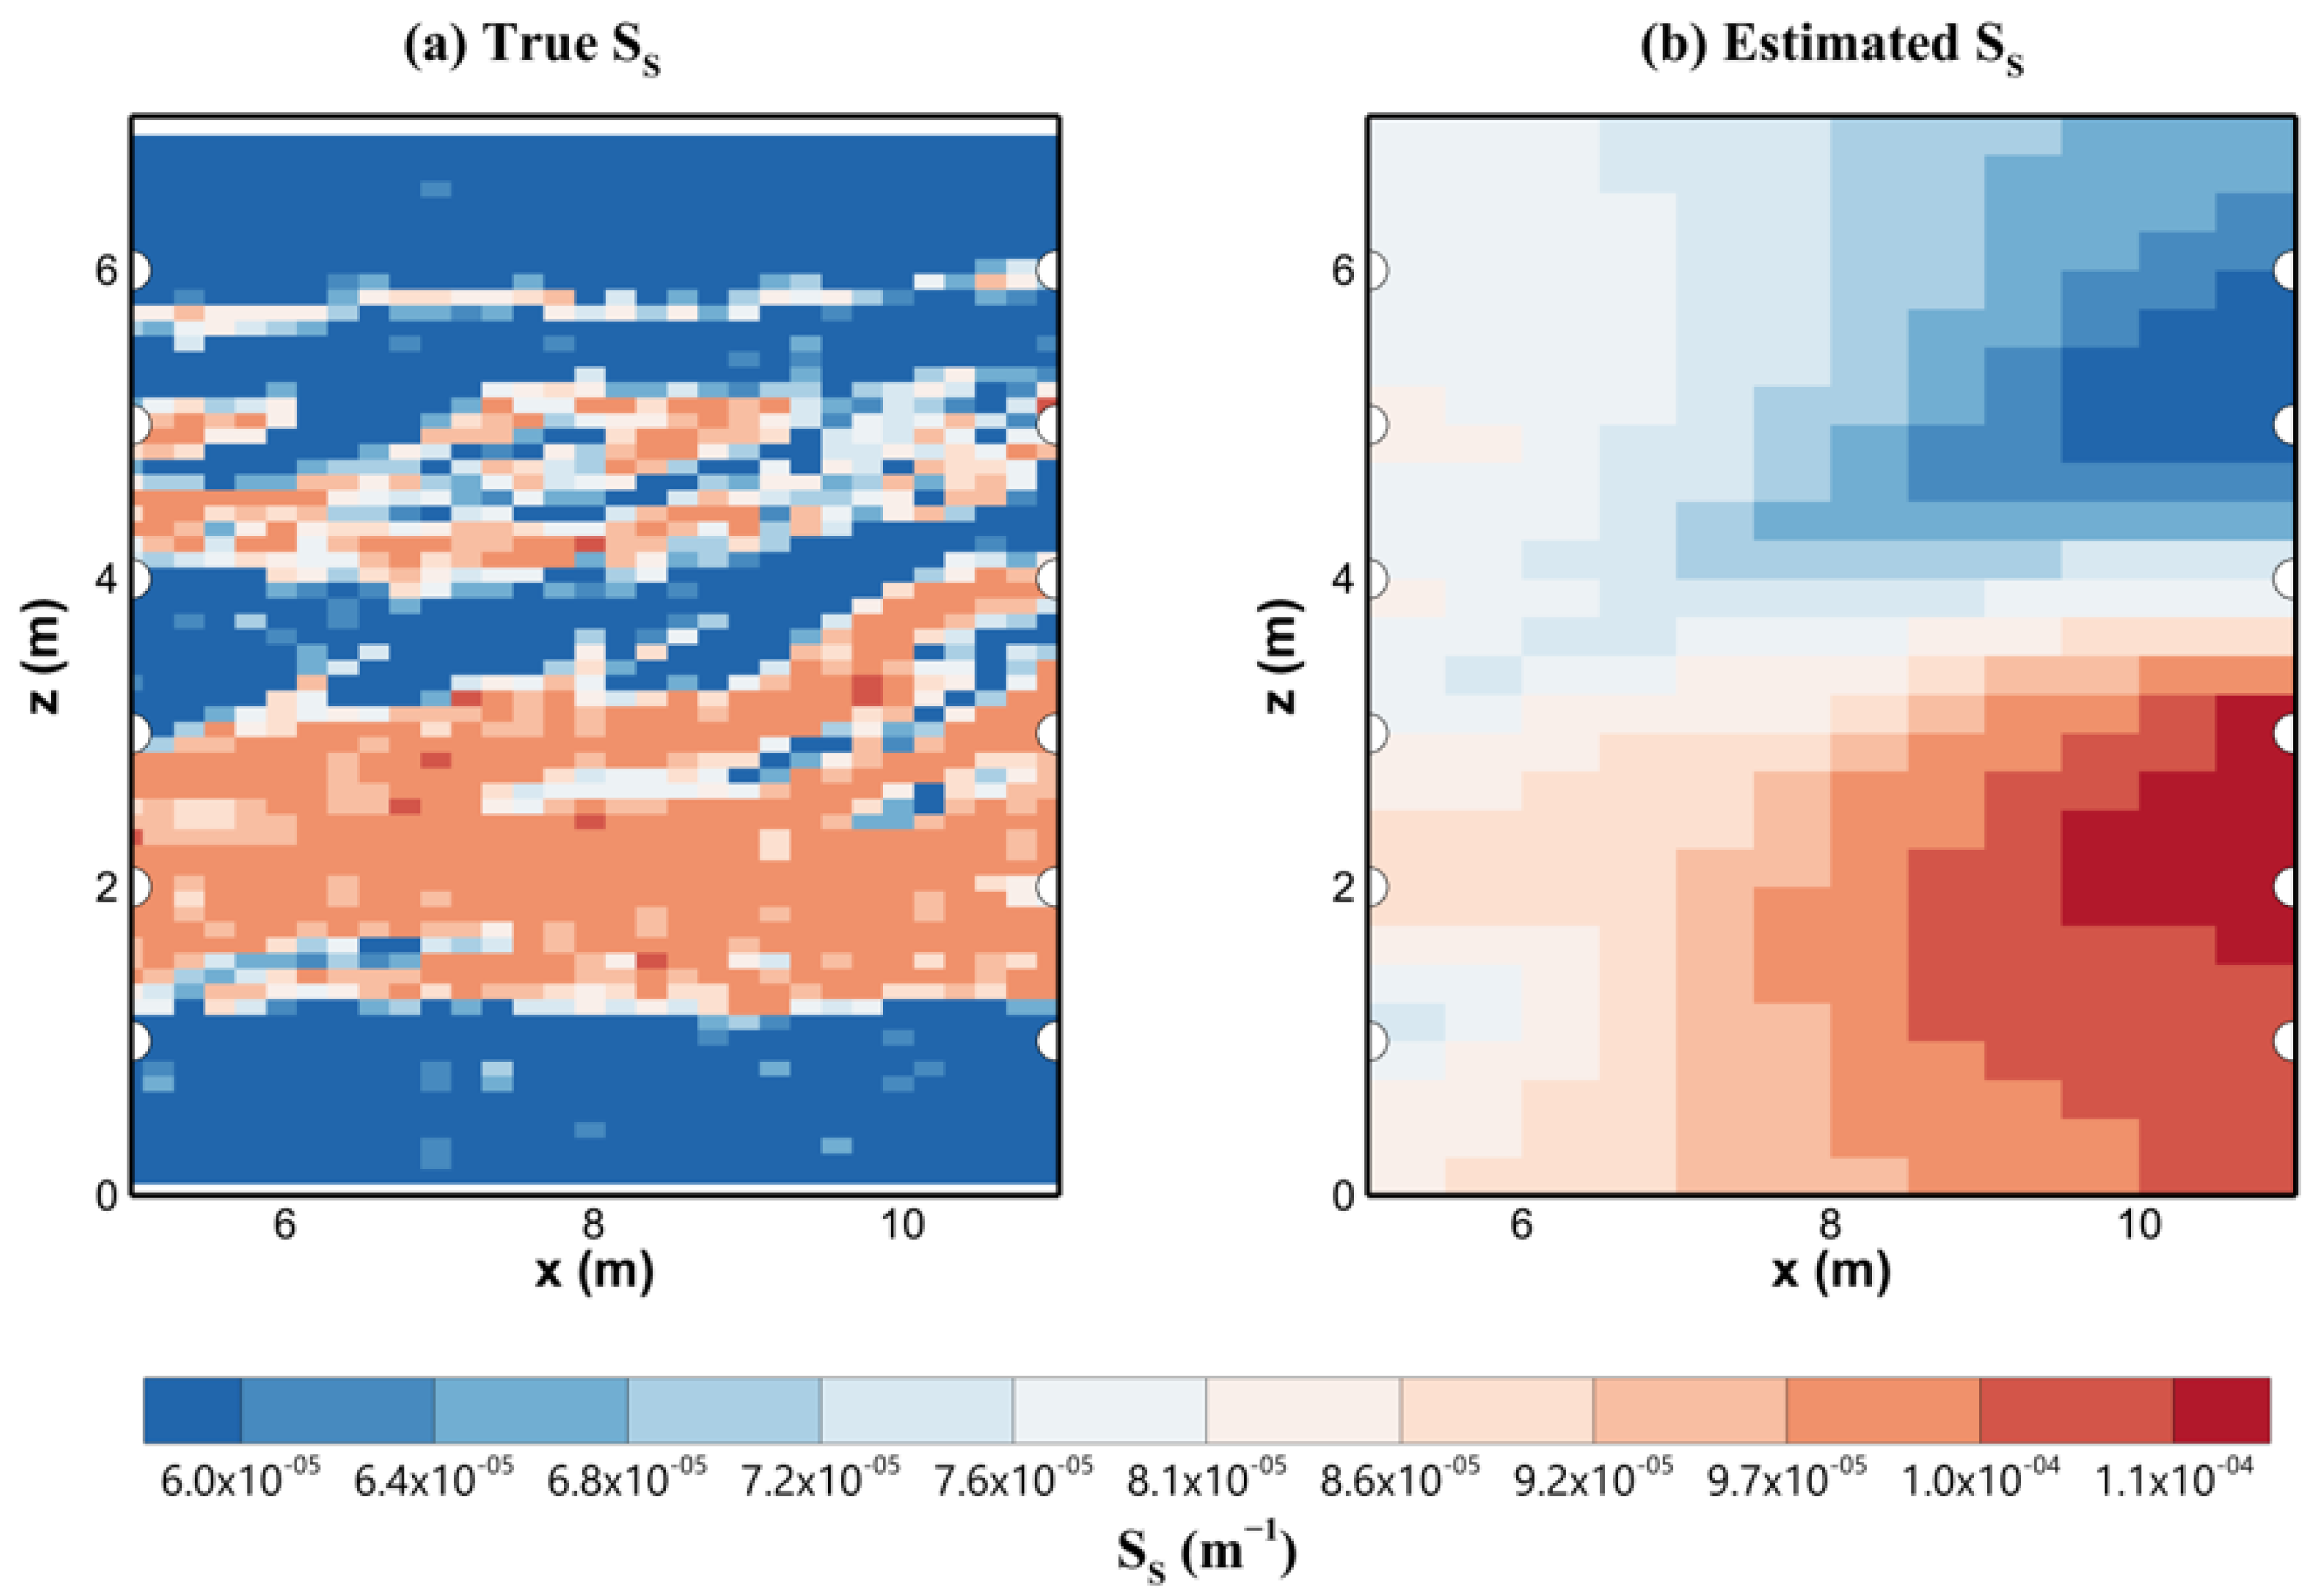
In the inversion procedure, the inversion domain is 7 m deep and 6 m wide (Figure 2), consisting of six monitoring points and six injection points between them. After the numerical calculations, the inversion results of the reconstructed D and S S field are presented in Figure 4 and Figure 5.
The tomogram in Figure 4 reveals a high- D zone between injection and monitoring points around 4 m. The inverted D values of this area vary in a range from 3.8 to 15 m2/s; the low- D areas varying from 0.5 to 1.9 m2/s were also identified around 2.5 m. The top and bottom areas have a medium D around 2.7 m2/s, which may be distorted due to there being less signals obtained in these areas.
The inversion result of S S in Figure 5 shows the distribution of estimated S S with a range from 6 × 10⁻⁵ to 1.1 × 10⁻⁴ m−1. The tomogram in Figure 5 reveals a high- S S zone at the middle layer in the inversion domain which varies from 9 × 10⁻⁵ to 1.1 × 10⁻⁴ m−1 and is close to the “true” S S assigned in the forward simulation. In the top area, it shows a low- S S with a range of 6 × 10⁻⁵ to 7.5 × 10⁻⁵ m−1 which is higher than the “true” S S .
The tomogram in Figure 6 shows the distribution of the calculated hydraulic conductivity (based on the relationship K = D × S S ), the calculated K values range from 2 × 10⁻⁵ to 1.7 × 10⁻³ m/s which are lower than the true K values. Comparing to the K distribution from the Herten analogue, it shows that the estimated K has a good fit for the low K area at a depth of about 2 m, and the distribution of the high K area around 3–4 m obtained the position of the high K channel which is lower than the “true” K in this tomogram. The main reason why the high K values did not fit well is that the calculated hydraulic conductivity distribution accumulates the estimation error of D and S S .

4.2. Inverted K Distribution by the Thermal Tracer Tomography

In the travel-time based inversion procedure, parameter porosity ϕ and thermal retardation R are assumed to be constant as 0.5 and 2.5, respectively. The hydraulic gradient i is set to 0.1 (Table 1).
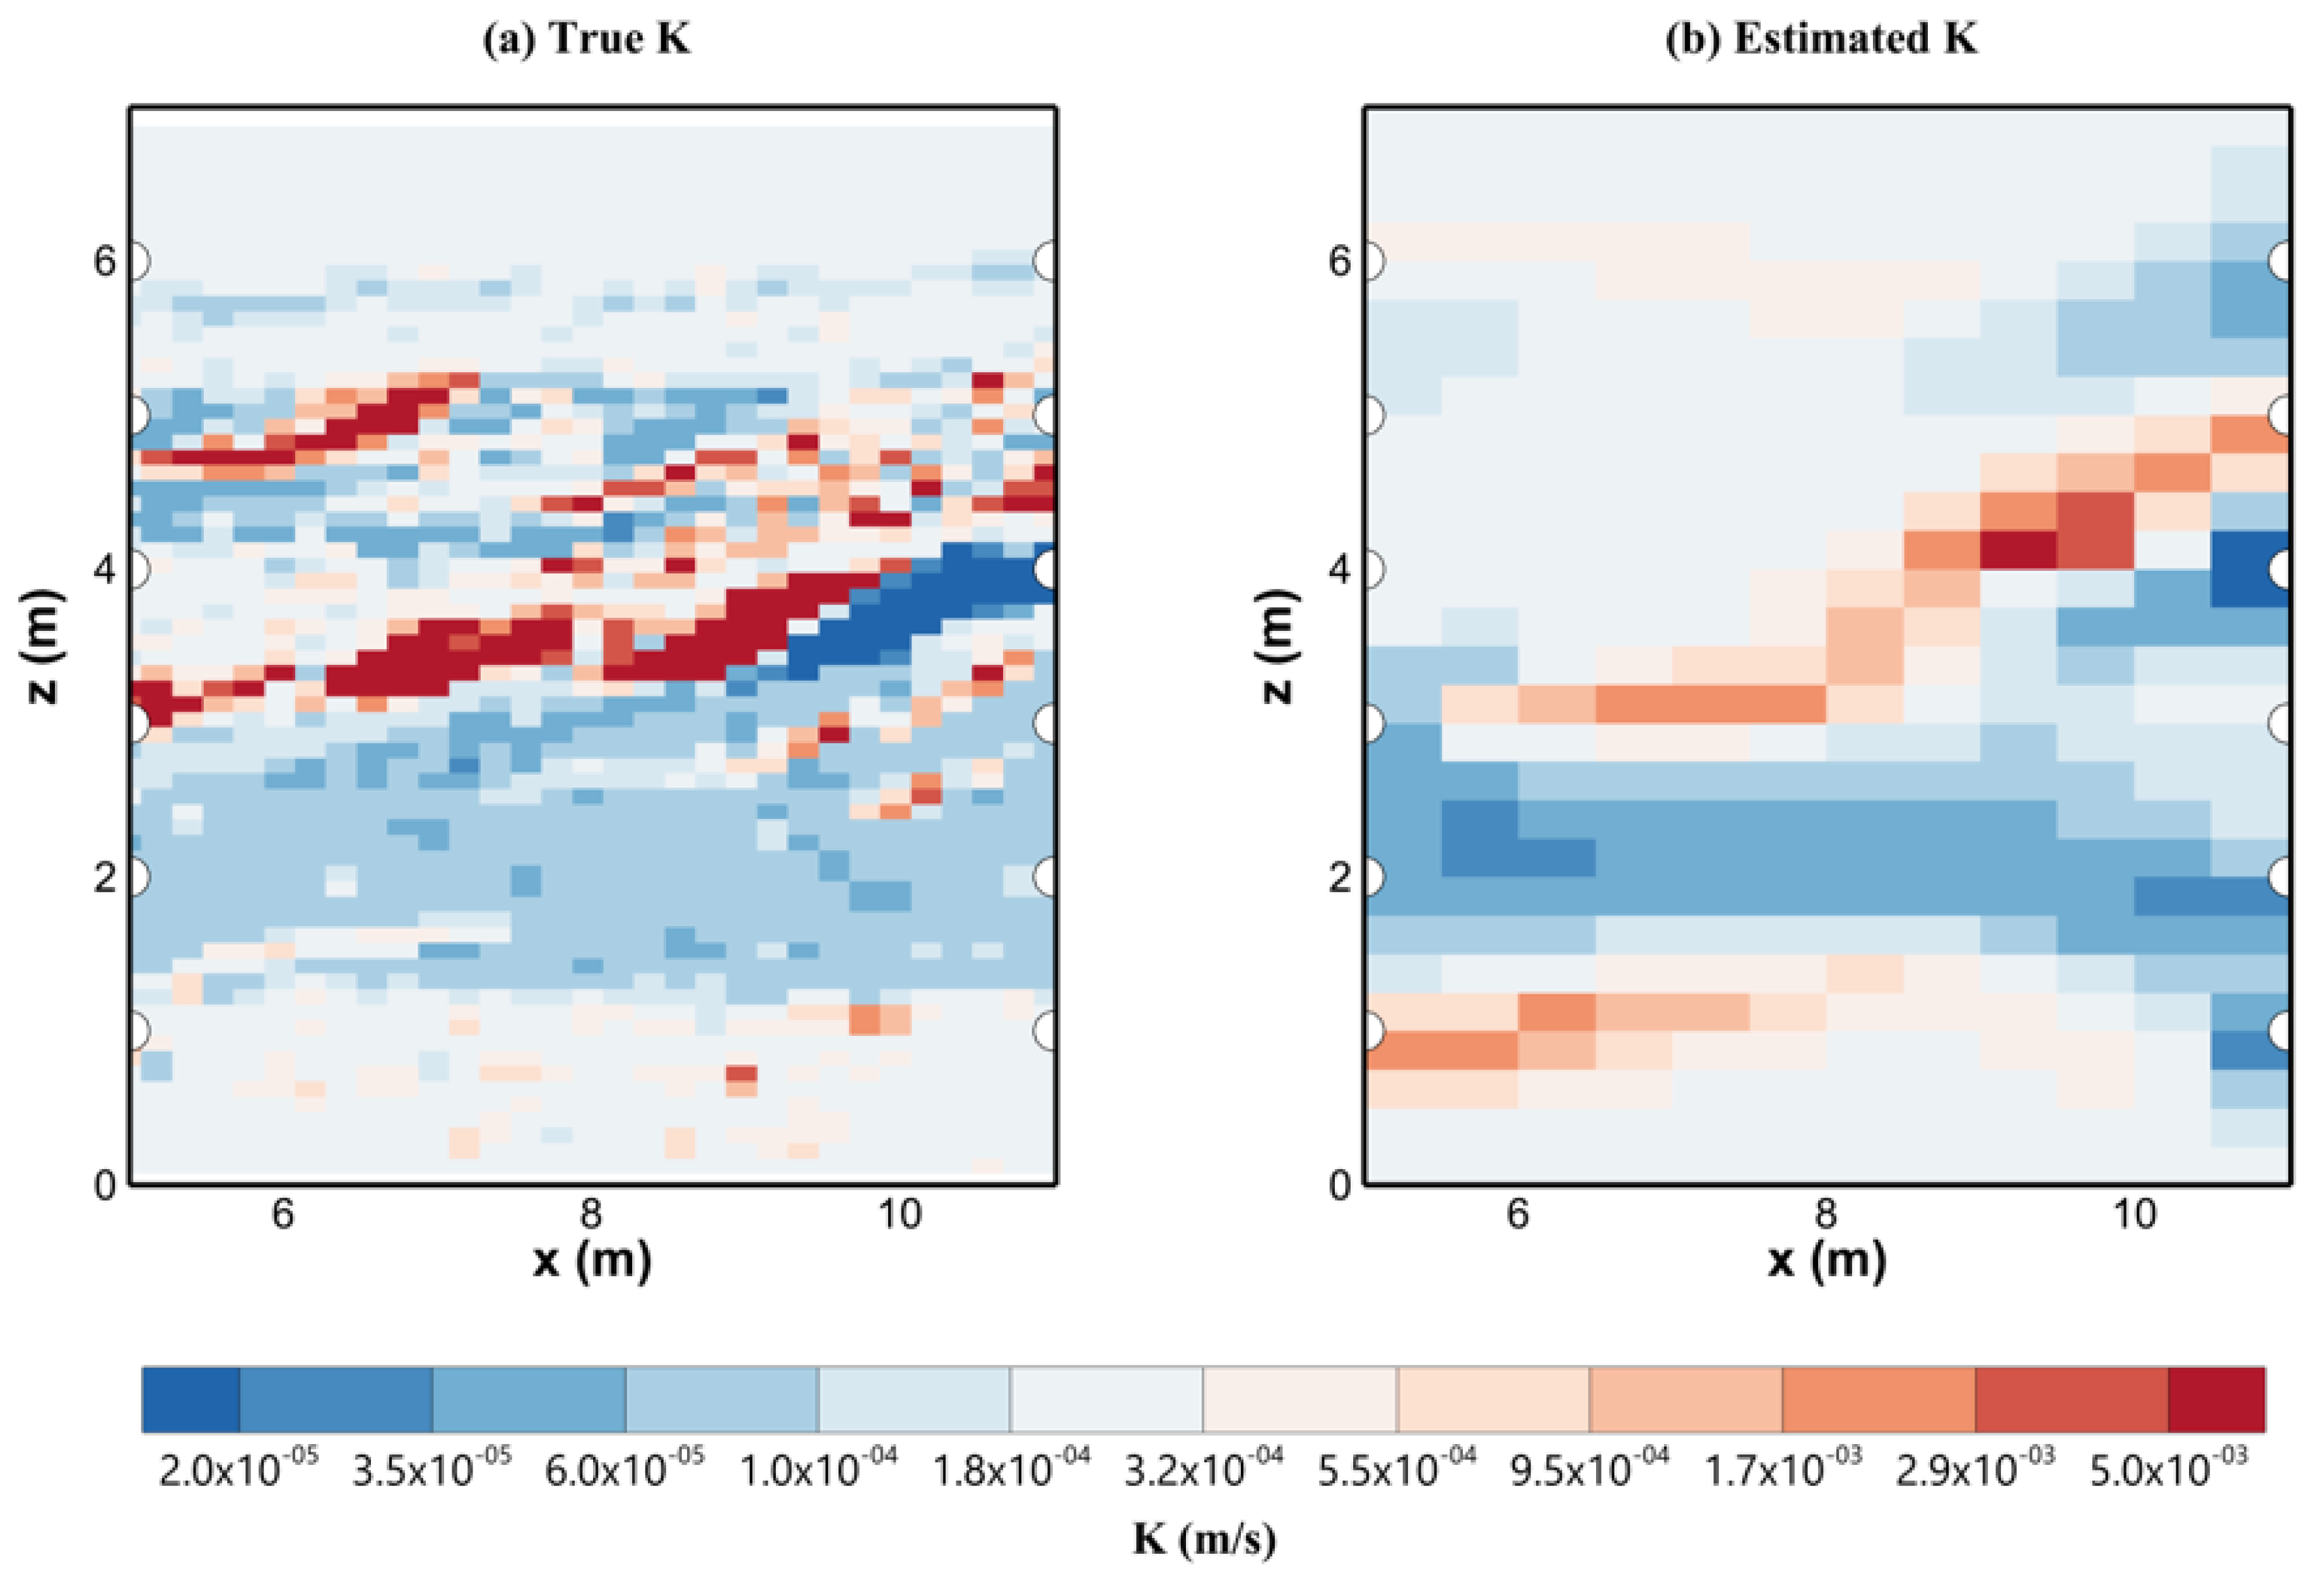
A total of 36 thermal travel times were extracted by using the early-time diagnostic method. After identifying the peak value of each thermal response curve, the early travel time corresponding to 10% of the peak value can be obtained. The early travel time is then extrapolated to the ideal travel time that takes heat diffusion into account [43]. The tomogram of the inverted K values in Figure 7 reveals a connected high- K channel with K varying from 9.5 × 10⁻⁴ to 5 × 10⁻³ m/s and a low- K zone varying from 2.0 × 10⁻⁵ to 1.8 × 10⁻⁴ m/s. At the left bottom of the inverted tomogram, an estimation error occurs due to less constraints from the thermal travel time data. The disconnected high- K zone in the upper left was not correctly identified; the sparse monitoring density and the influence of the surrounding low- K region could be the main reasons.

4.3. Geostatistical Inversion

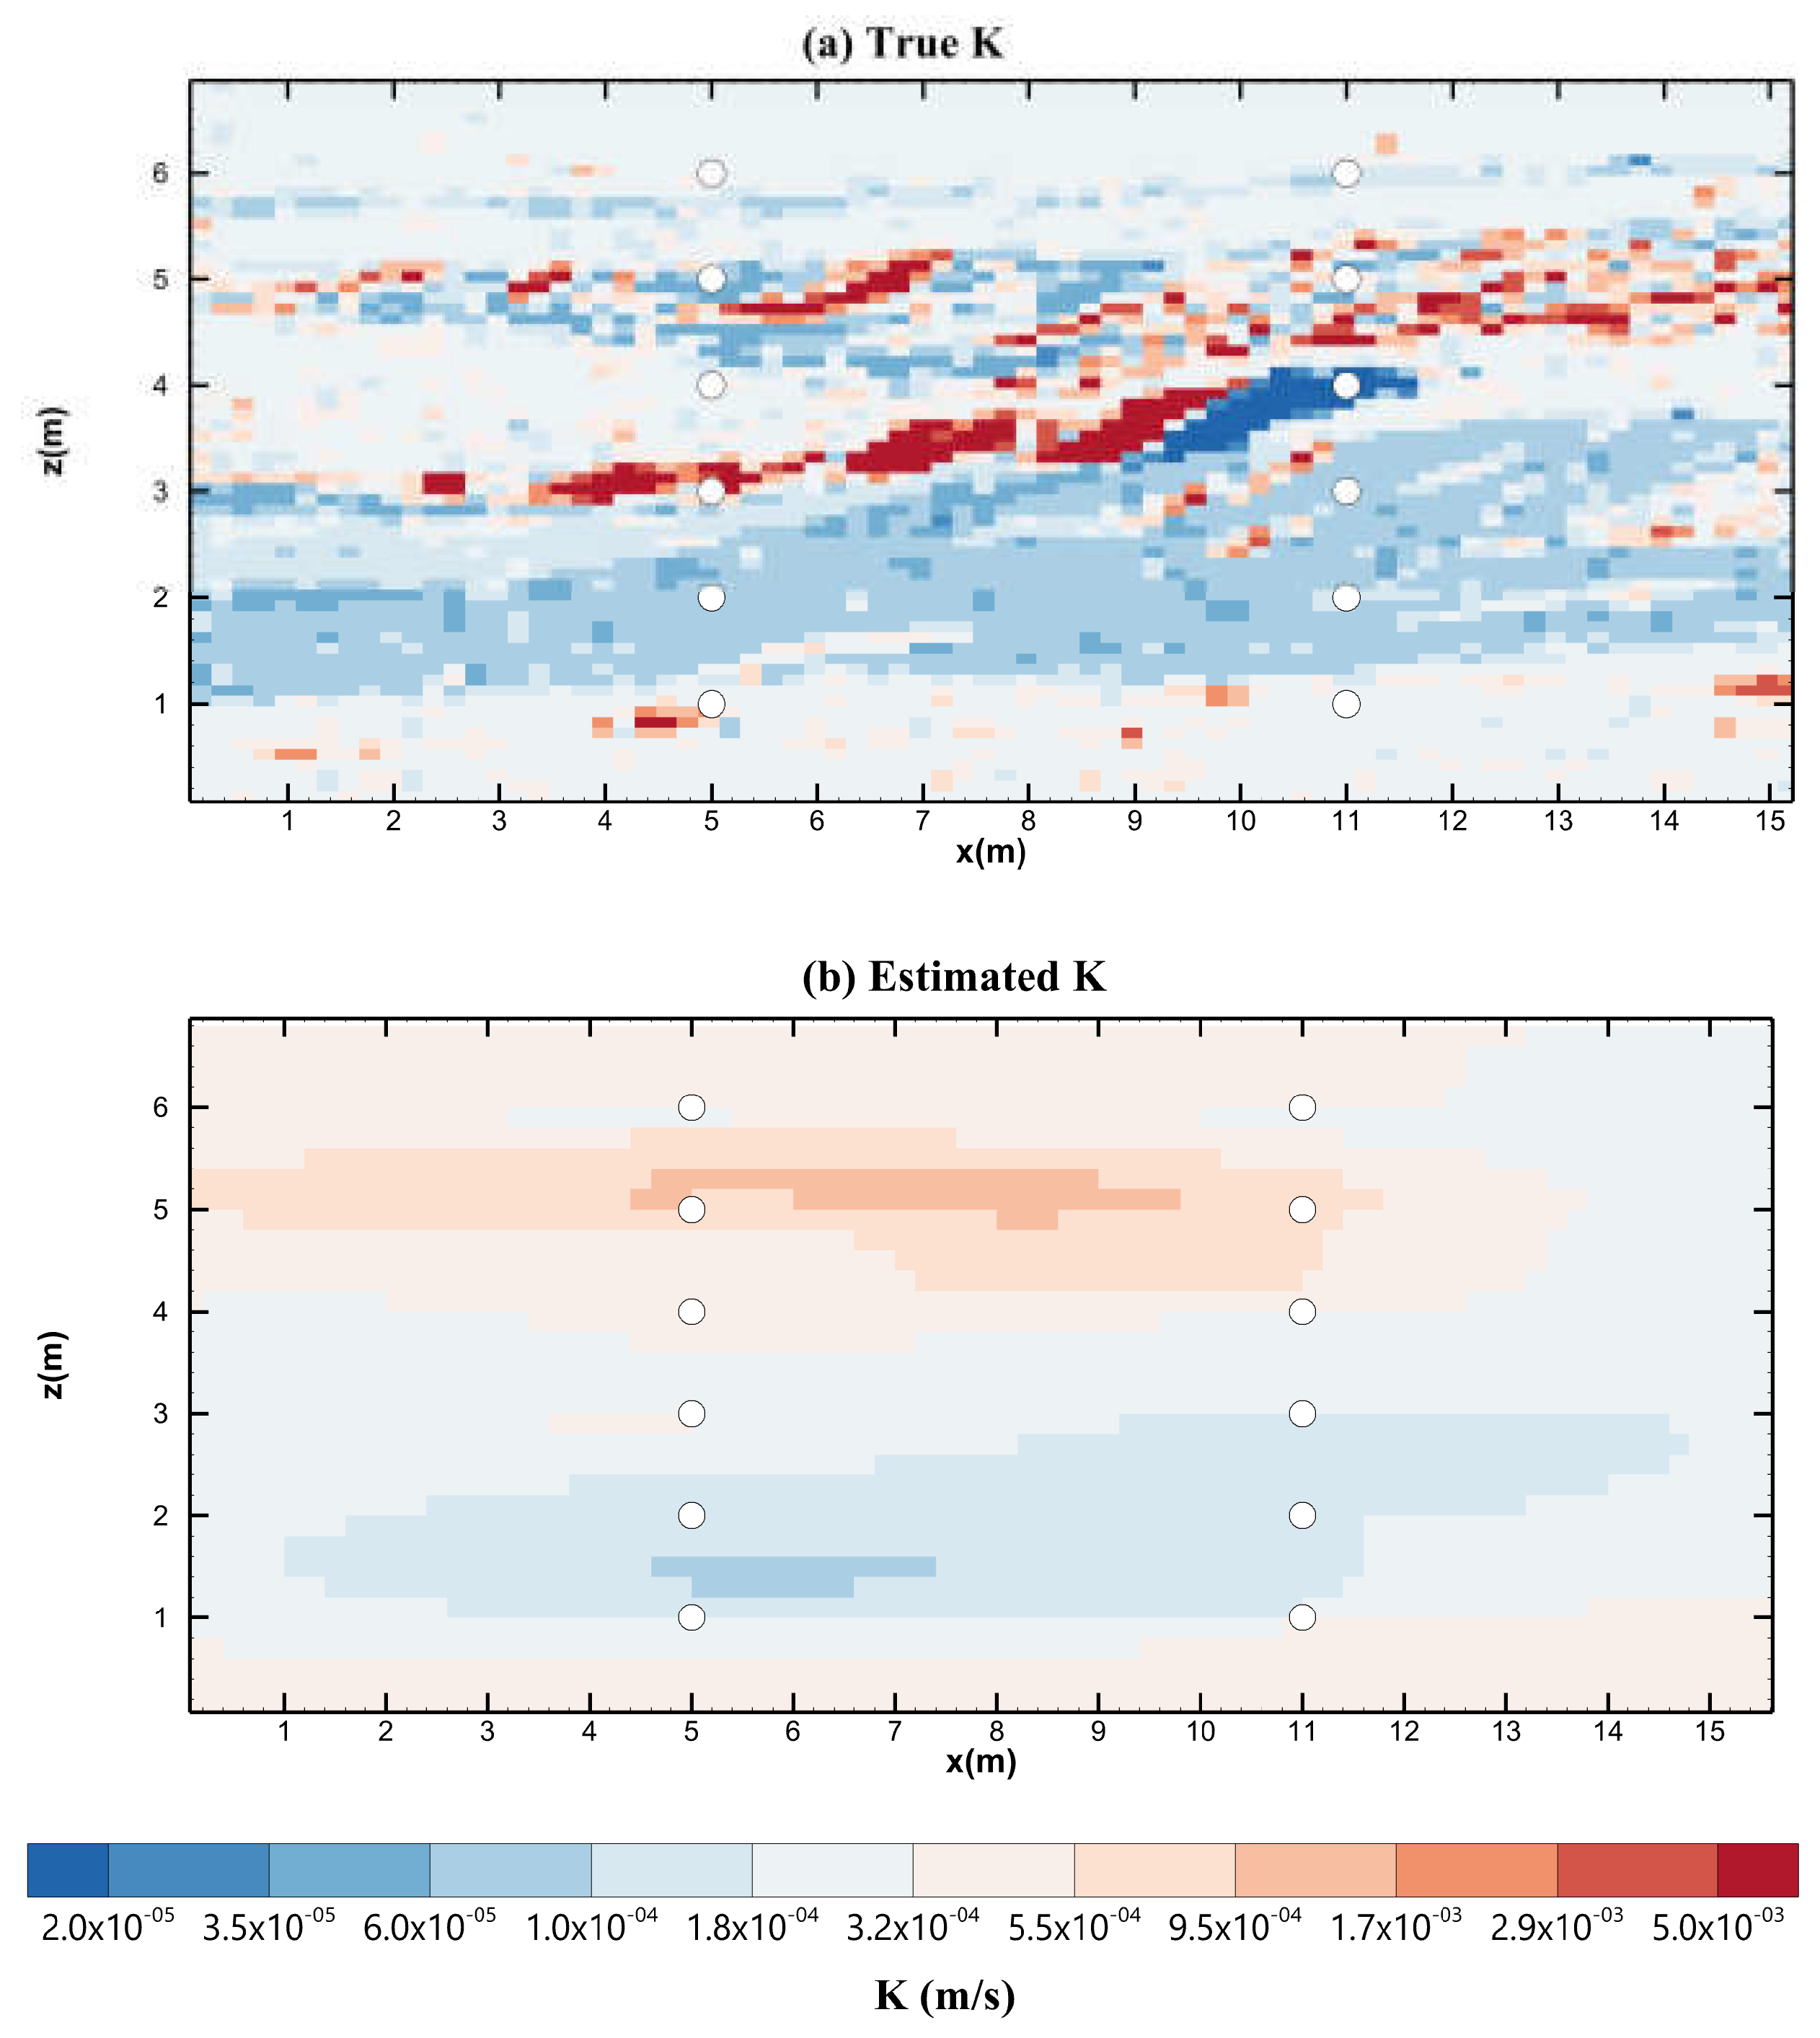
On inputting the water level data of all observation points in a total of six water injection simulation tests into vsaft2 for SLE inversion calculation, the inversion tomogram in Figure 8 reveals two main areas: a high- K zone ranges from 5.5 × 10⁻⁴ to 1.7 × 10⁻³ m/s and a low- K zone ranges from 6.5 × 10⁻⁵ to 1.8 × 10⁻⁴ m/s. The location of the estimated high- K zone is closer to the top of the aquifer than the ‘true’ K distribution, while not revealing the connected high- K channel at the middle of the aquifer. There are several reasons for this: (1) in order to maintain the same well configuration with other methods, the number of observation wells is limited, and the locations are all focused on the other side of the water injection well; (2) this study does not involve the prior information of parameters which could obviously improve the result.
The three tomograms and the R 2 , L 2 of the inverted K from Figure 9, showed that the thermal tracer tomography, hydraulic travel-time, and attenuation tomography characterized the high- K channel position more accurately within the well area, whereas the geological statistical method tended to depict the overall distribution of K values for a larger area. The thermal tracer tomography was more accurate in identifying the positions and values of the high- and low- K channel compared with the other two methods.
In the current case with a limited number of wells and observation points, geostatistical inversion is not accurate enough to describe the location of the high- K channels. Since all different inversion methods are based on the same data set from the performed hot water injection tests, the input data for geostatistical inversion was limited and less than the amount with which the geostatistical inversion is expected to perform better. The comparison of these methods is summarized in Table 2.
By combining different inversion methods, it is possible to fully analyze the experimental data to obtain a more accurate distribution of aquifer permeability parameters in the case of one experiment, which reduces both the need for other supplementary experiments and the budgetary expenditures.

5. Conclusions

In this study, numerical experiments were conducted by using a synthetic 2D heterogeneous aquifer, which was cut from the Herten aquifer analogue. A comparison between transient hydraulic tomography (THT) algorithms, thermal tracer tomography, and geostatistical inversion was performed.
A series of cross-well multilevel heat injection tests were set up in the numerical experiments. A total of six injection tests were simulated in this study. Based on simulated head and temperature signals, the hydraulic travel time inversion, head attenuation inversion, thermal tracer tomography inversion, and geostatistical inversion were performed individually.
Our study leads to the following findings and conclusions:
Through the numerical experiments, it was demonstrated that the cross-well thermal tracer tomography tests can be used to obtain different types of hydraulic parameters and their distributions of the aquifer by using hydraulic travel time inversion and head attenuation, thermal tracer tomography, and geostatistical inversion. In this case, multiple hydraulic tomographic inversions were performed to make full use of the same experimental data. In addition, by comparing the results of different methods, more comprehensive information on the hydraulic parameters of the synthetic aquifer analogue could be estimated while reducing the possibility of inversion uncertainty.
By comparing with the given hydraulic parameters of the Herten analogue, it was shown that: Hydraulic travel time and attenuation inversion can obtain the distributions of D and S S from the early-time data. These travel time-based inversion methods are efficient in computation, by sacrificing inversion accuracy somewhat. Thermal tracer tomography uses the overall temperature data to characterize the K distribution, which presents a higher accuracy. The temperature measurements in the field test usually contain less environmental noise than the hydraulic data, and the temperature data can have a high temporal and spatial resolution when using the distributed temperature sensing (DTS) system device. However, the disadvantage of the thermal tracer test is that it requires a long testing time in practice due to the slower propagation of the thermal signal than the hydraulic signal.
In conclusion, in the current case with a limited number of wells and observation points, the thermal tracer tomography had the best comprehensive performance, whereas the hydraulic travel time and attenuation tomography were the most economical choice when considering the experimental time and calculation cost. The geostatistical inversion provides a larger investigation area than the other methods with general information about the aquifer heterogeneity and is expected to perform better with more wells and observation data. The full use of the data set from one series of tests with four different methods is a very cost-effective way and the comparison of the results can help evaluate and reduce the uncertainty of each individual inversion.
The current work used the same experimental data for different inversion methods. The results showed that the various methods have different disadvantages and advantages, because they actually have different requirements of input data for their own optimum performance. In this work, we only compared the performance under the same situation.
In future research, we will combine these various methods for joint inversions, which can improve the characterization accuracy and efficiency, with less uncertainty. For the geostatistical inversion, the calculation efficiency is expected to be increased. For example, based on the results of the cross-correlation analysis, a short-term pumping strategy was proposed for the hydraulic tomography to obtain the spatial distribution of hydraulic conductivity and specific storage using the successive linear estimator [54]. It was found that the travel-time inversion method can provide the prior model efficiently for the geostatistical inversion with its low computational cost [31]. Likewise, the K value retrieved by thermal tracer tomography is also helpful to improve the estimation accuracy of the hydraulic parameters by reducing the estimation uncertainty. However, it is still necessary to study how to reasonably increase the data collection points to increase the monitoring density considering the resolution requirements in high spatial and temporal conditions.

Author Contributions

Data curation, Y.S.; Formal analysis, Q.L. and H.Q.; Methodology, R.H., Q.L. and H.Q.; Software, Y.S.; Supervision, R.H.; Writing—original draft, Q.L., H.Q. and Y.S.; Writing—review and editing, Y.S., R.H., Q.L., H.Q., X.H., J.Q. and B.K.-A. All authors have read and agreed to the published version of the manuscript.

Funding

This work was supported by the Ministry of Science and Technology of China through the Program “Driving process and mechanism of three-dimensional spatial distribution of high-risk organic pollutants in multi field coupled sites” (Project Code: 2019YFC1804303).

Data Availability Statement

Not applicable.

Acknowledgments

We acknowledge support by the Open Access Publication Funds of the Göttingen University.

Conflicts of Interest

The authors declare no conflict of interest.

References

  1. Alexander, M.; Berg, S.J.; Illman, W.A. Field Study of Hydrogeologic Characterization Methods in a Heterogeneous Aquifer. Groundwater 2011, 49, 365–382. [Google Scholar] [CrossRef]
  2. Salamon, P.; Fernàndez-Garcia, D.; Gómez-Hernández, J.J. Modeling Tracer Transport at the MADE Site: The Importance of Heterogeneity. Water Resour. Res. 2007, 43, W08404. [Google Scholar] [CrossRef]
  3. Luo, N.; Zhao, Z.; Illman, W.A.; Berg, S.J. Comparative Study of Transient Hydraulic Tomography with Varying Parameterizations and Zonations: Laboratory Sandbox Investigation. J. Hydrol. 2017, 554, 758–779. [Google Scholar] [CrossRef] [Green Version]
  4. Luo, N.; Illman, W.A.; Zha, Y.; Park, Y.-J.; Berg, S.J. Three-Dimensional Hydraulic Tomography Analysis of Long-Term Municipal Wellfield Operations: Validation with Synthetic Flow and Solute Transport Data. J. Hydrol. 2020, 590, 125438. [Google Scholar] [CrossRef]
  5. Zhao, Z.; Illman, W.A. On the Importance of Considering Specific Storage Heterogeneity in Hydraulic Tomography: Laboratory Sandbox and Synthetic Studies. J. Hydrol. 2021, 593, 125874. [Google Scholar] [CrossRef]
  6. Day-Lewis, F.D.; Harris, J.M.; Gorelick, S.M. Time-lapse Inversion of Crosswell Radar Data. Geophysics 2002, 67, 1740–1752. [Google Scholar] [CrossRef]
  7. Robinson, J.; Slater, L.; Johnson, T.; Shapiro, A.; Tiedeman, C.; Ntarlagiannis, D.; Johnson, C.; Day-Lewis, F.; Lacombe, P.; Imbrigiotta, T.; et al. Imaging Pathways in Fractured Rock Using Three-Dimensional Electrical Resistivity Tomography. Groundwater 2016, 54, 186–201. [Google Scholar] [CrossRef]
  8. Brauchler, R. Derivation of Site-specific Relationships between Hydraulic Parameters and P-wave Velocities Based on Hydraulic and Seismic Tomography. Water Resour. Res. 2012, 14, W03531. [Google Scholar] [CrossRef] [Green Version]
  9. Bohling, G.C.; Zhan, X.; Butler, J.J., Jr.; Zheng, L. Steady Shape Analysis of Tomographic Pumping Tests for Characterization of Aquifer Heterogeneities. Water Resour. Res. 2002, 38, 60-1–60-15. [Google Scholar] [CrossRef] [Green Version]
  10. Qiu, P.; Hu, R.; Hu, L.; Liu, Q.; Xing, Y.; Yang, H.; Qi, J.; Ptak, T. A Numerical Study on Travel Time Based Hydraulic Tomography Using the SIRT Algorithm with Cimmino Iteration. Water 2019, 11, 909. [Google Scholar] [CrossRef] [Green Version]
  11. Yeh, T.-C.J.; Liu, S. Hydraulic Tomography: Development of a New Aquifer Test Method. Water Resour. Res. 2000, 36, 2095–2105. [Google Scholar] [CrossRef] [Green Version]
  12. Zhu, J.; Yeh, T.-C.J. Analysis of Hydraulic Tomography Using Temporal Moments of Drawdown Recovery Data. Water Resour. Res. 2006, 42, W02403. [Google Scholar] [CrossRef] [Green Version]
  13. Brauchler, R.; Liedl, R.; Dietrich, P. A Travel Time Based Hydraulic Tomographic Approach. Water Resour. Res. 2003, 39, 1370. [Google Scholar] [CrossRef]
  14. Illman, W.A.; Berg, S.J.; Zhao, Z. Should Hydraulic Tomography Data Be Interpreted Using Geostatistical Inverse Modeling? A Laboratory Sandbox Investigation. Water Resour. Res. 2015, 51, 3219–3237. [Google Scholar] [CrossRef]
  15. Illman, W.A.; Berg, S.J.; Yeh, T.-C.J. Comparison of Approaches for Predicting Solute Transport: Sandbox Experiments. Groundwater 2012, 50, 421–431. [Google Scholar] [CrossRef]
  16. Illman, W.A.; Zhu, J.; Craig, A.J.; Yin, D. Comparison of Aquifer Characterization Approaches through Steady State Groundwater Model Validation: A Controlled Laboratory Sandbox Study. Water Resour. Res. 2010, 46, W04502. [Google Scholar] [CrossRef]
  17. Illman, W.A.; Liu, X.; Craig, A. Steady-State Hydraulic Tomography in a Laboratory Aquifer with Deterministic Heterogeneity: Multi-Method and Multiscale Validation of Hydraulic Conductivity Tomograms. J. Hydrol. 2007, 341, 222–234. [Google Scholar] [CrossRef]
  18. Liu, S.; Yeh, T.-C.J.; Gardiner, R. Effectiveness of Hydraulic Tomography: Sandbox Experiments. Water Resour. Res. 2002, 38, 5-1–5-9. [Google Scholar] [CrossRef]
  19. Liu, X.; Illman, W.A.; Craig, A.J.; Zhu, J.; Yeh, T.-C.J. Laboratory Sandbox Validation of Transient Hydraulic Tomography. Water Resour. Res. 2007, 43, W05404. [Google Scholar] [CrossRef]
  20. Yin, D.; Illman, W.A. Hydraulic Tomography Using Temporal Moments of Drawdown Recovery Data: A Laboratory Sandbox Study. Water Resour. Res. 2009, 45, W01502. [Google Scholar] [CrossRef]
  21. Berg, S.J.; Illman, W.A. Three-Dimensional Transient Hydraulic Tomography in a Highly Heterogeneous Glaciofluvial Aquifer-Aquitard System. Water Resour. Res. 2011, 47, W10507. [Google Scholar] [CrossRef]
  22. Bohling, G.C.; Butler, J.J., Jr.; Zhan, X.; Knoll, M.D. A Field Assessment of the Value of Steady Shape Hydraulic Tomography for Characterization of Aquifer Heterogeneities. Water Resour. Res. 2007, 43, W05430. [Google Scholar] [CrossRef] [Green Version]
  23. Brauchler, R.; Hu, R.; Hu, L.; Jimenez, S.; Bayer, P.; Dietrich, P.; Ptak, T. Rapid Field Application of Hydraulic Tomography for Resolving Aquifer Heterogeneity in Unconsolidated Sediments. Water Resour. Res. 2013, 49, 2013–2024. [Google Scholar] [CrossRef]
  24. Cardiff, M.; Zhou, Y.; Barrash, W.; Kitanidis, P.K. Aquifer Imaging with Oscillatory Hydraulic Tomography: Application at the Field Scale. Groundwater 2020, 58, 710–722. [Google Scholar] [CrossRef] [PubMed]
  25. Zha, Y.; Yeh, T.-C.J.; Illman, W.A.; Tanaka, T.; Bruines, P.; Onoe, H.; Saegusa, H. What Does Hydraulic Tomography Tell Us about Fractured Geological Media? A Field Study and Synthetic Experiments. J. Hydrol. 2015, 531, 17–30. [Google Scholar] [CrossRef]
  26. Zhao, Z.; Illman, W.A. Three-Dimensional Imaging of Aquifer and Aquitard Heterogeneity via Transient Hydraulic Tomography at a Highly Heterogeneous Field Site. J. Hydrol. 2018, 559, 392–410. [Google Scholar] [CrossRef]
  27. Vasco, D.W.; Keers, H.; Karasaki, K. Estimation of Reservoir Properties Using Transient Pressure Data: An Asymptotic Approach. Water Resour. Res. 2000, 36, 3447–3465. [Google Scholar] [CrossRef]
  28. Vasco, D.W.; Datta-Gupta, A. Asymptotic Solutions for Solute Transport: A Formalism for Tracer Tomography. Water Resour. Res. 1999, 35, 98WR02742. [Google Scholar] [CrossRef]
  29. Kitanidis, P.K. Quasi-Linear Geostatistical Theory for Inversing. Water Resour. Res. 1995, 31, 2411–2419. [Google Scholar] [CrossRef]
  30. Xiang, J.; Yeh, T.-C.J.; Lee, C.-H.; Hsu, K.-C.; Wen, J.-C. A Simultaneous Successive Linear Estimator and a Guide for Hydraulic Tomography Analysis. Water Resour. Res. 2009, 45, W02432. [Google Scholar] [CrossRef] [Green Version]
  31. Qiu, H.; Hu, R.; Luo, N.; Illman, W.A.; Hou, X. Comparison of Travel-Time and Geostatistical Inversion Approaches for Hydraulic Tomography: Synthetic Modeling Study on Data Density and Well Configuration Issues. J. Hydrol. 2023, 618, 129247. [Google Scholar] [CrossRef]
  32. Vasco, D.W.; Karasaki, K. Interpretation and Inversion of Low-Frequency Head Observations. Water Resour. Res. 2006, 42, W05408. [Google Scholar] [CrossRef] [Green Version]
  33. Brauchler, R.; Hu, R.; Dietrich, P.; Sauter, M. A Field Assessment of High-Resolution Aquifer Characterization Based on Hydraulic Travel Time and Hydraulic Attenuation Tomography. Water Resour. Res. 2011, 47, W03503. [Google Scholar] [CrossRef]
  34. Brauchler, R.; Cheng, J.-T.; Dietrich, P.; Everett, M.; Johnson, B.; Liedl, R.; Sauter, M. An Inversion Strategy for Hydraulic Tomography: Coupling Travel Time and Amplitude Inversion. J. Hydrol. 2007, 345, 184–198. [Google Scholar] [CrossRef]
  35. Hu, R. Hydraulic Tomography: A New Approach Coupling Hydraulic Travel Time, Attenuation and Steady Shape Inversions for High-Spatial Resolution Aquifer Characterization. Ph.D. Thesis, Universität Göttingen, Göttingen, Germany, 2011. Available online: https://ediss.uni-goettingen.de/handle/11858/00-1735-0000-0006-B2F7-E (accessed on 27 June 2023).
  36. Jiménez, S.; Brauchler, R.; Bayer, P. A New Sequential Procedure for Hydraulic Tomographic Inversion. Adv. Water Resour. 2013, 62, 59–70. [Google Scholar] [CrossRef]
  37. Anderson, M.P. Heat as a Ground Water Tracer. Groundwater 2005, 43, 951–968. [Google Scholar] [CrossRef]
  38. Hermans, T.; Wildemeersch, S.; Jamin, P.; Orban, P.; Brouyère, S.; Dassargues, A.; Nguyen, F. Quantitative Temperature Monitoring of a Heat Tracing Experiment Using Cross-Borehole ERT. Geothermics 2015, 53, 14–26. [Google Scholar] [CrossRef] [Green Version]
  39. Sarris, T.S.; Close, M.; Abraham, P. Using Solute and Heat Tracers for Aquifer Characterization in a Strongly Heterogeneous Alluvial Aquifer. J. Hydrol. 2018, 558, 55–71. [Google Scholar] [CrossRef]
  40. Lee, J.; Kokkinaki, A.; Kitanidis, P.K. Fast Large-Scale Joint Inversion for Deep Aquifer Characterization Using Pressure and Heat Tracer Measurements. Transp. Porous Med. 2018, 123, 533–543. [Google Scholar] [CrossRef]
  41. Ringel, L.; Somogyvári, M.; Jalali, M.; Bayer, P. Comparison of Hydraulic and Tracer Tomography for Discrete Fracture Network Inversion. Geosciences 2019, 9, 274. [Google Scholar] [CrossRef] [Green Version]
  42. Schwede, R.L.; Li, W.; Leven, C.; Cirpka, O.A. Three-Dimensional Geostatistical Inversion of Synthetic Tomographic Pumping and Heat-Tracer Tests in a Nested-Cell Setup. Adv. Water Resour. 2014, 63, 77–90. [Google Scholar] [CrossRef]
  43. Somogyvári, M.; Bayer, P.; Brauchler, R. Travel-Time-Based Thermal Tracer Tomography. Hydrol. Earth Syst. Sci. 2016, 20, 1885–1901. [Google Scholar] [CrossRef] [Green Version]
  44. Somogyvári, M.; Kühn, M.; Reich, S. Reservoir-Scale Transdimensional Fracture Network Inversion. Adv. Geosci. 2019, 49, 207–214. [Google Scholar] [CrossRef] [Green Version]
  45. Somogyvári, M.; Bayer, P. Field Validation of Thermal Tracer Tomography for Reconstruction of Aquifer Heterogeneity. Water Resour. Res. 2017, 53, 5070–5084. [Google Scholar] [CrossRef]
  46. Liu, Q.; Hu, R.; Hu, L.; Xing, Y.; Qiu, P.; Yang, H.; Fischer, S.; Ptak, T. Investigation of Hydraulic Properties in Fractured Aquifers Using Cross-Well Travel-Time Based Thermal Tracer Tomography: Numerical and Field Experiments. J. Hydrol. 2022, 609, 127751. [Google Scholar] [CrossRef]
  47. Illman, W.; Yeh, J.-J. Fusion of Tomography Tests for DNAPL Source Zone Characterization: Technology Development and Validation. Final Report No. Project ER-1365. SERDP. 2011, p. 450. Available online: https://serdp-estcp.org/Program-Areas/ (accessed on 27 June 2023).
  48. Rücker, C.; Günther, T.; Wagner, F.M. PyGIMLi: An Open-Source Library for Modelling and Inversion in Geophysics. Comput. Geosci. 2017, 109, 106–123. [Google Scholar] [CrossRef]
  49. Yeh, T.-C.J.; Jin, M.; Hanna, S. An Iterative Stochastic Inverse Method: Conditional Effective Transmissivity and Hydraulic Head Fields. Water Resour. Res. 1996, 32, 85–92. [Google Scholar] [CrossRef] [Green Version]
  50. Bayer, P. Aquifer-Analog-Studie in Grobklastischen ‘Braided River’Ablagerungen: Sedimentäre/Hydrogeologische Wandkartierung und Kalibrierung von Georadarmessungen—Diplomkartierung. Master’s Thesis, Universitaet Tuebingen, Tübingen, Germany, 2000. [Google Scholar]
  51. Liu, Q.; Hu, L.; Bayer, P.; Xing, Y.; Qiu, P.; Ptak, T.; Hu, R. A Numerical Study of Slug Tests in a Three-Dimensional Heterogeneous Porous Aquifer Considering Well Inertial Effects. Water Resour. Res. 2020, 56, e2020WR027155. [Google Scholar] [CrossRef]
  52. Ma, R.; Zheng, C. Effects of Density and Viscosity in Modeling Heat as a Groundwater Tracer. Groundwater 2010, 48, 380–389. [Google Scholar] [CrossRef]
  53. Hu, R.; Liu, Q.; Xing, Y. Case Study of Heat Transfer during Artificial Ground Freezing with Groundwater Flow. Water 2018, 10, 1322. [Google Scholar] [CrossRef] [Green Version]
  54. Hou, X.; Hu, R.; Yeh, T.J.; Li, Y.; Qi, J.; Song, Y.; Qiu, H. A Short-Term Pumping Strategy for Hydraulic Tomography Based on the Successive Linear Estimator. Water Resour. Res. 2023, 59, e2022WR033831. [Google Scholar] [CrossRef]
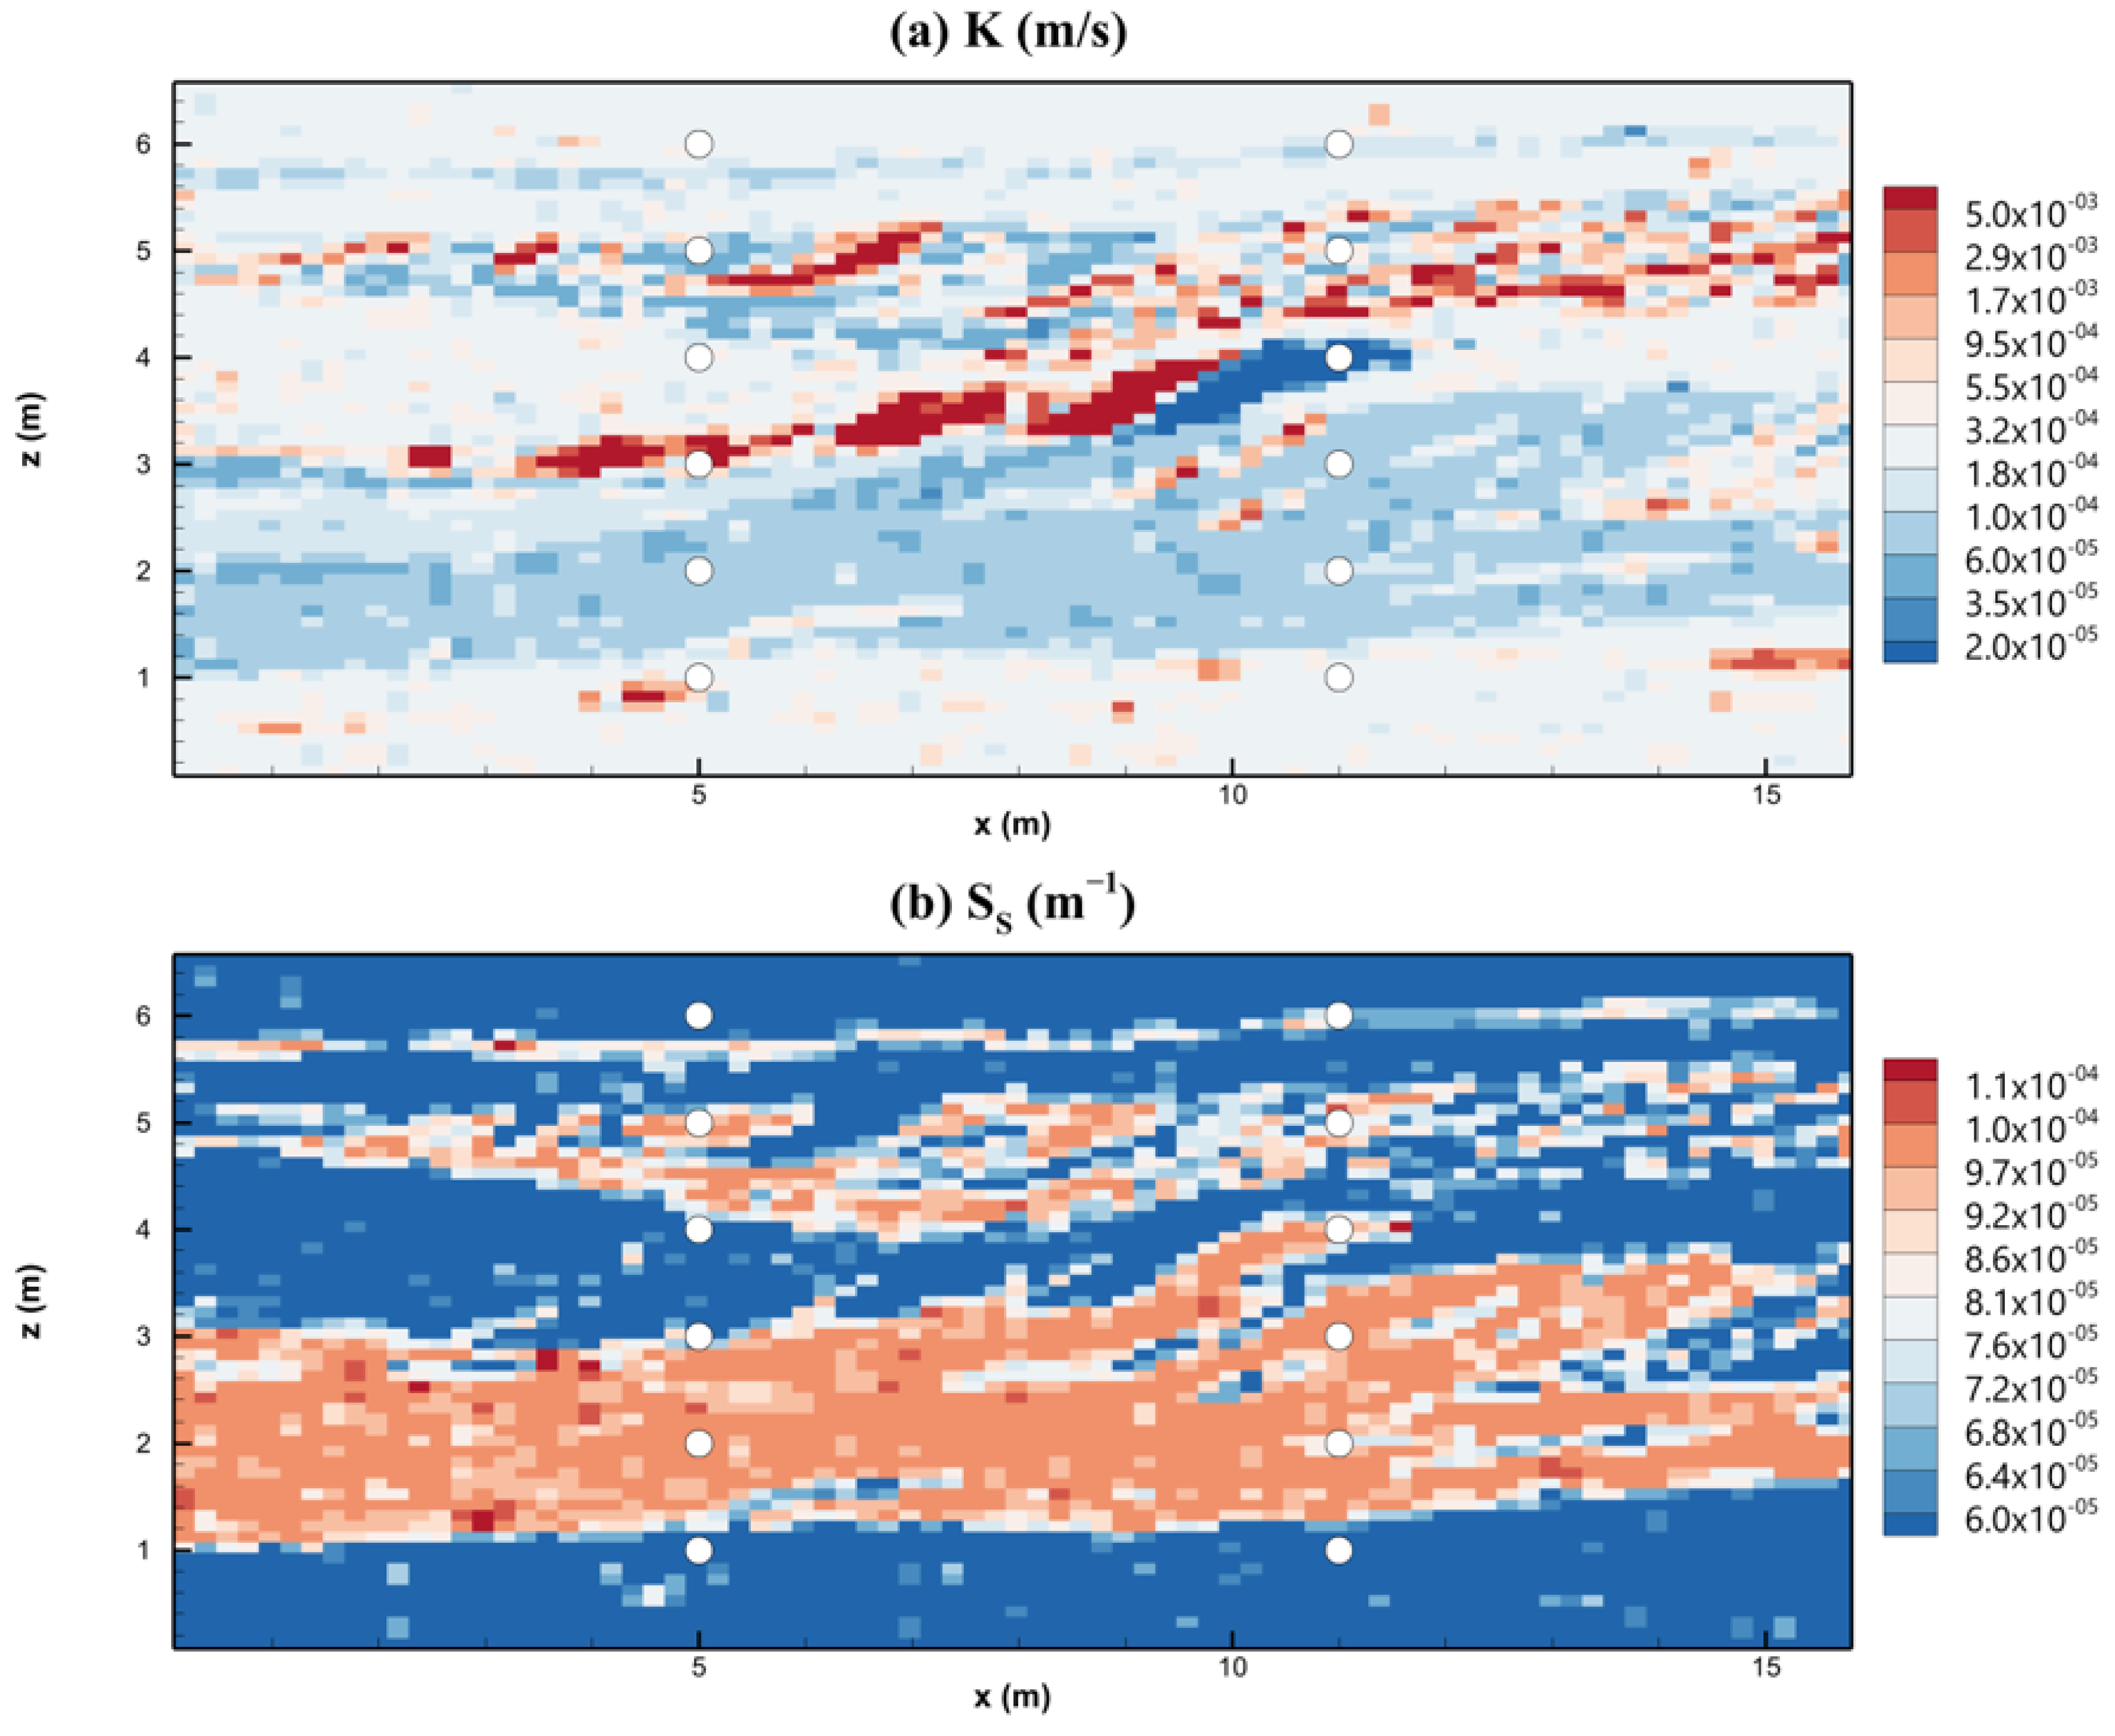
Figure 1. The distribution of true (a) K and (b) S S of the Herten analogue slice (the 12 white points are the positions of the injection and monitoring well screens).
Water 15 02401 g001
Figure 2. Geometry of the forward model and boundary condition settings (note the scale distortion). The inversion domain is between the two wells and inversion mesh is generated; S1–S6: 6 injection well screens; R1–R6: 6 observation well screens.
Water 15 02401 g002
Figure 3. Data processing in the calculation of (a) hydraulic travel times, head attenuation and (b) thermal tracer travel times.
Water 15 02401 g003
Figure 4. The inverted D distribution by hydraulic travel time inversion.
Water 15 02401 g004
Figure 5. The inverted S S distribution by hydraulic attenuation inversion.
Water 15 02401 g005
Figure 6. The inverted K distribution calculated by multiplying the inverted hydraulic diffusivity and inverted specific storage.
Water 15 02401 g006
Figure 7. The inverted K distribution by thermal tracer tomography.
Water 15 02401 g007
Figure 8. The inverted K distribution by geostatistical inversion.
Water 15 02401 g008
Figure 9. The R 2 and L 2 of estimated K , (a) calculated K by travel-time and attenuation inversion; (b) estimated K by thermal tracer tomography; (c) estimated K by geostatistical inversion.
Water 15 02401 g009
Table 1. Parameters in forward simulations.
VariableDescriptionValue
K p Hydraulic conductivity of the homogeneous aquifer2.1 × 10−3 m/s
S S p Specific storage of the homogeneous aquifer6.6 × 10−5 m−1
Q Injection rate5 L/s
H i n i t i a l Initial head of the confined aquifer0.2 m
T a m i b e n t Ambient temperature20 °C
T i n j e c t i o n Temperature of the injected water30 °C
ϕ Parameters porosity0.5
R Thermal retardation2.5
i The hydraulic gradient0.1
Table 2. Comparison of different methods.
Hydraulic Travel Time and Attenuation TomographyThermal Tracer TomographyGeostatistical Inversion
Requirementshigh-precision water head datathe injection water needs heatingpumping/injection needs to continue until head is stable
Advantageslow computational cost; low cost of testing timelow computational cost; less environmental noise in thermal signalhigher inversion resolution and broader inversion area
Disadvantagescalculated hydraulic conductivity contains more errors; environmental noise impactrequires a long testing timehigh computational cost
Disclaimer/Publisher’s Note: The statements, opinions and data contained in all publications are solely those of the individual author(s) and contributor(s) and not of MDPI and/or the editor(s). MDPI and/or the editor(s) disclaim responsibility for any injury to people or property resulting from any ideas, methods, instructions or products referred to in the content.