Article

Drought-Induced Salinity Intrusion Affects Nitrogen Removal in a Deltaic Ecosystem (Po River Delta, Northern Italy)

1
DiSAP—Department of Environmental and Prevention Sciences, University of Ferrara, Via L. Borsari 46, 44121 Ferrara, Italy
2
Department of Chemistry, Life Sciences and Environmental Sustainability, University of Parma, Parco Area delle Scienze 33/A, 43124 Parma, Italy
*
Author to whom correspondence should be addressed.
Water 2023, 15(13), 2405; https://doi.org/10.3390/w15132405
Submission received: 4 May 2023 / Revised: 16 June 2023 / Accepted: 27 June 2023 / Published: 29 June 2023
(This article belongs to the Section Water and Climate Change)

Abstract

:
In the summer of 2022, the Po River Delta (Northern Italy), a eutrophication hotspot, was severely affected by high temperatures, exceptional lack of rainfall and saline water intrusion. The effect of saline intrusion on benthic nitrogen dynamics, and in particular the N removal capacity, was investigated during extreme drought conditions. Laboratory incubations of intact sediment cores were used to determine denitrification and DNRA rates at three sites along a salinity gradient in the Po di Goro, an arm of the Po River Delta. Denitrification was found to be the main process responsible for nitrate reduction in freshwater and slightly saline sites, whereas DNRA predominated in the most saline site, highlighting a switch in N cycling between removal and recycling. These results provide evidence that salinity is a key factor in regulating benthic N metabolism in transitional environments. In a climate change scenario, salinity intrusion, resulting from long periods of low river discharge, may become an unrecognized driver of coastal eutrophication by promoting the dissimilatory nitrate reduction to ammonium and N recycling of bioactive nitrogen within the ecosystem, rather than its permanent removal by denitrification.

1. Introduction

Rivers draining highly exploited agricultural basins export large amounts of reactive nitrogen (N) to coastal waters, which may cause eutrophication in lagoonal and marine ecosystems [1,2,3]. In transitional environments, multiple biogeochemical reactions transform, temporarily retain, or permanently remove N species [4,5,6,7]. Sharp gradients of labile carbon, oxygen, salinity, and nutrients result in a continuously variable coupling among microbial reactions which, in turn, regulate N fate. Indeed, one of the most recognized ecosystem services of transitional environments is their ability to improve water quality, acting as biogeochemical filters that mitigate anthropogenic impacts on coastal environments by preventing excessive nutrient inputs [5,7].
Sediments are highly active sites for N cycling, especially for N removal through the coupled nitrification–denitrification process. Under favorable conditions, heterotrophic denitrification is the main sink for bioavailable N, resulting in its permanent N removal in the aquatic ecosystems via the reduction of N from nitrate (NO3) to dinitrogen gas (N2), which is released into the atmosphere [8,9,10]. Nitrification, the two-step chemoautotrophic oxidation of ammonium (NH4+) to nitrite (NO2) and NO3, provides oxidized substrates for denitrification [11]. The dissimilatory nitrate reduction to ammonium (DNRA), using the same substrates of denitrification (NO3 and organic carbon) can be an alternative microbial pathway for NO3 reduction. However, the first process removes the bioavailable N from the ecosystem, while the second recycles it [12]. Nitrification, denitrification and DNRA are functionally linked, and investigating their regulation drivers in coastal sediments is crucial to understanding the role of environmental stressor in the N biogeochemical processes.
The functioning of transitional environments is currently threatened by the interaction of eutrophication and climate change [13]. Climate change has been identified as one of the major challenges facing humanity in the 21st century, and the Mediterranean region is particularly vulnerable. Here, the IPCC Report (2022) [14] predicts a reduction in precipitation of up to 20% and an increase in the periodicity of droughts and extreme storm events [15,16]. By affecting the water temperature regime and the hydrodynamism of water masses, climate change not only shapes the timing and entity of N loads but may also affect their transformation and reduction in transitional environments, ultimately altering the capacity of these ecosystems to act as a natural N filters. Prolonged periods of elevated water temperature combined with low river discharge may increase water residence time, stratification, and saline intrusion and, hence, the extent of hypoxia or anoxia in bottom water and sediments [17,18,19,20]. Salinity, together with temperature and the availability of NO3 and organic carbon, is one of the main environmental factors regulating the partitioning between denitrification and DNRA. Therefore, saline intrusion caused by climate change may have a profound effect on N speciation and processing. In particular, salinity inhibits the activity of nitrifiers, thereby reducing the availability of NO3 for the denitrification process [21]. Conversely, DNRA has been shown to outcompete denitrification in organic-rich sediments during periods of summer saltwater intrusion [20,22,23] by enhancing NH4+ production. Thus, salinization can alter the dominant biogeochemical processes and the ability to provide the key ecosystem service of coastal N filtering [24].
The Po River Basin, an area of intense human activity with the fundamental role in the agricultural and industrial sectors in Italy, is a NO3 pollution hotspot, causing severe eutrophication in the north-western Adriatic coast. The Po Delta has recently been identified as a buffer zone for NO3 loads via denitrification during the summer season, the main sensitive period for eutrophication, due to the warm temperature [25]. However, this capacity may be threatened by climate change, the effects of which (e.g., increased frequency of droughts, temperature warming, and saline intrusion) have already been observed in the Po Basin over the last twenty years [25,26,27]. In particular, the extreme drought of spring and summer 2022 in the Po Delta determined a persistent saline intrusion along the branches of the Po River [27], which could alter the proportion of NO3 dissimilated by denitrification or by DNRA. The study of this partitioning of NO3 consumption, despite its great ecological importance, has not yet been adequately addressed.
The aim of the present study was to assess the effects of the summer saline intrusion of 2022 on the N cycling in the sediments of the Po Delta. Denitrification and DNRA rates were measured along a salinity gradient in the Po di Goro, the southernmost arm of the Po River and representative of the whole Po Delta and other transitional ecosystems increasingly affected by climate change-related phenomena.

2. Materials and Methods
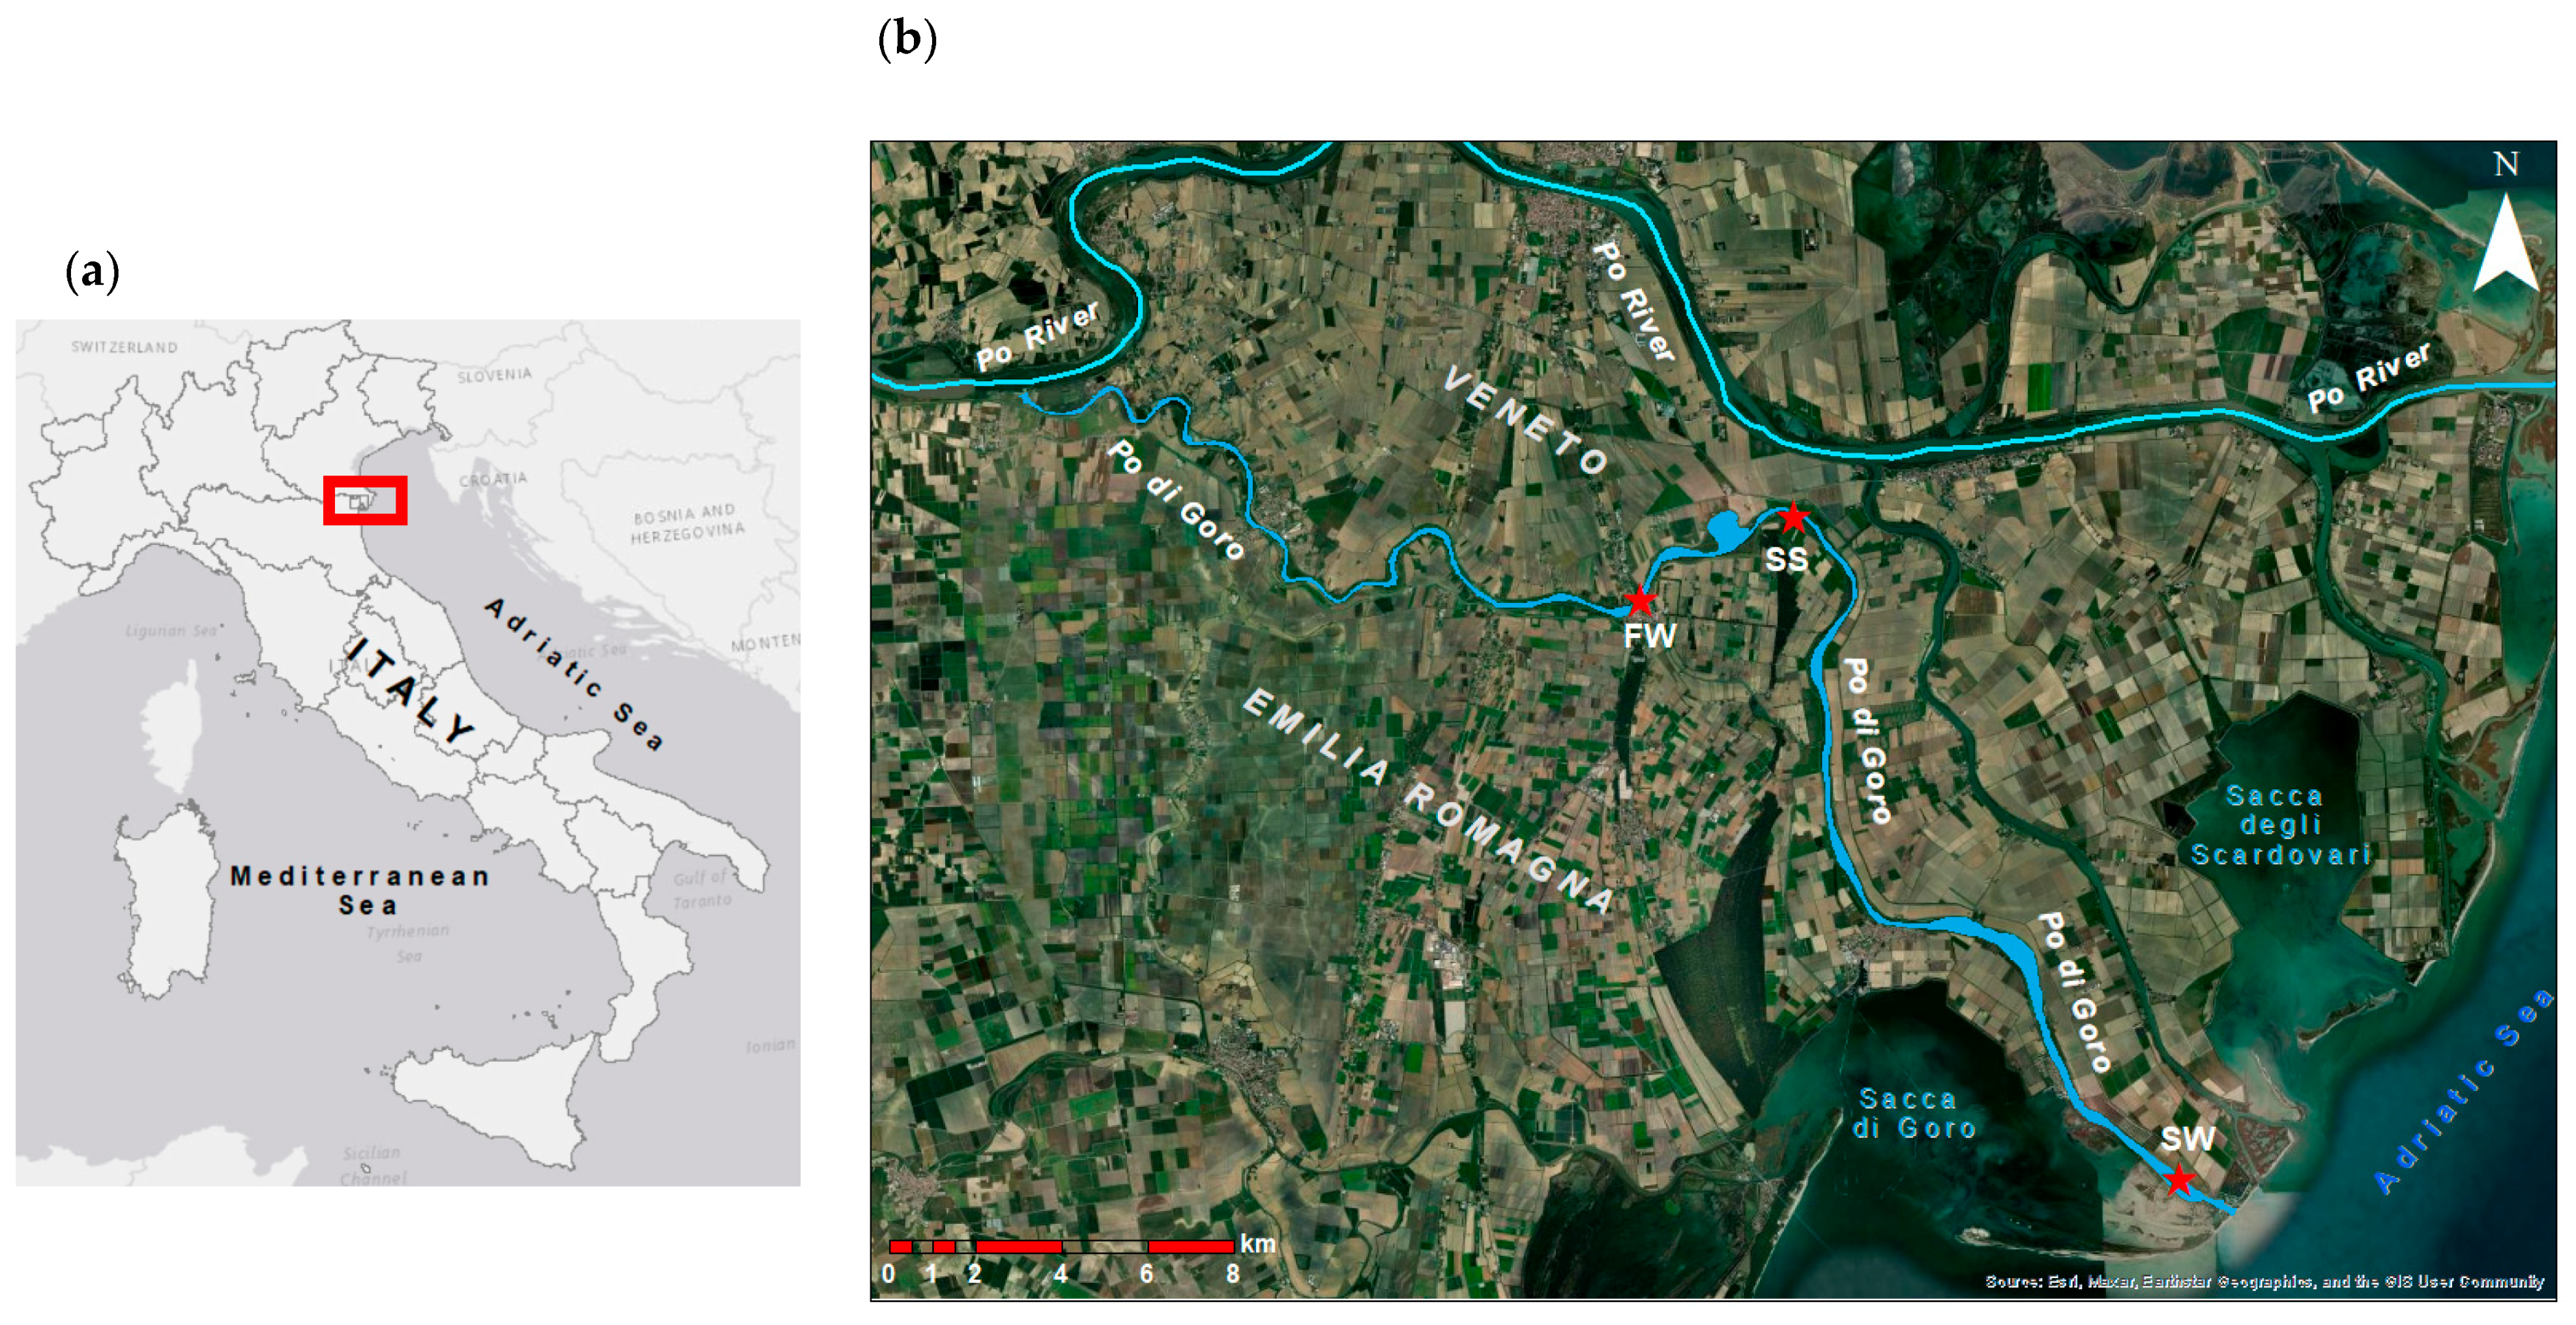
2.1. Area of Study

The Po di Goro is the southernmost of the five branches of the Po River Delta, originating near the town of Serravalle (province of Ferrara) and marking the border between the Emilia-Romagna and Veneto regions as far as the Adriatic Sea (Figure 1). Its average summer discharge represents approximately 15% of the flow of the Po River, which is monitored at Pontelagoscuro (Ferrara, Italy) at the closing section of the Po River Basin [26]. The Po di Goro is one of the main freshwater inputs to the Sacca di Goro (26 km2), the southernmost lagoon of the Po Delta, identified as the most important European site for the production of Manila clam. Since the 1980s, the lagoon has suffered from macroalgal blooms due to excessive nutrient loads, causing summer anoxic crises and dystrophic outbreaks [27].

2.2. Sediment and Water Sampling

The sediment cores were taken on 28th June 2022, when the Po River was already in an extreme drought and the average water temperature (28 ± 1 °C) was significantly higher than in the previous summer (25 ± 0.5 °C) [7]. The lack of rainfall and the consequent reduction in the flow of the Po River caused a deep and persistent saline intrusion into the delta, extending the mixing zone between freshwater and seawater [28]. Three sampling sites (Figure 1) were selected on the basis of chemical parameters, in particular the salinity conditions along the vertical profile. The first station was located in Mesola (44°55′31.6″ N, 12°13′53.3″ E), 27 km upstream of the Po outlet, and was labeled as the freshwater site (FW). Here, the conductivity values were still typical of Po freshwater (approximately 400 µS cm−1 on the top; Figure 2). At the sightly saline site (SS; 44°56′32.8″ N, 12°16′41.8″ E), located 22 km upstream of the river mouth, the salinity profile showed values between 1.0 and 5.4 ppt from the surface to the bottom. The saline water site (SW; 44°47′59.0″ N, 12°23′00.3″ E) was located in a section 1.5 km upstream of the Po di Goro outlet.
The vertical profiles of the physical conditions (water temperature, oxygen, electrical conductivity, and salinity) were measured at the three sites using multiparametric probe (YSI ODO/CT), operated from the boat in the middle of the river section. The water samples from the sites were filtered and stored at −20 °C to be analyzed in the next two weeks. Intact sediment cores (Plexiglass liners, internal diameter: 4.5 cm, length: 20 cm) were collected from the boat using a hand corer and immediately immersed with site water in separate tanks corresponding to the sampling sites, continuously aerated with portable pumps, and transported to the laboratory. From each site, 50 L of bottom water were collected using a submerged pump for core maintenance during pre-incubation and incubation phases in laboratory. At each station, five intact sediment cores were used for dark flux and N process measurements and three replicates for sediment characterization. Cores stabilization and incubation were performed according to a standard protocol [29].

2.3. Benthic Flux Measurements and Sediment Characterization

Upon arrival at the laboratory, five sediment cores from each of the three sites were transferred to three separate tanks filled with unfiltered in situ water, submerged, and recirculated by the mean of a Teflon-coated magnetic bar rotating at 40 rpm, added a few centimeters above the sediment surface, useful for mixing the core water column, avoiding resuspension. The cores were kept at in situ temperature (28 °C) by a thermostat connected to the tanks during the first night in laboratory. The next day, prior to the start of the incubation, the water tanks were replaced with water from each sampling site to maintain nutrient concentrations close to those in situ. At the start of incubation, the water in the tanks was removed to resubmerge the intact cores, and each core was closed with a gas-tight lid on the top.
Before and after the incubation, physical parameters such as temperature and oxygen concentration were measured directly inside the cores, using the same probe as the sampling probe, and water samples were taken from each core using a glass 60 mL syringe, filtered thought Whatman GF/F glass fiber filters (pore size: 0.45 µm), transferred to 20 mL polyethylene scintillation vials, and frozen before the determination of dissolved inorganic N concentrations (NO3, NO2, and NH4+). Dark incubation was applied for 2 h to keep the variation of the O2 concentration within 20% of the initial value throughout the incubation [29]. Dark conditions were imposed to reproduce the in situ benthic conditions of the Po di Goro, always in darkness, as the depth ranged from 3 to 6 m, and the light penetration was limited by phytoplanktonic high turbidity. In the following days, water samples were analyzed according to standard protocols. The nitrate was analyzed with a Technicon AutoAnalyser II (detection limit: 0.4 μM [30]); NO2 was determined with sulfanilamide and N-(1-naphtyl)-ethylenediamine (detection limit: 0.1 μM [31]) using a Jasco V-550 double-beam spectrophotometer at 541 nm; and NH4+ was analyzed using salicylate and hypochlorite in the presence of sodium nitroprusside (detection limit: 0.5 μM [32]) and determined with the same spectrophotometer at 640 nm. The concentrations of the solutes together with the incubation time were used to calculate the dark fluxes (Fx, μmol m−2 h−1) at the sediment–water interface, according to Equation (1):
F x = C t C 0   ·   V A   ·   t
where C0 (μM) is the concentrations of the species at the beginning of the incubation, Ct is the concentrations of the same species at the end of incubation, V (L) is the water column volume present in each core, A (m2) is the sediment surface, and t (h) is the incubation time. The negative values describe the net consumption of species from the water column to the sediment, and positive values indicate the net production, so the fluxes are determined from the sediment to the water column (net production).
Three additional cores from each sampling site were used to determine the physical properties of the sediments. The porosity and water content (%) were determined using the wet weight loss method. The upper 0–2 cm layer (divided into two parts: 0–1 and 1–2 cm layers) was cut from each core, and after being homogenized using a spatula, a sub-sample of 5 mL was collected using cut-off syringes and dried for 72 h at 50 °C; the samples were then transferred to a muffle furnace at 350 °C for 3 h to quantify the organic matter content (OM, %) using the same weight loss method.

2.4. Measurement of Denitrification and DNRA Rates

At the end of the first incubation, the water was replaced with the water of sampling site and the intact cores were resubmerged for approximately 1 h to stabilize before the following incubation. Then, the water level in the tank was lowered again and the isotope pairing technique (IPT [33]) was applied to measure the denitrification rates. An aliquot of a 15 mM 15NO3 stock solution (Na15NO3, Sigma Aldrich, USA) was added in the water column of each core to achieve a final 15N atomic % enrichment of at least ~50%. Water samples were collected in each core before and after the addition of 15NO3 to calculate the 14N:15N ratio in the NO3 pool. As in the first incubation, the cores were sealed with a gas-tight lid on the top and incubated for 2 h in the dark. At the end of the incubation, in each core the sediment and water phases were gently mixed to homogenize the N2 pools dissolved in the aqueous phase and in the pore water. From each core, an aliquot of the slurry was transferred to a 12 mL glass-tight vial (Exetainer®, Labco Limited, UK), fixed with 200 μL of 7 M ZnCl2 to stop microbial activity and kept refrigerated with the upside down orientation until the analysis in the following days. The water samples were analyzed using a Membrane Inlet Mass Spectrometer equipped with a copper reduction column maintained at 600 °C (MIMS, Bay Instrument, MD, USA [34]) to determine the abundance of 29N2 and 30N2. The denitrification rates were calculated using Equations (2) and (3), as follows [33]:
D 15 = p 29 + 2 p 30
D 14 = D 15   ·   p 29 2 p 30
where D15 is the denitrification rate of the labeled 15NO3, and D14 is the total denitrification rate; p29 and p30 are the production rate of 29N2 and 30N2, respectively.
The total denitrification rate (Dtot) was calculated as the sum of Dw (i.e., the denitrification of NO3 diffusing from the water column to the sediment) and Dn (i.e., the denitrification of NO3 produced in the superficial oxic sediment by nitrification). The rates were calculated according to the following equations [33] and expressed in µmol N m−2 h−1.
D tot = D w + D n
D w = N 14 O 3 N 15 O 3   ·   D 15
D n = D 14 D w
The denitrification efficiency (DE, %) is the ratio between the denitrification and the total fluxes of inorganic N from the sediment, both in ionic (NO3 + NO2 + NH4+) and gaseous (N2) form, calculated according to Equation (7) [35]:
DE = Dtot DIN + Dtot   ·   100
where DIN (µmol N m−2 h−1) is the sum of inorganic N fluxes (NO3 + NO2 + NH4+) directed from the sediment to the water column (effluxes), and Dtot is the total efflux of N2 from the sediment.
After IPT incubation, an additional aliquot (30 mL) of the sediment slurry was sampled from each core to determine the DNRA rates from the production of 15NH4+, according to the procedure reported by Magri et al. [36]. Briefly, the slurry was treated with 2 g of KCl (2 M) in 50 mL falcon tubes to determine the exchangeable ammonium pool, comprehensive of the 15NH4+ fraction. The samples were shaken for 30 min, centrifuged (1800 rpm for 15 min), filtered (Whatman GF/F glass fiber filters, pore size: 0.45 µm), transferred into 20 mL scintillation vials and frozen. At the time of the analyses, the samples were diluted (1:5) and air-purged for 10 min to eliminate 29N2 and 30N2 pools generated during the IPT incubation. A 12 mL aliquot of each purged sample was transferred to Exetainers, and a volume of 200 µL of alkaline hypobromite solution was added to oxidize NH4+ to N2 [37]. After oxidation, the 29N2 and 30N2 concentrations were determined using MIMS. The total DNRA rates (µmol N m−2 h−1) were calculated according to [38] as the DNRA of NO3 from the water column (DNRAw; µmol N m−2 h−1) and the DNRA coupled to nitrification (DNRAn; µmol N m−2 h−1), according to the Equations (8)–(10), as follows:
DNRA =   p 15   NH 4 +   ·   D 14 D 15
DNRA w = N 14 O 3 N 15 O 3   ·   p 15   NH 4 +
DNRA n = DNRA   DNRA w
where p15NH4+ is the production of 15NH4+.

2.5. Statistical Analysis

One-way ANOVA and pairwise multiple comparisons of the means (post hoc and Tukey’s test) were used to determine the difference in the N fluxes, denitrification and DNRA rates among the three sampling sites. The Shapiro–Wilk and Levene’s tests were used to check whether the data had a normal distribution and to determine the homogeneity of the variance, respectively. The statistical analysis, with the significance level set at p < 0.05, was performed using Sigma Plot 14.5 (Systat Software, Inc., San Jose, CA, USA).

3. Results and Discussion

3.1. The Summer Drought of 2022

The spring and summer months of 2022 will be remembered for the severe drought that affected large areas of Europe, combined with long and intense heat waves that spread from the Iberian Peninsula to Northern and Central Europe, also affecting Italy [39]. In particular in the north of Italy, the dry conditions were a result of low snow accumulation in the Alps during the winter and early spring of 2021–2022, similar to the year 2015 [40], and a persistent lack of precipitation in late spring and early summer [28], combined with early heat waves in May and June. According to Italian reports, the period from May to July 2022 was indicated as the warmest months in the recent decades, although other summers were just as dry, such as in the years 2003 and 2009 [41]. This critical period was confirmed by water temperature and discharge data for the Po River (Figure 3), measured throughout the whole of 2022 at the basin’s closing section. The water temperature was steadily higher than the 2000–2021 average monthly values, with the maximum discrepancy recorded in the second half of May (+5 °C) and an average positive anomaly of 2.5 °C throughout the summer and until mid-autumn. The Po River was enduring an exceptional hydrological drought, with an average discharge deficit of approximately 60% during the whole of 2022 (Figure 3). The daily river discharge was particularly low during June–August, at or below the historical minimum of the last twenty years. The most negative monthly anomaly at the closing section occurred in July when the discharge was approximately 30% below the historical minimum for 2000–2021, which occurred in July 2006 [42]. The water shortage lasted until August, when the hydrological situation improved after some storms, although the flow remained below typical seasonal values. The critical reduction in the river discharge led to a significant intrusion of the deep and persistent saline wedge during late spring and summer in the Po Delta, extending along the Po di Goro branch for a maximum length of approximately 35 km from the mouth [43], more than the 15 km of saline intrusion in Po di Goro during the summer of 2017. In particular, the slightly saline site (SS) was identified at a greater distance from the Po di Goro outlet compared to the previous year [7].
The in situ conditions were different for the three sites, in particular the salinity varied along the Po di Goro River, starting from 1.5 mg L−1 in the bottom of the FW site to 30.1 mg L−1 in the SW site, and also along the vertical profile in each sampling site (Figure 3a). The FW site showed homogeneity of water, while the SS and SW sites showed an increase in the saline concentrations from the surface to the bottom water, highlighting the water stratification. Moreover, the water stratification was also confirmed with the vertical profile of the concentration of oxygen (Figure 3b). As can be seen, the oxygen concentration was distributed equally in the FW site, indicating the continued mixing in of the freshwater systems of the Po River, different from the other sites. The SS and SW sites showed a reduction in the oxygen concentrations along the vertical profile, in particular for the SS site, where the concentrations reduced down to 2.9 mg L−1 at the bottom (Table 1). The sampling sites were different also in the composition and physical properties of the surface sediments: sandy and low organic matter (OM, %) at the FW site, muddy–sandy and with high organic matter at the SS site, and mostly clay at the SW site; the highest porosity was found at the SS and SW sites (Table 2).

3.2. Benthic N Fluxes along the Salinity Gradient

Because of the low spring rainfall and Po flows, nitrate concentrations were generally low in summer 2022, decreasing from ~40 μM at the FS to the very low value of ~10 μM at the most downstream station SW (Table 1). This decrease along with the increasing salinity gradient is not surprising and is mainly due to a mixed contribution of removal processes along the river and dilution with seawater. In all three stations, sediment–water fluxes of oxidized N species (NO3 + NO2) were negative, indicating that consumption prevailed over production in the sediments of the Po di Goro River, and the removal rates depended on the availability of NO3 in the overlying bottom water. The rates of NOx consumption (with NO3 always representing >95% of NOx) decreased significantly with the increasing salinity (p < 0.05, Table 3) along the river–sea gradient, from FW (−245 ± 36 µmol N m−2 h−1) to SS (−154 ± 31 µmol N m−2 h−1) and to the more marine station SW (−70 ± 23 µmol N m−2 h−1). A good agreement was found between the NOx removal rates and the N2 production rates, but the latter were always slightly higher on average, suggesting that denitrification was not only fueled by the diffusion of NO3 from the water column into the sediment (Figure 4).
The denitrification rates decreased along the salinity gradient (p < 0.001, Table 3), likely due to the cumulative effect of the NO3 availability, which decreased progressively downstream (Table 1), and the bottom water oxygen concentration, which was high at the well-mixed freshwater station FW, low at the stratified intermediate station SS, and again high at the stratified saline station SW (Figure 2), influencing the N availability along the vertical profile. The denitrification rates were the highest at the FW station (368 ± 45 µmol N m−2 h−1), where NO3 was more available (~30 µM), and there was continuous freshwater mixing [44]. The intermediate station had almost the same NO3 concentration (Table 1), but the denitrification rates were lower (274 ± 19 µmol N m−2 h−1), likely due to the onset of water stratification, affecting the diffusion of NO3 in water column. The Dtot was not significantly different between the FW and SS sites, but it was significantly higher in both the FW and SS than in the SW station, according to Tukey’s test (Table 3). The lowest oxygen concentration measured in the bottom water at SS station was probably because of the sediment OM content, which was the highest at this site (Table 2), and its mineralization. Here, the high organic matter content was due to the flocculation of the particulate organic load induced by the mixing of salt and fresh water, which caused the riverine organic carbon to form sinking aggregates [45,46]. The most downstream station (SW) had the lowest denitrification rates (77 ± 9 µmol N m−2 h−1), likely due to the lowest NO3− concentration (Table 1), water column stratification and high oxygen concentration in the bottom water (Figure 2). Bacterial communities, such as nitrifiers and denitrifiers, have been shown to be physiologically stressed by salinity. In addition, when other electron acceptors, such as NO3 and O2, are limited, saltwater intrusion promotes sulphate reduction, leading to sulphide accumulation, which directly inhibits nitrification and denitrification [47,48].
At all sampling sites, the NH4+ fluxes were positive, indicating a higher production than consumption (Figure 4) and systematically higher than the corresponding N2 production rate. Although not significant (Table 3), the release of NH4+ was slightly higher at the SS site, where the sediment organic matter concentration was higher (~4%) than at the other two stations. The denitrification efficiency was approximately 90% at FW, indicating that the sediments lost N mostly as N2, while it decreased to 32% at the most downstream station, where the sediments tended to be sources of inorganic N ions that were recycled to the water column. The marked decrease in DE at the site closer to the Po di Goro outlet has a very important ecological consequence.

3.3. Denitrification and DNRA Rates

At the FW station, Dtot was 368 ± 45 µmol N m−2 h−1, decreasing to 274 ± 19 µmol N m−2 h−1 and 77 ± 9 µmol N m−2 h−1 at the SS and SW stations, respectively. At the FW station, Dw was still 55% of Dtot, while because of the extreme drought condition, water column stratification and, thus, reduced NO3 supply from the water column, Dw was a lower fraction of the total, 35% and 48% of Dtot at the SS and SW stations, respectively. Both availability of NO3 in the water column and oxygen concentration regulated the partitioning of the total rates into Dw and Dn [9]. In the freshwater site, the denitrification was mostly supported by the nitrate present in the water column (Dw~65%), while the contributions of Dw and Dn were almost equal at the SW site (Figure 5), which was confirmed by Tukey’s test (Table 3), which highlighted a difference in Dw among the three sampling sites, while the differences in Dn appeared between FW and SW or SS and SW but not between FW and SS. The Dn rates strongly decreased at SW likely due to the occurrence of salinity-induced sulphidic conditions inhibiting the nitrification process [28,49] and the loss of NO3 via coupled nitrification–denitrification [50].
DNRA process was always detected, but the rates at the first two sites were one order of magnitude lower than the corresponding denitrification rates. In fact, denitrification consistently outperformed DNRA in freshwater and slightly saline sites, while the two processes were almost equally important in the more saline site. While denitrification along the salinity gradient to the sea decreased (p < 0.001), DNRA increased (p < 0.05), with the highest DNRA rate measured at the SW site (116 ± 29 µmol N m−2 h−1) (Figure 5, Table 3), followed by the FW and SS sites (55 ± 9 and 27 ± 8 µmol N m−2 h−1, respectively), and significant statistical differences appeared between SS and SW, according to the post hoc Tukey’s test (Table 3). The DNRA rates were slightly higher than the denitrification rates at SW, suggesting that saline conditions may favor DNRA over denitrification [6]. Nevertheless, DNRAw was slightly higher than DNRAn at the FW and SS sites (56% and 68% of DNRAtot, respectively), while at SW site the DNRAn was higher than the DNRAw, due to limited NO3 availability in the water column (65 ± 4 and 50 ± 8 µmol N m−2 h−1, respectively).
Denitrification was the dominant pathway for NO3 reduction in freshwater and slightly saline conditions, outperforming DNRA by an average factor of 7. DNRA was low at the FW and SS stations, and the consumption of NO3 by the DNRA process, calculated as the percentage ratio of the DNRA:NO3 flux, was 14% and 11%, respectively. At the SW station, the DNRA:NO3 flux ratio increased to 74%, likely due to the decrease in the NO3 concentration and the higher salinity conditions which favor NO3 reduction to NH4+ [6,51,52]. According to several authors [10,52,53], DNRA is favored over denitrification at high salinity conditions, low NO3 availability, and where the presence of sulphide inhibits coupled nitrification–denitrification [47,54].
The DNRA rates measured in the Po River Delta are in line with rates obtained in other aquatic ecosystems of the Po River Basin (lakes and lagoons) and in other brackish environments in summer (Table 4) [36,55]. This comparison (Table 4) confirms that the DNRA process was stimulated by saline conditions; in fact, the higher rates occurred in Goro Lagoon (Italy) and in Plum Island Sound estuary (Massachusetts) [55,56], where the salinity was 28‰ and 25‰, respectively. Moreover, DNRA rates increased along the NO3 availability gradient and when sediments were more OM rich, such as in the Goro Lagoon [55].
In the Po di Goro arm, the maximum saline intrusion was recorded in August and reached 38 km upstream from the mouth [61]. Extending the denitrification rates presented here to the river stretch affected by saline intrusion, the N dissipation capacity via denitrification of the entire Po di Goro arm was estimated to be reduced by 33% of the value measured in June. This simulation highlights the need to gather further information on saline intrusion and the relative effects on denitrification and DNRA and, hence, on N load dissipation vs. recycling, induced by extreme drought conditions, which may have relevant impacts on nutrient availability and eutrophication in coastal ecosystems.

4. Conclusions

Global warming affects aquatic ecosystems in terms of N cycling and nutrient availability. The drought observed in the summer of 2022 decreased the Po River discharge, also reducing N loads and N availability in the delta. At the same time, low discharge caused an extensive saline intrusion in most of the Po River Delta, which by the end of June had already reached sections ~30 km upstream of the Adriatic Sea.
The present results show that global warming and reduced precipitation are altering nitrogen cycling in transitional ecosystems, decreasing denitrification and nitrate removal and increasing DNRA and NH4+ release from sediments. Prolonged drought and saline water intrusion, by favoring DNRA over denitrification (i.e., N recycling rather than removal) may have negative effects on coastal eutrophication in the spring and summer seasons, reducing the effectiveness of transitional environments to remove nitrogen and increasing N export to the sea.
DNRA is still one of the least understood N cycling processes in aquatic ecosystems. The results presented here are the first quantification of denitrification and DNRA in the Po Delta and indicate that drought and saline intrusion may regulate benthic N dynamics, N load speciation, and eutrophication in coastal ecosystems. Further studies are needed to clarify the specific role of extreme meteorological conditions on aquatic ecosystems and biogeochemical processes, including the effects of multiple drivers, such as NO3 and organic carbon availability, as well as sediment sulphide concentrations, and why they will become more important as extreme conditions worsen because of climate change.

Author Contributions

Conceptualization, M.P.G., E.S. and G.C.; methodology, E.S., M.M., F.V. and G.C.; investigation, M.P.G., E.S., F.V., M.M. and G.C.; resources, F.V.; formal analysis, M.P.G. and M.M.; writing—original draft preparation, M.P.G.; writing—review and editing, E.S., M.M. and G.C.; visualization, M.P.G.; funding acquisition, G.C. and E.S.; supervision, G.C. All authors have read and agreed to the published version of the manuscript.

Funding

This work was financially supported by the Emilia-Romagna Region (project Post LIFE AGREE—“Monitoring of the Valle di Gorino, Sacca di Goro, for the definition of a management plant in line with the Water Framework Directive”) and by the local water authority, Consorzio di Bonifica Pianura di Ferrara, within a collaboration aimed at defining management strategies for the control of eutrophication in the Po River Delta.

Data Availability Statement

Data will be made available upon request.

Acknowledgments

The authors would like to thank Mattia Lanzoni and Luca Bellini for their help during the sampling campaign.

Conflicts of Interest

The authors declare no conflict of interest.

References

  1. Dugdale, R.C.; Wilkerson, F.P.; Hogue, V.E.; Marchi, A. The Role of Ammonium and Nitrate in Spring Bloom Development in San Francisco Bay. Estuar. Coast. Shelf Sci. 2007, 73, 17–29. [Google Scholar] [CrossRef]
  2. Howarth, R.W. Coastal Nitrogen Pollution: A Review of Sources and Trends Globally and Regionally. Harmful Algae 2008, 8, 14–20. [Google Scholar] [CrossRef]
  3. Kroeze, C.; Bouwman, L.; Seitzinger, S. Modeling Global Nutrient Export from Watersheds. Curr. Opin. Environ. Sustain. 2012, 4, 195–202. [Google Scholar] [CrossRef]
  4. Cornwell, J.C.; Kemp, W.M.; Kana, T.M. Denitrification in coastal ecosystems: Methods, environmental controls, and ecosystem level controls, a review. Aquat. Ecol. 1999, 33, 41–54. [Google Scholar] [CrossRef]
  5. Santoro, A.E. Microbial Nitrogen Cycling at the Saltwater–Freshwater Interface. Hydrogeol J. 2010, 18, 187–202. [Google Scholar] [CrossRef]
  6. Zhou, Z.; Ge, L.; Huang, Y.; Liu, Y.; Wang, S. Coupled Relationships among Anammox, Denitrification, and Dissimilatory Nitrate Reduction to Ammonium along Salinity Gradients in a Chinese Estuarine Wetland. J. Environ. Sci. 2021, 106, 39–46. [Google Scholar] [CrossRef]
  7. Gervasio, M.P.; Soana, E.; Vincenzi, F.; Castaldelli, G. An Underestimated Contribution of Deltaic Denitrification in Reducing Nitrate Export to the Coastal Zone (Po River–Adriatic Sea, Northern Italy). Water 2022, 14, 501. [Google Scholar] [CrossRef]
  8. Tiedje, J.M.; Sexstone, A.J.; Myrold, D.D.; Robinson, J.A. Denitrification: Ecological Niches, Competition and Survival. Antonie Van Leeuwenhoek 1983, 48, 569–583. [Google Scholar] [CrossRef]
  9. Piña-Ochoa, E.; Álvarez-Cobelas, M. Denitrification in Aquatic Environments: A Cross-System Analysis. Biogeochemistry 2006, 81, 111–130. [Google Scholar] [CrossRef]
  10. Burgin, A.J.; Hamilton, S.K. Have We Overemphasized the Role of Denitrification in Aquatic Ecosystems? A Review of Nitrate Removal Pathways. Front. Ecol. Environ. 2007, 5, 89–96. [Google Scholar] [CrossRef] [Green Version]
  11. Heil, J.; Vereecken, H.; Brüggemann, N. A Review of Chemical Reactions of Nitrification Intermediates and Their Role in Nitrogen Cycling and Nitrogen Trace Gas Formation in Soil: Chemical Reactions of Nitrification Intermediates in Soil. Eur. J. Soil Sci. 2016, 67, 23–39. [Google Scholar] [CrossRef]
  12. Scott, J.T.; McCarthy, M.J.; Gardner, W.S.; Doyle, R.D. Denitrification, Dissimilatory Nitrate Reduction to Ammonium, and Nitrogen Fixation along a Nitrate Concentration Gradient in a Created Freshwater Wetland. Biogeochemistry 2008, 87, 99–111. [Google Scholar] [CrossRef]
  13. Xia, R.; Zhang, Y.; Critto, A.; Wu, J.; Fan, J.; Zheng, Z.; Zhang, Y. The Potential Impacts of Climate Change Factors on Freshwater Eutrophication: Implications for Research and Countermeasures of Water Management in China. Sustainability 2016, 8, 229. [Google Scholar] [CrossRef] [Green Version]
  14. Pörtner, H.-O.; Roberts, D.C.; Tignor, M.; Poloczanska, E.S.; Mintenbeck, K.; Alegría, A.; Craig, M.; Langsdorf, S.; Löschke, S.; Möller, V. (Eds.) IPCC, 2022: Climate Change 2022: Impacts, Adaptation and Vulnerability. Contribution of Working Group II to the Sixth Assessment Report of the Intergovernmental Panel on Climate Change; Cambridge University Press: Cambridge, UK; New York, NY, USA, 2022; p. 3056. [Google Scholar]
  15. Gao, X.; Giorgi, F. Increased Aridity in the Mediterranean Region under Greenhouse Gas Forcing Estimated from High Resolution Simulations with a Regional Climate Model. Glob. Planet. Change 2008, 62, 195–209. [Google Scholar] [CrossRef]
  16. Carvalho, D.; Pereira, S.; Silva, R.; Rocha, A. Aridity and Desertification in the Mediterranean under EURO-CORDEX Future Climate Change Scenarios. Clim. Change 2022, 174, 28. [Google Scholar] [CrossRef]
  17. Howarth, R.W.; Swaney, D.P.; Butler, T.J.; Marino, R. Rapid Communication: Climatic Control on Eutrophication of the Hudson River Estuary. Ecosystems 2000, 3, 210–215. [Google Scholar] [CrossRef]
  18. Feyen, L.; Dankers, R. Impact of Global Warming on Streamflow Drought in Europe. J. Geophys. Res. 2009, 114, D17116. [Google Scholar] [CrossRef]
  19. Statham, P.J. Nutrients in Estuaries—An Overview and the Potential Impacts of Climate Change. Sci. Total Environ. 2012, 434, 213–227. [Google Scholar] [CrossRef]
  20. Osborne, R.I.; Bernot, M.J.; Findlay, S.E.G. Changes in Nitrogen Cycling Processes Along a Salinity Gradient in Tidal Wetlands of the Hudson River, New York, USA. Wetlands 2015, 35, 323–334. [Google Scholar] [CrossRef]
  21. Xie, R.; Rao, P.; Pang, Y.; Shi, C.; Li, J.; Shen, D. Salt Intrusion Alters Nitrogen Cycling in Tidal Reaches as Determined in Field and Laboratory Investigations. Sci. Total Environ. 2020, 729, 138803. [Google Scholar] [CrossRef]
  22. Giblin, A.E.; Weston, N.B.; Banta, G.T.; Tucker, J.; Hopkinson, C.S. The Effects of Salinity on Nitrogen Losses from an Oligohaline Estuarine Sediment. Estuaries Coasts 2010, 33, 1054–1068. [Google Scholar] [CrossRef]
  23. Marchant, H.K.; Lavik, G.; Holtappels, M.; Kuypers, M.M.M. The Fate of Nitrate in Intertidal Permeable Sediments. PLoS ONE 2014, 9, e104517. [Google Scholar] [CrossRef]
  24. Herbert, E.R.; Boon, P.; Burgin, A.J.; Neubauer, S.C.; Franklin, R.B.; Ardón, M.; Hopfensperger, K.N.; Lamers, L.P.M.; Gell, P. A Global Perspective on Wetland Salinization: Ecological Consequences of a Growing Threat to Freshwater Wetlands. Ecosphere 2015, 6, art206. [Google Scholar] [CrossRef]
  25. Gervasio, M.P.; Soana, E.; Granata, T.; Colombo, D.; Castaldelli, G. An Unexpected Negative Feedback between Climate Change and Eutrophication: Higher Temperatures Increase Denitrification and Buffer Nitrogen Loads in the Po River (Northern Italy). Environ. Res. Lett. 2022, 17, 084031. [Google Scholar] [CrossRef]
  26. Bellafiore, D.; Ferrarin, C.; Maicu, F.; Manfè, G.; Lorenzetti, G.; Umgiesser, G.; Zaggia, L.; Levinson, A.V. Saltwater Intrusion in a Mediterranean Delta Under a Changing Climate. J. Geophys. Res. Ocean. 2021, 126, e2020JC016437. [Google Scholar] [CrossRef]
  27. Viaroli, P.; Giordani, G.; Bartoli, M.; Naldi, M.; Azzoni, R.; Nizzoli, D.; Ferrari, I.; Comenges, J.M.Z.; Bencivelli, S.; Castaldelli, G.; et al. The Sacca Di Goro Lagoon and an Arm of the Po River. In Estuaries; Wangersky, P.J., Ed.; The Handbook of Environmental Chemistry; Springer: Berlin/Heidelberg, Germany, 2005; Volume 5H, pp. 197–232. ISBN 978-3-540-00270-3. [Google Scholar]
  28. Bonaldo, D.; Bellafiore, D.; Ferrarin, C.; Ferretti, R.; Ricchi, A.; Sangelantoni, L.; Vitelletti, M.L. The Summer 2022 Drought: A Taste of Future Climate for the Po Valley (Italy)? Reg. Environ. Change 2023, 23, 1. [Google Scholar] [CrossRef]
  29. Dalsgaard, T.; Nielsen, L.P.; Brotas, V.; Viaroli, P.; Underwood, G.; Nedwell, D.; Sundback, K.; Rysgaard, S.; Miles, A.; Bartoli, M.; et al. Protocol Handbook for NICE-Nitrogen Cycling in Estuaries: A Project under the EU Research Programme: Marine Science and Technology (MAST III); Ministry of Environment and Energy National Environmental Research Institute: Denmark; Department of Lake and Estuarine Ecology: Silkeborg, Denmark, 2000; pp. 1–62. [Google Scholar]
  30. Armstrong, F.A.J.; Stearns, C.R.; Strickland, J.D.H. The Measurement of Upwelling and Subsequent Biological Process by Means of the Technicon Autoanalyzer® and Associated Equipment. In Deep Sea Research and Oceanographic Abstracts, 1967th ed.; Elsevier: Amsterdam, The Netherlands; Volume 14.
  31. Golterman, H.L.; Clymo, R.S.; Ohnstand, M.A.M. Methods for Physical and Chemical Analysis of Fresh Waters, I.B.P.; Blackwell: Oxford, MS, USA, 1978; Volume 8. [Google Scholar]
  32. Bower, C.E.; Holm-Hansen, T. A Salicylate–Hypochlorite Method for Determining Ammonia in Seawater. Can. J. Fish. Aquat. Sci. 1980, 37, 794–798. [Google Scholar] [CrossRef]
  33. Nielsen, L.P. Denitrification in Sediment Determined from Nitrogen Isotope Pairing. FEMS Microbiol. Lett. 1992, 86, 357–362. [Google Scholar] [CrossRef]
  34. Kana, T.M.; Darkangelo, C.; Hunt, M.D.; Oldham, J.B.; Bennett, G.E.; Cornwell, J.C. Membrane Inlet Mass Spectrometer for Rapid High-Precision Determination of N2, O2, and Ar in Environmental Water Samples. Anal. Chem. 1994, 66, 4166–4170. [Google Scholar] [CrossRef]
  35. Eyre, B.; Ferguson, A. Comparison of Carbon Production and Decomposition, Benthic Nutrient Fluxes and Denitrification in Seagrass, Phytoplankton, Benthic Microalgae- and Macroalgae-Dominated Warm-Temperate Australian Lagoons. Mar. Ecol. Prog. Ser. 2002, 229, 43–59. [Google Scholar] [CrossRef] [Green Version]
  36. Magri, M.; Benelli, S.; Bonaglia, S.; Zilius, M.; Castaldelli, G.; Bartoli, M. The Effects of Hydrological Extremes on Denitrification, Dissimilatory Nitrate Reduction to Ammonium (DNRA) and Mineralization in a Coastal Lagoon. Sci. Total Environ. 2020, 740, 140169. [Google Scholar] [CrossRef]
  37. Warembourg, F.R. Nitrogen Fixation in Soil and Plant Systems; R Knowles and T H Black-burn; Academic Press Inc.: New York, NY, USA, 1993. [Google Scholar]
  38. Risgaard-Petersen, N.; Rysgaard, S. Nitrate Reduction in Sediments and Waterlogged Soil Measured by 15N Techniques. In Methods in Applied Soil Microbiology; Academic Press Inc.: London, UK, 1995. [Google Scholar]
  39. Toreti, A.; Masante, D.; Acosta Navarro, J.; Bavera, D.; Cammalleri, C.; De Felice, M.; de Jager, A.; Di Ciollo, C.; Hrast Es-senfelder, A.; Maetens, W.; et al. Drought in Europe July 2022: GDO Analytical Report; Publications Office of the European Un-Ion: Luxembourg, 2022. [Google Scholar]
  40. Marchina, C.; Natali, C.; Fazzini, M.; Fusetti, M.; Tassinari, R.; Bianchini, G. Extremely Dry and Warm Conditions in Northern Italy during the Year 2015: Effects on the Po River Water. Rend. Fis. Acc. Lincei 2017, 28, 281–290. [Google Scholar] [CrossRef]
  41. Chatzidaki, E.; Vecchi, A. Estate 2022: Presente e Futuro Si Toccano; Ecoscienza—ARPAE: Bologna, Italy, 2022. [Google Scholar]
  42. Montanari, A. Hydrology of the Po River: Looking for Changing Patterns in River Discharge. Hydrol. Earth Syst. Sci. 2012, 16, 3739–3747. [Google Scholar] [CrossRef] [Green Version]
  43. Autorità di Bacino Distrettuale del Fiume Po. Osservatorio Permanente Sugli Utilizzi Idrici Del Distretto Idrografico Del Fiume Po; Autorità di Bacino Distrettuale del Fiume Po: Parma, Italy, 2022. [Google Scholar]
  44. Maicu, F.; De Pascalis, F.; Ferrarin, C.; Umgiesser, G. Hydrodynamics of the Po River-Delta-Sea System. J. Geophys. Res. Ocean. 2018, 123, 6349–6372. [Google Scholar] [CrossRef]
  45. Sholkovitz, E.R. Flocculation of Dissolved Organic and Inorganic Matter during the Mixing of River Water and Seawater. Geochim. Et Cosmochim. Acta 1976, 40, 831–845. [Google Scholar] [CrossRef]
  46. Asmala, E.; Bowers, D.G.; Autio, R.; Kaartokallio, H.; Thomas, D.N. Qualitative Changes of Riverine Dissolved Organic Matter at Low Salinities Due to Flocculation: Riverine DOM Flocculation. J. Geophys. Res. Biogeosci. 2014, 119, 1919–1933. [Google Scholar] [CrossRef]
  47. Neubauer, S.C.; Piehler, M.F.; Smyth, A.R.; Franklin, R.B. Saltwater Intrusion Modifies Microbial Community Structure and Decreases Denitrification in Tidal Freshwater Marshes. Ecosystems 2019, 22, 912–928. [Google Scholar] [CrossRef]
  48. Ardón, M.; Morse, J.L.; Colman, B.P.; Bernhardt, E.S. Drought-Induced Saltwater Incursion Leads to Increased Wetland Nitrogen Export. Glob. Chang. Biol. 2013, 19, 2976–2985. [Google Scholar] [CrossRef]
  49. Æsøy, A.; Ødegaard, H.; Bentzen, G. The Effect of Sulphide and Organic Matter on the Nitrification Activity in a Biofilm Process. Water Sci. Technol. 1998, 37, 115–122. [Google Scholar] [CrossRef]
  50. Joye, S.B.; Hollibaugh, J.T. Influence of Sulfide Inhibition of Nitrification on Nitrogen Regeneration in Sediments. Science 1995, 270, 623–625. [Google Scholar] [CrossRef]
  51. Lisa, J.A.; Song, B.; Tobias, C.R.; Hines, D.E. Genetic and Biogeochemical Investigation of Sedimentary Nitrogen Cycling Communities Responding to Tidal and Seasonal Dynamics in Cape Fear River Estuary. Estuar. Coast. Shelf Sci. 2015, 167, A313–A323. [Google Scholar] [CrossRef] [Green Version]
  52. Kraft, B.; Tegetmeyer, H.E.; Sharma, R.; Klotz, M.G.; Ferdelman, T.G.; Hettich, R.L.; Geelhoed, J.S.; Strous, M. The Environmental Controls That Govern the End Product of Bacterial Nitrate Respiration. Science 2014, 345, 676–679. [Google Scholar] [CrossRef] [PubMed]
  53. King, D.; Nedwell, D.B. The Influence of Nitrate Concentration upon the End-Products of Nitrate Dissimilation by Bacteria in Anaerobic Salt Marsh Sediment. FEMS Microbiol. Lett. 1985, 31, 23–28. [Google Scholar] [CrossRef]
  54. An, S.; Gardner, W. Dissimilatory Nitrate Reduction to Ammonium (DNRA) as a Nitrogen Link, versus Denitrification as a Sink in a Shallow Estuary (Laguna Madre/Baffin Bay, Texas). Mar. Ecol. Prog. Ser. 2002, 237, 41–50. [Google Scholar] [CrossRef]
  55. Magri, M.; Benelli, S.; Castaldelli, G.; Bartoli, M. The Seasonal Response of in Situ Denitrification and DNRA Rates to Increasing Nitrate Availability. Estuar. Coast. Shelf Sci. 2022, 271, 107856. [Google Scholar] [CrossRef]
  56. Koop-Jakobsen, K.; Giblin, A.E. The Effect of Increased Nitrate Loading on Nitrate Reduction via Denitrification and DNRA in Salt Marsh Sediments. Limnol. Oceanogr. 2010, 55, 789–802. [Google Scholar] [CrossRef]
  57. Nizzoli, D.; Carraro, E.; Nigro, V.; Viaroli, P. Effect of Organic Enrichment and Thermal Regime on Denitrification and Dissimilatory Nitrate Reduction to Ammonium (DNRA) in Hypolimnetic Sediments of Two Lowland Lakes. Water Res. 2010, 44, 2715–2724. [Google Scholar] [CrossRef]
  58. Bonaglia, S.; Klawonn, I.; De Brabandere, L.; Deutsch, B.; Thamdrup, B.; Brüchert, V. Denitrification and DNRA at the Baltic Sea Oxic-Anoxic Interface: Substrate Spectrum and Kinetics: Denitrification and DNRA at the Oxic-Anoxic Interface. Limnol. Oceanogr. 2016, 61, 1900–1915. [Google Scholar] [CrossRef] [Green Version]
  59. Broman, E.; Zilius, M.; Samuiloviene, A.; Vybernaite-Lubiene, I.; Politi, T.; Klawonn, I.; Voss, M.; Nascimento, F.J.A.; Bonaglia, S. Active DNRA and Denitrification in Oxic Hypereutrophic Waters. Water Res. 2021, 194, 116954. [Google Scholar] [CrossRef]
  60. Murphy, A.E.; Bulseco, A.N.; Ackerman, R.; Vineis, J.H.; Bowen, J.L. Sulphide Addition Favours Respiratory Ammonification (DNRA) over Complete Denitrification and Alters the Active Microbial Community in Salt Marsh Sediments. Environ. Microbiol 2020, 22, 2124–2139. [Google Scholar] [CrossRef]
  61. Po River Basin District Authority. Monthly Bullettin of the Permanent Observatory on Water Uses in the Po River District (August 2022); Autorità di Bacino Distrettuale del Fiume Po: Parma, Italy, 2022. [Google Scholar]
Figure 1. (a) The area of the study was situated in the Po River Delta (Northern Italy), indicated with a red square; (b) Po di Goro River and three sampling sites (red stars): freshwater site (FW), sightly saline site (SS), and saline water site (SW); (base map of ArcMap 10.8.2).
Water 15 02405 g001
Figure 2. (a) Average daily water temperature of the Po River in 2022 at the basin closing section (Pontelagoscuro station) compared with the average monthly water temperature over the last 20 years; (b) average daily discharge in 2022 compared to the minimum and average monthly discharge over the last 20 years (data source: Environmental Protection Agency of the Emilia-Romagna Region, https://simc.arpae.it/dext3r/; accessed on 10 January 2023).
Water 15 02405 g002
Figure 3. Vertical profiles of (a) salinity (ppt) and (b) O2 concentration (mg O2 L−1) at the three sampling stations on the day of sampling.
Water 15 02405 g003
Figure 4. Benthic dark fluxes of NOx (NO3 + NO2), NH4+, total denitrification (N2), and denitrification efficiency (DE, black triangle) at the three sampling sites. The average values and standard deviations are reported.
Water 15 02405 g004
Figure 5. Denitrification and DNRA rates measured at the three sampling stations along the salinity gradient (black dots). The fraction of the two processes supported by NO3 from the water column (Dw and DNRAw) and the fraction portion coupled to nitrification (Dn and DNRAn) are also shown. The data are reported as the means and standard deviations.
Water 15 02405 g005
Table 1. Oxygen concentrations, N nutrient availability, and salinity conditions at the three sampling stations during the experimental campaign in situ.
SiteDistance from the Outlet
(km)
O2
(mg L−1)
Salinity
(mg L−1)
NO3
(µM)
NH4+
(µM)
Ntot
(µM)
FW254.71.53914107
SS222.95.44023118
SW1.55.830.111368
Table 2. Typology, porosity, density (g mL−1), and organic matter content (OM) in sediments at the three sampling sites of Po di Goro River. Average values and standard deviations are reported.
FWSSSW
TypologySandyMuddy–SandyClay
Porosity0.47 ± 0.120.65 ± 0.020.62 ± 0.05
Density (g mL−1)1.80 ± 0.111.47 ± 0.041.56 ± 0.05
OM (%)1.003.91.90
Table 3. One-way ANOVA and Tukey’s test results (p < 0.05; NS = not statistically significant).
ParameterpFTukey’s Test
NOx flux<0.055.6FW vs. SW
NH4+ fluxNS0.9-
Dtot<0.00130.9FW vs. SW
SS vs. SW
Dw<0.00147.1FW vs. SS
SS vs. SW
FW vs. SW
Dn<0.0115.1FW vs. SW
SS vs. SW
DNRAtot<0.054.9SS vs. SW
DNRAwNS4.1-
DNRAnNS2.5-
Table 4. Total denitrification and DNRA rates measured in other aquatic ecosystems of the Po River Basin (lakes and lagoons) and in selected freshwater and brackish environments during summer around the world. The rates are expressed as the average values ± standard deviations. Water and sediment features are reported for comparison.
LocationT
(°C)
Salinity (‰)NO3 (μM)OM
(%)
DNRAtot
(μmol N m−2 h−1)
Dtot
(μmol N m−2 h−1)
Reference
Pit Lake Ca’ Stanga—Hypolimnetic Sediments
(Italy)
6.5-2021 *7 ± 4163 ± 12 [57]
Pit Lake Verde—Hypolimnetic Sediments
(Italy)
12.51022 *4 ± 131 ± 5
Goro Lagoon—Site Giralda
(Italy)
235322 *48217 [36]
21.7779765 ± 11152 ± 36 [55]
10545 ± 11290 ± 94
23662 ± 8414 ± 123
43759 ± 11377 ± 65
87474 ± 8472 ± 50
1722108 ± 23631 ± 51
Goro Lagoon—Site Gorino
(Italy)
2528230.24 *3572 [36]
22.516619176 ± 14290 ± 58 [55]
113127 ± 17399 ± 94
226241 ± 102690 ± 109
462150 ± 11713 ± 36
871334 ± 651077 ± 225
1725235 ± 421304 ± 196
Baltic Sea—Site A6101.3-0.1540 [58]
Baltic Sea—Site B120.50.6722
Baltic Sea—Site C100.9 0.13
Curonian Lagoon—Baltic Sea
(Sediments)
220.3113 *2 ± 10.95 ± 0.06 [59]
Plum Island Sound Estuary—Coastal Sediments (Massachusetts, USA)2322 -13 ± 226 ± 0.6 [60]
Plum Island Sound Estuary—Tidal Creek (Massachusetts, USA)24257-20 ± 527 ± 2 [56]
Note: * Organic carbon.
Disclaimer/Publisher’s Note: The statements, opinions and data contained in all publications are solely those of the individual author(s) and contributor(s) and not of MDPI and/or the editor(s). MDPI and/or the editor(s) disclaim responsibility for any injury to people or property resulting from any ideas, methods, instructions or products referred to in the content.

