Article

Numerical Simulation of the Lower and Middle Reaches of the Yarkant River (China) Using MIKE SHE

School of Geology and Mining Engineering, Xinjiang University, Urumqi 830046, China
*
Author to whom correspondence should be addressed.
Water 2023, 15(13), 2492; https://doi.org/10.3390/w15132492
Submission received: 31 May 2023 / Revised: 26 June 2023 / Accepted: 30 June 2023 / Published: 7 July 2023
(This article belongs to the Section Hydraulics and Hydrodynamics)

Abstract

:
As the largest irrigation area in northwest China, the middle and lower reaches of the Yarkant River basin are limited in economic development by the shortage of surface water resources and the increasing demand for groundwater resources from agriculture and industry, and the phenomenon of over-exploitation is becoming increasingly serious, which is not in line with the concept of sustainable development. Therefore, improving the efficiency of water resource utilization while curbing the trend of declining groundwater levels is an important issue that needs to be addressed in the middle and lower reaches of Yarkant at present, specifically, by establishing a distributed hydrological model MIKE SHE based on a soil texture dataset. The model efficiency coefficient Ens, the water balance coefficient (WB), the correlation coefficient r, and the relative error Re were selected to evaluate the model’s applicability. The results were: Ens = 0.84, WB = 0.80, and r = 0.96 for the annual scale runoff simulation and Ens = 0.85, RE = 0.61, and r = 0.96 for the monthly scale runoff simulation. The relative errors between the simulated and observed values of the typical observation wells were 3.45%, 1.59%, 2.52%, and 0.35%. According to the analysis of the soil parameters on the runoff sensitivity and groundwater table sensitivity, the saturated hydraulic conductivity had the greatest effect on the peak discharge. The results show that the MIKE SHE model has some applicability in the lower and middle reaches of the Yarkant River basin.

1. Introduction

In arid and semi-arid areas, surface water resources are limited and subject to seasonal influences. When the surface water is dry, industrial, agricultural, and domestic water use becomes more dependent on groundwater extraction. The problems facing ecological and economic development projects in the process of the exploitation of water resources in arid and semi-arid areas have thus been becoming increasingly acute [1]. In order to guarantee the stability of both ecosphere and socio-economic development, hydrological models have been studied in order to reflect the effects of changing natural conditions and human activities on the water environments of the basin, so as to use both surface water and groundwater resources in more rational ways. The study of physically-based distributed hydrological models for the overall simulation of the hydrological processes in surface and groundwater has been driven by both social needs and the development of computer technology [2]. After 30 years of practice and research, the use of such physical models has become the main method for studying the response relationships between natural properties and hydrological processes [3].
The development of hydrological models has been through three stages: those of empirical models, ensemble models, and distributed hydrological models [4]. The common types of distributed hydrological models are the SWAT (Soil and Water Assessment Tool) model and the MIKE SHE (System Hydrological European) model. The MIKE SHE model is able to better express natural spatial heterogeneity than the SWAT model, which describes soil water movement in addition to the coupling of surface and groundwater through the use of empirical equations. Therefore, the SWAT model cannot show the moisture content dynamics for each soil profile. The MIKE SHE model, however, is able to simulate the complete hydrological process of surface and groundwater integration. In terms of the application areas, the SWAT model is unsuitable for flat areas with denser river networks, while the MIKE SHE model performs well in such areas [5]. In 1969, Freeze and Harlan proposed a blueprint for hydrological cycle modeling. Since 1997, a consortium of three European organizations both developed and widely used the hydrological system SHE (System Hydrological European) based on this blueprint [6]. Thus, the integrated hydrological simulation system MIKE SHE (http://www.Dhigroup.com, accessed on 3 January 2023) was born. Today, MIKE SHE is an advanced and flexible framework used for hydrological modeling. It includes complete pre-processing and post-processing tools, as well as a loose mix of both progressive and simple solution techniques. It covers the main processes of the water cycle, including evapotranspiration, surface runoff, unsaturated flow, groundwater flow, and channel flow, and their interactions in process models.
Research based on the MIKE SHE hydrological model is more mature, and many scholars have contributed to it in recent years. In terms of the impact on the groundwater regarding land use types, for example, Patrick [7] applied the MIKE SHE model to the Tarim River basin and analyzed the impact of land use and climate change on the groundwater. In terms of simulating surface runoff, Spyridon [8] conducted a hydrological simulation of the Spurgeos River in central Greece based on the MIKE SHE model, and the results showed the model could simulate surface runoff better. Regarding the effects of agricultural activities on the groundwater level, Lingfeng Jiang [9] simulated the natural artificial composite water cycle process using the 150th regiment of the Manas basin as the study area, and was able to determine that the proportion of the groundwater level’s decrease caused by water-saving irrigation accounted for 24.7% of the total decrease. To forecast groundwater storage changes using models, Dongrong Lai [10] et al. analyzed the water-use scenarios of the North China Plain based on the MIKE SHE model, and was able to determine the effects of different scenarios on groundwater storage. For the model parameter validation, Yi Guo [11] performed a rate determination for the MIKE SHE model parameters using a BP neural network, and the results showed that the parameter rate determination effects of a BP (back propagation) neural network inverse analysis were smaller than the error of the automatic rate determination of the MIKE SHE model parameters.
In the above study, the meteorological and hydrological data and soil raster data were well established. For the arid and semi-arid regions of Xinjiang, there were fewer previous studies and soil data was lacking. As for the current research on the hydrological model of the Yarkant River basin, only Liu Jiao [12] simulated the hydrological process of the Yarkant River mountainous area based on remote sensing data, which better simulated the hydrological processes of the Kachun hydrological station. However, there is a gap in the research on the coupled surface water and groundwater models for the lower and middle reaches of the Yarkant River basin plain area.
Therefore, this study has two aims: (1) to investigate whether the soil raster data can provide more accurate soil data for the establishment of coupled surface water and groundwater models in the watersheds of arid and semi-arid regions; (2) to evaluate the applicability of the MIKE SHE model for a simulation of the lower and middle reaches of the basin, through which the model can provide a reference for hydrological observation and management, as well as the development and utilization of water resources in the Yarkant River basin. The main innovative methods of the article are to verify the practicality of the soil raster data by comparing the experimentally measured soil parameters with those of the soil raster data. The response of the groundwater level is simulated by varying the saturated hydraulic conductivity parameter of the soil in the envelope.

2. Materials and Methods

2.1. Study Area Overview

The object of this study was the lower and middle reaches of the Yarkant basin. The Yarkant River basin is located in central Eurasia, and its ecological environment and production life are both sensitive to global climate change. Over the last 60 years, the rate of temperature increases in the Yarkant River basin have been 2.78 times the average rate of global warming [13]. Global warming thus poses a serious challenge to the Yarkant River basin in the northwest arid zone. Under the influence of the Taklimakan Desert, Bugula Desert, and Tokelak Desert, the Yarkant River Basin assumes a banded distribution way [14], and thus part of the natural resources of the basin are intertwined with its fragile ecological environment [15]. With economic and social development, the development of the oasis water and soil resources in the bay has increased, the magnitude of the irrigation areas has increased significantly, and the existing pattern of surface water resources used for water supply are unable to meet agricultural production needs. Since 2008, the groundwater level has dropped by 3.6 m due to excessive groundwater extraction [16].
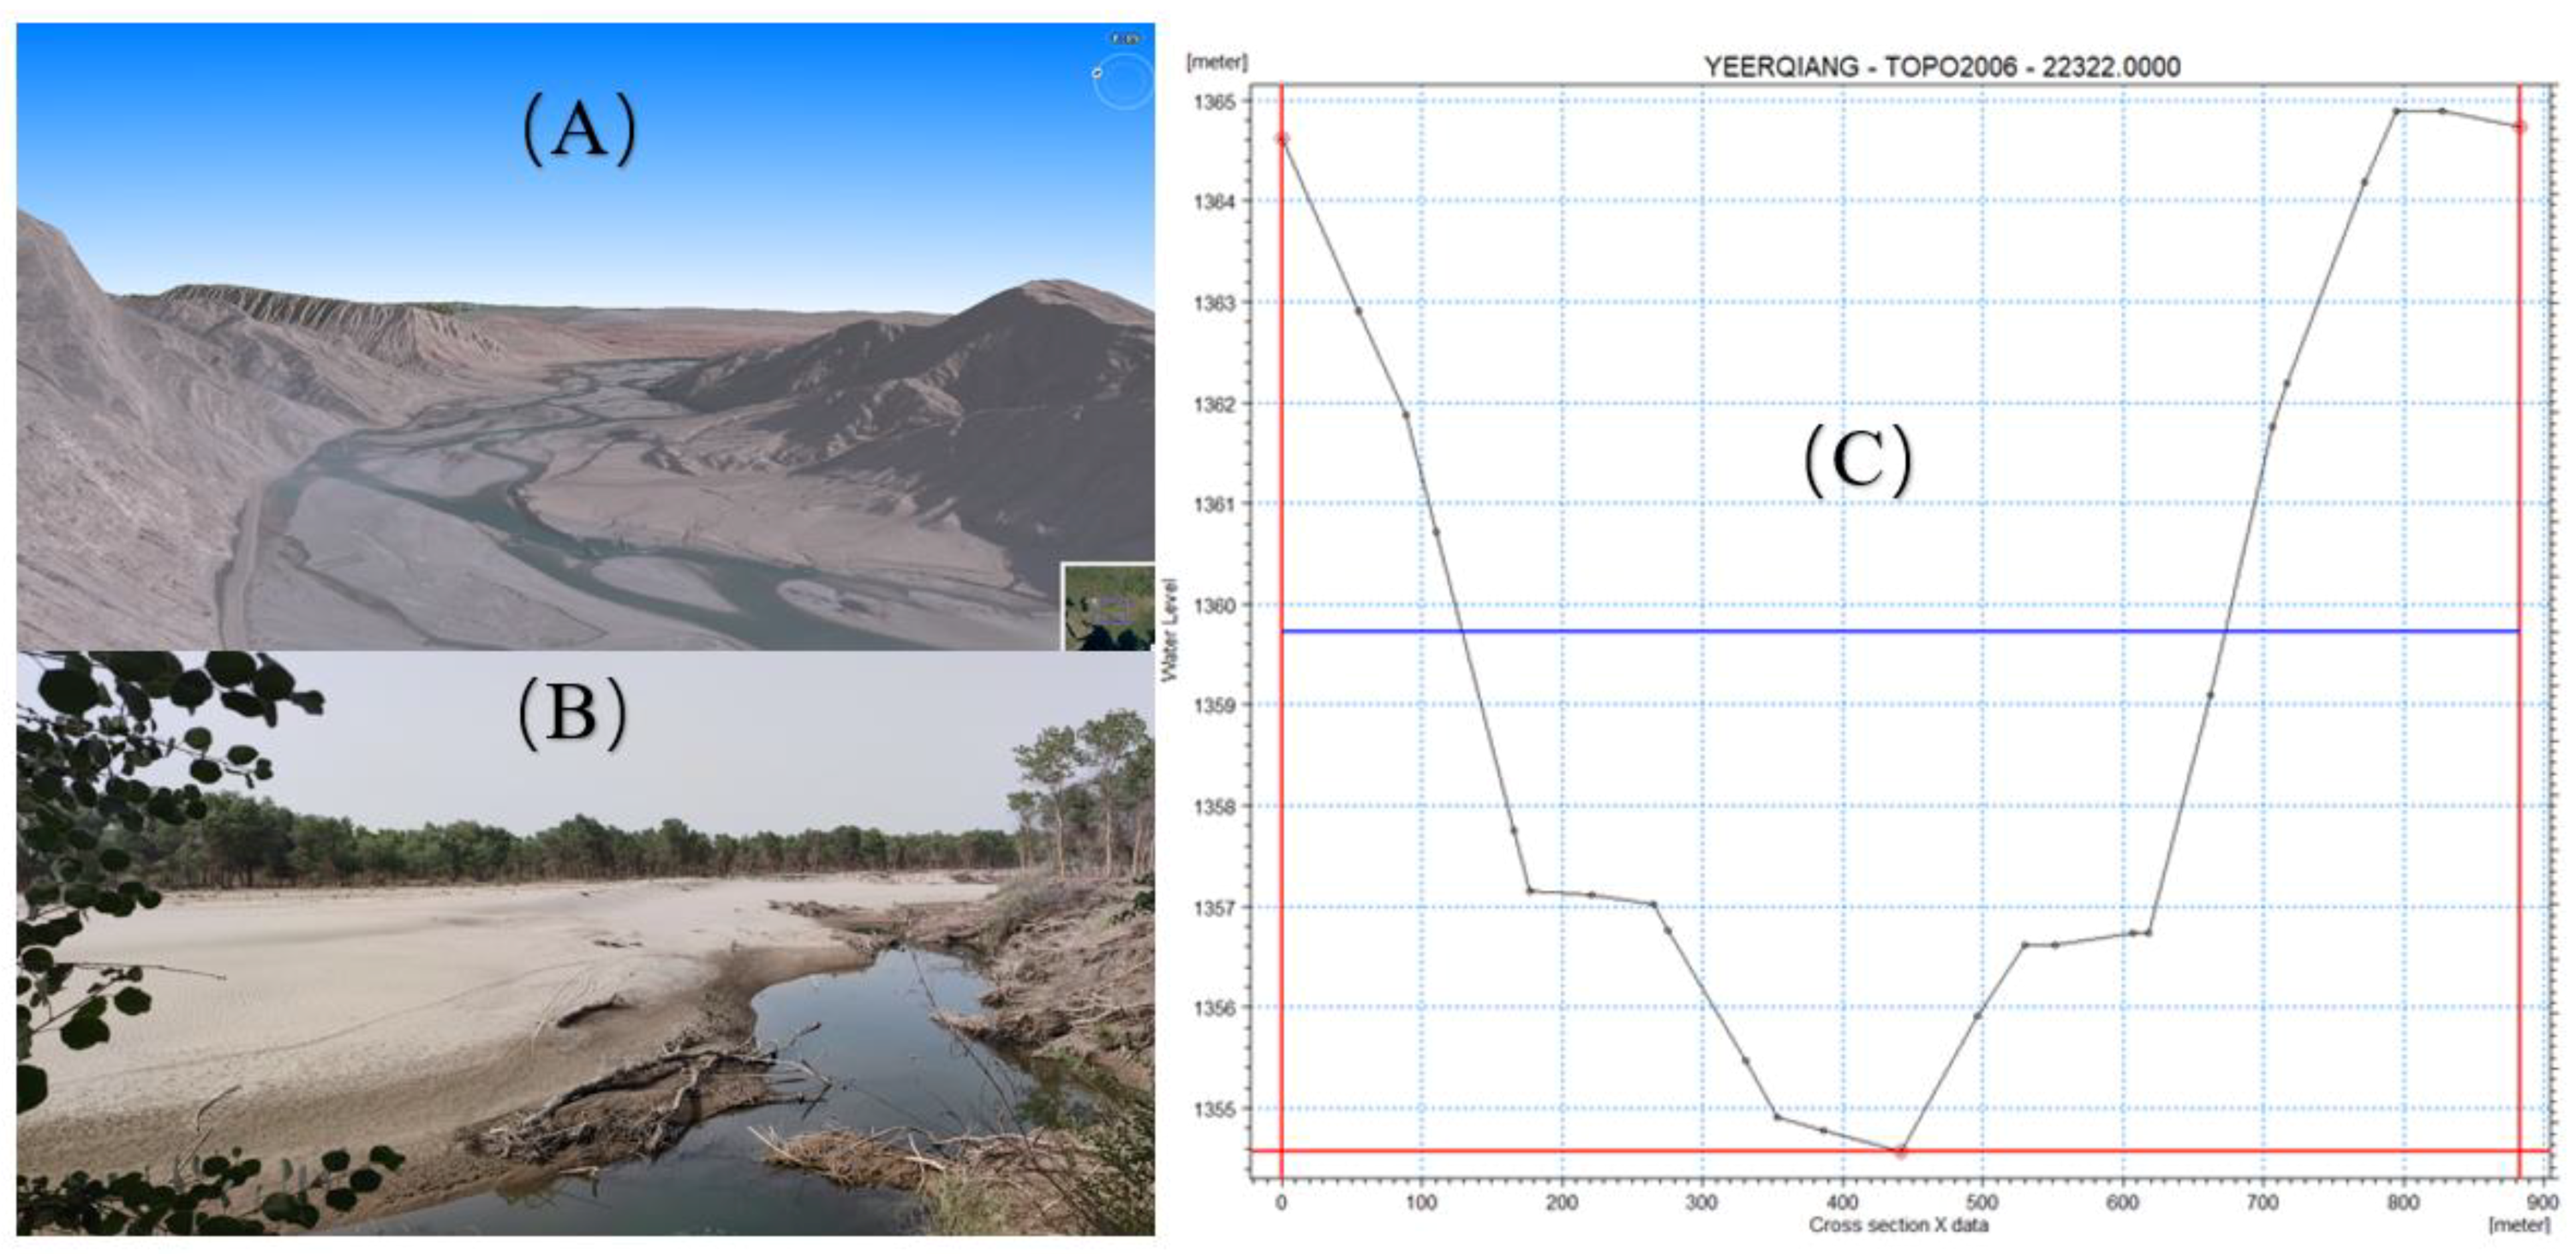
Yarkant River is an essential river in the Kashgar region of Xinjiang and is one of the three primary sources of the Tarim River, which originates at the northern edge of the Kunlun Mountains. The basin’s topography is high in the southwest and low in the northeast, with a basin area of 10.81 × 10⁴ km2, of which the Plain area accounts for 4.7 × 10⁴ km2, or 43.5% of the basin area [14]. The area of the Yarkant River basin in the study area is about 1.5 × 10⁴ km2, and an overview of the study area is shown in Figure 1. The length of the Yarkant River in the study area is about 567 km, and the specific river cross-sectional geomorphological features are shown in Figure 2. The average multi-year runoff of the Yarkant River is 67.29 × 10⁸ m3/a, as observed by the Kachun hydrological station. Under normal flow conditions, the river in the lower reaches of the Yarkant in Bachu County is dry year-round, and only a small amount of water becomes available during mega-floods. The geomorphology of the study area is mainly alluvial, with alluvial plains and wind-deposited deserts. The climate of the study area is a warm–temperate continental arid climate, with a multi-year average temperature of 11.4 °C to 11.7 °C, rainfall of 40–70 mm/year, and four distinct seasons in the spring, summer, autumn, and winter [14].

2.2. Data Sources

This paper provides the monthly temperature, rainfall, and evaporation from 2012 to 2018 measured by the main meteorological stations as supplied by the Kashgar Regional Meteorological Bureau. The monthly runoff data from the Kachun and Hainiaz hydrological station from 2012 to 2018 was used for the hydrological data. A digital elevation model (DEM), land use, and soil data were also used. The data types used, as well as their sources, are detailed in Table 1.

2.3. MIKE SHE Model

MIKE SHE was used to simulate all the critical processes in the terrestrial phase of the hydrologic cycle for the water resources and environmental issues related to surface water and groundwater. MIKE SHE can be applied at scales ranging from local infiltration to regional watershed studies, and it simulates all the main processes, including precipitation, snowmelt, evapotranspiration, surface runoff, unsaturated flow, groundwater flow in the saturated zone, surface open channel flow, and all the interrelationships among them. The researchers could select the appropriate simulated processes to study according to the actual needs. Since the study area was mainly the lower and middle reaches of the Yarkant River that have a low snowfall in the winter, the snowmelt module was not involved. Applying the MIKE SHE model, the study area was divided into several rectangular grids in the horizontal direction. In standing order, it could be divided by the researchers according to the number of stratigraphic substrata, the number of aquifers, as well as other constraints according to the actual needs. The evapotranspiration module has two main calculation methods: the Rutter model simulates the interception process, while the Penman–Monteith formula is used to predict the real evaporation rate; the Kristensen–Jensen model is calculated using the leaf area index and the interception coefficient. The surface runoff is mainly calculated using the continuity equation and the momentum equation from St. Venant’s equation for confluence. Using Richards’ equation, the unsaturated zone flow describes one-dimensional vertical soil water movement. The saturated zone flow is mainly expressed by calculating three-dimensional partial differential equations for both the spatial and temporal variation of the groundwater level.
MIKE 11 is used as the module for simulating open channel flow in MIKE SHE, which includes the model selection, data input, calculation time step setting, and results analysis. MIKE 11 can simulate the river network in addition to setting up hydraulic structures such as channels and sluices according to their locations. It can also be used to accurately describe the scheduling patterns of some artificially influenced rivers and hydraulic structures. The MIKE 11 hydrodynamic module uses implicit discrete differential equations to simulate one-dimensional river flows. The coupling between MIKE SHE and MIKE 11 is achieved using river links (MIKE SHE links). The river links connect the river network node information and river cross-section information defined in the MIKE 11 1D hydrodynamic model to the correct physical locations in the MIKE SHE model using vector data transfers between adjacent grids. The other hydrological cycle processes in the MIKE SHE model are linked to the open channel flow of the river to simulate the runoff process.

2.4. Model Building

2.4.1. Discretization

With the application of the MIKE SHE model, the study area was divided into a certain number of rectangular grids in both horizontal directions: in the vertical direction, it could be divided by researchers according to the number of stratigraphic substrata, the number of aquifers, and other constraints according to actual needs. The smaller the grid size of the model, the higher the relative simulation accuracy and the longer the time required for the simulation [17,18]. The grid of the model for the study area was divided into 200 columns in each of the x and y directions, with cell sizes of 1584 m. The vertical discretization of the unsaturated zone consisted of 16 layers of exponentially increasing thickness, starting at 0.05 m from the surface and ending at 2 m from it. For the saturated zone, initial simulations were first performed using a single soil layer in order to approximate the minimum groundwater level required to minimize the coupled correlation error between the saturated and unsaturated zones [18].

2.4.2. Data Input

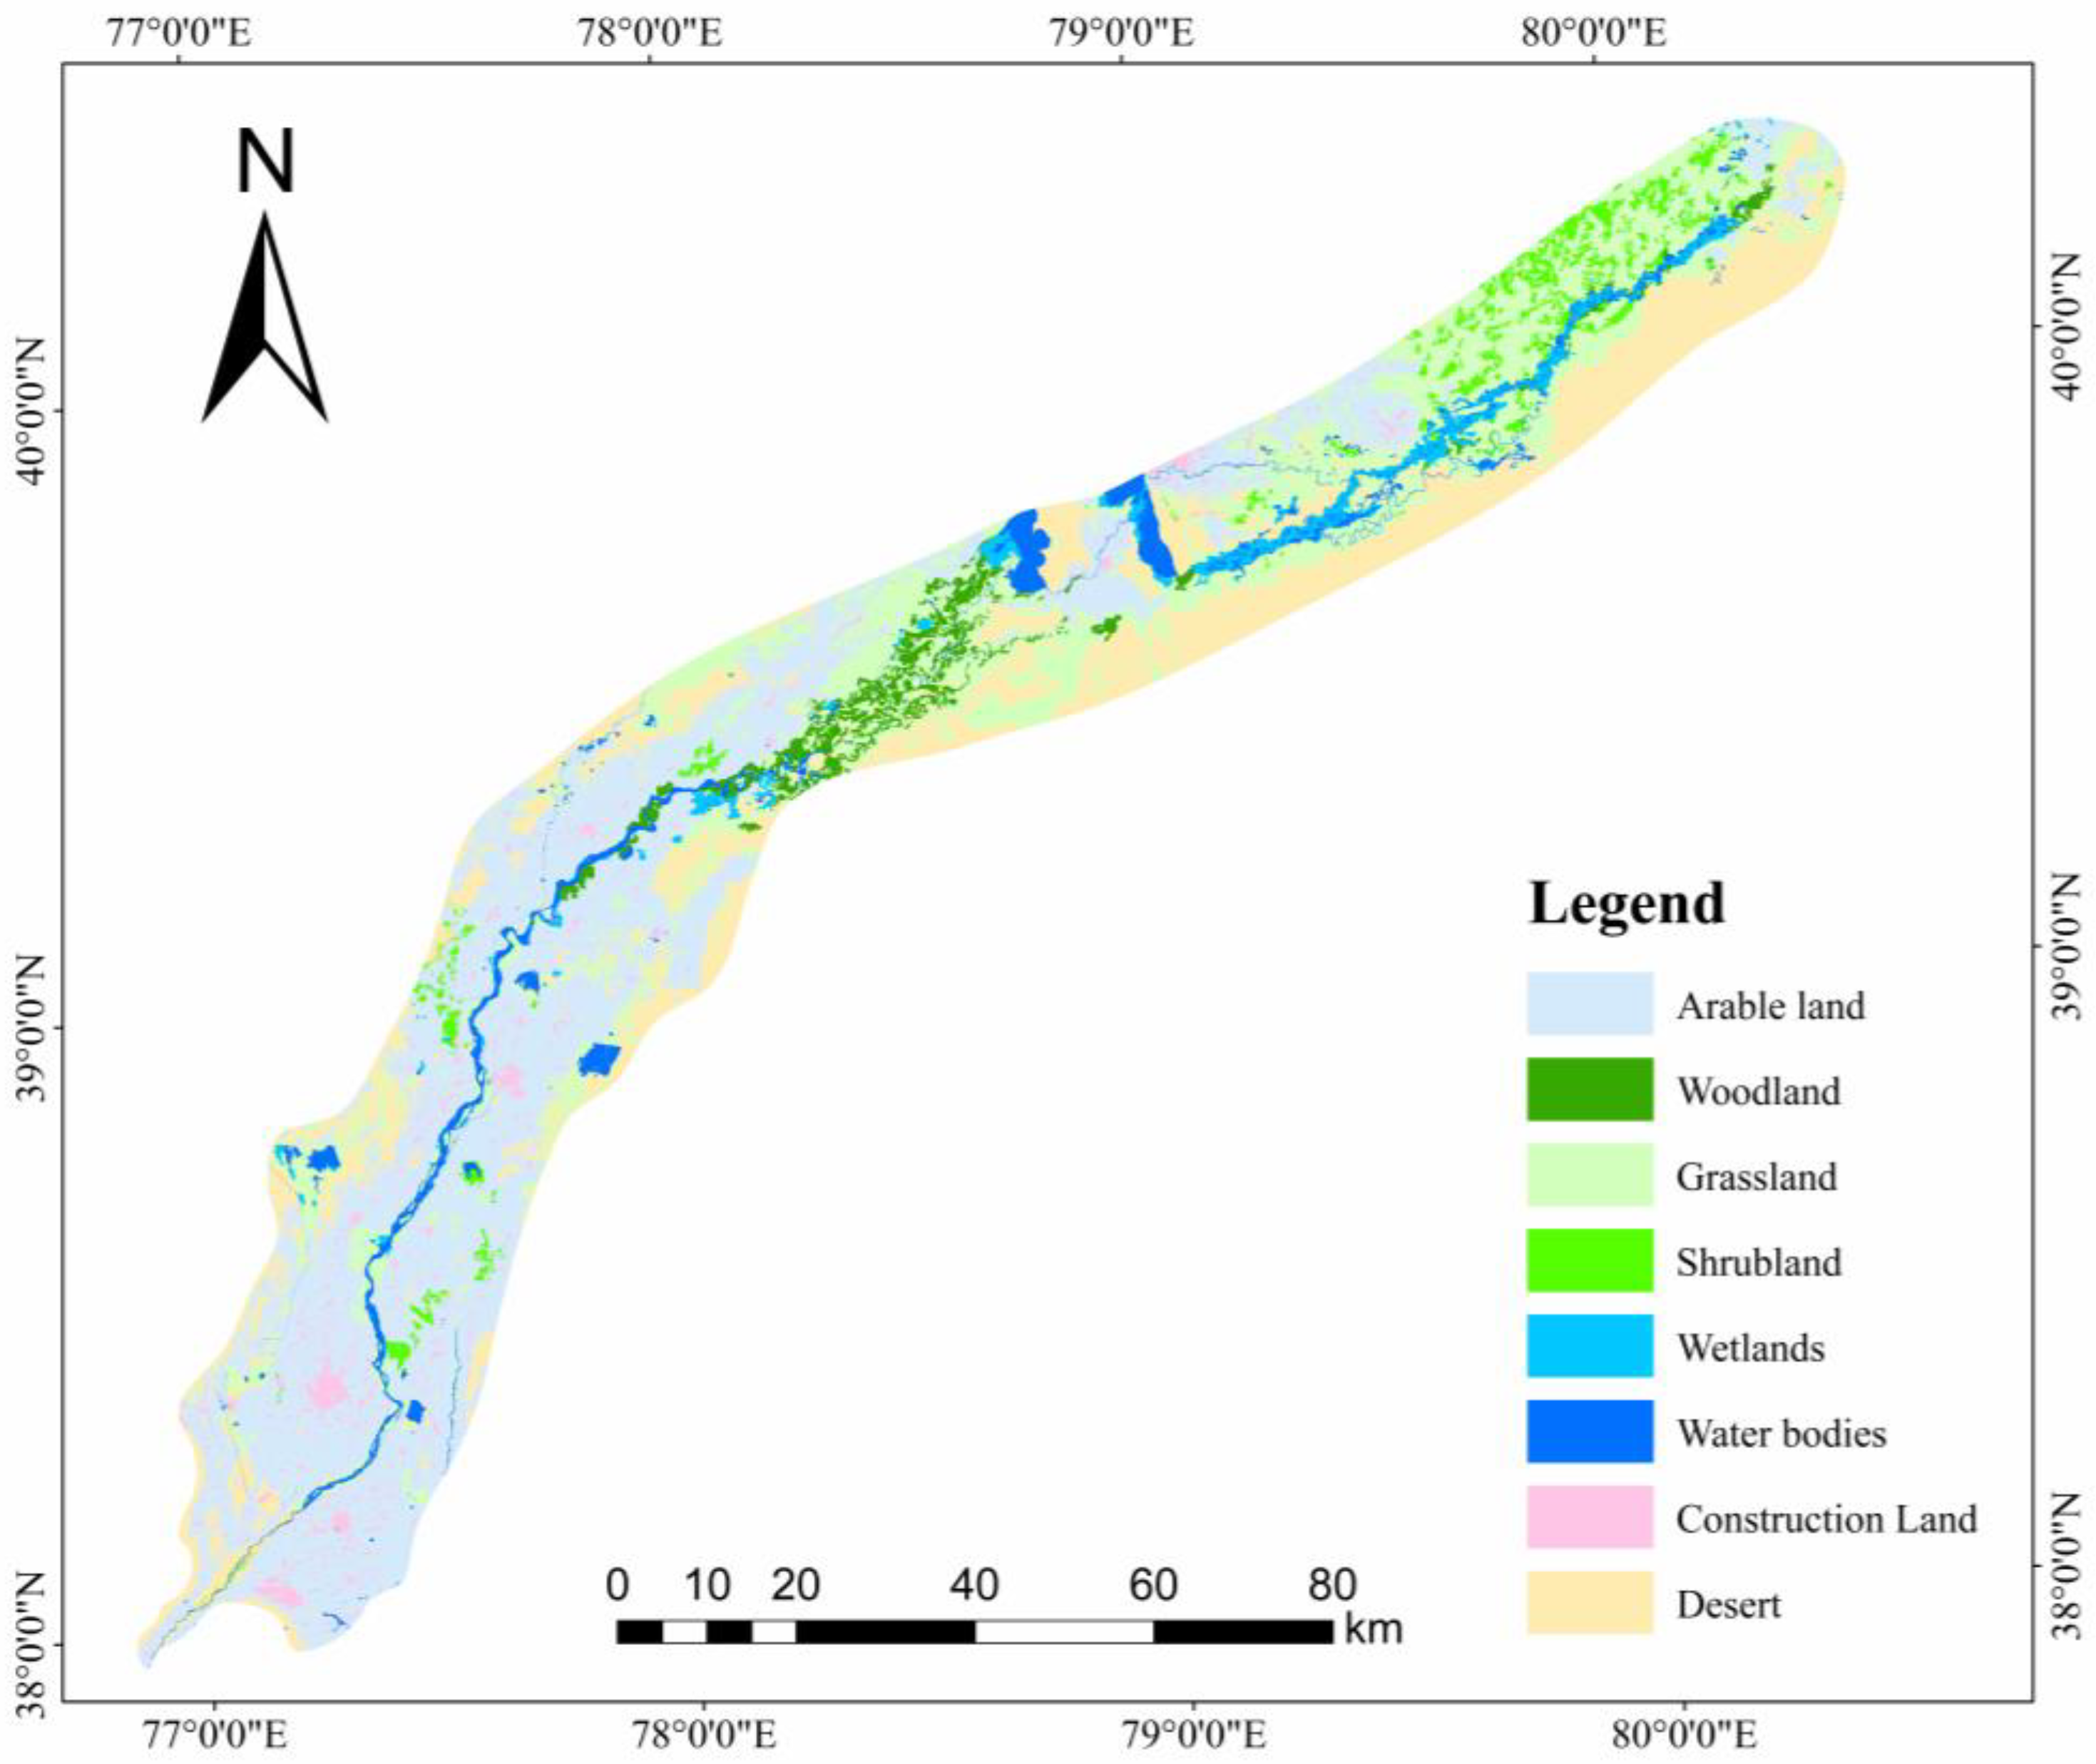
The projection coordinate system in this study was defined as CGCS2000_GK _CM _75E. The study area extent map, digital elevation model DEM, land use type map, initial water level map, and river network distribution map required for the model were all projected onto this coordinate system. The land use data in the study area included eight primary types: cropland, woodland, grassland, shrubland, wetland, water bodies, building land, and bare land, as shown in Figure 3. The area occupied by the eight land use types was 1.5 × 10⁴ km2, with 39.2% cropland, 23.5% grassland, and 22% bare land. The values applied to the MIKE SHE model by land use are shown in Table 2. The leaf area index (LAI) and root depth were determined by both land use type and vegetation cover type; the range of values for the leaf area index was 0–6, while the range of values for the root depth was 0–1000 mm.
The soil type data of the unsaturated zone in the study area was obtained from the soil texture data set of the HWSD (Harmonized World Soil Database) of the National Glacial Permafrost Desert Scientific Data Center, and was reclassified and cropped using the GIS software to obtain the soil type map for the study area, as shown in Figure 4. The coefficients and other parameters required for the unsaturated zone soil profile simulation were calculated using SPAW software (Soil–Plant–Atmosphere–Water) based on the clay, sand, organic matter, salinity, and gravel content, as well as other contents in the soil.
To verify the accuracy of the soil parameters, nine sets of field samples were collected in the study area in July 2020, with sampling points spaced at an average interval of 50 km and evenly distributed within the study area, to ensure that soil representative of all the different types was obtained. A foot-operated soil auger was used to take 0.5 kg of samples from the 0–30 cm, 30–50 cm, and 50–80 cm soil layers, respectively. All soil sample bags were numbered and sent to the laboratory, where they were all air-dried at room temperature. The soil samples were passed through a 2 mm sieve at a 5:1 water-to-soil ratio, according to the soil agrochemical analysis method [20], in order to remove debris such as plant roots and stems. After that, particle fractionation tests were performed via the sieve analysis method and densitometer method, in which the particle size range of the soil applied with the sieve analysis method was 0.075~60 mm, and the particle size range of the soil sample applied with the densitometer method was lower than the 0.075 mm range [21]. The saturated water and residual water content as well as the soil–water characteristic curves of the soil samples were provided by Northwest Agriculture and Forestry University.
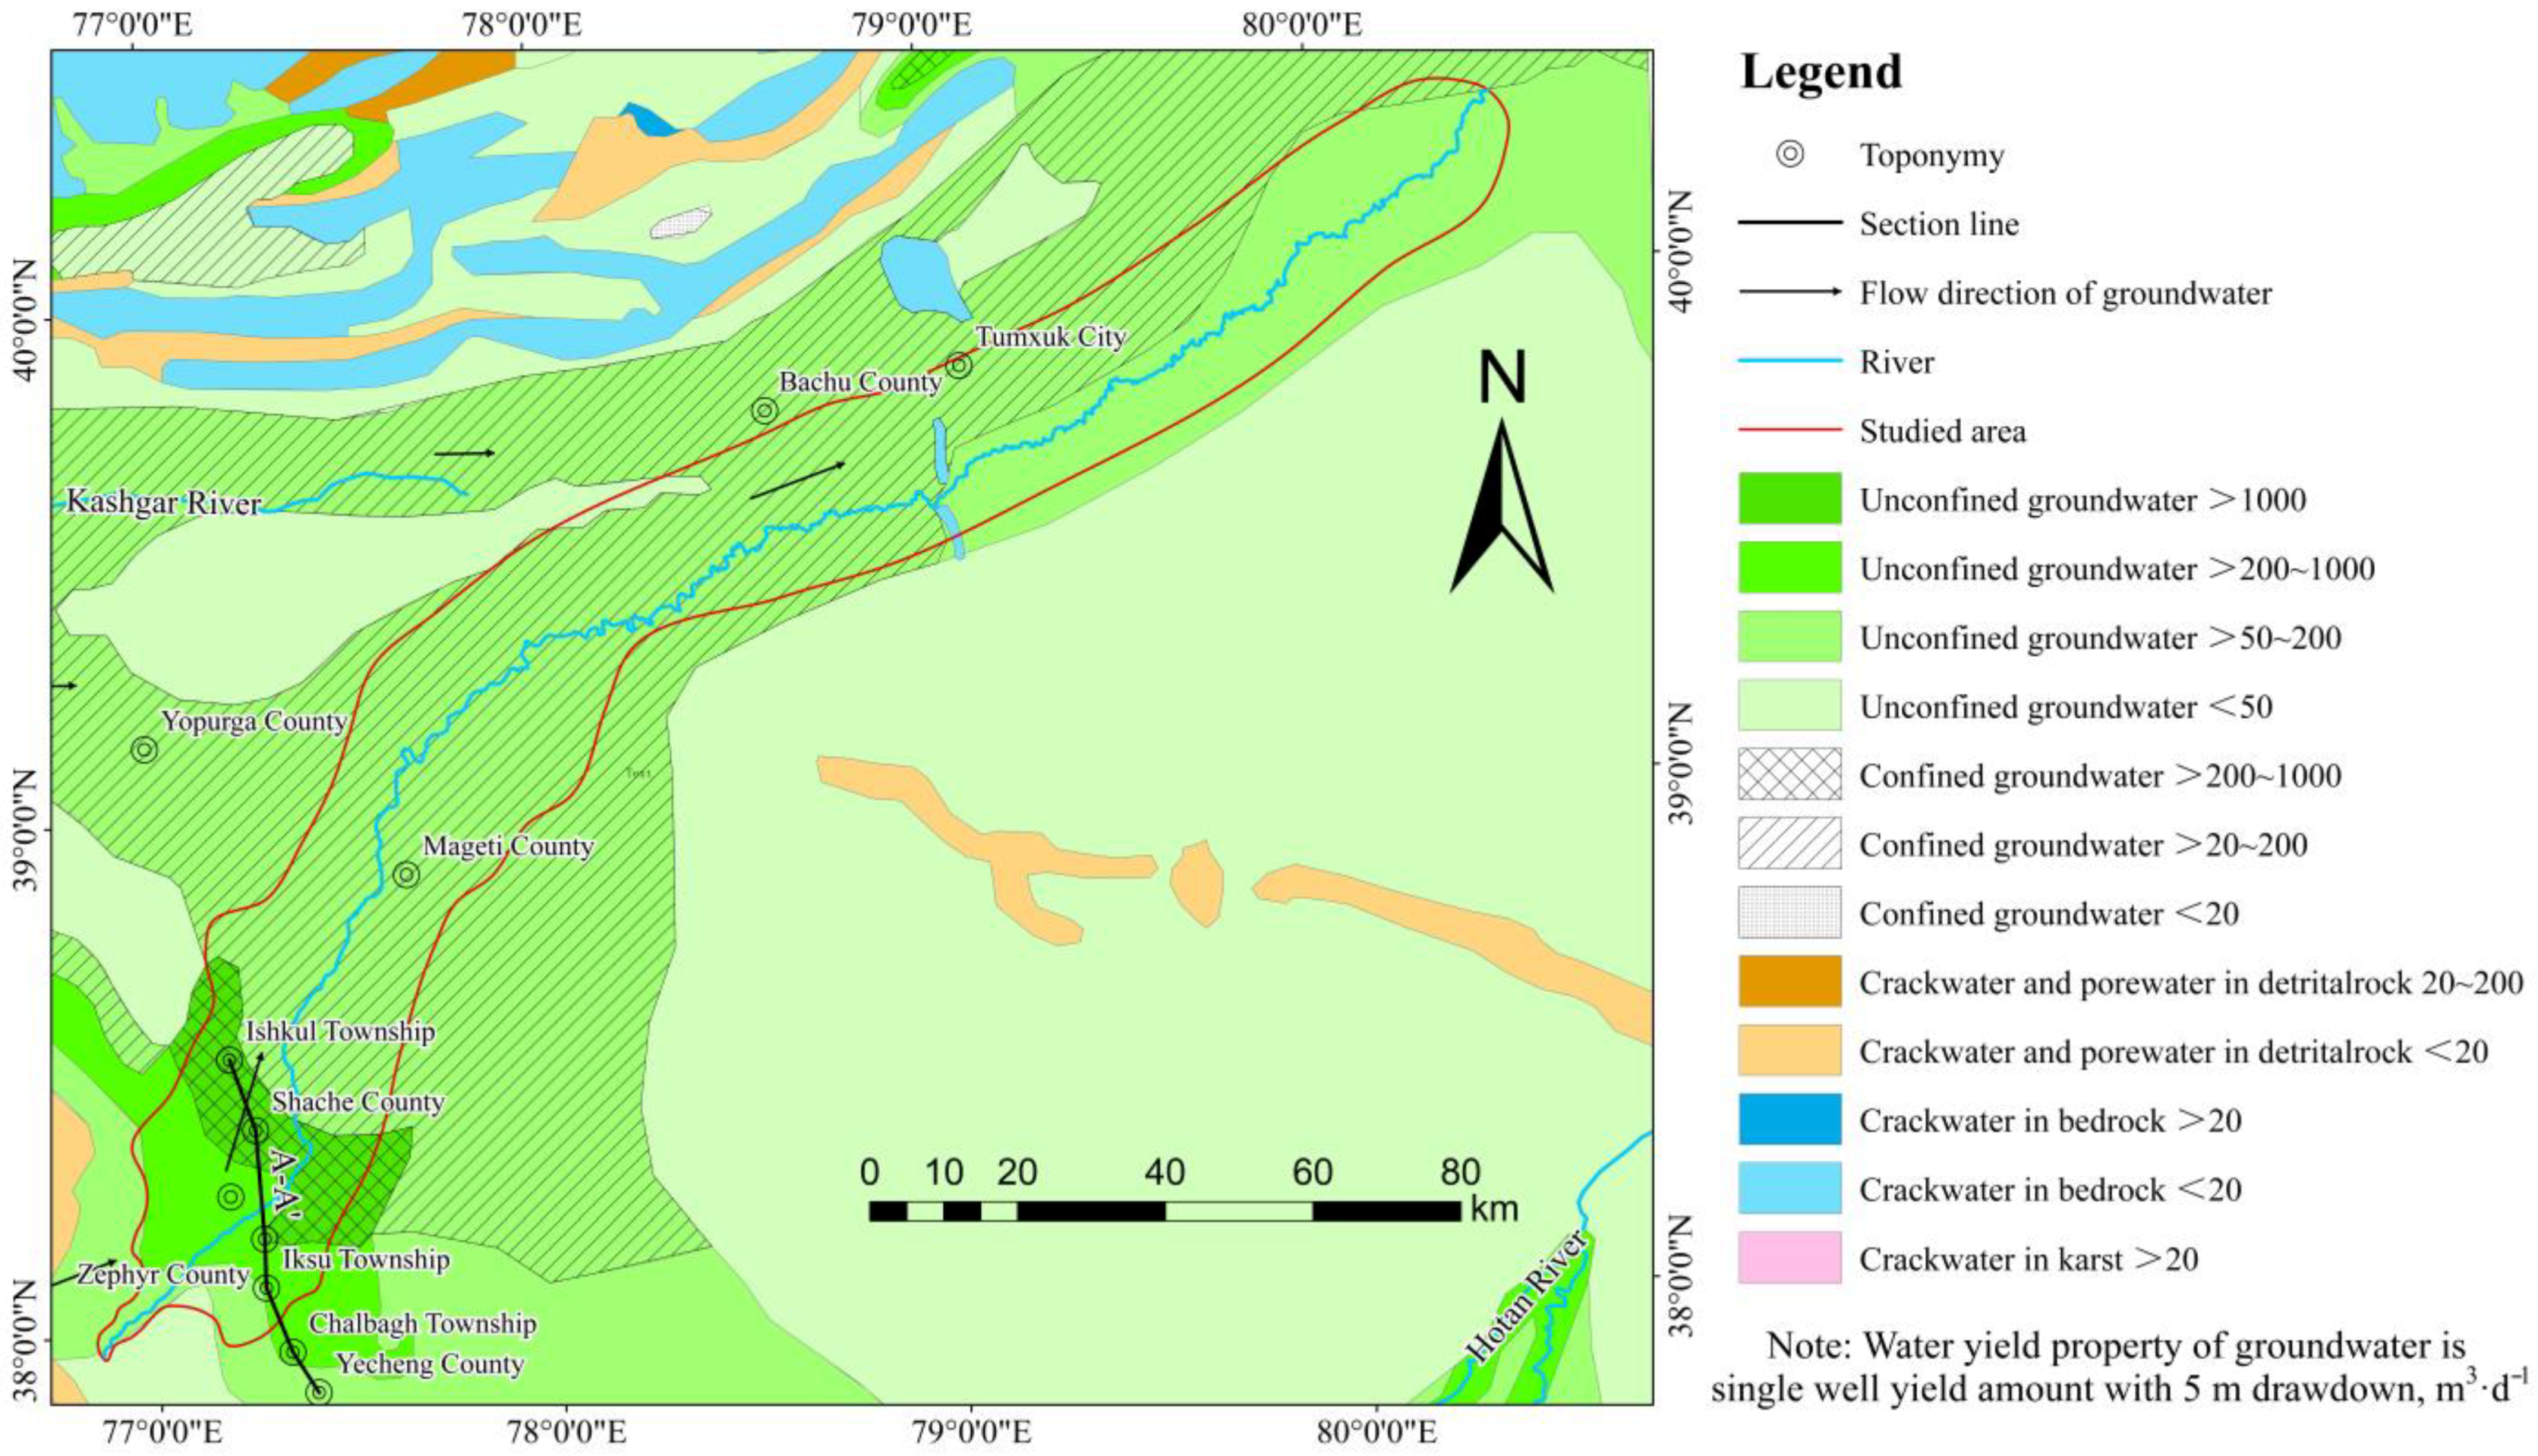
Based on both the borehole data and previous studies [14,22], an A–A’ profile and regional hydrogeological map of the plain area of the Yarkant River basin were drawn, as shown in Figure 5 and Figure 6. The single unconfined aquifer was located in the middle and front of the alluvial sloping plain in front of the mountain. The lithology of the aquifer was pebble and gravel, and sand and gravel, while the groundwater level was more than 15 m below the surface elevation, with the thickness of the aquifer being greater at roughly 150 m. In the central part of the alluvial fan near the front edge, there was a weakly permeable layer of fine sand and sub-clay on the aquifer, the thickness of which was thin near the mountains and gradually thickened in the distant mountains.
The multi-layered structure aquifers (the unconfined aquifer in the upper part and the semi-confined aquifers in the lower part) are mainly distributed in the area north of Yima Township in Zephyr County and Aslanbagh Township in Shache County, and the lithology of the aquifers are mainly medium sand and fine sand, with a thickness of 30–65 m.
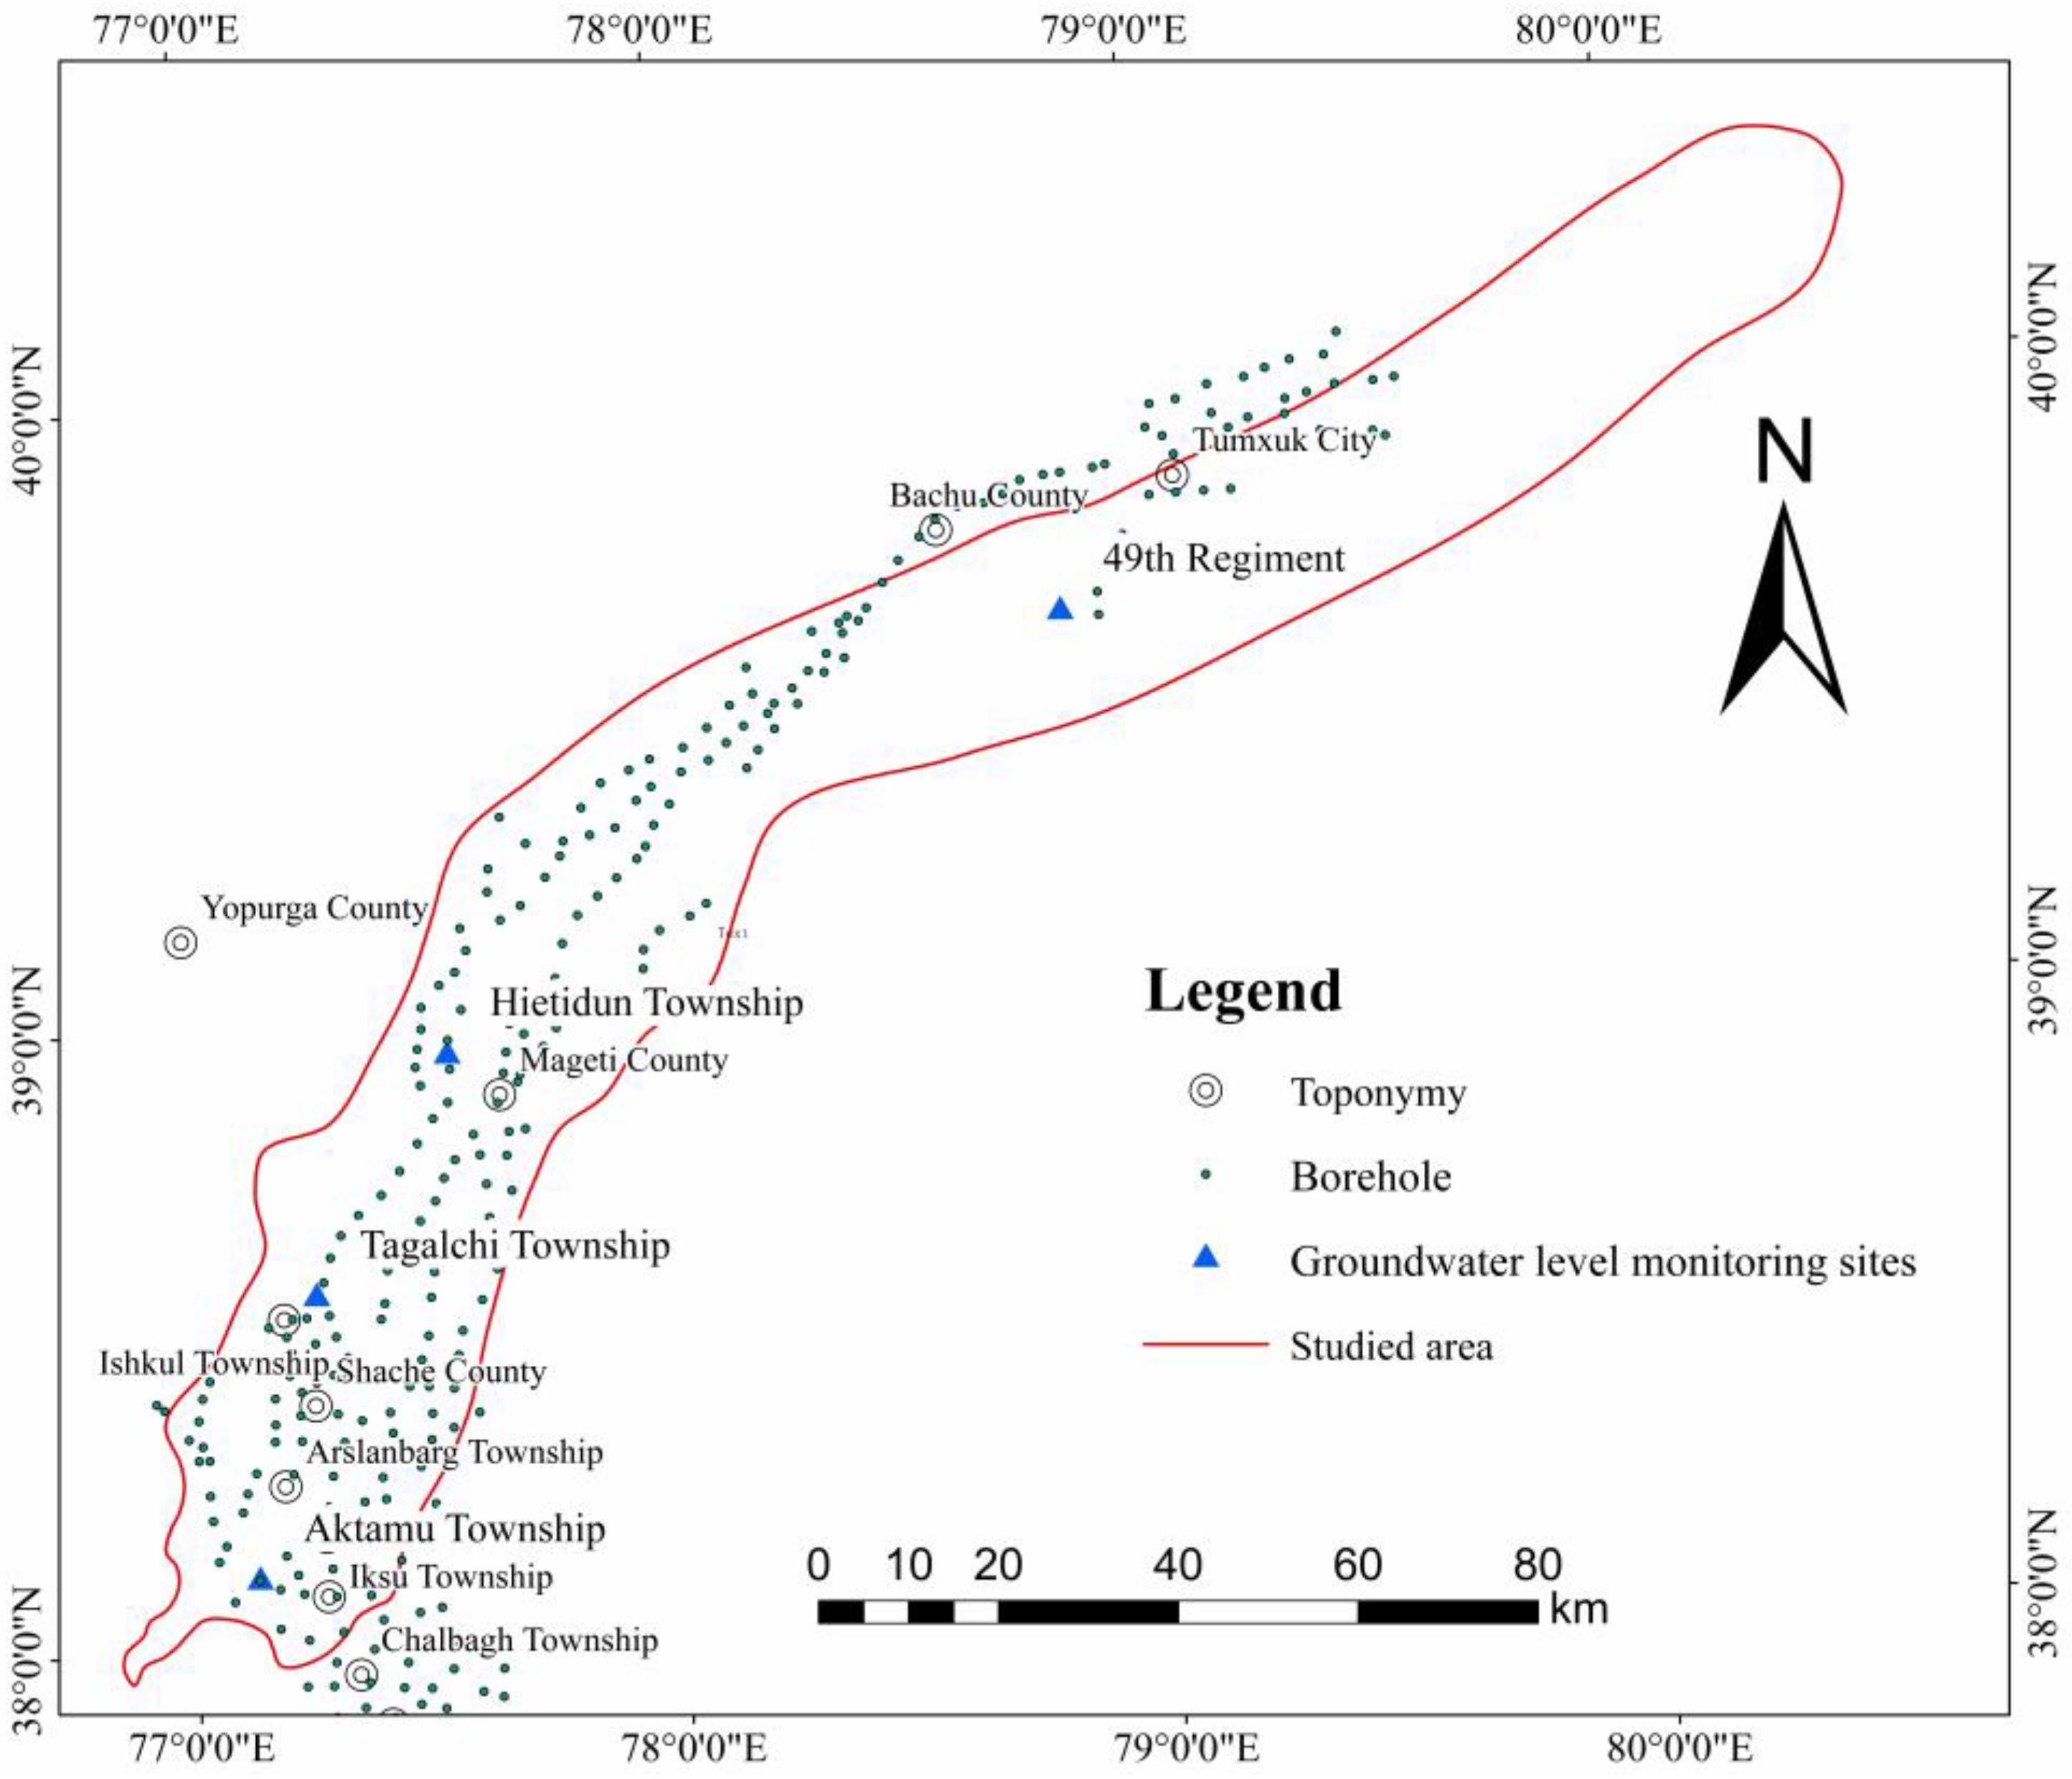
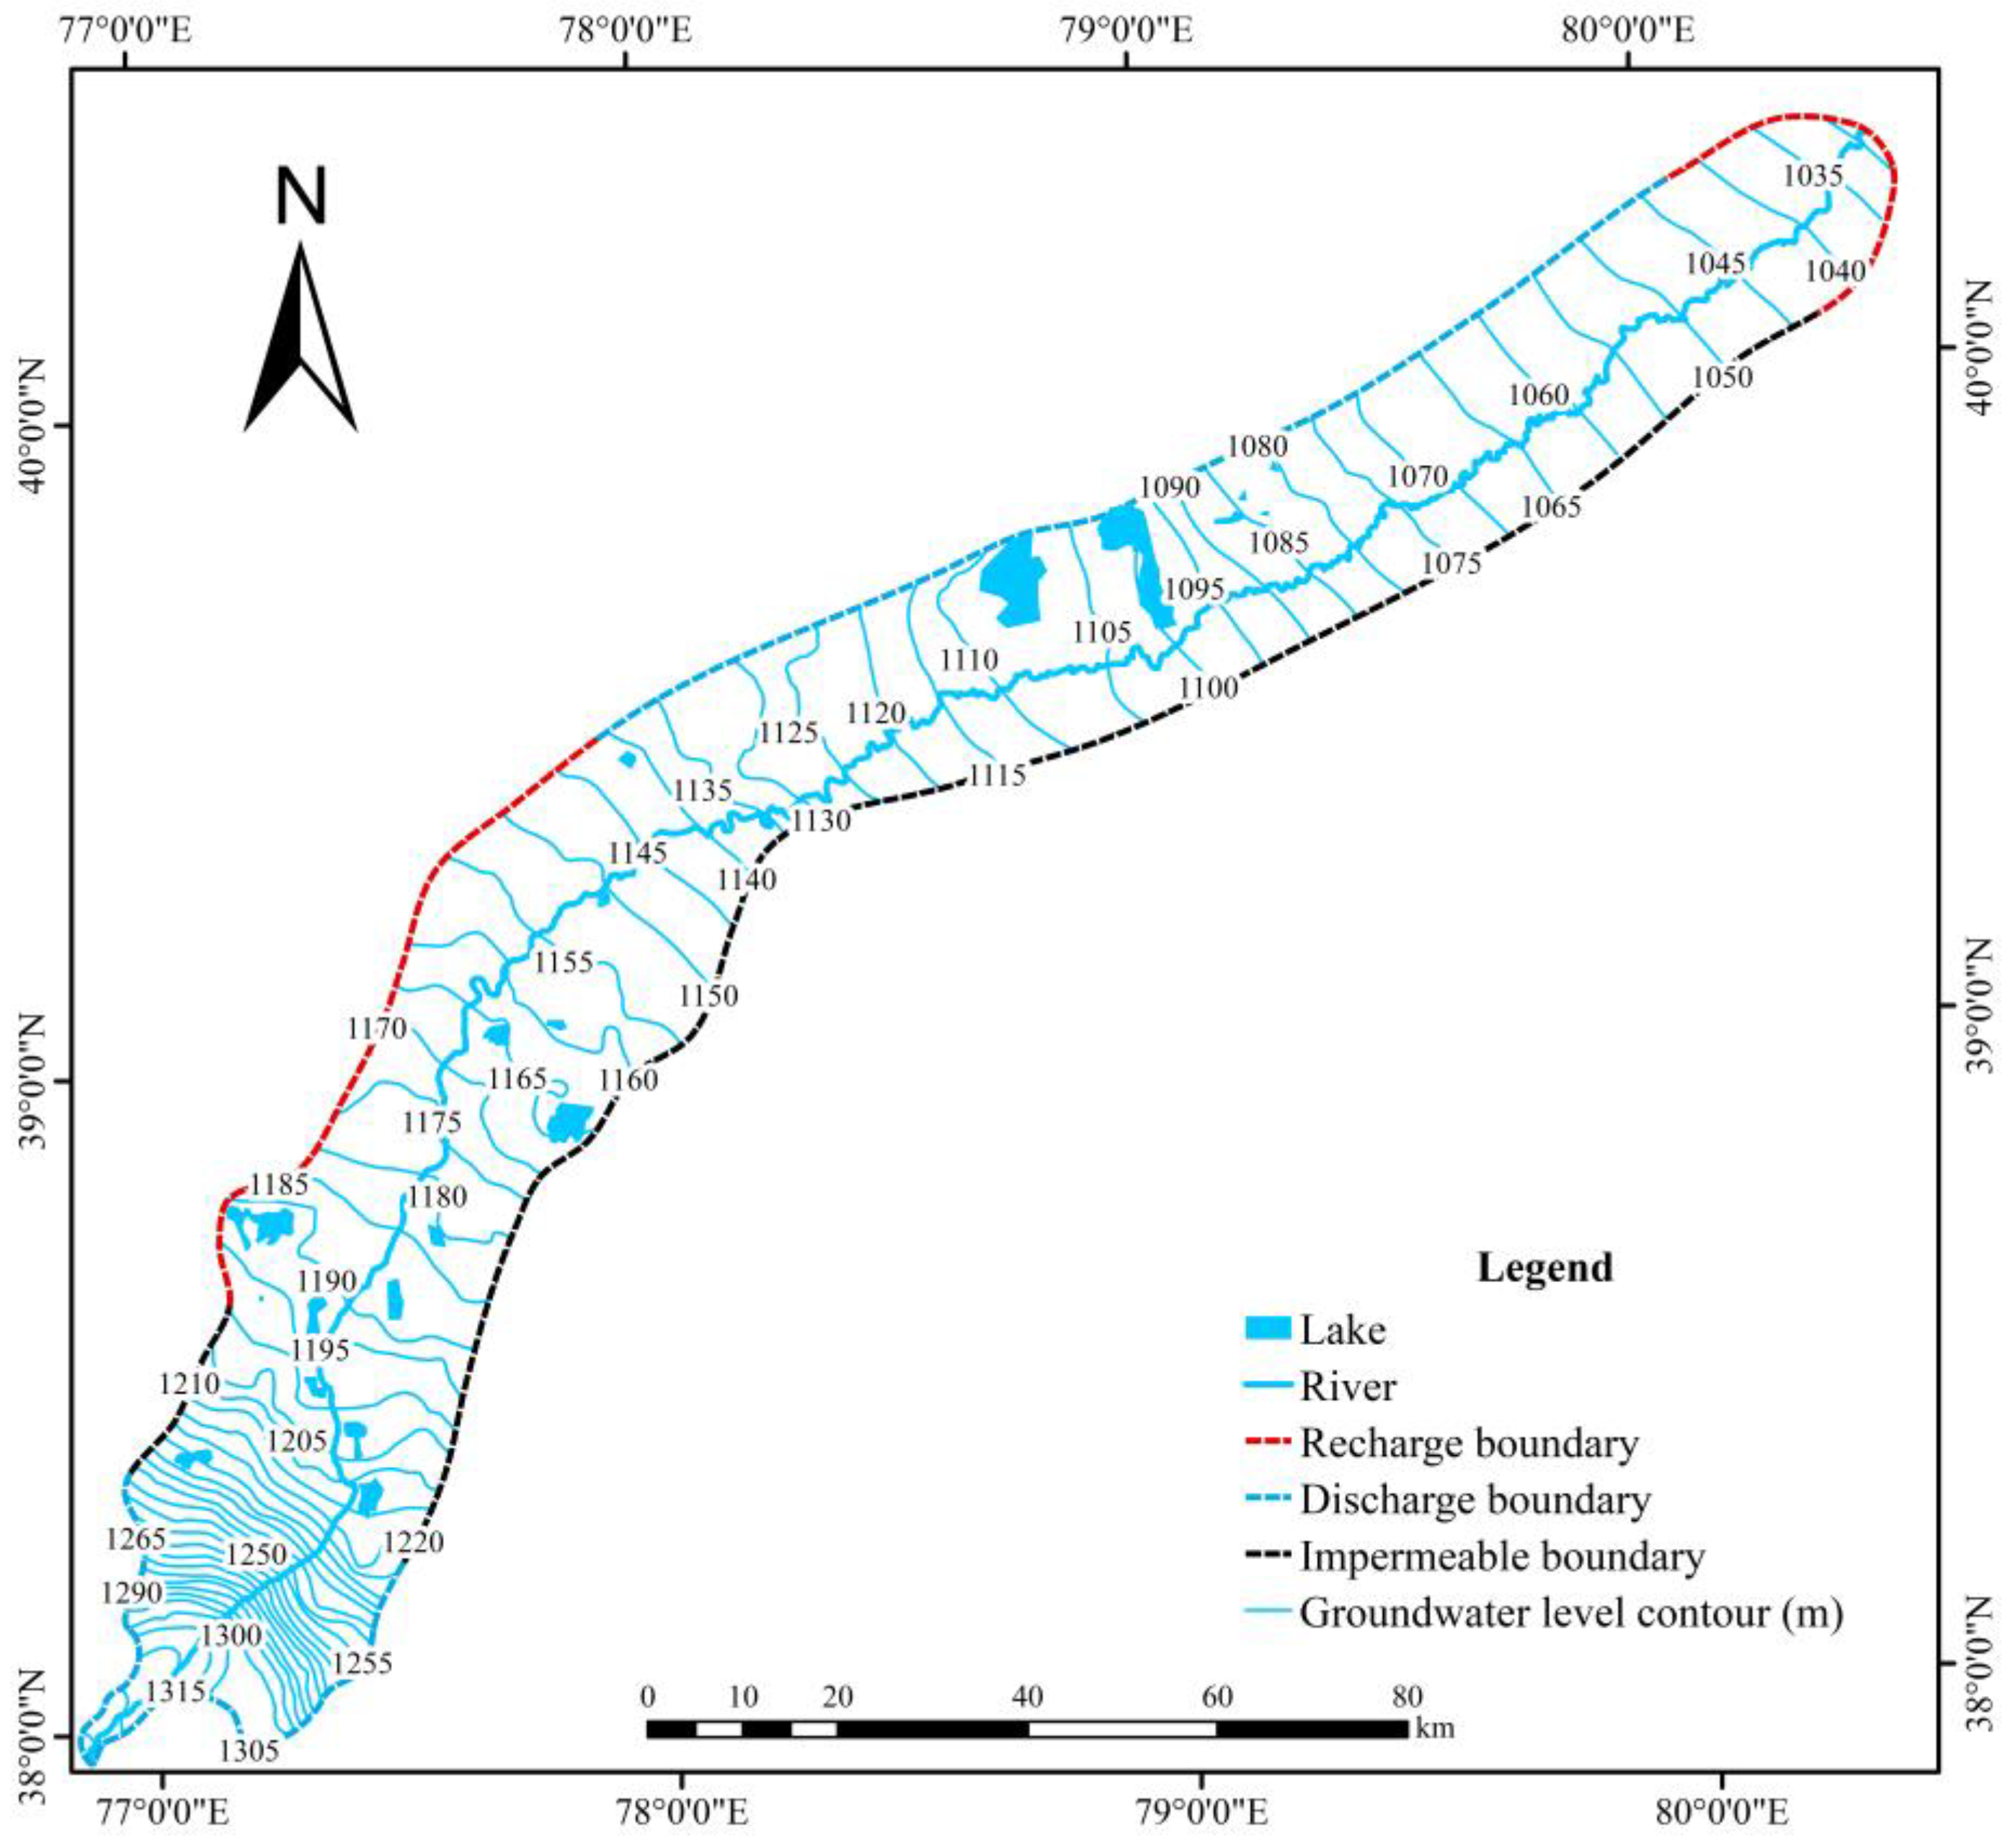
The aquifer was generalized to the thicker unconfined aquifer due to the weak compressive nature of semi-confined aquifers, as well as the fact that most of the borehole pumping in the study area was carried out with a mixture of unconfined and semi-confined aquifers. The permeability coefficients of the aquifer parameters were calculated from data gathered from in-situ pumping tests, and the distribution of the boreholes is shown in Figure 7. The isopiestic line in the study area was obtained via the Kriging interpolation of the groundwater levels measured in the boreholes [23], as shown in Figure 8.
Generalizing boundary conditions is a key step in building conceptual hydrogeological models. The boundaries can be divided into fixed head boundaries, fixed flow, and mixed boundaries based on the circumstances of water exchange and various hydrogeological conditions. Fixed flow boundaries can be divided into the recharge boundary, the discharge boundary according to the direction of the lateral recharge of the boundary, and the zero-flow boundary where the lateral recharge is zero. The lakes in the study area had a certain hydraulic connection with the groundwater and were chosen as fixed head boundaries. The southwestern parts of the boundary were perpendicular to each other in the direction of the groundwater flow, and the groundwater flowed into the study area; the northern part of the boundary received a recharge from groundwater runoff of the Kashgar River basin, so the recharge boundary was chosen. The groundwater flows out of the study area from both the western part of the boundary and the northeastern part of the boundary, and thus the discharge boundary was selected.
Along the southwestern and eastern parts of the boundary, the isopiestic line was orthogonal to the boundary, and, therefore, the no-flow boundary was selected. The rivers in the study area were coupled to the MIKE SHE link through MIKE 11. The link was set on the boundary that divided the two adjacent cells, and the river and groundwater exchanged water through the cell boundary. This treatment assumed a very thin layer of weak permeability between the river and aquifer and considered the resistance between the aquifer and riverbed layer during water exchange, which better reflected the interconversion between the surface water and the groundwater compared to a more traditional setting as a fixed head boundary. The boundary conditions of the study area are shown in Figure 8.
The groundwater balance calculation was based on the groundwater resource utilization and protection planning report for the Kashgar area prepared by the Xinjiang Corps Survey and Design Institute. The calculation of the groundwater balance in the study area mainly included the calculation of the recharge and discharge amounts. The groundwater recharge in the study area is 29.13 × 10⁸ m3/a, mainly including the lateral groundwater runoff recharge in the plain area 0.12 × 10⁸ m3/a, rainfall infiltration recharge 0.45 × 10⁸ m3/a, irrigation water infiltration recharge 5.4 × 10⁸ m3/a, reservoir seepage recharge 1.64 × 10⁸ m3/a, mountain front storm flood infiltration 0.28 × 10⁸ m3/year, 10 × 108 m3/year of canal seepage, 10.4 × 10⁸ m3/year of river seepage, etc. The groundwater discharge in the study area is 29.97 × 10⁸ m3/year, mainly including 0.22 × 10⁸ m3/a of lateral groundwater runoff discharge in the plain area, 14.55 × 10⁸ m3/a of actual groundwater extraction, 7.13 × 10⁸ m3/a of diving evaporation, 1.64 × 10⁸ m3/a of spring discharge, and 6.42 × 10⁸ m3/a of river discharge.
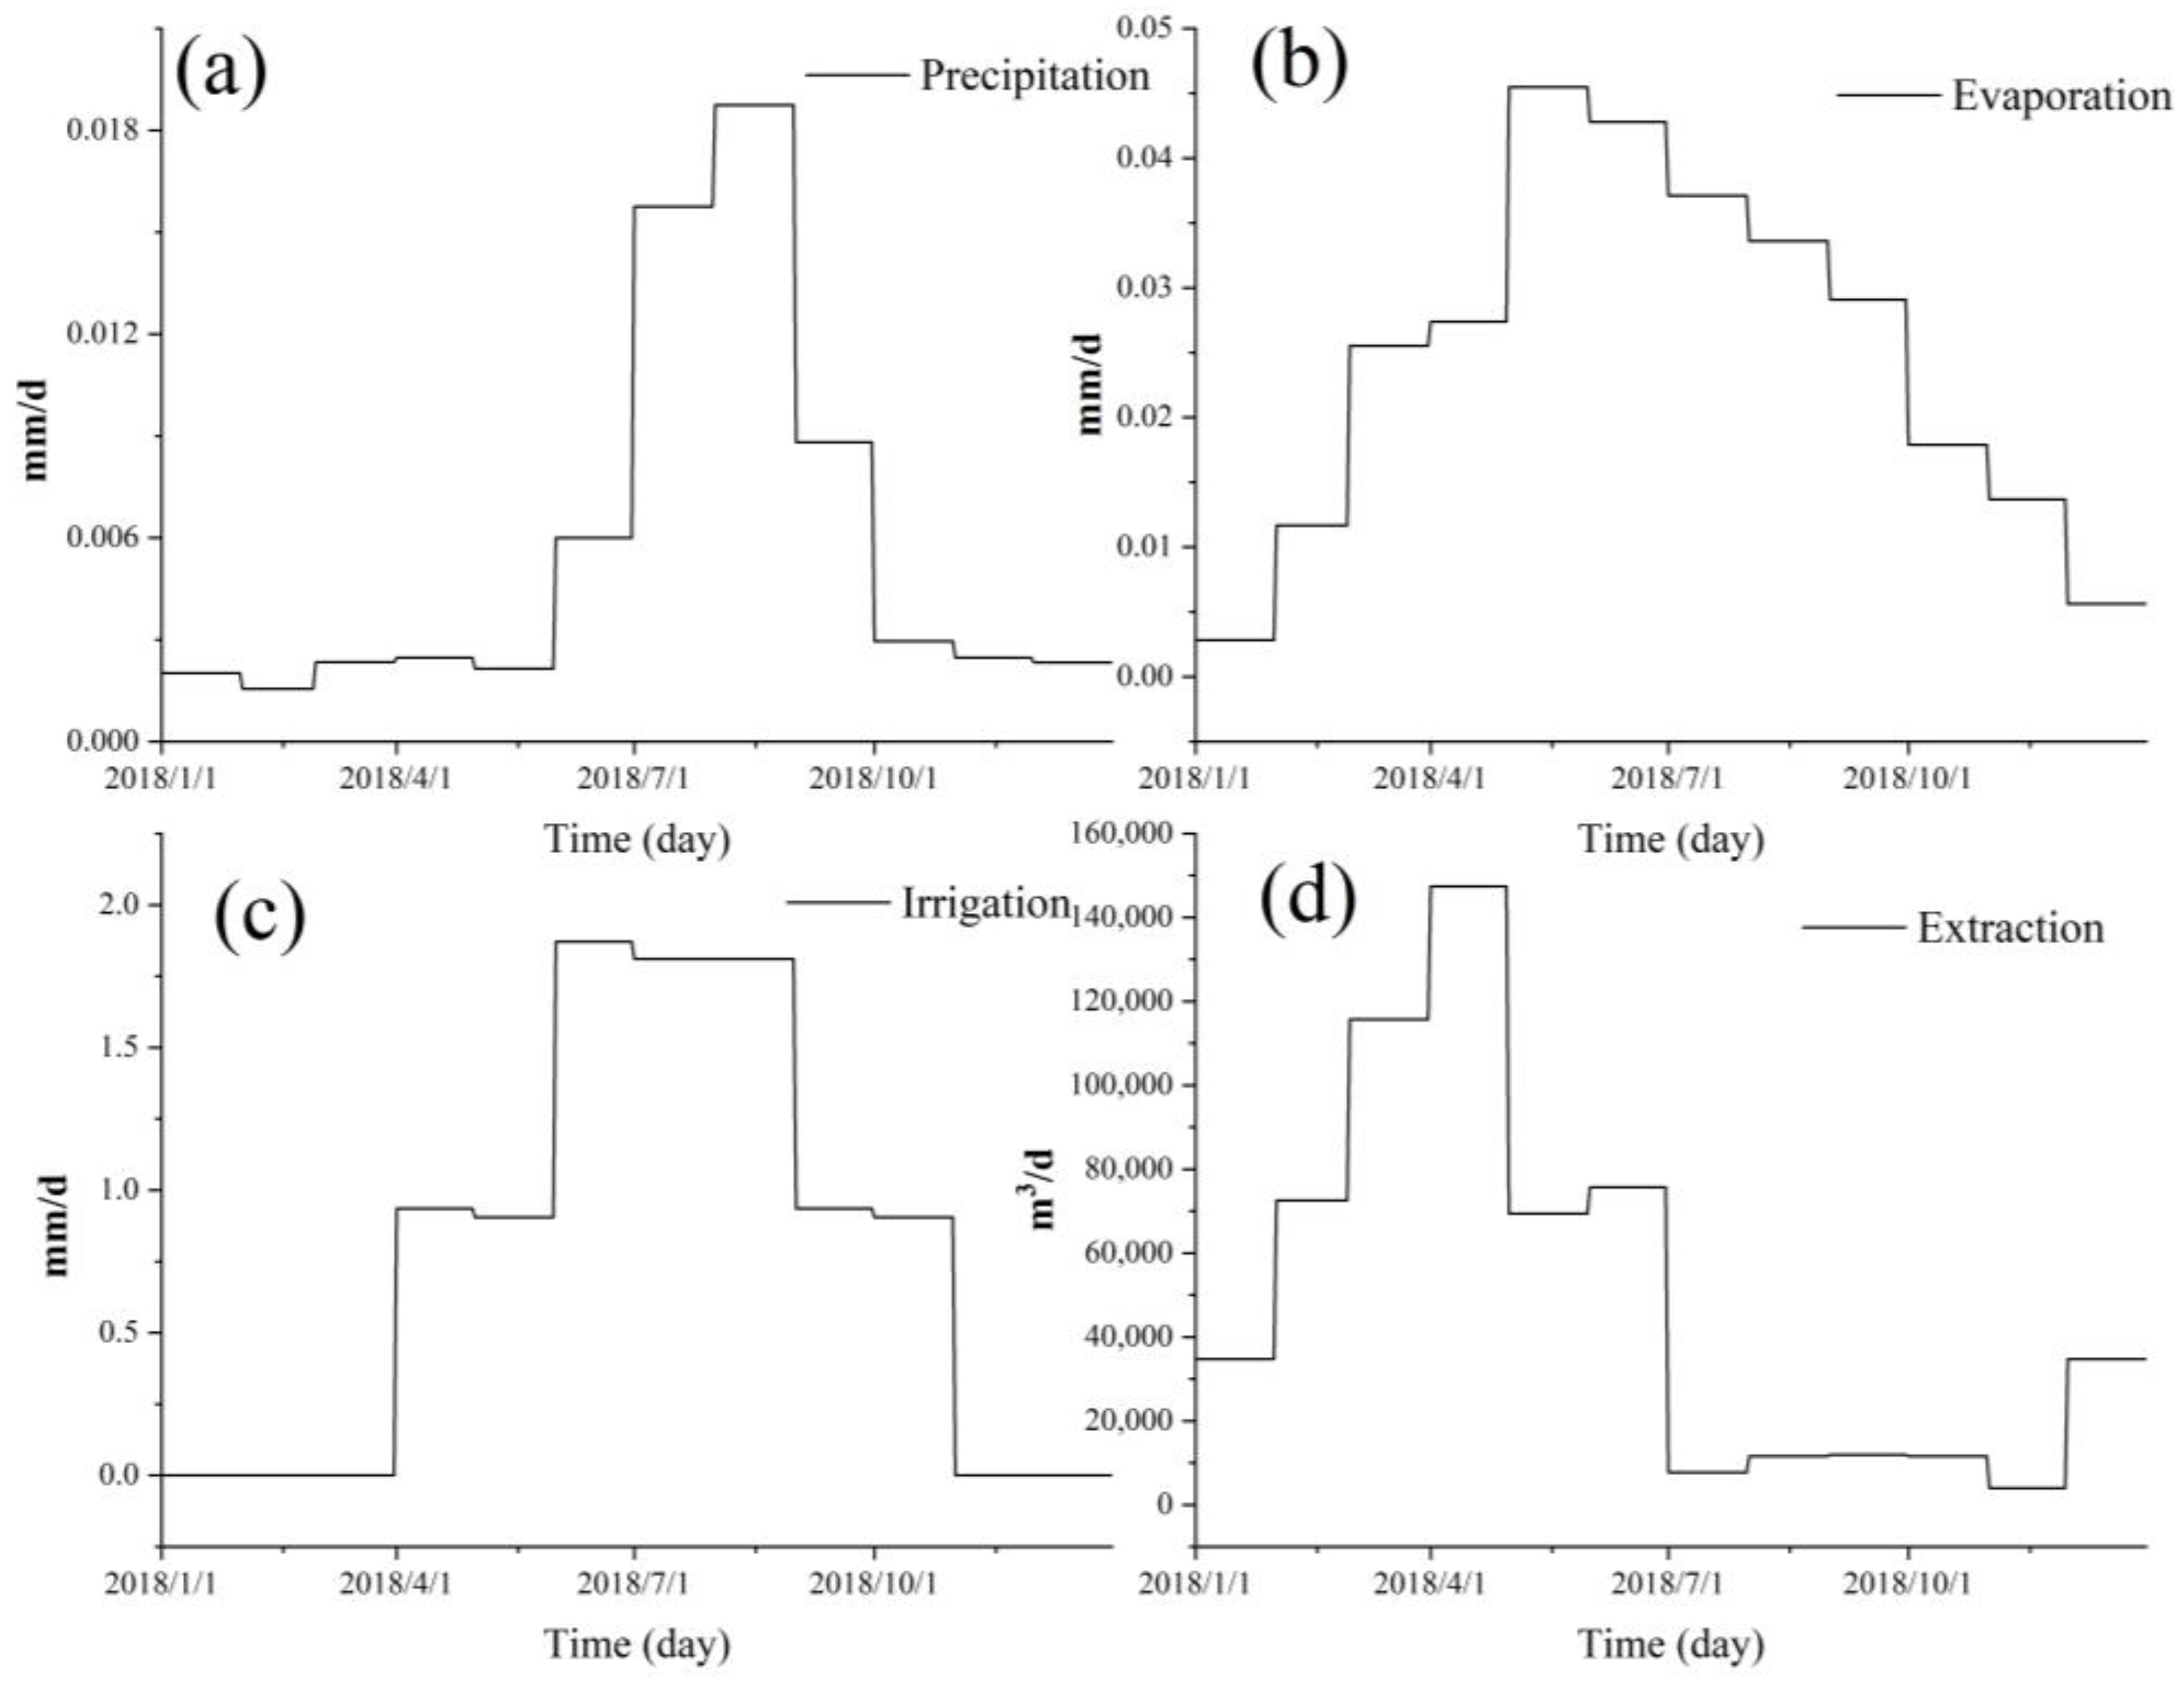
The intra-annual distribution of rainfall, evaporation, irrigation, and extraction in Shache County is shown in Figure 9 for 2018, with the amount of lateral groundwater runoff recharge and discharge generalized on the recharge and discharge boundary. The rainfall infiltration and dive evaporation are generalized in the rainfall and evaporation modules of the climate module in the MIKE SHE model, while the irrigation water infiltration recharge is generalized in the irrigation demand module of the land use type module.
The pumping well module in the model is used to generalize the extracted groundwater. According to the borehole survey, the number of boreholes in the study area was 19,052 in 2018. The annual volume of groundwater extraction was about 1940 million m3, with the groundwater extraction mainly being used for agricultural irrigation, while the amount of domestic and industrial water borehole extraction accounted for only 3% of the total extraction. Due to the large number of boreholes, they were generalized to 40, distributed in the study area according to the actual groundwater extraction proportion in each county and city, and were then extracted according to the existing irrigation period. The location of the pumping well is shown in Figure 10. The projection coordinate system of the pumping well was CGCS2000_GK _CM _75E. As the river flows are mainly concentrated in July, August, and September, for the spring irrigation, the amount of surface water was low and the irrigation water was mainly extracted from the groundwater.

2.4.3. Model Validation and Calibration

In this study, a continuous time series from 2012 to 2018 at the Kachun hydrological station of the Yarkant River was used for the simulation, where 2012 to 2015 was the rating period of the model and 2016–2018 was the validation period. In this paper, the Nash-Sutcliffe model efficiency coefficient (Ens) [24], the water balance coefficient (WB) [25], and the correlation coefficient (r) were chosen to calibrate the model. The three coefficients were calculated as follows:
E n s = 1 i = 1 n ( Q o b s , i Q s i m , i ) 2 i = 1 n ( Q o b s , i Q ¯ o b s ) 2
W B = 1 i = 1 n | Q o b s , i Q s i m , i | i = 1 n Q o b s , i
r = i = 1 n ( Q o b s , i Q ¯ o b s ) ( Q s i m , i Q ¯ s i m ) i = 1 n ( Q o b s , i Q ¯ o b s ) 2 i = 1 n ( Q s i m , i Q ¯ s i m ) 2
where: Qobs,i—is the observed flow rate at time i (m3); Qsim,i—is the simulated flow rate at time i (m3); Q ¯ o b s —is the average value of the observed flow rate during the simulated period (m3); Q ¯ s i m —is the average value of the simulated flow during the simulated period (m3); and n is the time step.
The allowable range of the Nash efficiency coefficient is between 0 and 1, with larger values indicating higher efficiencies. Meanwhile, the WB and correlation coefficients are important indicators of the model efficiency, and the closer their values are to 1, the better the results of the model rate determination are.
Additionally, Re was selected to evaluate the depth to the water table, the relative error reflects the degree of agreement between the simulated and measured values, and the calculation formula is:
Re = [ ( H s i m H o b s ) H o b s ] × 100 %
where Hsim is the simulated value and Hobs is the measured value. When the value of the water balance coefficient is greater than 0, the simulated value is large; when the value of the water balance coefficient is less than 0, the simulated value is small; and when the value of the water balance coefficient is equal to 0, the simulated value of the model matches the measured value.

3. Results and Discussion

3.1. Parameter Values after Calibration

Most of the parameters in the distributed hydrological model are physically meaningful, only need to be measured in the field, and do not require rate determination. Moreover, there have been few studies of large watersheds, and there is a lack of measurement data. In order for the model to be able to reproduce the physical characteristics of the basin more accurately, thus improving the simulation results, this paper used a manual trial-and-error approach to rate the main parameters, and iteratively adjusted the parameters based on the measured runoff data compared to the simulated runoff values. The results of this calibration are shown in Table 3. Manning M is the inverse of the more conventional Manning n. The value of n is typically in the range of 0.01 (smooth channels) to 0.10 (thickly vegetated channels). This corresponds to values of M between 100 and 10, respectively. Generally, lower values of Manning M are used for overland flow compared to channel flow [17].

3.2. Results from the Surface Runoff Calibration and Validation

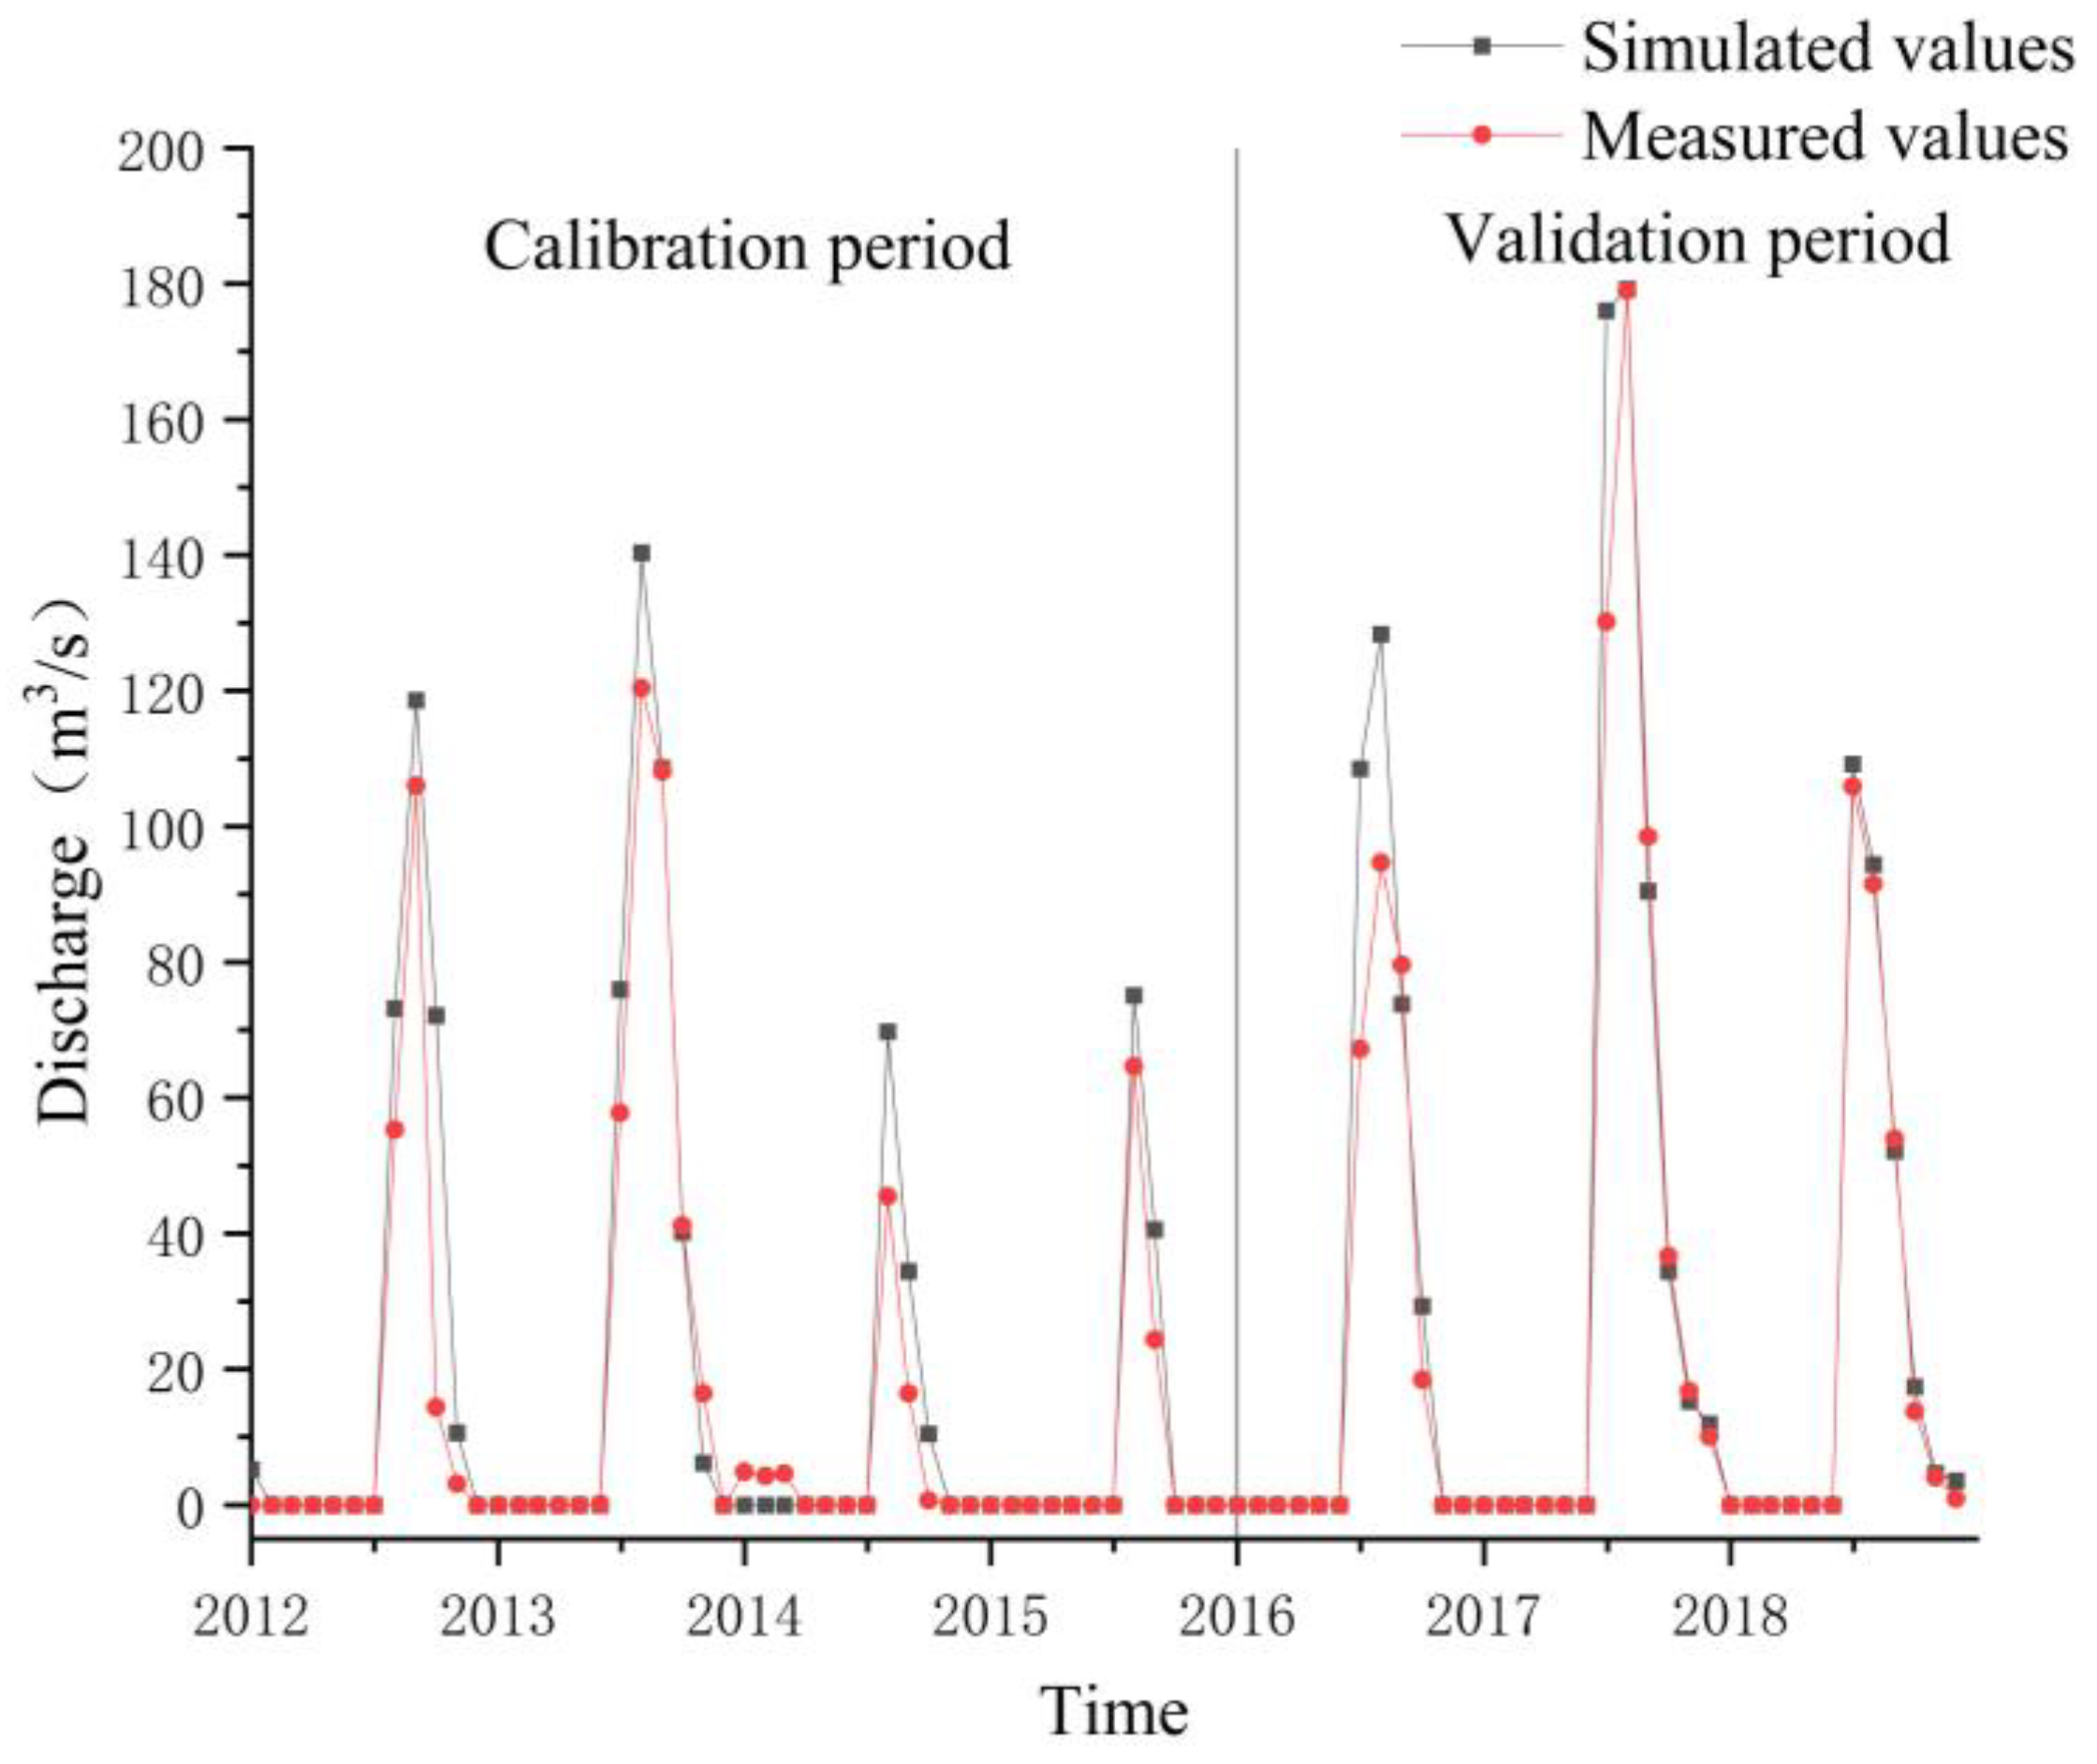
Based on the control cross-sections in the lower and middle reaches of the Yarkant River basin, the model was rate-calibrated and validated at the Hainiaz hydrological station for the series of the monthly flows from 2012 to 2018, and the results are shown in Table 4. As seen there, after calibration, the model can more accurately simulate the runoff in the Yarkant River, with similar variation trends. The low water balance coefficient in the calibration period was due to the low total runoff in 2014 and 2015, which were dry years. Comparing the simulation results of the calibration and validation periods, the results for the validation period were higher than those of the calibration period.
A comparison of the measured and simulated values for the monthly runoff at the Hainiaz hydrological station cross-section is shown in Figure 11.
In Figure 11, it can be seen that since the lower Yarkant River is seasonal, the flow distribution is uneven during the year, with the flow rapidly increasing in May and reaching a maximum in August, then decreasing in September and slowing down by January of the following year. Further analysis shows that the MIKE SHE model simulates the runoff during the dry season well. Still, the simulation of the peak runoff in the summer and autumn shows some deviations due to the single setting of the model roughness and the use of a unique value for the whole basin, which is an area that could be improved in subsequent studies.

3.3. Groundwater Simulation Validation

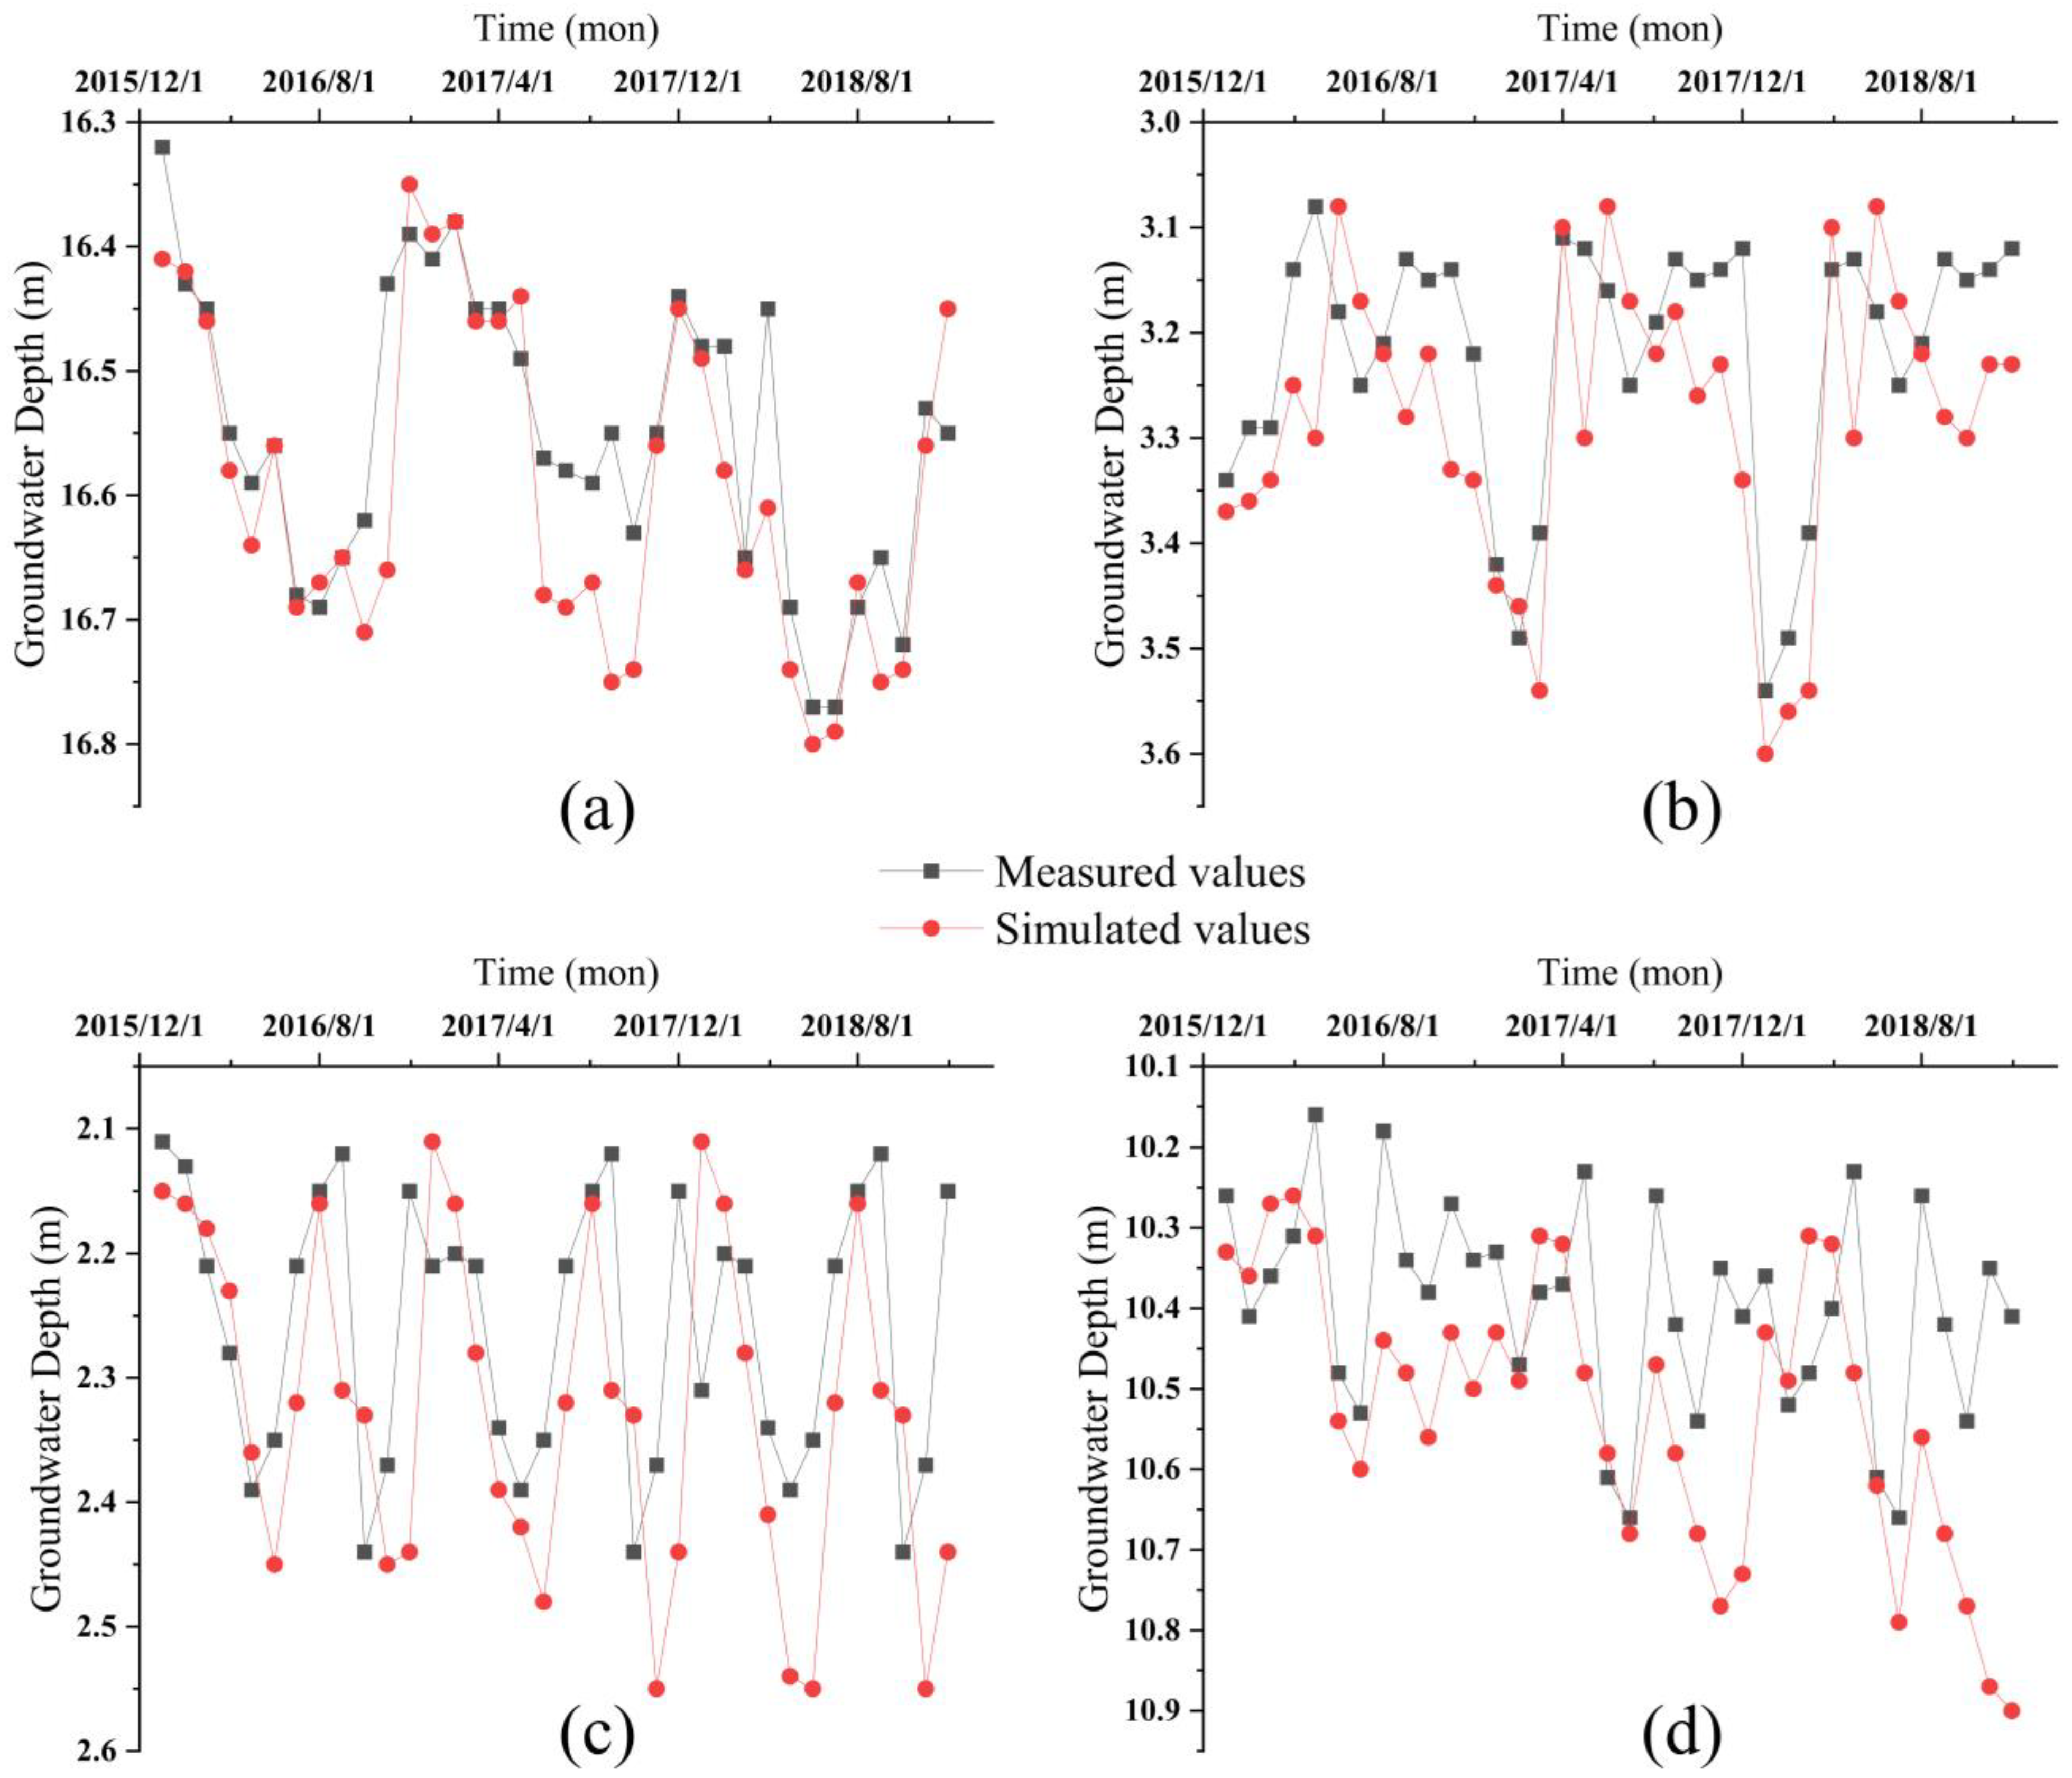
Based on the month-by-month depth to water table observation data for 2016 to 2018 from the shallow groundwater observation wells in each of the counties and townships in the lower and middle reaches of the Yarkant River, the results were compared to and verified with the groundwater simulation results, which is shown in Figure 12.
After the model calculation, the depth to water table data for the four observation wells located in the Hietidun Township, Aktamu Township, the 49th Regiment, and Tagalchi Township from 2016 to 2018 during the model validation period were both fitted and validated, as shown in Figure 12. Figure 12 shows that the simulation of the model for the depth to water table data is fairly consistent with the measured data. The groundwater table depth values decreased yearly from 2016 to 2018 due to the negative groundwater equilibrium in the study area. The groundwater level depth value decreased until June due to the effects of groundwater extraction by the spring irrigation of the crops in March. When the river was abundant in July–September, the irrigation water share relationship shifted, groundwater received a recharge from the river irrigation, and the groundwater level depth value rose. Table 5 shows that the relative error between the simulated and observed values of the depth to the groundwater table is small, and the simulated value was slightly larger than the measured value.

3.4. Sensitivity Analysis

The land use type in the study area is mainly arable land, while irrigation activities are frequent and irrigation infiltration remains an important source of groundwater recharge. Both irrigation water and river water enter the groundwater through the unsaturated zone, and, therefore, the parameters of the unsaturated zone influence the infiltration of irrigation and river water. In order to determine which unsaturated zone parameters are the most sensitive to the model’s output, a sensitivity analysis was carried out using a perturbation analysis. The perturbation analysis is one of the simplest methods of parameter sensitivity analysis, in which an artificial disturbance (for example: a 10% increase or decrease) is provided around the best estimate of a parameter, and the rate of change in the model output resulting from such fluctuations in the parameter over a small range is calculated [26]. The validated parameter values in Table 6 were used as the criterion to determine the sensitive unsaturated zone parameters by increasing the saturated water content, the water content at the wilting point, and the saturated hydraulic conductivity by 30%, as suggested by Ma (2018) [27].
The saturated water content is the maximum water content of the soil and is equal to the porosity. The residual water content is the minimum water content at very high suction pressures. The soil saturation hydraulic conductivity is the amount of water that passes through a unit area per unit water potential gradient and per unit time when the soil is saturated with water, and it is a function of the soil texture, the bulk capacity, and the pore distribution characteristics.
In the sensitivity analysis, one parameter is increased in turn and the others are then kept constant during the simulation. Table 7 shows the peak flow results for 30% increases in the saturated water content, residual water content, and saturated hydraulic conductivity parameters [26].
As can be seen from the results in Figure 13 and Table 6, the soil parameter that has the most significant effect of the three on the peak flow is the saturated water content, with a 72.8% reduction in peak flow from 39.27 m3/s to 9.42 m3/s being observed during the simulation period of 2012 to 2018.

3.5. Sensitivity Analysis for the Water Content at Saturation

For the study area, there were many land use and soil types, and the effects of adjusting one parameter on different land types and different soil types on peak runoff are ambiguous. A sensitivity analysis was therefore carried out for the saturated water contents of the soil types with the largest proportion of land use types in the study area.
In this study, the largest area of cultivated land accounted for 40% of the total study area. According to the soil type distribution map and land use type map of the study area, the proportion of the different soil types to the arable area was obtained via an overlay analysis using ArcGIS, as shown in Table 8. As can be seen from Table 8, loam accounted for the largest proportion of the cultivated area at 47.9%, while silty clay, clay loam, and sand were 16.2%, 13.7%, and 11.2%, respectively. Therefore, a sensitivity analysis was conducted for the saturated water content of the loam in the cultivated area.
Table 9 shows the variations in the peak flow rate for the saturated water content of loam in arable land when subjected to artificial disturbances increasing and decreasing by 30%.
When the saturated hydraulic conductivity increased by 30%, the minimum peak flow rate was 34.87 m3/s, a reduction of 12.2% compared to the standard value. When the saturated hydraulic conductivity was reduced by 30%, the maximum peak flow rate was 47.26 m3/s, an increase of 18.7% compared to the standard value.
Increasing the saturated water content of the soil in the unsaturated zone has a catalytic effect on river infiltration groundwater, but a peak discharge analysis alone cannot show how strongly the groundwater levels respond to changes in the saturated water content. The response of the groundwater levels to changes in the saturated water content is shown in Table 10, where the standard value of the groundwater depth for each monitoring well is the modeled average water table depth during 2018.
As can be seen from Table 10, the variation in the saturated water content of the soil in the unsaturated zone had an effect on the depth to the groundwater table values in the Hietidun Township and the 49th Regiment, but for the other two townships, where the depth to the groundwater table values exceeded 10 m, the effects of the saturated water content were weak. The mechanisms of the effect of the saturated water content on the depth value of the groundwater table needs more in-depth studies, and this paper only aims to analyze the phenomenon.

4. Conclusions

In this paper, we simulated the lower and middle reaches of the Yarkant River by establishing a distributed hydrological model with MIKE SHE, selected actual measured runoff data from the Hainiaz hydrological station to simulate and validate the model, and selected the 2016–2018 month-by-month water level burial data from four water level observation wells in the study area in order to simulate and validate the model, and to perform a sensitivity analysis on the soil parameters. We then reached the following conclusions.
Soil texture datasets can provide data on soil parameters in the inclusive zone for large watersheds that lack data for establishing a distributed hydrological MIKE SHE model. Its accuracy was experimentally corroborated through the design of the field sampling used. The established distributed hydrological model MIKE SHE simulated the runoff of the Yarkant River well, and was able to reflect the general inter- and intra-annual runoff conditions. The monthly scale runoff simulations accurately reproduced hydrological processes, with Ens coefficients greater than 0.84, water balance coefficients greater than 0.61, and correlation coefficients reaching 0.96 for both the regular and validation periods, indicating that a soil texture dataset can provide more accurate data on the soil parameters in the unsaturated zone in more extensive distributed hydrological model construction, and has applicability in the simulation of the runoff in watersheds for which information is lacking. This applies to the simulation of watershed runoff in the absence of information.
The relative errors between the proposed water table depth and the measured value were 3.45% in the Hietidun Township, 1.59% in the Aktamu Township, 2.52% in the 49th Regiment, and 0.35% in the Tagalchi Township, through the fitting of the groundwater level depth data for the validation period of 2016 to 2018. The results showed that the established distributed hydrological model could more accurately simulate dynamic changes in groundwater levels in the counties and cities in the study area for the period of 2016 to 2018.
The area of cultivated land in the study area was 40% of the total study area, and irrigation activities were more frequent. The infiltration of the river water and irrigation water is an important source of groundwater recharge, and the unsaturated zone is the recharge path. The sensitivity analysis of the soil parameters in the unsaturated zone showed that the change in the saturated water content had a large effect on the simulated peak flow of the runoff, indicating a negative correlation. The change in the saturated water content had a positive effect on areas with high groundwater levels, but had a weak effect on areas with low groundwater levels.
This study also has some limitations: for example, the number of parameters required to establish a distributed hydrological model of the study area is large, and many parameters use measured values, but due to the limited data collected, some parameters in the modeling process use empirical values, resulting in limited application of the model. Thus, in future simulations, as much as possible, measured data and collected information for modeling should be used more, reflecting a more realistic physical situation.
In summary, the established distributed hydrological model MIKE SHE has high accuracy in its use for the simulation of surface water and groundwater in the lower and middle reaches of the Yarkant River, which can help with the future management, development, and utilization of water resources in the region.

Author Contributions

Conceptualization, B.W. and S.L.; methodology, B.W.; software, B.W.; validation, S.L. and Y.G.; formal analysis, B.W.; investigation, B.W.; resources, S.L.; data curation, Y.G.; writing—original draft preparation, B.W.; writing—review and editing, B.W. and S.L. All authors have read and agreed to the published version of the manuscript.

Funding

This research received no external funding.

Data Availability Statement

The data that supports the findings of this study is available from the corresponding authors upon reasonable request.

Conflicts of Interest

The authors declare no conflict of interest.

References

  1. Hu, R.J.; Fan, Z.L.; Wang, Y.Q. Groundwater resources and their characteristics in the arid zone of northwest China. J. Nat. Res. 2002, 3, 321–326. [Google Scholar]
  2. Abbott, M.B.; Bathurst, J.C.; Cunge, J.A.; O’Connell, P.E.; Rasmussen, J. An introduction to the European Hydrological System — System Hydrologique Europeen, “SHE”, 1: History and philosophy of a physically-based, distributed modelling system. J. Hydrol. 1986, 87, 45–59. [Google Scholar] [CrossRef]
  3. Arnone, E.; Noto, L.V.; Lepore, C.; Bras, R.L. Physically-based and distributed approach to analyze rainfall-triggered landslides at watershed scale. Geomorphology. 2011, 133, 121–131. [Google Scholar] [CrossRef] [Green Version]
  4. Xiao, S.Y.; Yang, G.; He, X.L. Hydrological modeling of MIKE SHE in the Manas River basin. J. Mt. Sci. 2021, 39, 1–9. [Google Scholar] [CrossRef]
  5. Liang, M.; He, C.G.; Bian, H.F. MIKE SHE modeling of ecohydrological processes: Merits, applications, and challenges. Ecol. Eng. 2016, 96, 137–149. [Google Scholar] [CrossRef]
  6. Liu, S.W.; Liu, H.L.; Wang, L. Research on the development and application of the MIKE SHE model. Hydrology 2018, 38, 23–28. [Google Scholar]
  7. Patrick, K.; Markus, D.; Ümüt, H. Effects of Land Use and Climate Change on Groundwater and Ecosystems at the Middle Reaches of the Tarim River Using the MIKE SHE Integrated Hydrological Model. Water 2015, 7, 3040–3056. [Google Scholar] [CrossRef] [Green Version]
  8. Paparrizos, S.; Maris, F. Hydrological simulation of the Sperchios River basin in Central Greece using the MIKE SHE model and geographic information systems. Appl. Water Sci. 2017, 7, 591–599. [Google Scholar] [CrossRef] [Green Version]
  9. Jiang, L.F.; Xue, L.Q.; Liu, Y.H. Research on the effect of water-saving irrigation on groundwater levels in arid areas based on the MIKE SHE model. J. Irrig. Drain Eng. 2016, 35, 59–65. [Google Scholar] [CrossRef]
  10. Lai, D.R.; Qin, H.H.; Wan, W. Analysis of water resources utilization scenarios in North China Plain based on the MIKE SHE model. J. Water Resour. Water Eng. 2018, 29, 60–67. [Google Scholar]
  11. Guo, Y.; Wu, X.M.; Qie, Z.H. Parameter rate determination of MIKE SHE model based on BP neural network. J. Yangtze River Sci. Res. Inst. 2019, 36, 26–30. [Google Scholar]
  12. Liu, J.; Liu, T.; Huang, Y. Simulation and analysis of hydrological processes in the Yarkant River basin based on remote sensing data. Adv. Geophys. 2017, 36, 753–761. [Google Scholar]
  13. Brohan, P.; Kennedy, J.J.; Harris, I.; Tett, S.F.B.; Jones, P.D. Uncertainty estimates in regional and global observed temperature changes: A new data set from 1850. J. Geophys. Res. 2006, 111, D12106. [Google Scholar] [CrossRef] [Green Version]
  14. Ren, J.G. Study the Transformation of Three Glasses of Water in Xinjiang’s Plain Area of the Yarkant River Basin. Master’s Thesis, Chengdu University of Technology, Chengdu, China, 2004. [Google Scholar]
  15. Chen, Y.N.; Yang, Q.; Luo, Y. Reflections on Water Resources in the Northwest Arid Zone. AZG 2012, 35, 1–9. [Google Scholar]
  16. Zhai, J.Q.; Liu, K.; Zhao, Y. Research progress of groundwater level regulation methods and models in oases in arid areas. J. Hydrol. 2021, 41, 1–7. [Google Scholar] [CrossRef]
  17. Huang, C.J.; Li, C.G.; Jing He, F.X. Impact of land use and precipitation changes on groundwater level in the area around the Yellow River in the Zhongning section of Ningxia based on the MIKE SHE model. Hydropower Energy Sci. 2022, 40, 14–17. [Google Scholar]
  18. Park, G.T.; An, S.H.; Jang, D.W. Runoff Estimation in Ungauged Watershed and Sensitivity Analysis According to the Soi Characteristics: Case Study of the Saint Blaise Vallon in France. Sustainability 2022, 14, 9848. [Google Scholar] [CrossRef]
  19. Lu, R.K. Soil Agricultural Chemical Analysis Method; Chinese Agricultural Science and Technology Press: Beijing, China, 1999. (In Chinese) [Google Scholar]
  20. Zhang, J. Study on the Evolution of Groundwater Quality and Its Formation Mechanism in the Plain Area of the Yarkant River Basin. Ph.D. Thesis, Xinjiang Agricultural University, Urumqi, China, 2021. [Google Scholar]
  21. Rouhani, S.; Myers, D.E. Problems in space-time kriging of geohydrological data. Math. Geol. 1990, 22, 611–623. [Google Scholar] [CrossRef]
  22. Zhang, J.; Zhou, J.L.; Nai, Y.H. Spatial distribution and causes of shallow groundwater salinization in the plain area of Yarkant River basin, Xinjiang. J. Agric. Engitaly 2019, 35, 126–134. [Google Scholar]
  23. Nash, J.E.; Sutcliffe, J.V. River flow forecasting through conceptual models part I-a discussion of principles. J. Hydrol. 1970, 10, 282–290. [Google Scholar] [CrossRef]
  24. Ma, Q. Research on Drought Assessment and Forecasting Model of Huangshui Basin Based on MIKE SHE Model. Master’s Thesis, Northwest Agriculture and Forestry University of Science and Technology, Xi’an, China, 2014. [Google Scholar]
  25. Wang, Z.G.; Xia, J.; Liu, C.M.; Ou, C.P.; Zhang, Y.Y. Exploration of parameter rate determination and sensitivity analysis of distributed hydrological model. J. Nat. Resour. 2007, 4, 649–655. [Google Scholar]
  26. Ma, Q. Deterministic Hydrological Modelling for Real Time Decision Support System: Application to the Var Catchment. Ph.D. Thesis, Université Côte d’Azur, Nice, France, 2018. [Google Scholar]
  27. Mariotti, A.; Blard, P.H.; Charreau, J.; Petit, C.; Molliex, S.; Bourles, D.L. Denudation systematics inferred from in situ cosmogenic10Be concentrations in fine (50–100 µm) and medium (100–250 µm) sediments of the Var River basin, southern French Alps. Earth Surf. Dynam. 2019, 7, 1059–1074. [Google Scholar] [CrossRef] [Green Version]
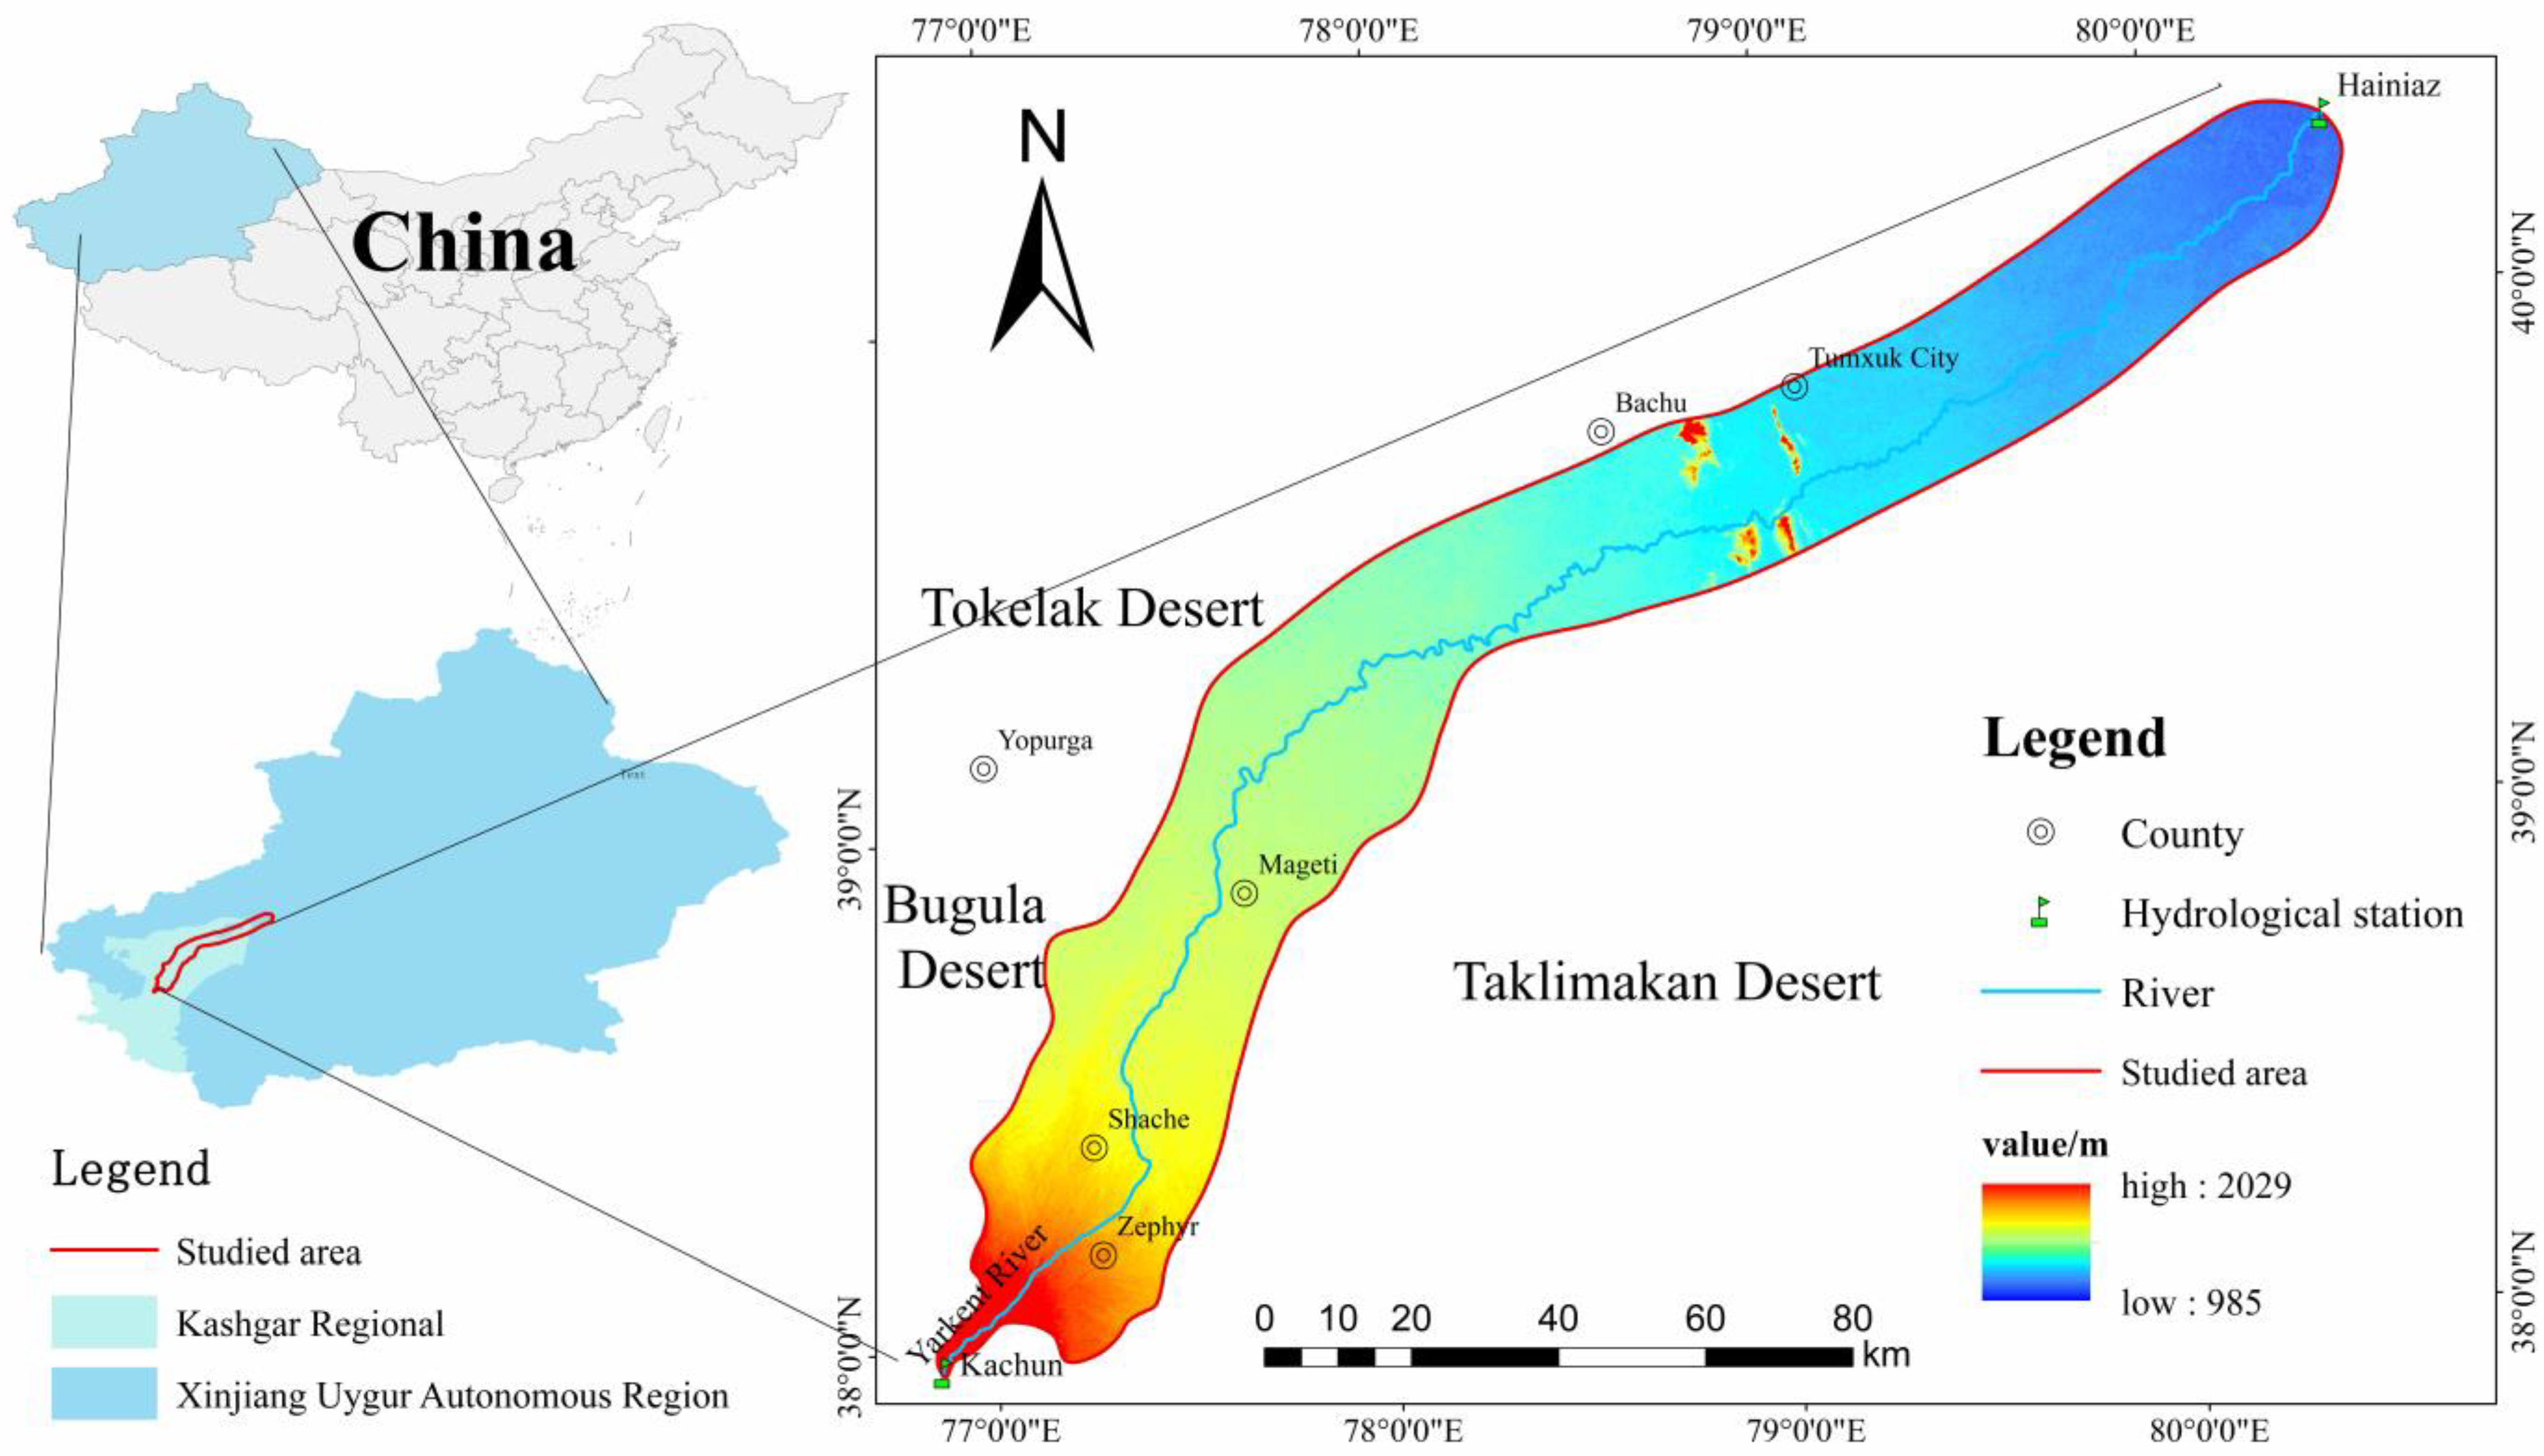
Figure 1. Location of the Yarkant River Basin, China.
Water 15 02492 g001
Figure 2. Geomorphological features of Yarkant River. (A) Morphological characteristics of the river at a distance of 22 km from the starting mile of the study area. (B) Photographs of river cross-sections in Bachu County. (C) Typical river cross section files in MIKE 11.
Water 15 02492 g002
Figure 3. Land use types.
Water 15 02492 g003
Figure 4. Soil types and sampling sites.
Water 15 02492 g004
Figure 5. The hydrogeological profile of A–A’ section.
Water 15 02492 g005
Figure 6. Regional hydrogeological map of the plain area of the Yarkant River Basin [23].
Water 15 02492 g006
Figure 7. The distribution of the boreholes.
Water 15 02492 g007
Figure 8. Boundary condition generalization diagram.
Water 15 02492 g008
Figure 9. Time series data for 2018 in Shache County: (a) Precipitation, (b) Evaporation, (d) Extraction. (c) Amount of irrigation in the study area.
Water 15 02492 g009
Figure 10. Location of pumping well.
Water 15 02492 g010
Figure 11. Monthly-scale measured and simulated flow values for 2012 to 2018.
Water 15 02492 g011
Figure 12. Depth to water table fitting diagram: (a) Tagalchi Township, (b) 49th Regiment, (c) Hietidun Township, (d) Aktamu Township.
Water 15 02492 g012
Figure 13. Peak discharge according to the 30% increase in the parameters.
Water 15 02492 g013
Table 1. Types and sources of the data used in the study.
Data TypesDescription of the DataData Sources
DEM dataResolution 30 × 30 mhttp://www.gscloud.cn (accessed on 14 June 2022)
Meteorological dataMonthly data of five weather stations from 2012 to 2018Kashgar Regional Meteorological Bureau
Land use dataLand use data at a 30 m spatial resolutionhttp://www.globallandcover.com (accessed on 29 June 2022)
Hydrological dataMonthly runoff data of Kachun and Hainiaz hydrological station from 2012 to 2018Xinjiang Institute of Water Resources and Hydropower Survey and Design
Soil dataResolution 1 kmNational Scientific Data Center for Glacial Permafrost Desert (http://www.ncdc.ac.cn) (accessed on 29 June 2022).
Soil particle data9 sampling sitesXinjiang Geotechnical Testing Centre
Borehole data261 boreholes, including parametric and groundwater level dataXinjiang Corps Survey and Design Institute
Groundwater balance dataGroundwater recharge and discharge in the study areaXinjiang Corps Survey and Design Institute
Table 2. The value of the parameters of the land use types in the research area [19].
CodeLand Use TypesLAIRoot Depth (mm)
10cropland1.5–5.0200–1000
20woodland6.0800
30grassland1.1–4.0300
40shrubland6.0800
50wetland0.8100
60water body00
80building land0.8100
90bare land00
Table 3. Results of the parameter calibration.
ParameterValueUnit
Rivers and lakes
Resistance value Yarkant riverbed (Manning M)45m1/3·s−1
Leakage coefficient0.00001
Overland Flow
Resistance value (Manning M)35m1/3·s−1
Detention storage0.01mm
Initial water depth0m
Saturated & Unsaturated zones
Sand: Qs; Qr; Sy; Ks0.38; 0.08; 0.33; 1.0 × 10⁻³—; —; —; m/s
Loamy sand: Qs; Qr; Sy; Ks0.07; 0.31; 2.3 × 10⁻⁴—; —; —; m/s
Sandy loam: Qs; Qr; Sy; Ks0.02; 0.30; 1.2 × 10⁻⁴—; —; —; m/s
Loam: Qs; Qr; Sy; Ks0.02; 0.15; 5.2 × 10⁻⁵—; —; —; m/s
Silty loam: Qs; Qr; Sy; Ks0.08; 0.18; 4.7 × 10⁻⁵—; —; —; m/s
Silt: Qs; Qr; Sy; Ks0.28; 0.11; 0.14; 5.0 × 10⁻⁵—;—;—;m/s
Silty clay: Qs; Qr; Sy; Ks0.27; 0.09; 0.11; 2.6 × 10⁻⁶—;—;—;m/s
Clay: Qs; Qr; Sy; Ks0.56; 0.22; 0.05; 3.0 × 10⁻⁶—;—;—;m/s
Notes: Qs: saturated moisture content (-); Qr: residual moisture content (-); Sy: specific yield (-); Ks: saturated hydraulic conductivity (m/s).
Table 4. Monthly runoff simulation results.
StageMonthly Runoff
Efficiency CoefficientWater Balance CoefficientCorrelation Coefficient
Calibration period0.850.610.96
Validation period0.930.830.97
Table 5. Depth to water table verification.
Location of the Observation WellsHietidun TownshipAktamu Township49th RegimentTagalchi Township
Relative Error3.45%1.59%2.52%0.35%
Table 6. Standard soil parameter values.
Water Content at
Saturation
Water Content at
Wilting Point
Saturated Hydraulic Conductivity (m/s)
Sand0.380.081.0 × 10−3
Loamy sand0.390.072.3 × 10−4
Sandy loam0.330.101.2 × 10−4
Loam0.390.125.2 × 10−5
Silty loam0.290.084.7 × 10−5
Silt0.280.115.0 × 10−5
Silty clay0.370.192.6 × 10−6
Clay0.560.223.0 × 10−6
Peak Discharge: 39.72 m3/s
Table 7. An amount of 30% increased water content at saturation.
Water Content at
Saturation
Water Content at
Wilting Point
Saturated Hydraulic Conductivity (m/s)
Sand0.4940.081.0 × 10−3
Loamy sand0.5070.072.3 × 10−4
Sandy loam0.4290.101.2 × 10−4
Loam0.5070.125.2 × 10−5
Silty loam0.3770.084.7 × 10−5
Silt0.3640.115.0 × 10−5
Silty clay0.4810.192.6 × 10−6
Clay0.7280.223.0 × 10−6
Peak Discharge: 9.42 m3/s
Table 8. Percentage of area of the different soil types in arable land.
ClayClay LoamLoamSandSandy Clay LoamSandy
Loam
Silty
Clay
Silty
Loam
Arable land0.5%13.7%47.9%11.2%2.1%0%16.2%8.4%
Table 9. Change range of the water content at saturation.
Range−30%−20%−10%Standard+10%+20%+30%
Loam0.2730.3120.3510.3900.4290.4680.507
Peak Discharge (m3/s)47.2646.543.5839.7236.5235.3434.87
Table 10. Depth to the groundwater table response to the saturated water content.
Range−30%−20%−10%Standard+10%+20%+30%
Loam0.2730.3120.3510.3900.4290.4680.507
Hietidun Township
(m)
2.402.382.352.342.312.302.29
Aktamu Township
(m)
10.6110.6110.6010.6010.5910.5710.57
49th Regiment
(m)
3.353.343.323.323.333.343.36
Tagalchi Township
(m)
16.6516.6516.6516.6516.6516.6516.65
Disclaimer/Publisher’s Note: The statements, opinions and data contained in all publications are solely those of the individual author(s) and contributor(s) and not of MDPI and/or the editor(s). MDPI and/or the editor(s) disclaim responsibility for any injury to people or property resulting from any ideas, methods, instructions or products referred to in the content.