Article

Analysis of Structure Stability of Underwater Shield Tunnel under Different Temperatures Based on Finite Element Method

1
CCCC Tunnel and Bridge (Nanjing) Technology Co., Ltd., Nanjing 211899, China
2
Productivity Centre of Jiangsu Province, Nanjing 210042, China
3
College of Water Conservancy and Civil Engineering, Zhengzhou University, Zhengzhou 450001, China
*
Author to whom correspondence should be addressed.
Water 2023, 15(14), 2577; https://doi.org/10.3390/w15142577
Submission received: 6 May 2023 / Revised: 25 June 2023 / Accepted: 3 July 2023 / Published: 14 July 2023
(This article belongs to the Special Issue Safety Evaluation of Dam and Geotechnical Engineering)

Abstract

:
The structural stability of the underwater shield tunnel during operations is affected by temperature variations. The effect of different structure temperatures on the underwater shield tunnel during the operation period was studied. By numerical simulation, the variation in the underwater shield tunnel temperature circle was analyzed. The variation patterns of the top arch, bottom arch, waist arch temperature, maximum principal stress, and settlement of the soil under different temperatures were obtained. The results showed that: (1) The early excavation time of the tunnel was short, and the temperature circle was small. The temperature circle expanded rapidly after 50 days of operating. The diffusion range increased from 1.5 m to 5.35 m: an increase of 256.7%. With the increase in time, the expansion rate of the temperature circle gradually slowed down. (2) The higher the temperature of the soil, the more complex the temperature transfer between the soil and the lining was while generating greater temperature stresses and reducing the safety of the tunnel. (3) When the tunnel was just excavated, the compression settlement of the top arch and the waist arch increased rapidly, reaching 5.43 mm and 0.24 mm, respectively. The bottom arch was squeezed by the soil on both sides, resulting in an uplift and rapid increase, reaching 4.94 mm. The settlement rate increased with the increase in the tunnel structure’s temperature. After the excavation, with the decrease in temperature, the strength of the soil and lining increased. The settlement of the top arch, bottom arch, and waist arch increased slowly with time, and the growth rate decreased gradually.

1. Introduction

With the continuous development of water conservancy in China over recent years, the technology of underwater shield tunnels has been developed rapidly. Some safety accidents in shield tunnels are caused by high temperatures in the tunnel’s structure [1,2,3]. The environmental control of the underwater shield tunnel operation represented by structure temperature has become a problem that must be considered in the underwater shield tunnel design [4,5]. This phenomenon could lead to safety hazards in the tunnel. The life safety of workers could also be affected [6,7,8]. Therefore, problems relating to structure temperature in underwater shield tunnels need to be studied in depth.
At present, there have been a large number of related studies to temperature [9,10,11,12,13,14]. The influence of the temperature disturbance caused by underwater shield tunnel construction on the temperature distribution of the soil and lining structure was studied, and a new finite difference temperature prediction model was proposed [13]. Based on the k-ε turbulence equation, a two-dimensional axisymmetric model coupling the convective-conduction heat transfer was established, and the airflow temperature field in a high-temperature underwater shield tunnel was investigated [15]. Zhou et al. [16] used the finite difference method to study a transient heat transfer model during the tunnel operation and investigated the effects of mechanical ventilation and the train piston wind on the tunnel’s temperature field. The effect of high temperatures from fires on tunnel structures has also been studied by many scholars [17,18,19]. The flow route of the fire-induced high-temperature airflow through the tunnel was proposed [20,21]. However, numerical simulation studies on the effects of high temperatures on underwater shield tunnel structures during operation are scarce. The high temperature, stress, and settlement changes in the tunnel cannot be better simulated by constructing a two-dimensional model. It is necessary to analyze the mechanical properties of tunnels under high-temperature conditions in the context of actual working conditions.
In this paper, a 3D model of an underwater shield tunnel in a different temperature environment was established. According to the temperature conditions of the underwater shield tunnel, the corresponding model parameters were given. Different thermodynamic parameters were set for the tunnel lining according to different temperatures, and temperature changes in the tunnel and lining were observed. The temperature, maximum principal stresses, and settlement changes to the top arch, bottom arch, and waist arch of the tunnel structure under different temperatures were analyzed. The results of this study provide a reference for similar working conditions.

2. Model Working Conditions

Based on the geological conditions of a tunnel, ABAQUS was used to model the soil and lining parameters, as shown in Table 1 and Table 2. The 3D underwater shield tunnel model was 33 m × 33 m in height and width, 50 m in longitudinal length, with a tunnel diameter of 15.0 m and a lining thickness of 0.5 m. The initial temperatures of the soil and lining were taken to be 100 °C and 20 °C, respectively. The forced convection heat transfer coefficient between the soil and the air was 30 W/(m2·°C). The forced convection heat transfer coefficient between concrete and air was 45 W/(m2·°C). The ambient temperature of the soil and lining was 20 °C. The densities of the soil and lining were 2630 kg/m3 and 2400 kg/m3, respectively. Transient temperature-displacement coupled analysis steps were used. The model had a hexahedral C3D8T unit. To ensure the accuracy and reliability of the calculations, the tunnels and their surroundings were subdivided into meshes to make the results more accurate.
The underwater shield tunnel model was divided into two solid parts, the soil, and the lining, as shown in Figure 1. Earth stresses were balanced in the soil prior to the excavation of the tunnel. The stiffness migration method was used, i.e., by killing the soil during excavation and activating the lining during assembly through the ABAQUS life and death unit function to achieve a change in stiffness from low to high. The transfer in temperature and stress in the tunnel was achieved by setting up a transient temperature-displacement coupled analysis step. Displacements in the X and Y directions were constrained by the horizontal X and Y axes, respectively, and these displacements at the bottom were constrained by the Z direction. No constraints were added to the upper part.

3. Analysis of Results

3.1. Analysis of the Temperature Field in Underwater Shield Tunnels

As can be seen from Figure 2, after the excavation of the diversion tunnel was completed and after 100 days of operating, the temperature of the part of the soil in contact with the lining changed, and a temperature circle appeared and expanded. As can be seen from Figure 2a, when the tunnel was freshly excavated, the soil was just in contact with the lining, and there was no temperature transfer. From Figure 2a,b, after 2 days of excavation, the temperature transfer between the soil and the liner occurred, and a temperature circle appeared. Due to the short contact time, the temperature circle was small, with a radius of 4.5 m, excluding the lining radius, and the temperature circle spread was 1.5 m. Because of the heat transfer between the liner and the air, the temperature on the inside of the liner showed a slight increase to 20.02 °C. From Figure 2b,c, the temperature circle expanded rapidly after 50 days of operation. The diffusion range increased from 1.5 m to 5.35 m at an increase of 256.7%. The temperature on the inside of the liner showed an increase compared to the completion of the excavation, reaching 21.16 °C. From Figure 2c,d, after 100 days of operating, the growth rate of the temperature circle slowed down, and the diffusion range increased from 5.35 m to 7.1 m: an increase of 32.7%.
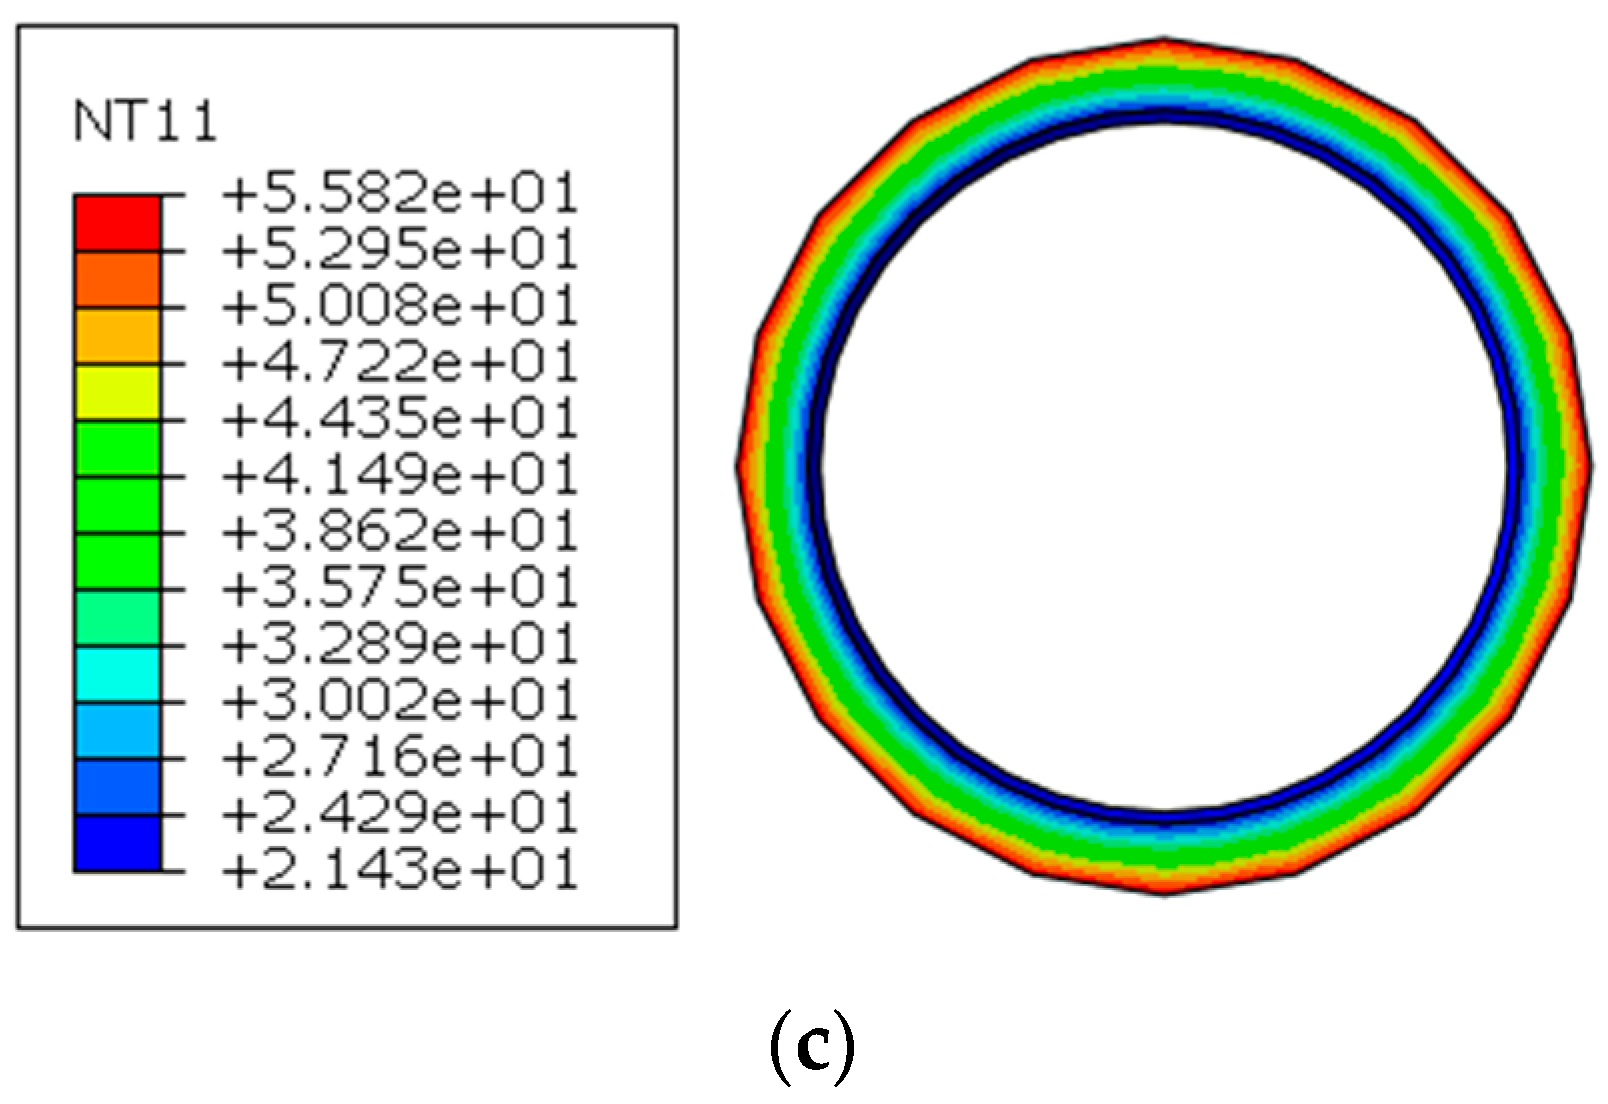
Figure 3 shows the lining temperature variation diagram. As can be seen from Figure 3a, after the excavation of the tunnel was complete, the temperature of the contact surface between the outer side of the lining and the soil was 92 °C. The modulus of elasticity of the liner decreased at high temperatures, and there was a difference of 71.98 °C from 20.02 °C on the inside of the liner. Large temperature gradients tend to produce large temperature stresses, and care should be taken during construction. Figure 3b shows that after 50 days of operating, the temperature of the outer liner contact surface with the soil was 60.84 °C: a significant reduction of 33.87% compared to when the excavation was completed. Figure 3c shows that after 100 days of operating, the temperature at the contact surface between the outer liner and the soil was 55.82 °C: a decrease of 8.25% compared to the temperature at 50 days of operating. This indicates that the temperature drop at the contact between the liner and the soil was greater in the early stage when the temperature difference between the liner and the soil was larger and slowed down in the later stage when the temperature difference decreased.

3.2. Analysis of Temperature Transfer between Envelope and Lining

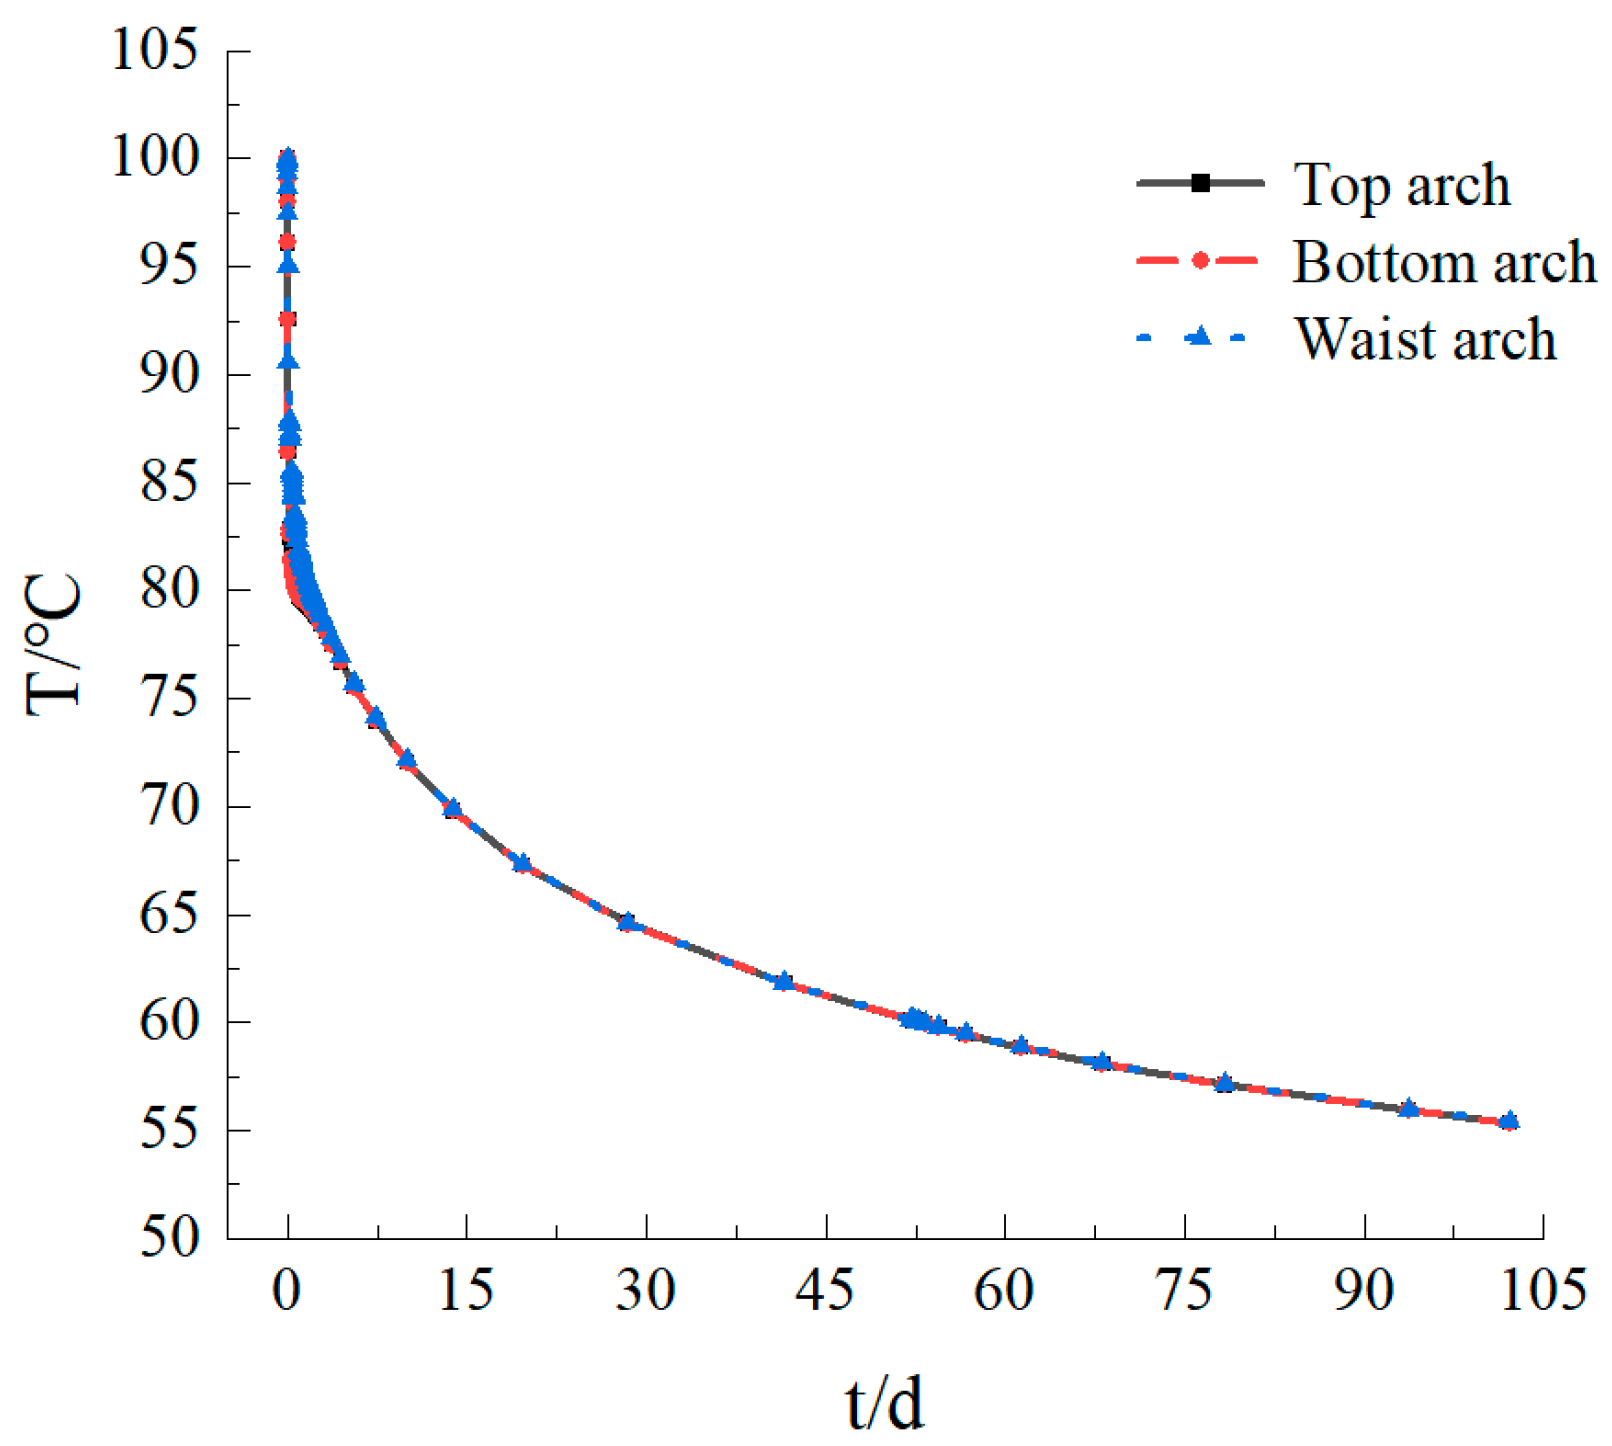
In order to analyze the temperature variation rule at the contact point between the soil and the lining with high temperature, based on the numerical simulation results, the temperature variation curves of the top arch, bottom arch, and waist arch of the tunnel were selected for analysis. As can be seen from Figure 4, the temperature curves of the top and bottom arches of the tunnel were the same over time. The change in temperature at the waist arch was slower than that of the top and bottom arches in the early part of the curve, and the same was true of the later part. The overall temperature of the three curves showed a rapid decrease with time, followed by a slow decrease, which was consistent with the numerical simulation results of Xu et al. [22], indicating the feasibility of the model developed in this paper. At the completion of the tunnel excavation, the temperature of the top, bottom, and waist arches was around 79 °C. After 50 days of operating, the temperature dropped to 60 °C, which was 24% lower than when the excavation was completed. After 100 days of operating, the temperature was 55 °C, which was 8.3% lower than after 50 days of operating. In the early stages, the temperature dropped faster because of the larger temperature difference between the soil and the lining and the large heat transfer coefficient, while in the later stages, the temperature difference between the soil and the lining decreased; as the heat transfer coefficient decreased the temperature dropped slower.

3.3. Analysis of the Maximum Principal Stress between the Soil and the Lining

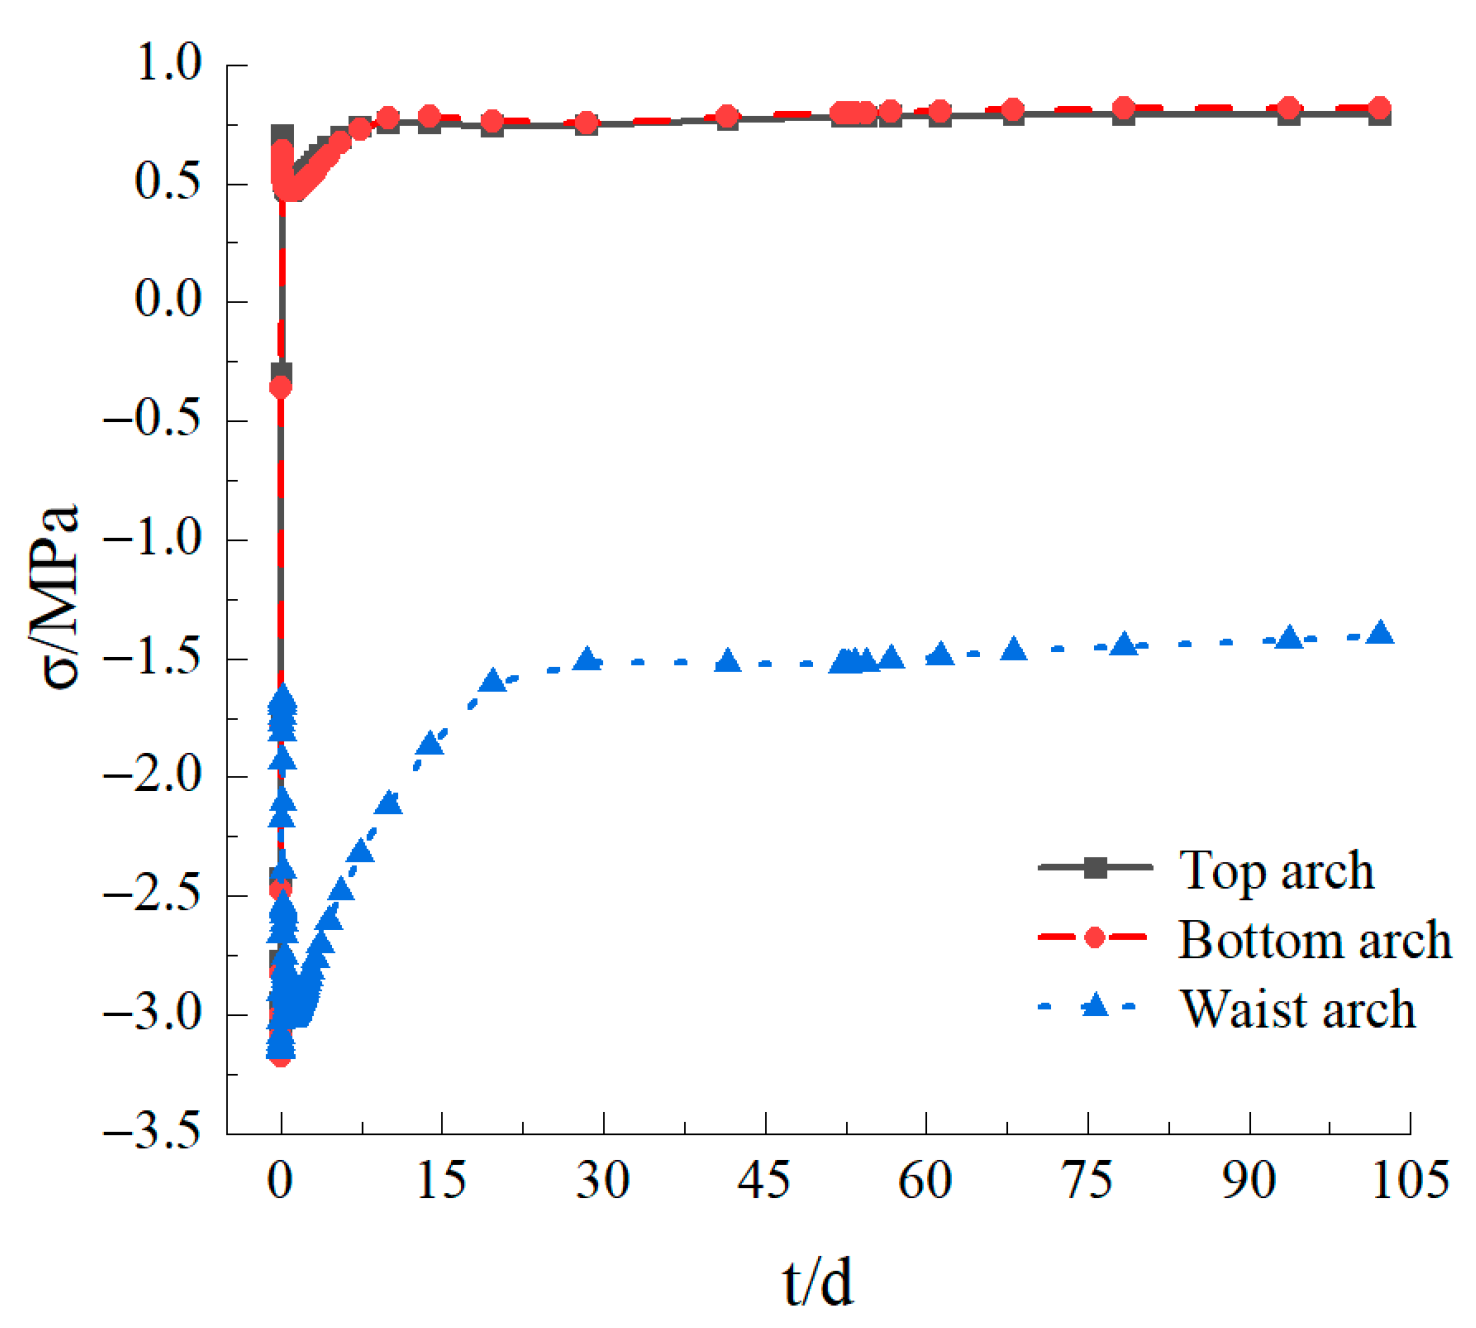
In order to analyze the law of change in the stress field at the contact between the high-temperature soil and lining, based on the numerical simulation results, the law of change in maximum principal stresses at the top, bottom, and waist arches of soil with time was selected for analysis. As shown in Figure 5, the positive values in the diagram are tensile stresses. For the sake of analysis, this analysis was carried out uniformly with positive tensile stresses. As can be seen from Figure 5, the top arch, bottom arch, and waist arch changes were divided into three stages: the sudden stress change period, stress fluctuation period, and stress stabilization period. The first stage was the sudden stress change period. At this stage, the maximum principal stresses in the top, bottom, and waist arches reached a minimum value of −3.12 MPa, −3.17 MPa, and −3.15 MPa, respectively, due to the fresh excavation of the tunnel soil and the influence of the self-weight of the soil. The soil was excavated and came into contact with air for heat exchange. The temperature at the contact between the soil and the air decreased abruptly under a large temperature difference, generating a large temperature stress and a rapid rise in the maximum principal stress occurred. The maximum principal stress in the girdle arch rose to −1.67 MPa, while the maximum principal stresses in the top and bottom arches rose to 0.70 MPa and 0.64 MPa, respectively. With the assembly of the first ring lining, the top arch, bottom arch, and waist arch were extruded by the lining, and the maximum principal stresses on the top and bottom arches decreased rapidly to 0.53 MPa and 0.52 MPa, respectively. The waist arch was subject to a large drop in the maximum principal stress of −2.54 MPa due to the combined extrusion of the upper and lower parts of the lining. The second stage was the period of stress fluctuation. With the disturbance in the tunnel excavation and lining assembly, the maximum principal stresses in the top, bottom, and waist arches fluctuated. The maximum principal stress in the top and bottom arches first decreased to 0.47 MPa and then gradually increased, while the maximum principal stress in the girdle arch first decreased to −3.02 MPa and then gradually increased. The third stage was the stress stabilization period. The maximum principal stresses in the top, bottom, and waist arches increased slowly with time in the early stages and reached stable values of 0.79 MPa and 0.81 MPa in the later stages as the temperature difference became smaller. The maximum principal stress in the waist arch decreased slowly with time, with a greater amount of variation compared to that in the top and bottom arches, which also gradually stabilized at a later stage, reaching a stable value of −1.40 MPa.

3.4. Settlement Analysis between Enclosure and Lining

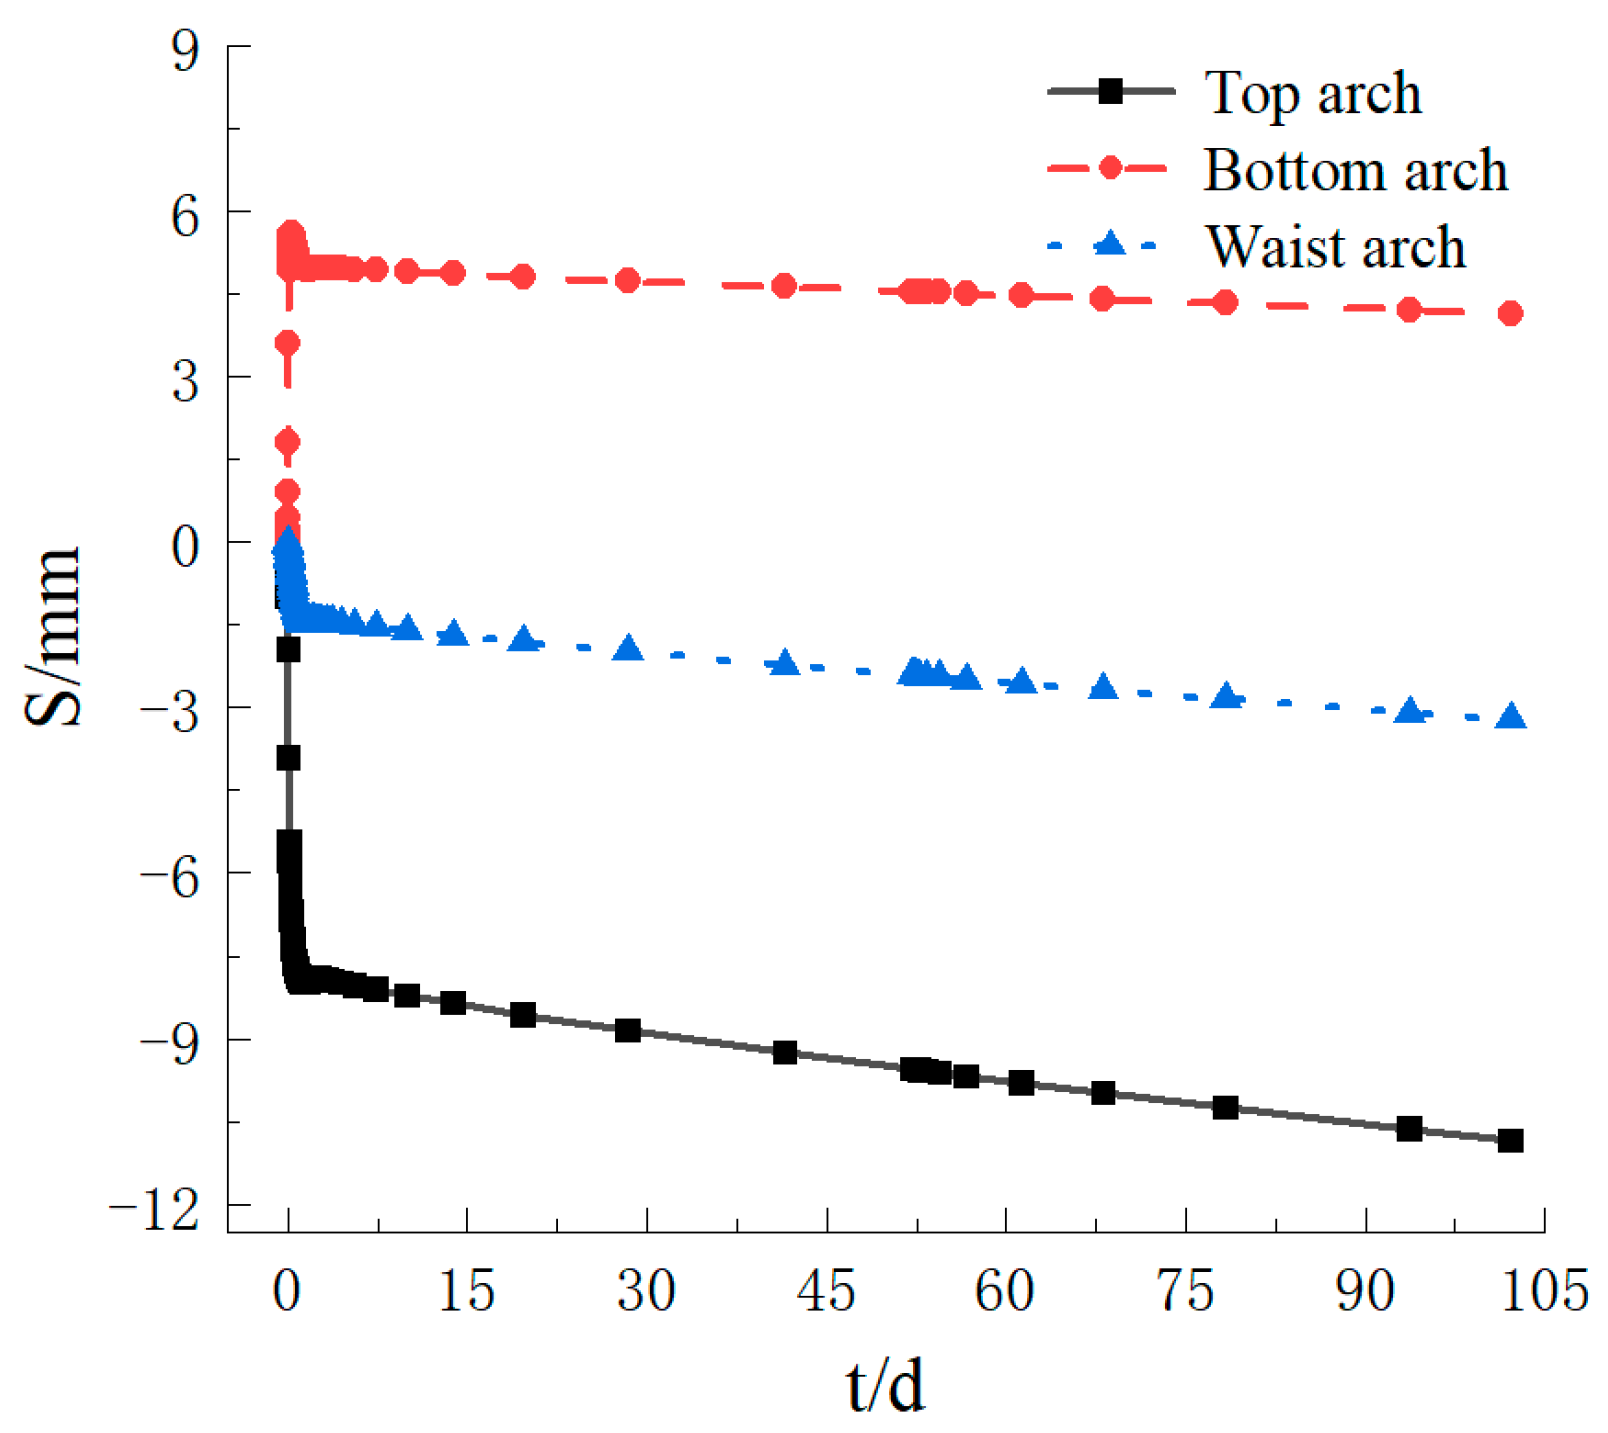
In order to analyze the variation rule of the settlement at the contact point between the high-temperature soil and lining and based on the numerical simulation results, the variation rule of the settlement of the soil vault, bottom arch, and waist arch over time was selected for analysis. As can be seen from Figure 6, the top arch, bottom arch, and waist arch could be divided into three stages: the abrupt settlement period, settlement fluctuation period, and settlement creep period. The settlement change curve was consistent with the experimental results of Wang et al. [23] and showed that the model established in this paper had a certain degree of reasonableness. In the first settlement of the abrupt change period, when the underwater shield tunnel was just excavated, under the influence of the dead weight of the soil, the compression settlement of the top arch and the waist arch increased rapidly, reaching 5.43 mm and 0.24 mm, respectively. The bottom arch was squeezed by the soil on both sides, resulting in an uplift that rapidly increased, reaching 4.94 mm. In the second stage of settlement fluctuation, with the assembly of the lining, the settlement of the top arch and waist arch slowed down in the early stage of excavation, reaching a maximum value of 7.98 mm and 1.48 mm, respectively, and the settlement decreased gradually in the later stage. The settlement increased slowly with the application during the third stage of settlement creep.
After the completion of the excavation, the settlement of the top arch and the waist arch were 7.90 mm and 1.43 mm, respectively, and the uplift of the bottom arch was 4.97 mm. After 50 days of operating, the settlement of the top arch and the waist arch was 9.55 mm and 2.42 mm, which increased by 1.65 m and 0.99 mm, respectively. The uplift of the bottom arch was 4.53 mm, which decreased by 0.44 mm. After 100 days of operating, the settlement of the top arch and waist arch was 10.85 mm and 3.22 mm, respectively, which increased by 1.3 mm and 0.8 mm compared to standing for 50 days. The uplift of the bottom arch was 4.14 mm, which decreased by 0.39 mm. After the excavation, with the decrease in the temperature, the strength of the soil and lining increased, and the settlement of the top arch, bottom arch, and waist arch increased slowly with time while the growth rate decreased gradually.

3.5. Temperature Transfer between Soil and Lining at Different High Structure Temperatures

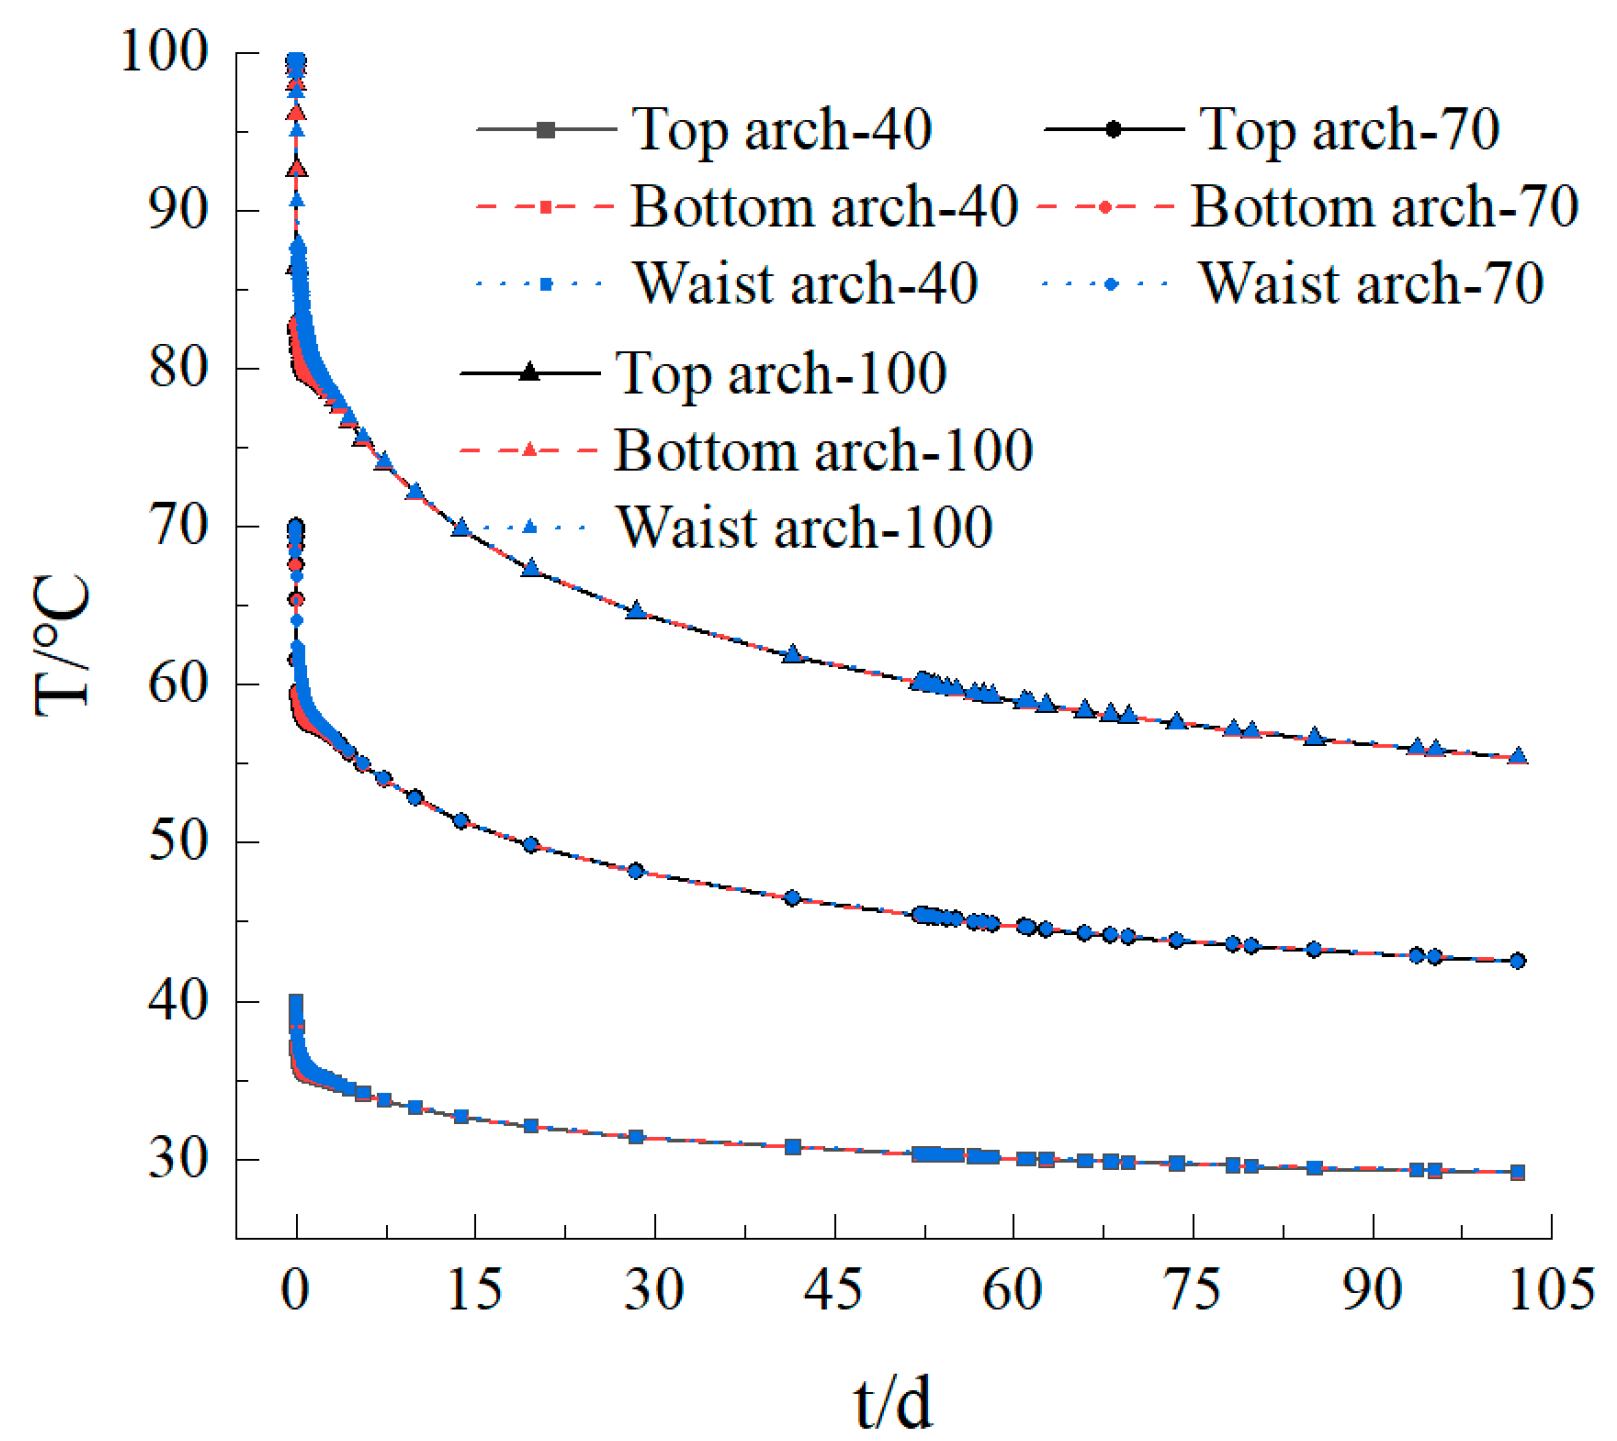
The temperature change curves of the top and waist arches of the tunnel at 40 °C, 70 °C, and 100 °C were extracted for further analysis of the temperature transfer between the soil and the lining at different high temperatures. As can be seen from Figure 7, the top, bottom, and waist arches followed the same trend at all three temperatures, with a rapid drop in temperature in the early stages and a slow and gradual stabilization in the later stages. At 40 °C of the soil temperature, the temperature of the top, bottom, and waist arches was around 35 °C after 2 days of excavation completion in the early stages: a reduction of 5.0 °C. With the later operating period of 50 days, the top and waist arch temperature was 30.3 °C, which was 9.7 °C lower than the initial temperature. After 100 days of operation, the temperature of the top and waist arches was 29.1 °C, which was 10.9 °C lower than the initial temperature. At 70 °C of the soil temperature, the temperature of the top, bottom, and waist arches was about 57 °C after 2 days of excavation completion in the early stages: a reduction of 13 °C. With the later operating period of 50 days, the top and waist arch temperatures were the same at 45.4 °C: a reduction of 14.6 °C from the initial temperature. After 100 days of operating, the temperature of the top and waist arches was 42.5 °C: a reduction of 27.5 °C from the initial temperature. At 100 °C of the soil temperature, the top, bottom, and waist arch temperatures were at 79.0 °C after 2 days of excavation completion in the early stages: a reduction of 21 °C. With the later operating period of 50 days, the top and waist arch temperatures were the same at 60.1 °C: a decrease of 39.9 °C from the initial temperature. After 100 days of operation, the top and waist arch temperature was 55.4 °C: a reduction of 44.6 °C from the initial temperature.
As the temperature of the soil increased, the greater the temperature drop in the tunnel, the greater the susceptibility to temperature stresses and the longer it took to reach stability. The difference in temperature between the top, bottom, and waist arches of the previous excavation increased as the temperature of the soil increased. Additional temperature stresses could easily be generated between the two. This stress was detrimental to the stability of the underwater shield tunnel.

3.6. Analysis of the Maximum Principal Stress between the Soil and the Lining at Different High Temperatures

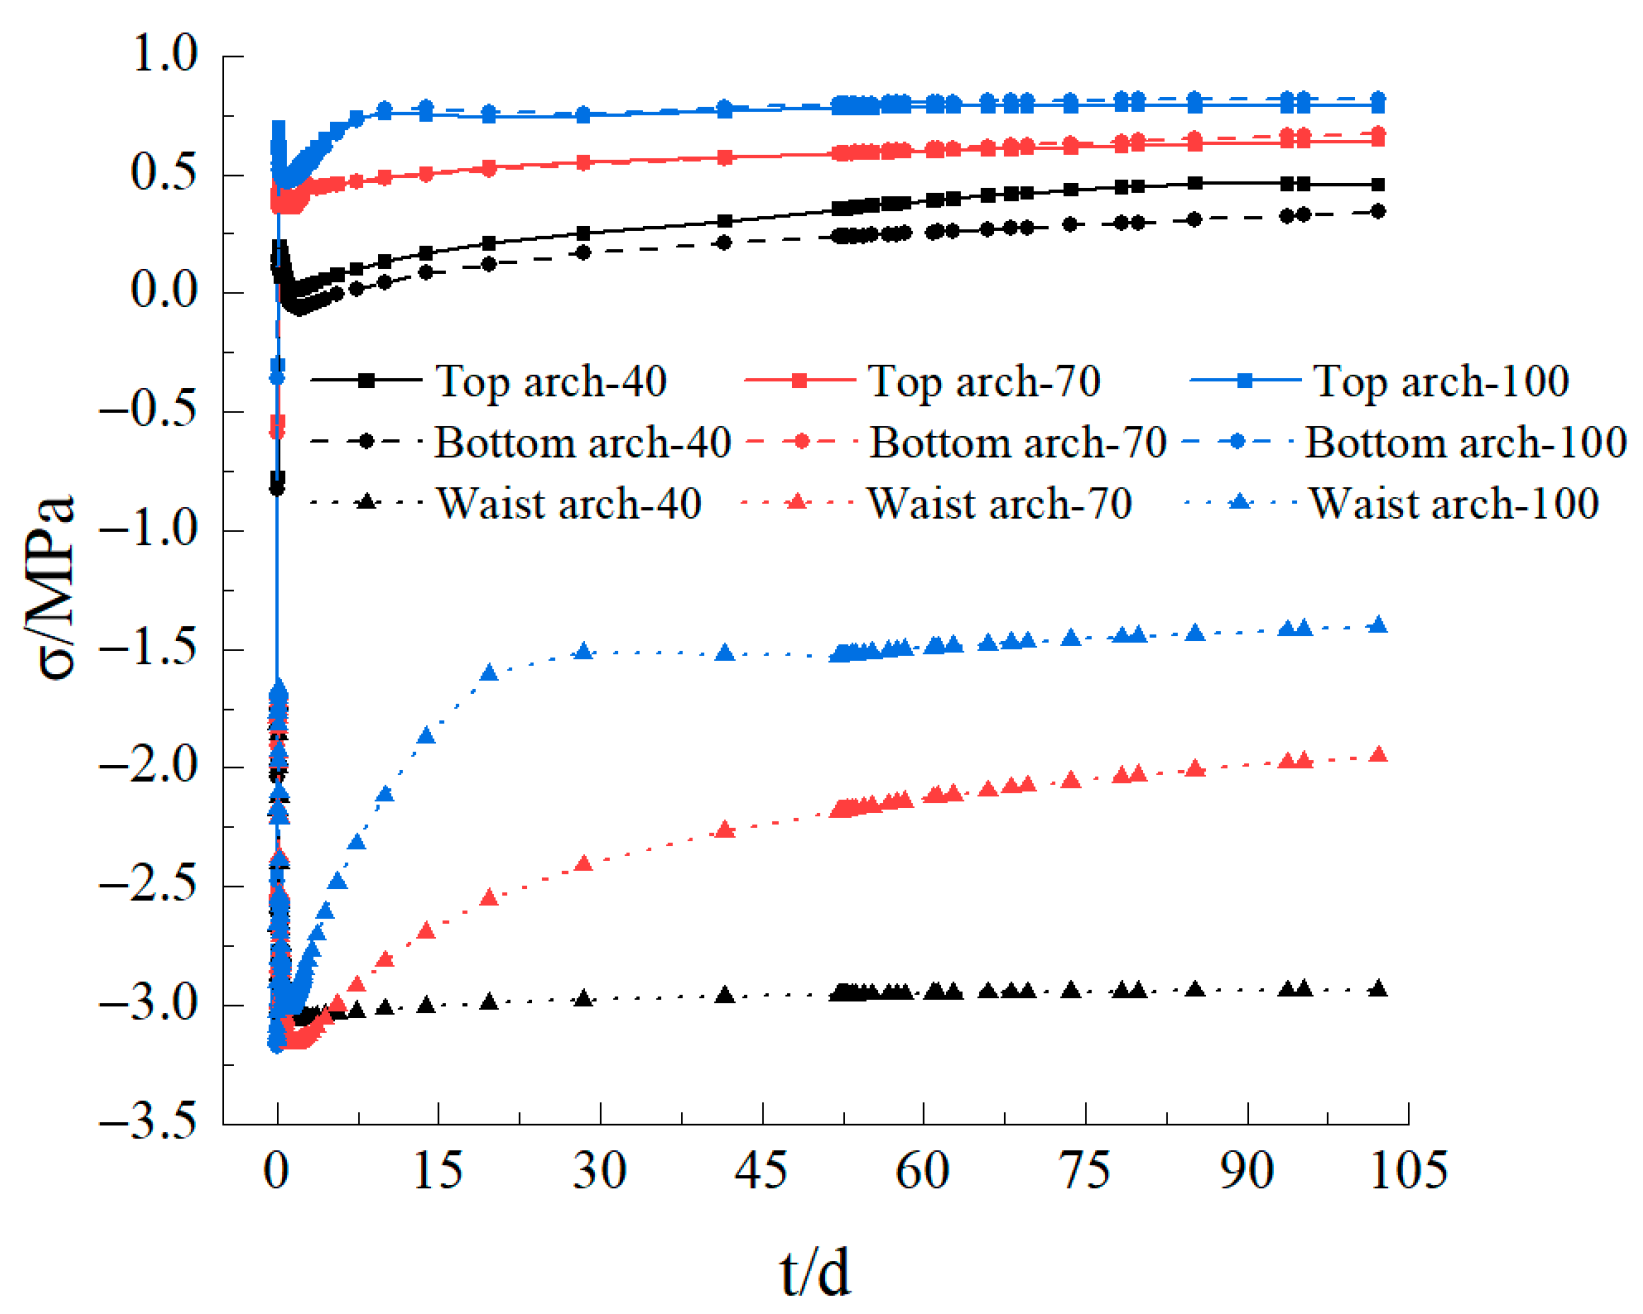
The maximum principal stress variation curves for the top, bottom, and waist arches of the tunnel at 40 °C, 70 °C, and 100 °C were extracted for further analysis of the stress variation pattern at the contact between the tunnel envelope and the lining at different high temperatures. As can be seen from Figure 8, the maximum principal stresses in the top, bottom, and waist arches at 40 °C, 70 °C, and 100 °C followed the same trend, all showing a surge, then a decrease, and finally a slow increase to a gradual stabilization. When the underwater shield tunnel was first excavated, the initial maximum principal stresses at 40 °C, 70 °C, and 100 °C were the same, with −3.12 MPa, −3.17 MPa, and −3.15 MPa for the top arch, bottom arch, and waist arch, respectively. As the soil was excavated and came into contact with air, the maximum principal stresses in the top, bottom, and waist arches all rose significantly. The maximum principal stresses in the top, bottom, and waist arches at 40 °C were 0.2 MPa, 0.15 MPa, and −1.72 MPa, respectively. The maximum principal stresses in the top, bottom, and waist arches at 70 °C were 0.20 MPa, 0.15 MPa, and −1.68 MPa, respectively. The maximum principal stresses in the top, bottom, and waist arches at 100 °C were 0.70 MPa, 0.64 MPa, and −1.67 MPa, respectively. As the tunnel was excavated and the lining was assembled, the maximum principal stresses in the top, bottom, and waist arches decreased first. The maximum principal stresses in the top, bottom, and waist arches at 40 °C were 0.01 MPa, −0.05 MPa, and −3.06 MPa, respectively. The maximum principal stresses in the top, bottom, and waist arches at 70 °C were 0.35 MPa, 0.40 MPa, and −3.16 MPa, respectively. The maximum principal stresses at 100 °C were 0.53 MPa, 0.52 MPa, and −2.54 MPa for the top, bottom, and waist arches, respectively, which then gradually increased. After the tunnel excavation was complete, the maximum principal stress increased slowly with time and finally stabilized. The maximum principal stresses in the top, bottom, and waist arches at 40 °C were 0.46 MPa, 0.34 MPa, and −2.94 MPa, respectively. The maximum principal stresses in the top, bottom, and waist arches at 70 °C were 0.65 MPa, 0.67 MPa, and −1.95 MPa, respectively. The maximum principal stresses in the top, bottom, and waist arches at 100 °C were 0.79 MPa, 0.81 MPa, and −1.40 MPa, respectively. Under the action of the self-weight of the soil, lining support, and temperature, the maximum principal stresses in the top, and bottom arches were predominantly in tension, while the maximum principal stresses in the waist arch were predominantly in compression. The higher the temperature of the soil surrounding the underwater shield tunnel, the more complex the temperature transfer between the soil and the lining, the higher the temperature stresses generated, and the greater the fluctuation of maximum principal stresses, which reduced the safety of the tunnel.

3.7. Settlement Analysis between Different High Structure Temperature Enclosures and Liners

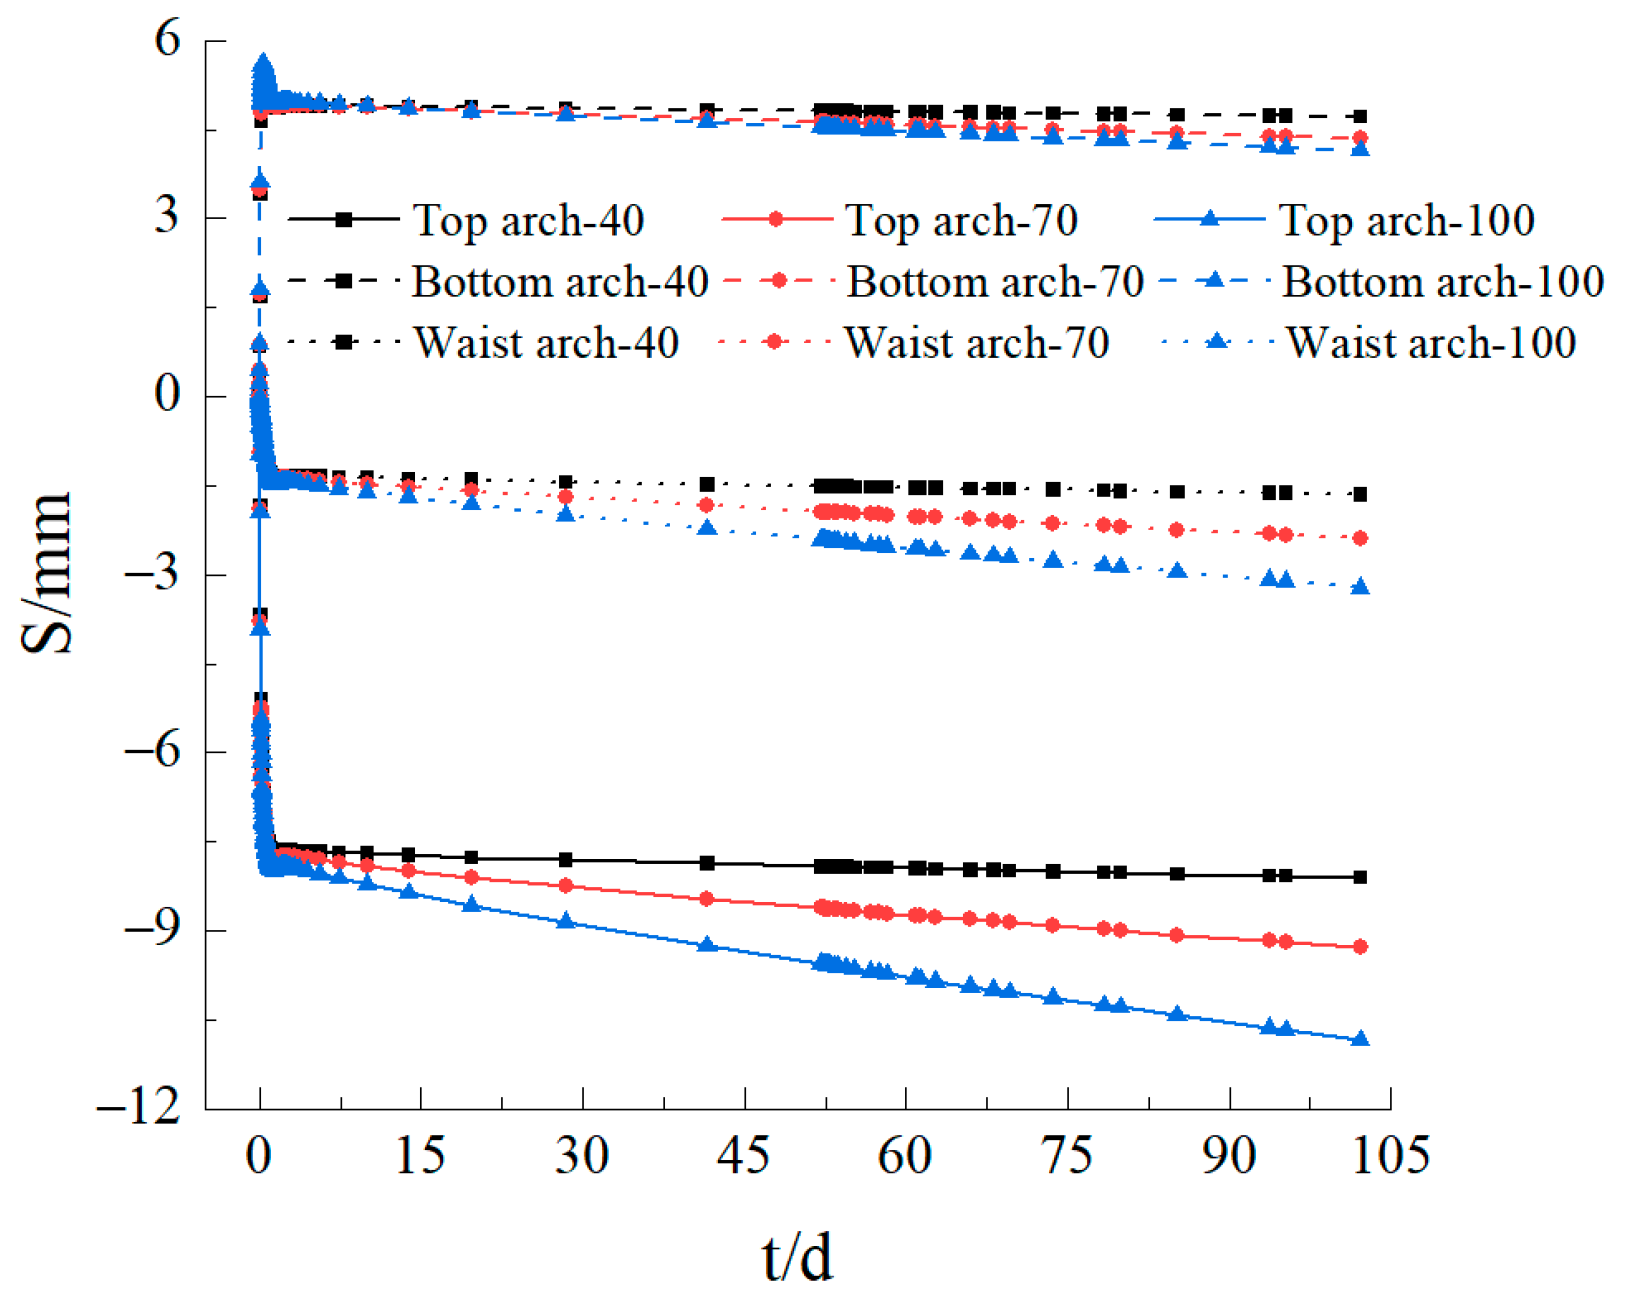
The settlement curves for the top, bottom, and waist arches of the tunnel at 40 °C, 70 °C, and 100 °C were extracted to further analysis with the settlement pattern at the contact between the tunnel envelope and the lining at different high temperatures. As can be seen from Figure 9, the top, bottom, and waist arches followed the same trend at 40 °C, 70 °C, and 100 °C. The top arch and waist arch settlement, in general, showed a trend that first surged before slowing down, then decreasing, and finally growing slowly with time. The bottom arch rose on the same trend as the top and waist arches settled. During excavation, the settlement of the top and waist arches first increased sharply and then slowed down to a maximum value during excavation. In total, 7.71 mm and 1.38 mm were recorded for the top and waist arches, respectively, at 40 °C, and 5.35 mm for the waist arch bulge. The settlement of the top and waist arches at 70 °C was 7.80 mm and 1.42 mm, respectively, and the bulge value of the waist arch was 5.45 mm. The settlement of the top and waist arches at 100 °C was 7.89 mm and 1.48 mm, respectively, and the bulge value of the waist arch was 5.61 mm. At the completion of the tunnel excavation, the settlement of the top and waist arches at 40 °C was 7.64 mm and 1.33 mm, respectively, and the bulge value of the waist arch was 4.90 mm. The settlement of the top and waist arches at 70 °C was 7.74 mm and 1.37 mm, respectively, and the bulge value of the waist arch was 4.92 mm. The settlement of the top and waist arches at 100 °C was 7.90 mm and 1.43 mm, respectively, and the bulge value of the waist arch was 4.97 mm. After 100 days of operating, the settlement of the top and waist arches at 40 °C was 8.10 mm and 1.65 mm, respectively, and the bulge value of the waist arch was 4.72 mm. The settlement of the top and waist arches at 70 °C was 9.28 mm and 2.39 mm, respectively, with a bulge value of 4.34 mm for the waist arch. The settlement of the top and waist arches at 100 °C was 10.85 mm and 3.22 mm, respectively, with a bulge value of 4.14 mm for the waist arch. The top and waist arch settlement values gradually increased with time, and the bottom arch bulge value gradually decreased with time. The higher the temperature of the soil in the underwater shield tunnel, the greater the settlement fluctuations caused during excavation; the greater the variation in the settlement values of the top and waist arches, as well as the rise in the bottom arch over the same operating time, the more detrimental this was to the stability of the tunnel.

4. Conclusions

Through the numerical simulation of high structure temperatures in an underwater shield tunnel, the variation in the tunnel temperature circle was investigated. The variation patterns of the top arch, bottom arch, and waist arch temperatures, maximum principal stress, and settlement of the tunnel envelope were analyzed. The simulation results could be used as a reference for the design and construction of different structure temperature tunnels. The main conclusions of the summary of the laws of temperature, maximum principal stress, and settlement changes in underwater shield tunnels at different temperatures were as follows:
(1)
The early excavation time of the underwater shield tunnel was short, and the temperature circle was small. The temperature circle expanded rapidly after 50 days of operation. The spread increased by 256.7%. The temperature change curves of the top, bottom, and waist arches decreased with time. The higher the temperature of the soil around the underwater shield tunnel, the greater the temperature drop.
(2)
The process of the change in the maximum principal stress in the top, bottom, and waist arches could be divided into three phases: the period of sudden stress change, the period of stress fluctuation, and the period of stress stabilization. The higher the temperature in the soil, the more complex the temperature transfer between the soil and the lining was while generating greater temperature stresses and reducing the safety of the tunnel. When in high-temperature conditions, the temperature between the tunnel and the soil should be controlled to avoid creating additional temperature stresses that could affect the stability of the tunnel.
(3)
Settlement changes could be divided into three phases: the abrupt settlement period and the settlement fluctuation period and settlement creep period. After the excavation, with a decrease in the temperature, the strength of the soil and lining increased. The settlement of the top arch, bottom arch, and waist arch increased slowly with time, and the growth rate decreased gradually. The higher the temperature of the tunnel structure, the greater the settlement and the more detrimental this was to the stability of the tunnel.

Author Contributions

L.Z.: Data curation, Resources; Q.W.: Project administration, Conceptualization; Y.J.: Methodology, Investigation; Z.L.: Writing—original draft, Validation; Y.W.: Supervision, Writing—review and editing. All authors have read and agreed to the published version of the manuscript.

Funding

This research received no external funding.

Data Availability Statement

Some or all of the data, models or codes that support the findings of this study are available from the corresponding author upon reasonable request.

Conflicts of Interest

The authors declare that they have no known competing financial interest or personal relationships that could have appeared to influence the work reported in this paper.

References

  1. Lin, M.; Zhou, P.; Jiang, Y.; Zhou, F.; Lin, J.; Wang, Z. Numerical investigation on comprehensive control system of cooling and heat insulation for high geothermal tunnel: A case study on the highway tunnel with the highest temperature in China. Int. J. Therm. Sci. 2022, 173, 107385. [Google Scholar] [CrossRef]
  2. Hu, Y.; Wang, M.; Wang, Q.; Liu, D.; Tong, J. Field test of thermal environment and thermal adaptation of workers in high geothermal tunnel. Build. Environ. 2019, 160, 106174. [Google Scholar] [CrossRef]
  3. Zhang, G.; Cao, Z.; Wang, W.; Mei, X.; Zhao, X.; Shen, S.; Na, T. Field test and numerical investigation on thermal environment of tunnel with air layer structure. Build. Environ. 2021, 203, 108105. [Google Scholar] [CrossRef]
  4. Chen, X.; Zhou, X.; Zhong, Z.; Liang, N.; Wang, Y.; Zhang, X. Study on temperature field and influencing factors of the high geothermal tunnel with extra-long one-end construction ventilation. Int. J. Therm. Sci. 2023, 191, 108322. [Google Scholar] [CrossRef]
  5. Duan, L.; Zhang, Y.; Lai, J. Influence of Ground Temperature on Shotcrete-to-Rock Adhesion in Tunnels. Adv. Mater. Sci. Eng. 2019, 2019, 8709087. [Google Scholar] [CrossRef] [Green Version]
  6. Luo, K.; Li, Y.; Zheng, C.; Gao, X.; Fan, J. Numerical simulation of temperature effect on particles behavior via electrostatic precipitators. Appl. Therm. Eng. 2015, 88, 127–139. [Google Scholar] [CrossRef]
  7. Uejio, C.K.; Morano, L.H.; Jung, J.; Kintziger, K.; Jagger, M.; Chalmers, J.; Holmes, T. Occupational heat exposure among municipal workers. Int. Arch. Occup. Environ. Health 2018, 91, 705–715. [Google Scholar] [CrossRef] [PubMed]
  8. Srinavin, K.; Mohamed, S. Thermal environment and construction workers’ productivity: Some evidence from Thailand. Build. Environ. 2003, 38, 339–345. [Google Scholar] [CrossRef]
  9. Zhao, Y.; Zhang, J.; Li, L.; Hu, T.; Zhao, Y. Analytical solution for the temperature field of an elliptical tunnel in cold regions. Cold Reg. Sci. Technol. 2023, 208, 103793. [Google Scholar] [CrossRef]
  10. Zhou, P.; Feng, Y.; Zhou, F.; Wei, Z.; Gou, S.; Xu, H.; Wang, Z. Evaluation system of worker comfort for high geothermal tunnel during construction: A case study on the highway tunnel with the highest temperature in China. Tunn. Undergr. Space Technol. Inc. Trenchless Technol. Res. 2023, 135, 105028. [Google Scholar] [CrossRef]
  11. John, H.; Kamelia, A. Fire-induced damage in tunnels: Thermo-mechanical modeling incorporating support system and geological conditions. Tunn. Undergr. Space Technol. Inc. Trenchless Technol. Res. 2023, 135, 105027. [Google Scholar]
  12. Zhang, D.; Zhao, B.; Zhu, K. Mechanical characteristics analysis of horizontal lifting of subsea pipeline with different burial depths. Front. Earth Sci. 2022, 10, 1011291. [Google Scholar]
  13. Wang, M.; Hu, Y.; Liu, D.; Jiang, C.; Wang, Q.; Wang, Y. A Study on the Heat Transfer of Surrounding Rock-Supporting Structures in High-Geothermal Tunnels. Appl. Sci. 2020, 10, 2307. [Google Scholar] [CrossRef] [Green Version]
  14. Wei, Y.; Sun, K.; Zhong, X.; Jia, J.; Huang, Q.; Qin, J.; Xiong, Z. Study on effects of the train-induced airflow on the temperature field of high-speed railway tunnels in cold regions. Therm. Sci. Eng. Prog. 2023, 41, 101837. [Google Scholar] [CrossRef]
  15. Kang, F.; Li, Y.; Tang, C. Numerical study on airflow temperature field in a high-temperature tunnel with insulation layer. Appl. Therm. Eng. 2020, 179, 115654. [Google Scholar] [CrossRef]
  16. Zhou, X.; Zeng, Y.; Fan, L. Temperature field analysis of a cold-region railway tunnel considering mechanical and train-induced ventilation effects. Appl. Therm. Eng. 2016, 100, 114–124. [Google Scholar] [CrossRef]
  17. Sun, B.; Xu, Z.D.; Zhou, H. A multiple back propagation neural network fusion algorithm for ceiling temperature prediction in tunnel fires. Eng. Struct. 2023, 280, 115601. [Google Scholar] [CrossRef]
  18. Wan, H.; Xiao, Y.; Wei, S.; Zhang, Y.; Oka, Y. Experimental study on multiple fire hazards in a naturally ventilated tunnel: Assessment of the flame interaction and extension of two unequal fires. Int. J. Therm. Sci. 2023, 187, 108209. [Google Scholar] [CrossRef]
  19. He, K.; Shi, L.; Zhang, S.; Cong, W.; Yang, H.; Cheng, X. Experimental study on temperature attenuation of smoke flow driven by dual fire sources in a tunnel. Tunn. Undergr. Space Technol. Inc. Trenchless Technol. Res. 2023, 134, 105004. [Google Scholar] [CrossRef]
  20. Sun, S.; Yan, S.; Cao, X.; Zhang, W. Distribution Law of the Initial Temperature Field in a Railway Tunnel with High Rock Temperature: A Model Test and Numerical Analysis. Appl. Sci. 2023, 13, 1638. [Google Scholar] [CrossRef]
  21. Wang, J.; Li, Z.; Li, G.; Xu, Y. Heat Hazard Control in High-Temperature Tunnels: Experimental Study of Coupled Cooling with Ventilation and Partial Insulation for Synergistic Geothermal Extraction. Int. J. Environ. Res. Public Health 2023, 20, 1941. [Google Scholar] [CrossRef] [PubMed]
  22. Xu, D.; Zhang, B.; Zubin, A.I.; Bu, X.; Pan, H.; Chen, S. Spatial-temporal evolution principle of temperature field in a high-temperature geothermal highway tunnel. Ain Shams Eng. J. 2023, 14, 101965. [Google Scholar] [CrossRef]
  23. Wang, T.; Zhang, C.; Xie, D. Study on creep deformation law of surrounding rock of slate tunnel considering temperature effect. J. Hebei Univ. Sci. Technol. 2022, 43, 90–98. [Google Scholar]
Figure 1. Tunnel model.
Water 15 02577 g001
Figure 2. Temperature field distribution of the tunnel: (a) Freshly excavated; (b) Excavation completed; (c) Operated for 50 days; (d) Operated for 100 days.
Water 15 02577 g002
Figure 3. Temperature field distribution of lining: (a) Freshly excavated; (b) Operated for 50 days; (c) Operated for 100 days.
Water 15 02577 g003aWater 15 02577 g003b
Figure 4. Temperature variation for top arch, bottom arch and waist arch of the tunnel.
Water 15 02577 g004
Figure 5. The maximum stress variation for top arch, bottom arch and waist arch of the tunnel.
Water 15 02577 g005
Figure 6. The settlement variation for top arch, bottom arch and waist arch of the tunnel.
Water 15 02577 g006
Figure 7. Curves of vault and waist temperature in tunnels with different high structure temperature.
Water 15 02577 g007
Figure 8. Curves of maximum principal stress variation at the vault and arch waist of the tunnel under different structure temperatures.
Water 15 02577 g008
Figure 9. Variation in vault and waist settlement of the tunnel under different structure temperatures.
Water 15 02577 g009
Table 1. Soil layer parameters.
Elastic Modulus (GPa)Poisson’s RatioAngle of Internal Friction (°)Cohesion (MPa)Thermal Conductivity (W/m·°C)Coefficient of Linear Expansion (°C−5)Specific Heat Capacity (J/Kg·°C)Temperature (°C)
6.50.25421.17.68.31285100
6.70.25421.18.07.6124080
6.80.25421.18.46.9119565
6.90.25421.18.96.2115050
7.00.25421.19.45.6110535
7.10.25421.1105.0106020
Table 2. Lining parameters.
Elastic Modulus (GPa)Poisson’s RatioAngle of Internal Friction (°)Cohesion (MPa)Thermal Conductivity (W/m·°C)Coefficient of Linear Expansion (°C−5)Specific Heat Capacity (J/Kg·°C)Temperature (°C)
30.00.17542.421.691.0091320
29.60.17542.421.681.0191635
29.10.17542.421.671.0291950
28.90.17542.421.661.0392365
28.70.17542.421.651.0492680
28.40.17542.421.641.05929100
Disclaimer/Publisher’s Note: The statements, opinions and data contained in all publications are solely those of the individual author(s) and contributor(s) and not of MDPI and/or the editor(s). MDPI and/or the editor(s) disclaim responsibility for any injury to people or property resulting from any ideas, methods, instructions or products referred to in the content.