Article

Response of Upstream Behavior and Hydrodynamic Factors of Anguilla Japonica in a Combined Bulkhead Fishway under Tidal Conditions

1
School of Marine Engineering Equipment, Zhejiang Ocean University, Zhoushan 316022, China
2
School of Naval Architecture and Maritime, Zhejiang Ocean University, Zhoushan 316022, China
3
Zhejiang Water Conservancy and Hydropower Project Audit Center Co., Ltd., Hangzhou 310000, China
4
School of Water and Environmental Engineering, Zhejiang University of Water Resources and Electric Power, Hangzhou 310000, China
*
Author to whom correspondence should be addressed.
Water 2023, 15(14), 2585; https://doi.org/10.3390/w15142585
Submission received: 16 May 2023 / Revised: 11 July 2023 / Accepted: 12 July 2023 / Published: 15 July 2023
(This article belongs to the Special Issue Fish Passage at Hydropower Dams 2.0)

Abstract

:
Frequent changes in the tide levels in estuaries cause constant changes in the hydraulics of fish passage systems, with important effects on successful fish passage and swimming behavior. In most cases, Japanese eels often have low passage rates in engineered fishways because of their special habits. In this study, we established a 1:4 scaled-down weir-hole combination bulkhead fishway, studied the effects of different tidal differences and water depths on the passage rates and swimming behavior of yellow-phase Japanese eels, and analyzed the response of the Japanese eels to the hydraulic factors by superimposing their swimming trajectories and the flow field simulation results. We found that the passage rate of the eels decreased from 68.18% to 50.00% and 45.45% under extreme high tide differences and extreme low tide differences, respectively. The eels tended to use the low-velocity area to climb up the wall, and when crossing the mainstream, the yellow-phase Japanese eels preferred the area with a flow velocity of 0.1~0.36 m/s and a turbulent kinetic energy range of 0.001~0.007 m2/s2. Their upstream swimming speed was maintained at a range of 0.1~0.3 m/s.

1. Introduction

In the context of the development boom of hydropower resources, a large number of weirs, dams, and other water-retaining structures have been built to cut off river channels, and the spawning and breeding channels of migratory fish have been cut off, resulting in the threat of population decline and the depletion of economic fish resources. Therefore, fish passage facilities have become an important means of transportation for fish to complete their reproductive migration [1,2,3]. Fish passage facilities in estuaries are relatively unique, and they need to take into account both tidal changes and the migratory needs of brackish and freshwater migratory fishes. The structural type of fish passage facilities is worthy of more consideration [4,5,6]. Unlike vertical slot fishways (VSFs), which have the obvious duality of water flow characteristics, combined bulkhead fishways combine vertical slits, submerged orifices, overflow weirs, and ecologically similar fishways to make full use of the advantages of various forms of fishways [7]. They are more adaptable to large water level variations and, thus, suitable for the simultaneous passage of a variety of fish, greatly improving the efficiency of fish passage systems, which have been popularized in the estuaries in eastern China.
The Japanese eel, an important economic fish migrating downstream, is widely distributed in China at the mouths of the Yangtze River, the Min River, and the Pearl River estuaries near the junctions of salt and freshwater basins. The abundance of global eel populations, including in China, has declined significantly over the past few decades, with a 90% reduction in fishing production [8,9,10,11]. Eels migrating upstream are easily drawn into the blades of different turbines by their attraction currents and even die [12,13]. Although mechanical damage to the turbine is avoided, the continuous climbing of the eels over the spillway greatly increases their migration time and covertly reduces their survival rate [14]. The presence of multiple dams on their migration path has had a cumulative effect on the eels’ passage delay and has also increased their mortality rates.
The current conservation of eels is mainly based on stocking and reducing their migratory barriers, and the design of fishways in China is mostly based on foreign studies on fish with strong swimming abilities, such as salmonids and trout, while eel-type swimmers (eels and seven-gill eels) are relatively weak swimmers. Previous studies have shown that eels have a burst swimming speed of 0.5 m/s on unmodified weir surfaces [15]. Some individuals have also shown a greater swimming speed, but for only a few seconds [16], and therefore, they tend to perform poorly when passing through vertical channel fishways and Daniel-type fishways (with channel flow velocities greater than 1.2 m/s), developed for salmonids, carps, and other species with strong swimming ability [17]. The eel is usually considered a typical benthic aquatic organism, especially when it is in the yellow eel stage, and it often feeds and migrates near the riverbed. However, under some specific conditions, eels can also show excellent climbing abilities. Legaul [18] demonstrated that juvenile eels less than 10 cm in length also have the ability to climb vertical walls, especially when the surfaces of these walls are covered with moss or algae. Cowx et al. [19] discovered that when the height of falling water approached the body length of an eel, it showed obvious difficulty in moving upwards. In order to solve the problem of the migration difficulties of eels, some research progress has been made through field observations and model tests, but there have been relatively few studies on the behavioral response of eels to hydraulic factors.
In this study, a reduced-scale hydraulic model was used to solve the high-cost problem caused by constructing the original-size model [20]. The transformed hydraulic indexes based on the Froude similarity criterion were used to analyze the response of fish to hydraulic characteristics so as to obtain regular data about their upstream trajectories and swimming ability [21,22,23,24]. The analysis of the upstream response of Japanese eels is essential for the future design of fish passage facilities in Chinese estuaries.

2. Materials and Methods

2.1. Research Fishway Overview

In this study, the right bank fishway project of the Cao’e River sluice gate in Shaoxing, China (30°22′ N, 120°45′ E) was used as a prototype. The design of fish passage structure and observed passage of eels at the Cao’e River sluice are shown in Figure 1.The water level changes upstream and downstream of the fishway were observed and counted throughout April 2017, with a maximum difference of 6.2 m between the upstream and downstream water levels. The species distribution in the right bank fishway was investigated by net fishing in November 2017. The normal storage level of the sluice gate is 3.90 m. The design is based on the calibrated standards for 100- and 300-year-flood events. The fishway is 429 m long, and the head is 1.0 m, which is a low-head fishway. The upstream and downstream sections of the fishway have an open rectangular channel structure, and the middle section is a closed box-shaped channel structure with a bottom slope of 0.21%. The net width of the fishway is 2.00 m, the wall thickness of the inner tank is 0.40 m, and the bottom thickness of the tank is 0.50 m. The spacing between the partitions is 3.00 m, the thickness of the partitions is 0.20 m, and there are 167 partitions. A resting pool is set up at every 27 m interval; the resting pool is 6.00 m long, and the inlet water level of the fishway is mainly influenced by the tide level from the outer river (Qiantang River), showing obvious day-to-day cycle changes. The outlet of the fishway is mainly influenced by the scheduled operation of the inner river (Cao’e River). From 2020 to 2022, using underwater video camera equipment, eels were observed crossing the dam and climbing over the weir surface at the same time.

2.2. Scaling Scale Experiment

2.2.1. Experimental Facilities

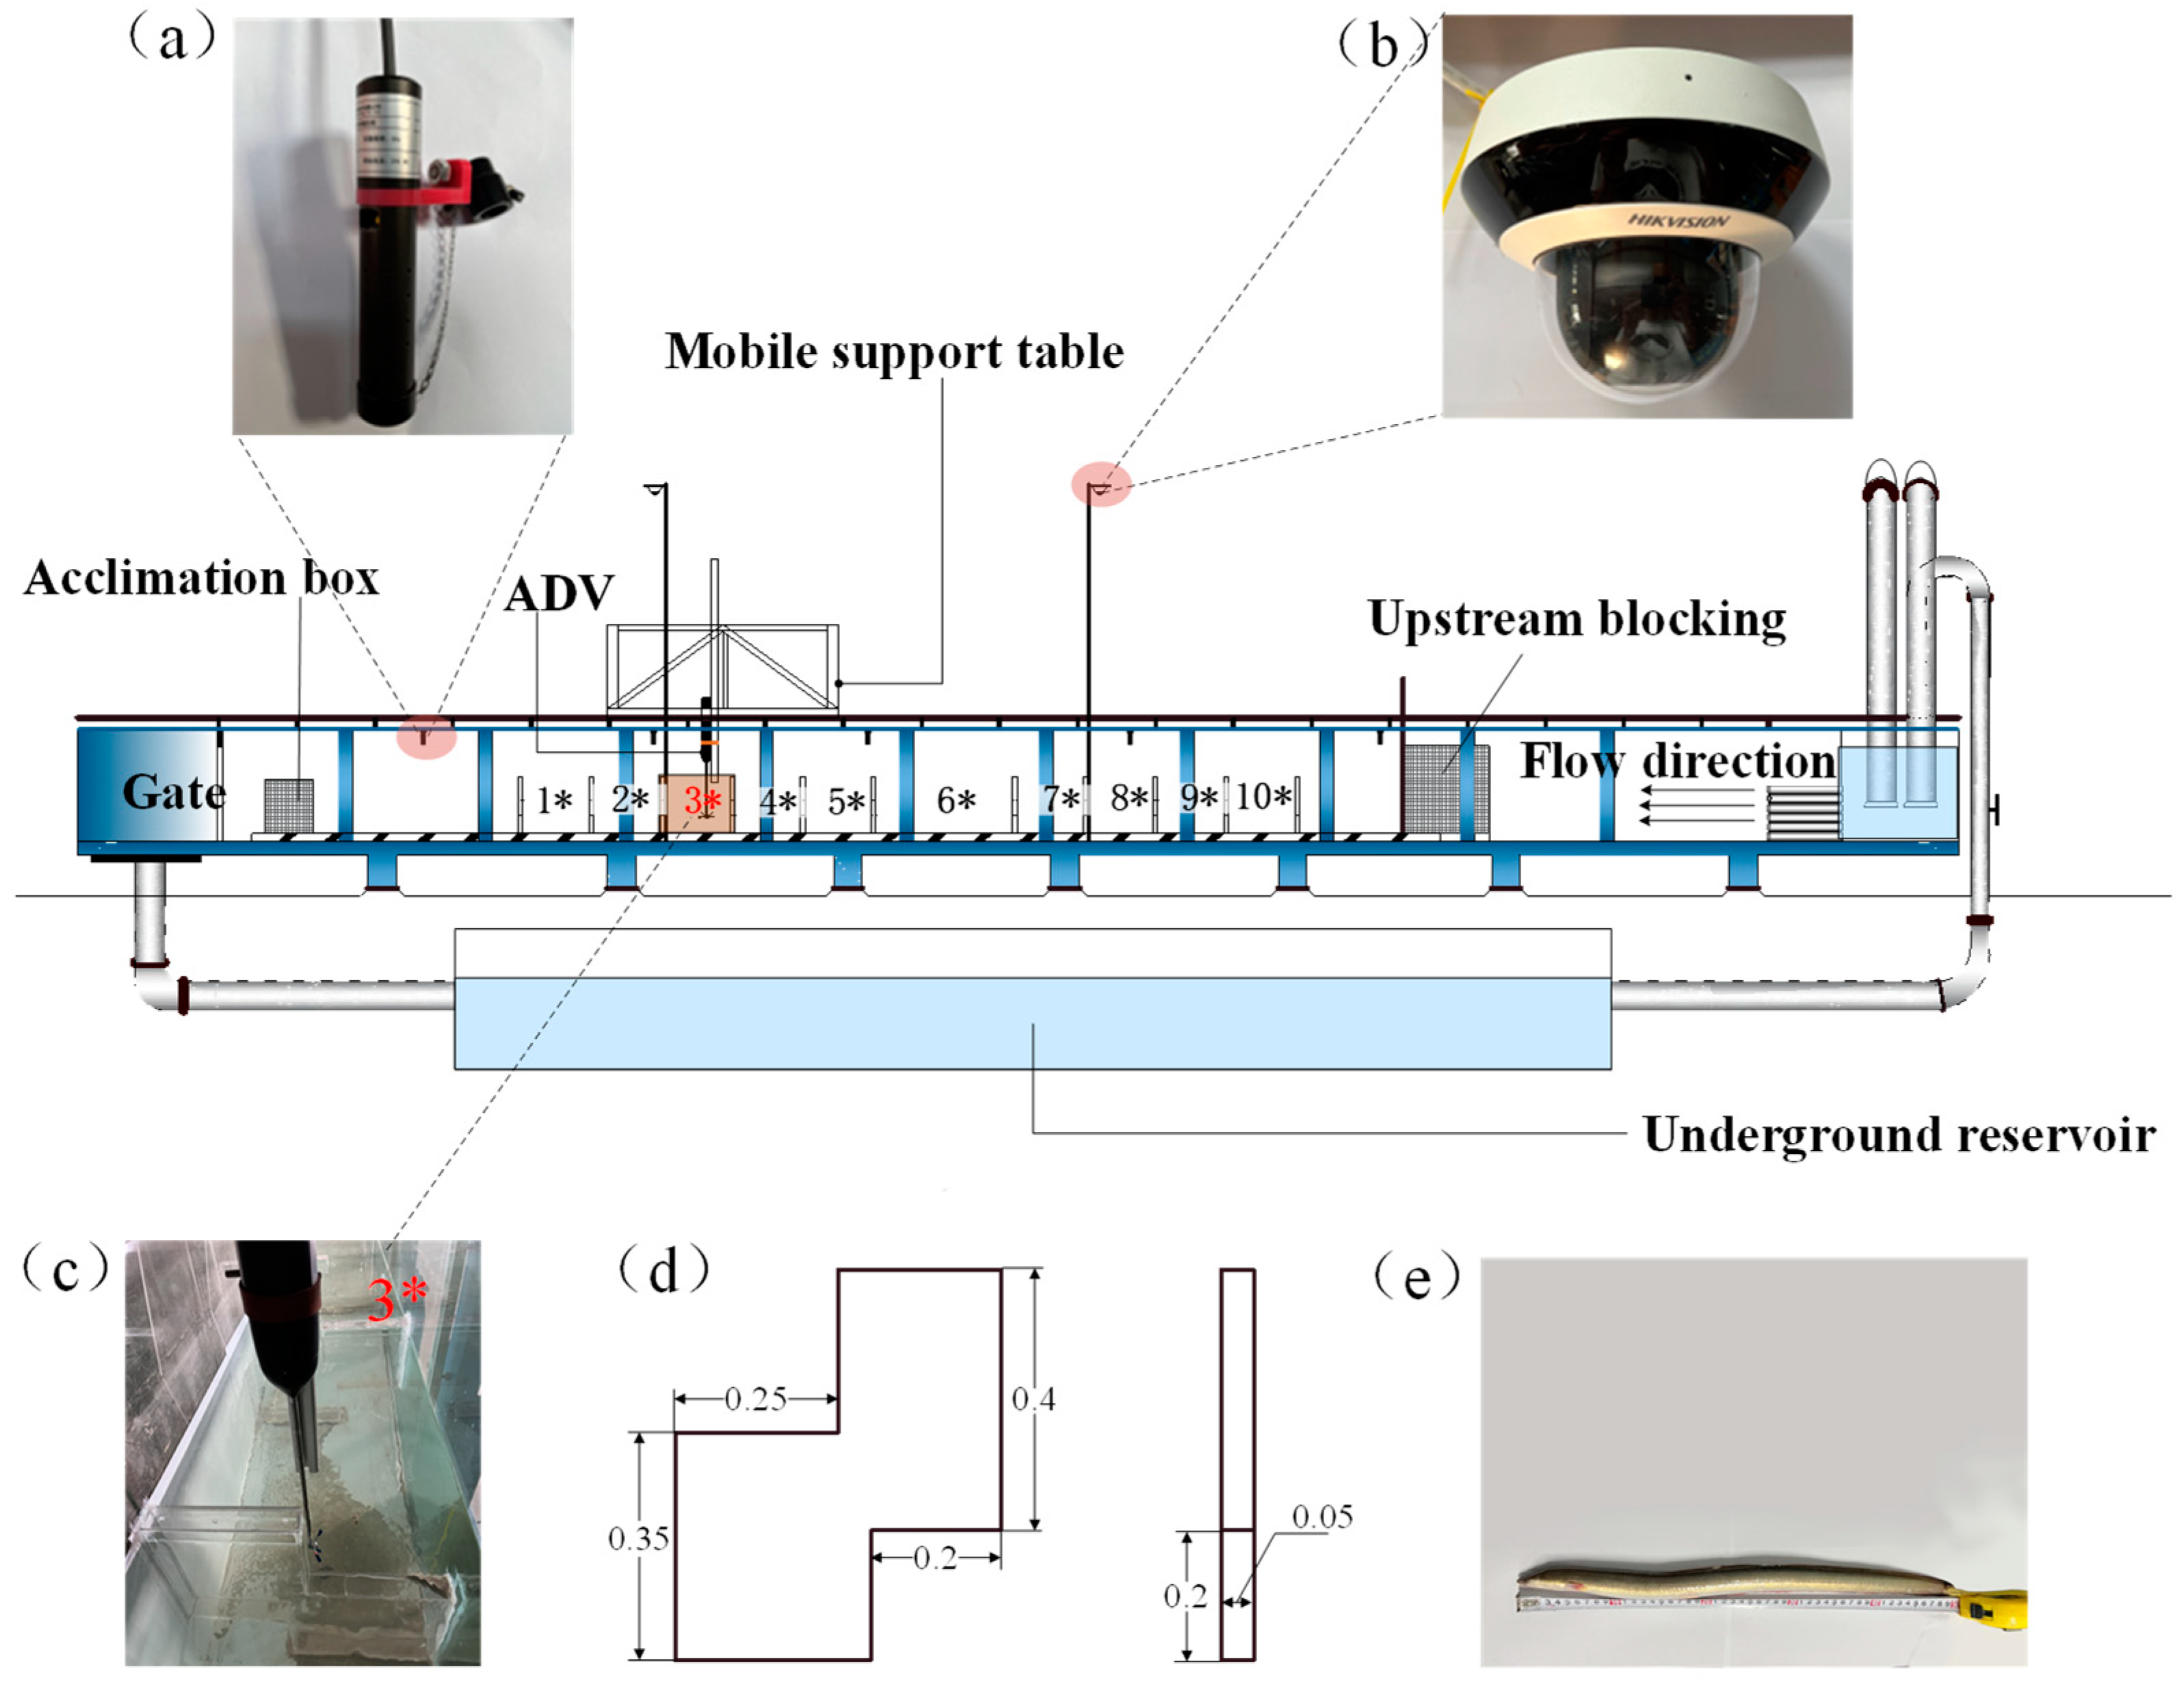
A scaled-down physical model with a length ratio of 1:4 was designed and developed to study the hydrodynamic characteristics of the combined bulkhead fishway and the upstream behavior of Japanese eels, as shown in Figure 2. The model was arranged in a wide flume at the Zhejiang Institute of Water Resources and Hydroelectricity. It has dimensions of 12.5 m (L) × 0.5 m (W) × 0.9 m (H), with 10 pool chambers (9 standard pools and 1 resting pool*), of which the standard pool is 0.75 m long, and the resting pool is 1.5 m long. In order to clearly capture the images of eels passing through, white reflective stickers were put on the bottom slope of the fishway and the side of the Plexiglas retaining wall. The Plexiglas partition was arranged between the retaining wall and the glass outer wall of the tank, and the external steel frame of the tank was reinforced. The whole structure was placed in a circulating water circuit, with a water supply circulating through the pump and the water level adjusted by a gate downstream.
With reference to the operating conditions of the fish passage project at the Cao’e River Lock and the tide level monitoring results, the passage of Japanese eels was studied under four different combinations of upstream water levels H1 and downstream tide levels H2. ∆H is the difference between the upstream and downstream water levels (∆H = H1 − H2), where W1 is the normal design condition of the Cao’e River Lock, and W2 and W3 are cases of low and very low tide levels downstream (the difference between the upstream and downstream water levels is 3.0 m). When the actual Cao’e River Lock is in operation, the difference between the downstream tide level and the upstream reservoir level can be as high as 6.1 m. W4 and W2 have the same head difference but different water depths, which was mainly used to investigate the effect of a low water depth at the inlet on the passage of the eel. The design conditions are shown in Table 1.
A square net box was set in the inlet section of the fish passage system as an activity area for the test fish to adapt to the flowing water, and a block net was set at the outlet of the fish passage system to collect the test fish. The water flow pattern was photographed by a camera, and the water level was measured by an infrared water level acquisition terminal with a sampling frequency of 5 HZ. The analysis of fish upstream behavior by video monitoring has been widely recognized by scholars [25,26,27], and two infrared network cameras (DS-2DC2D401W-D3/W, Hikvision, Hangzhou, China) with automatic zoom were set up directly above the fishway. Two infrared network cameras were set up directly in front of the fish passage to achieve a monitoring field of view covering the entire fish passage system, which could completely capture the behavior of the test fish in three dimensions.

2.2.2. Hydraulics

The combined mode of the overflow weir and submerged hole makes the water flow in the fish passage system relatively complex, so it was necessary to make fine measurements [28]. The experiments were conducted using an acoustic Doppler velocimeter (Vectrino velocimeter (ADV), Nortek, Boston, MA, USA) for water-layer heights of 0.2 H, 0.5 H, and 0.8 H at the bottom of the parallel pool as the study pool. Considering that the bottom hole and the top of the weir are the key parts of the fish passage system, four longitudinal measurement lines were arranged at the bottom hole and the top hole of the weir in the No. 3 bulkhead with equal spacing in the transverse longitudinal direction, totaling 32 measurement points. The arrangement of measurement points in pool 3* is shown in Figure 3.
The hydraulics calculations inside the combined bulkhead fishway were carried out by computational fluid dynamics (CFD), a common tool used in previous studies [29,30]. In this study, we focused on the flow velocity and turbulent energy inside the pool chamber of the fishway, two hydraulic factors that have been shown to have an important influence on the successful upstream movement of fish. We solved the Navier–Stokes equations within a reasonable computational cost based on the multiphase flow theory (VOF) and the k-ε dual-equation turbulence model, with the simulation object at a given water level of import and export, a set pressure boundary, and an iterative accuracy of 10−5.

2.2.3. Fish

The test eels were selected from yellow-phase Japanese eels produced in the Cao’e River and Qiantang River basins in China, provided by local farms, and tested on the day of delivery (Table 2). Quite a number of studies have confirmed that yellow-phase Japanese eels are more active and have an anadromous migratory demand [31], and their size is convenient for model observation after size reduction. The test eels were divided into two groups, large and small, according to body length, and they were temporarily reared in a transient pond before the test, with an oxygenation pump turned on during the process to ensure that the dissolved oxygen was greater than 8 mg/L. The transient pond was replenished and updated with 1/3 of the water volume every day. The eels were retrieved with a net after the test, and all eels were released into the Xiasha Riverside section of the Qiantang River after all tests were completed.

2.2.4. Test Method

The fish release experiment was carried out in November 2022. Welsh et al. [32] found that the nocturnal activity of eels was significantly higher than that in the daytime, so the experimental time chosen was from 16:00 to 22:00. To prevent the test water quality from causing harm to the eels, the basement was released a week in advance to flush the reservoir, which was then filled with tap water and natural water from the river on campus for 7 days of aeration. The water temperature during the test was 15 ± 1.8 °C, with a pH value of 7.2 and dissolved oxygen of about 8 mg/L. Before the test, the eels were put into the taming section near the inlet of the fish passage system so that they could fully feel the water flow. Then the net was opened, and the test eels swam freely to explore the upstream section while the infrared camera recorded the whole test process. The head of the fish entering the first partition was regarded as the beginning of the upstream section, and the tail of the fish leaving the last partition was regarded as the end. An eel was considered to have failed if it did not reach the 10th pool room. A total of 22 healthy and vigorous eels were randomly selected from the temporary pond at the beginning of each test, and a total of 88 tests were completed in 4 groups of conditions. The eels were not reused throughout the whole test.

2.3. Data Analysis

The test videos were all taken by infrared network cameras (DS-2DC2D401W-D3/W, Hikvision, Hangzhou, China) and stored in MP4 (H264) format, with 4 cameras recording the motion trajectory of each eel, for a total of 352 video files, of which a total of 50 successful upstream videos were collected. The processing of the eel swimming trajectory data were carried out by ZooTracker software (https://www.microsoft.com/en-us/research/project/zootracer/, accessed on 16 May 2023), which exported the coordinates of the eel movement trajectories frame by frame with the head of the eel and intercepted the position of the fish head in the new frame every 0.4 s so as to facilitate the subsequent unified analysis of the behavioral characteristics and swimming speed of the eel. In order to reflect the whole process of upstream swimming of the eel more intuitively, the test counted the passage rate, the upstream swimming time, the number of times the eel turned back, the turnback rate, the number of obstacles passed (the bottom holes and weirs), and the maximum upstream distance of the eel in the process of swimming upstream under four groups of working conditions. The eel was considered to have successfully passed through the last partition of the fish passage system (the 10th section of the pond). If the eel’s head and body turned around during the process of passing through the fish passage, it was defined as “turning back”, and the number of times the eel turned back was the total number of times the eel had passed through the fish passage to the farthest distance. The total time it took the eel to pass through the fish passage was the time it took the eel to pass the farthest distance.
The experiment obtained the passage strategy (trajectory type, use of low-speed reflux zone) of the eel in each section of the pool chamber under four combinations, as well as each passage speed (the maximum burst swimming speed and the average speed appearing in the process) in the 3* study pool. The swimming speed of the eel was obtained by synthesizing the motion speed obtained from the trajectory points in ZooTracker software and overcoming the flow velocity vector of the corresponding point in the background of the simulated flow field. The eel’s migration preference was determined by superimposing the flow velocity and turbulent energy of the hydraulic factors on the path chosen by the eel and the simulation results in order to facilitate the analysis of the response relationship between the eel’s migration behavior and the hydraulic factors. Statistical analysis of the experimental data were performed in IBM SPSS Statistics, and the variability among the samples was tested by the one-way ANONA method of variance. All tests were two-sided with a significance level.

3. Results

3.1. Flow Field Results Verification

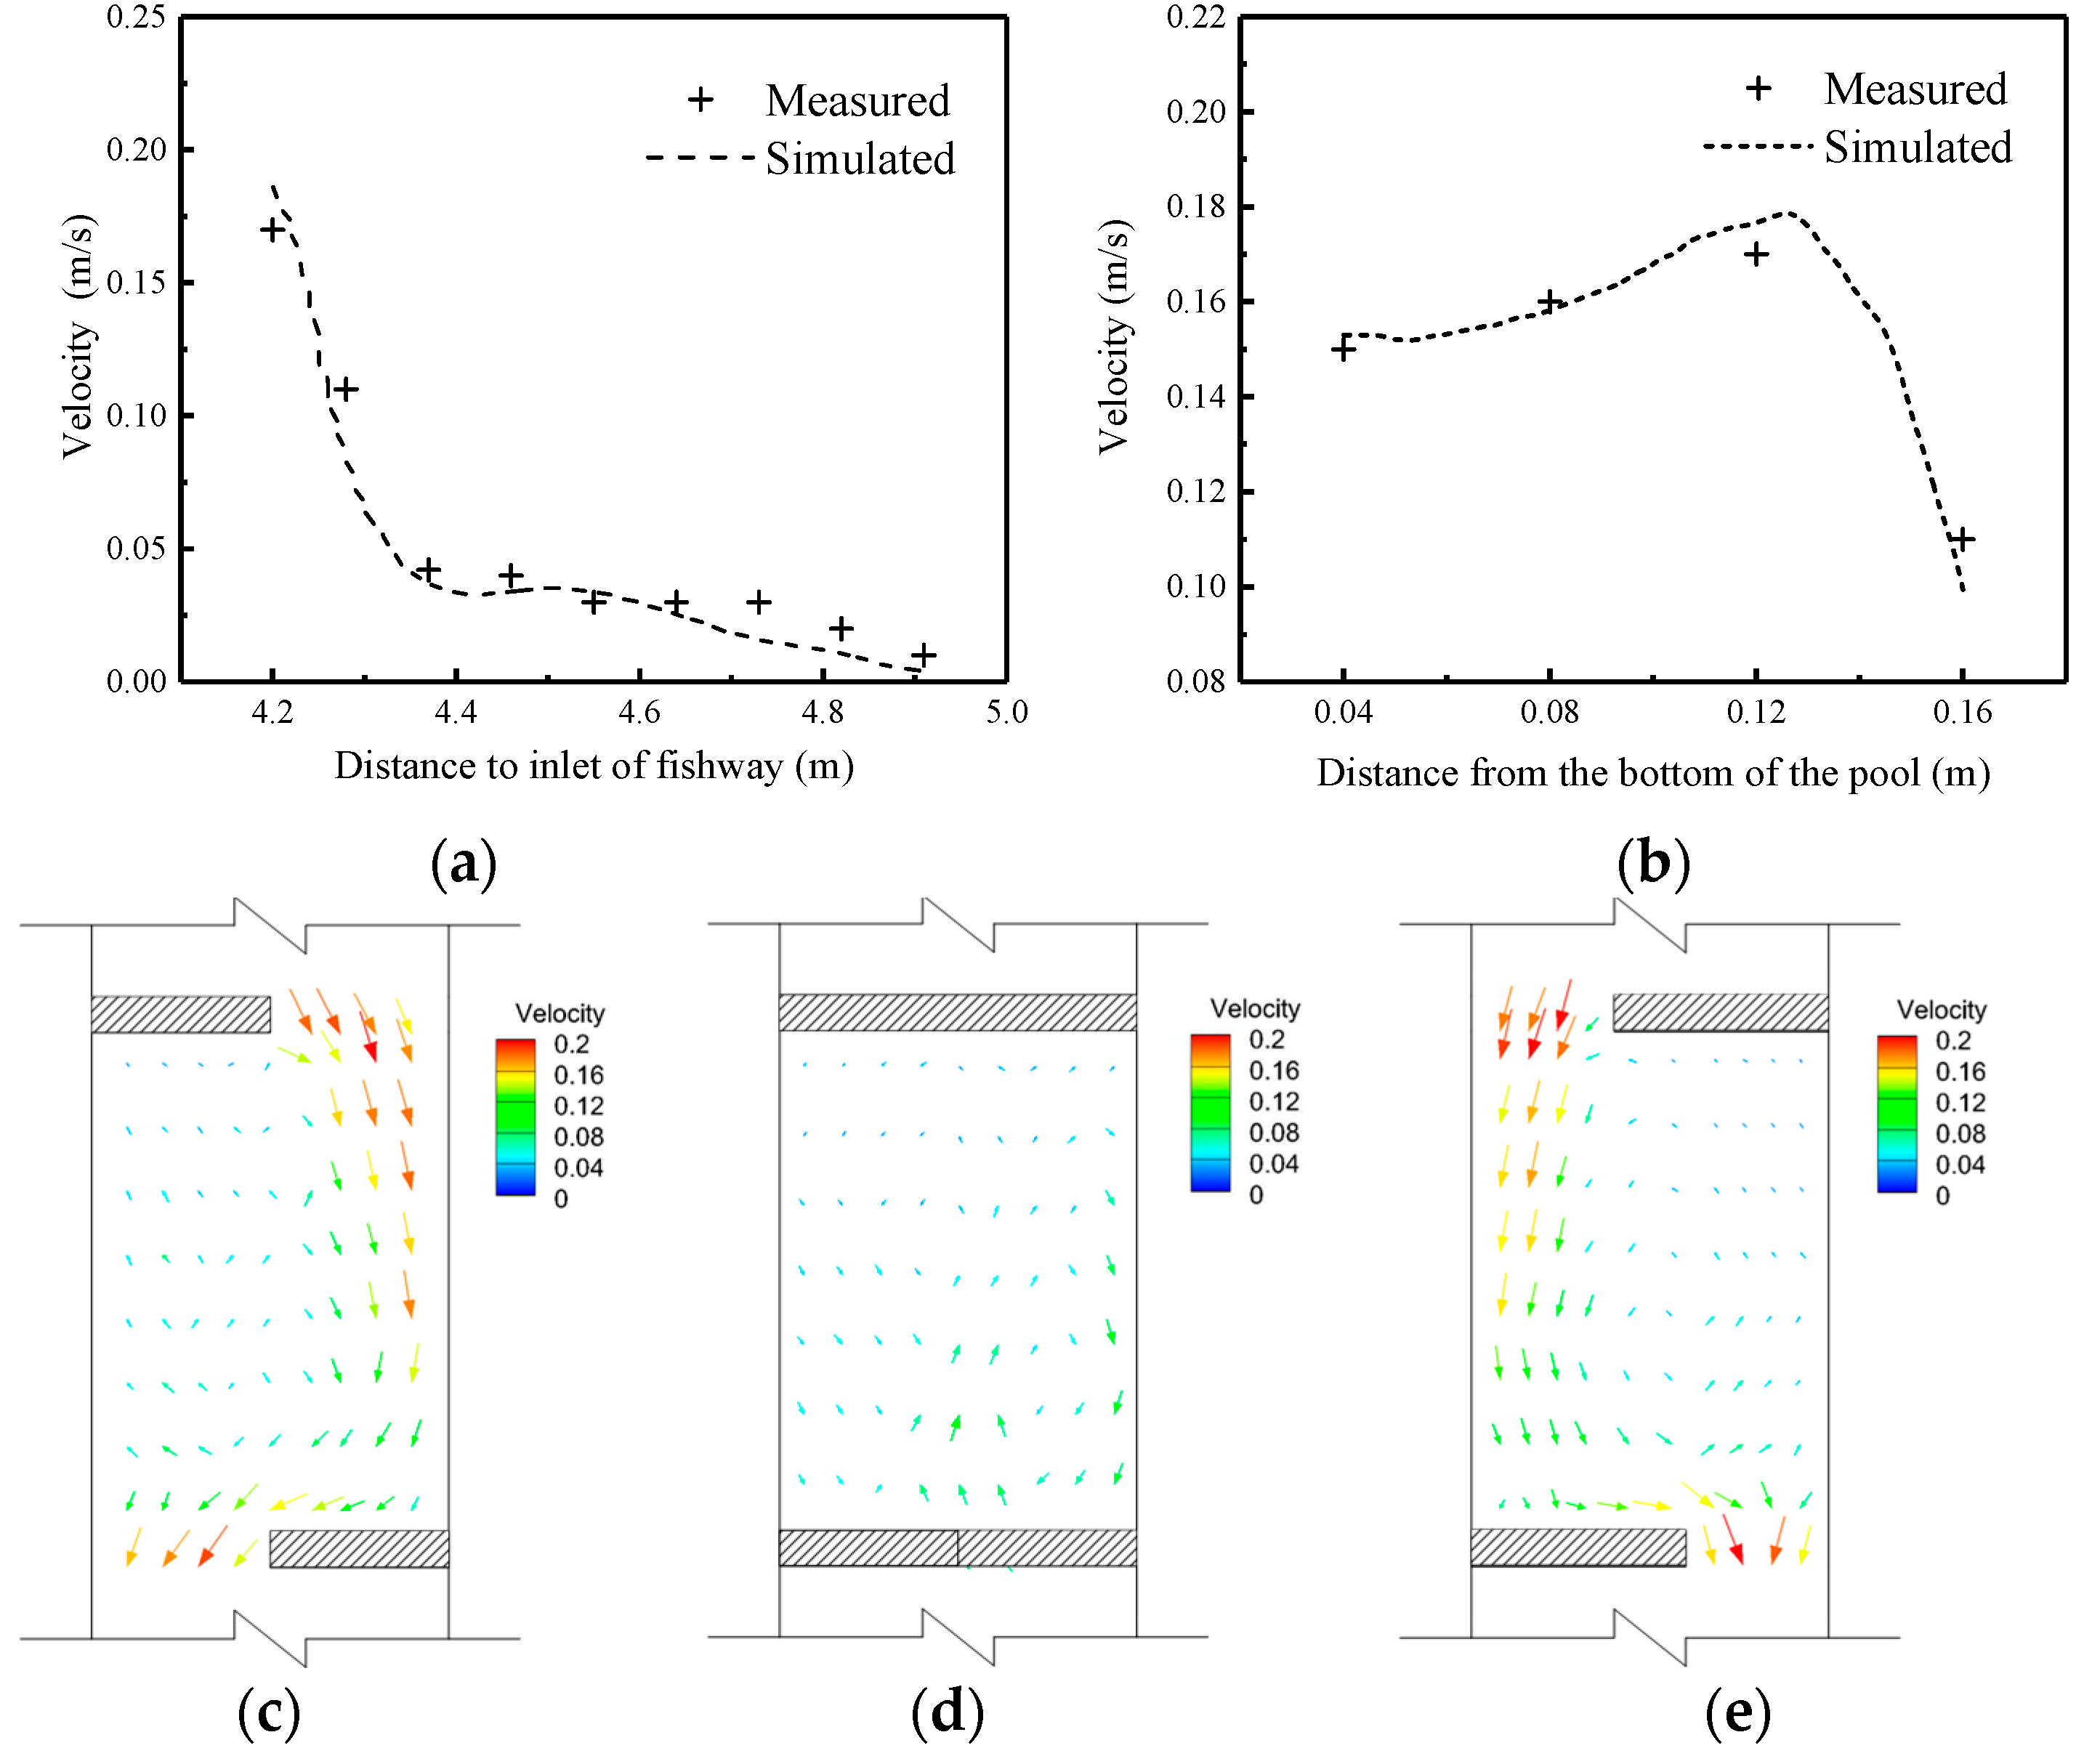
The test found that the eels mainly completed their migration through the bottom hole. The numerical simulation results at the 0.2 H water-layer and the submerged hole under W1 were compared with the physical model ADV measurements, and the simulated and measured flow velocities of measurement lines A and B were compared. In assessing the measurement accuracy, the mean absolute percentage error (MAPE) was introduced.
  MAPE = 1 n i   = 1 n M i   S i S i × 100 %
where Mi represents the measured value and Si represents the simulated value. Related studies generally agree that when the MAPE value is less than 10%, the simulated prediction results are within the acceptable range [33,34].
The numerical simulation results of all measurement lines basically match the measured results of the physical model (Figure 4). Most of the measurement points of measurement line A and the simulation comparison error value of the MAPE were in the range of 4.6~10%. The difference was only slightly larger in the position near the baffle, while the MAPE range of measurement line B was 2.2~6.7%. The numerical simulation had good accuracy overall and can truly reflect the hydrodynamics of the fish passage flow field.
The distributions of the surface and bottom layers of the fishway were similar. There was a main flow area (0.1~0.2 m/s) and a reflux area, and the main flow was distributed on the side of the orifice. The flow velocity of the middle layer was smaller compared to the surface and bottom layers, and the water flow was influenced by two jets moving up and down. The water flow structure was relatively complex, and there were two reflux areas, one large and one small, on the left and right sides.

3.2. Pass Rate and Pass Time

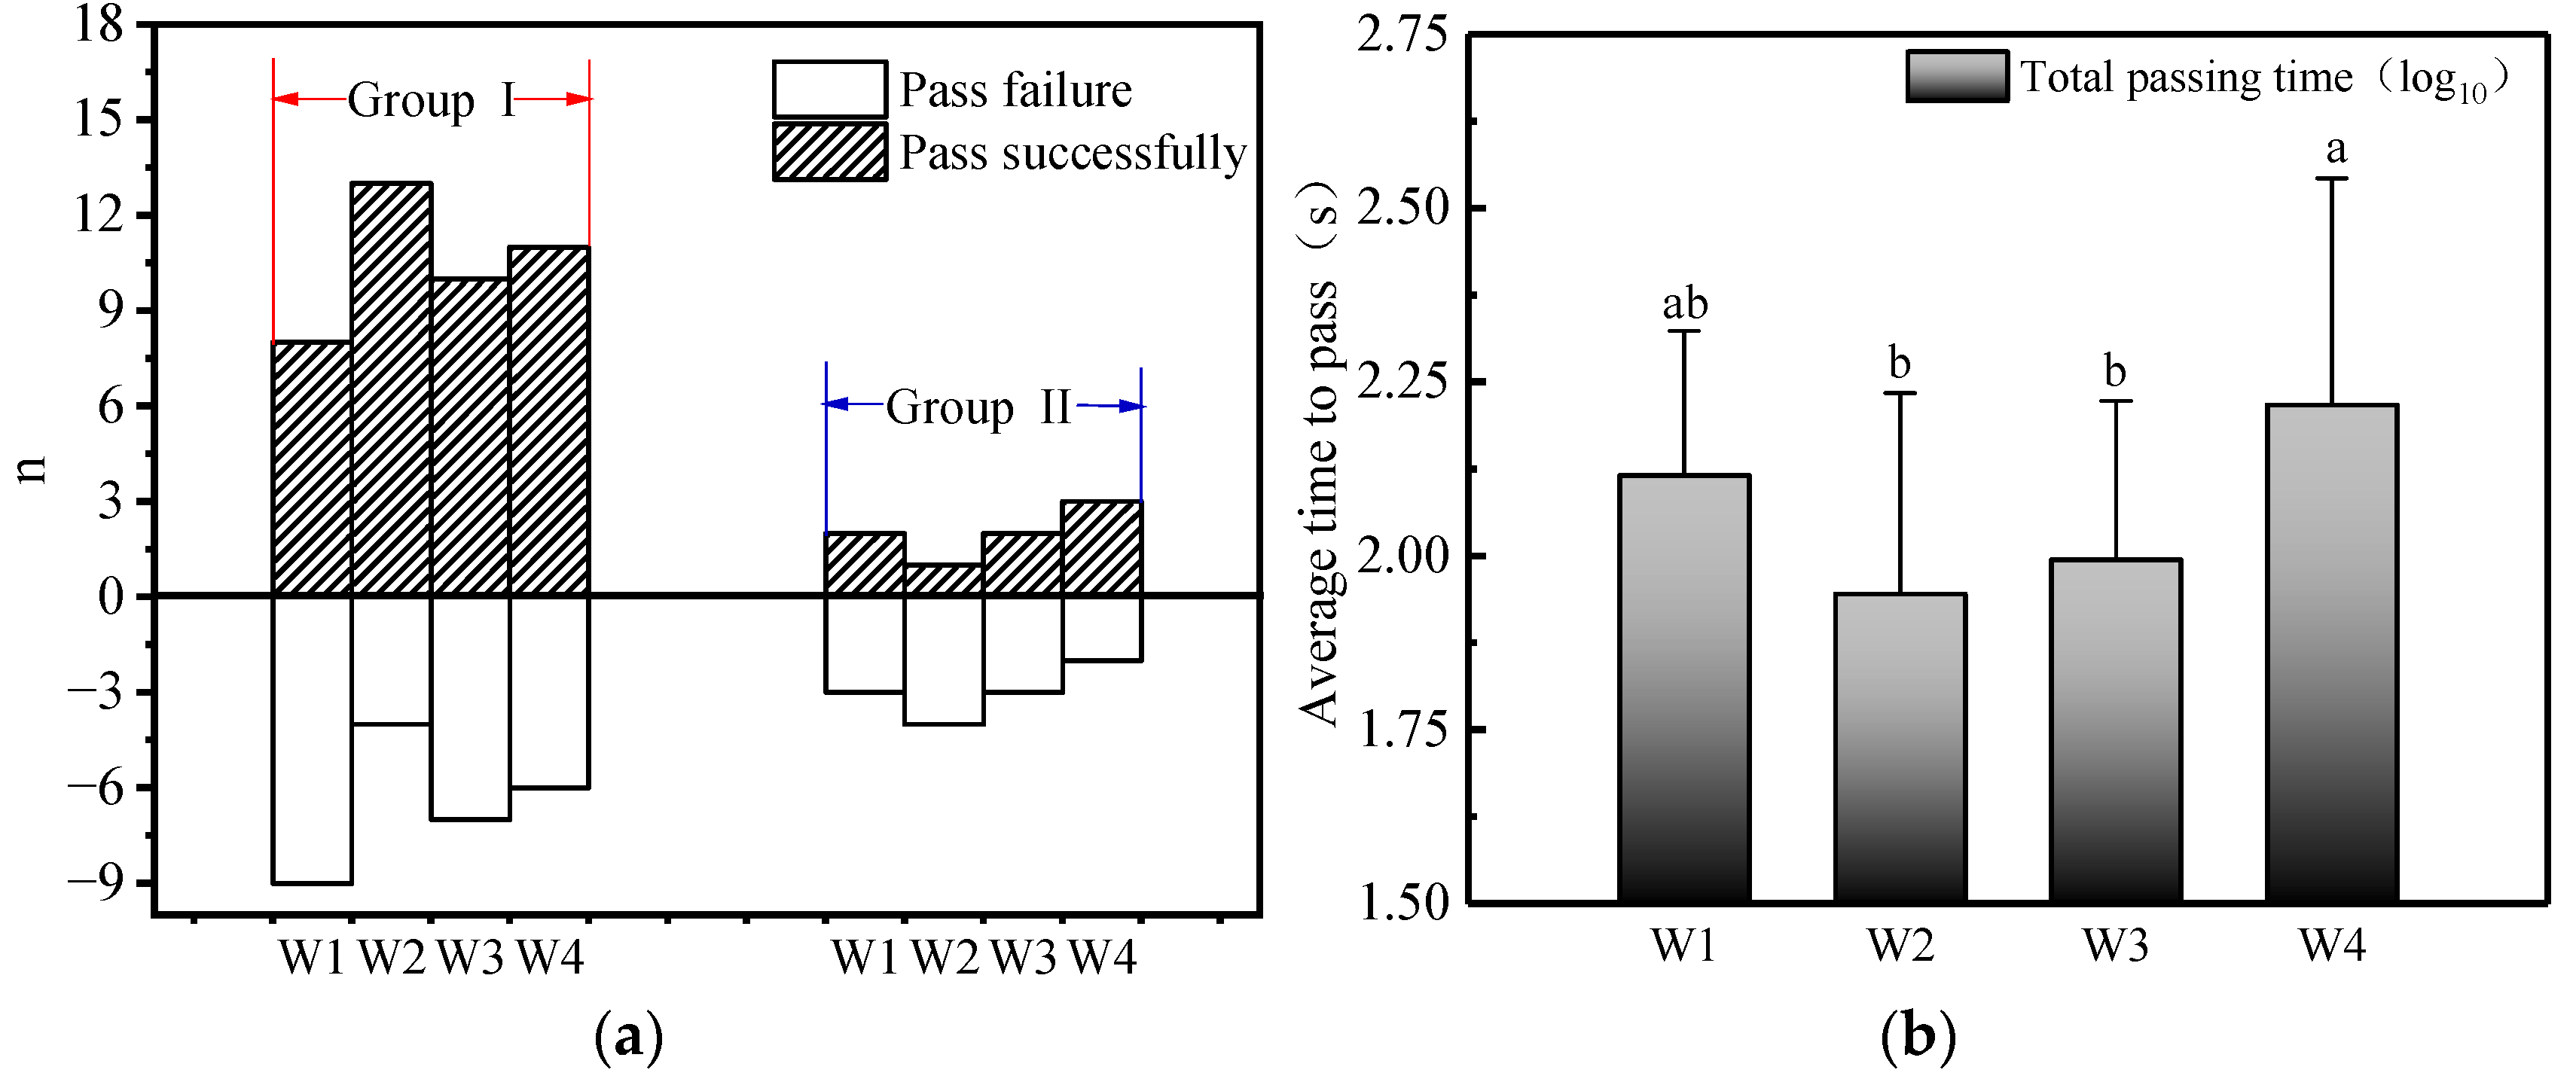
The results of the eel passing test are shown in Table 3 and Figure 5. Analysis of the data on passing in the four groups of working conditions revealed that under the flow field conditions of W1, a total of 19 out of 22 test eel samples exhibited upstream behavior, of which 10 eels successfully completed upstream swimming, with a passage rate of 45.45%. Among the 19 test samples with upstream behavior, a total of 16 showed turnback behavior, with a turnback rate of 84.21%. In the channel selection, the total number of fish crossing the bottom holes was 189, and a total of 2 eels crossed the weirs, with an incidence rate of 10.53%.
Under W2, the downstream tide level was lowered, and 15 eels swam upstream successfully, with a passage rate of 68.18%. A total of 15 returns were made, with a turnback rate of 31.82%, which was the lowest among all conditions. This may be an important reason why the passage rate for W2 was the highest among the four groups of conditions. There were 196 fish crossings in the bottom holes; a total of 2 eels crossed the weirs; and 3 eels crossed the top of the weir, with an incidence rate of 12.50%.
W3 further lowered the tide level on the basis of W2, which was a high-flow rate condition for eels. A total of 16 eels swam upstream, but only 11 passed successfully, with a passage rate of 50.00%. Out of the 16 upstream samples, 12 eels turned back, for a total of 25 returns, all of which occurred in the samples that swam successfully upstream, with a turnback rate of 75.00%. However, weir-crossing behaviors mainly occurred in the pool room after the resting pool, and the bottom hole was still the main crossing point for most of the fish. The bottom holes were crossed a total of 164 times, while the weirs were crossed 12 times, resulting in a weir-crossing rate of 18.75%.
W4 was based on the head drop of W2, and the inlet water depth was reduced to explore the effect of the inlet water depth on fish crossing. A total of 16 eels showed upstream behavior, and a total of 14 eels completed the upstream swimming, with a passage rate of 54.55%. In addition, 10 eels showed turnback behavior a total of 23 times, which occurred 15 times in the samples that successfully swam upstream, with a turnback rate of 62.50%. Six eels crossed the weir, crossing the bottom holes 174 times and the weirs 9 times, and the rate of crossing the weir was 37.50%.
The difference between the minimum and maximum time it took the eels to swim upstream was large, and for the purpose of our analysis, the upstream swimming time was bottom-logged by 10. The total time it took the Japanese eel to swim upstream in W1 and working condition 4 was significantly greater than that in W2 and W3 (p ˂ 0.05), indicating that both low-flow and low water depth prolonged the swimming time of the eels, indirectly indicating that the eels were prone to disorientation or disturbed passage selection under such conditions. In addition, many eels were found to turn back during the experiment, and the increase in the number of turns means that the eels needed to spend more time and consume more energy, which is not conducive to eels’ upstream swimming.
Overall, the yellow-phase Japanese eels in the small-length group seemed to perform better in the fish passage pool, with a higher passage rate. The surveillance video showed that they had more motivation to try to cross the weir and were able to climb over the top of the weir at some specific times, with a total of 13 groups of individuals successfully crossing the weir. The Japanese eels in the large-length group did not climb over the top of the weir in any of the four groups, and the test water showed a lower induction effect on them with a lower passage rate compared with that of the small-length group. (p ˃ 0.05).

3.3. Upstream Paths and Access Strategies

By comparing the upstream trajectories of Japanese eels in the yellow-phase of the four groups of working conditions collected, taking pool 3* as an example, we found that the upstream trajectories of the Japanese eels can be summarized into four types (Figure 6 and Figure 7), namely, “L” trajectories, “S” trajectories, “linear” trajectories, and climbing over the top of the weir. The “L” trajectory indicates that the eel crossed the mainstream against the wall, then followed the right side of the wall and the lower baffle in the reflux area, and finally passed the bottom hole. The “S”-typed trajectory means that the eel briefly used the reflux area to adjust and continued to enter the mainstream to complete the upstream trajectory. The “linear” trajectory means that the eel was in the mainstream for almost the entire upstream trajectory. Climbing over the top of the weir means that the eel climbed up and over the weir along the bulkhead or went up along the side wall of the sink first and then waited for an opportunity to swim from the mainstream area along the weir and swam through with burst speed.
Whether passing from the bottom hole or on the weir, most of the yellow-phase Japanese eels chose to pass through the mainstream quickly by pressing their bodies against the low-flow velocity area on the wall during the upstream process. The eels tended to avoid the center of the mainstream under high-flow, obviously slowed down and turned after their bodies contracted when their heads touched the bulkhead and continued to pass quickly after finding the mainstream along the bulkhead. Some of the eels continued to pass through the mainstream on an “S” trajectory. A small number of eels with strong swimming abilities passed through the bottom hole in a sprint line. However, the video playback showed that many eels that chose the “L” trajectory had attempted to cross the weir before reaching the bulkhead.
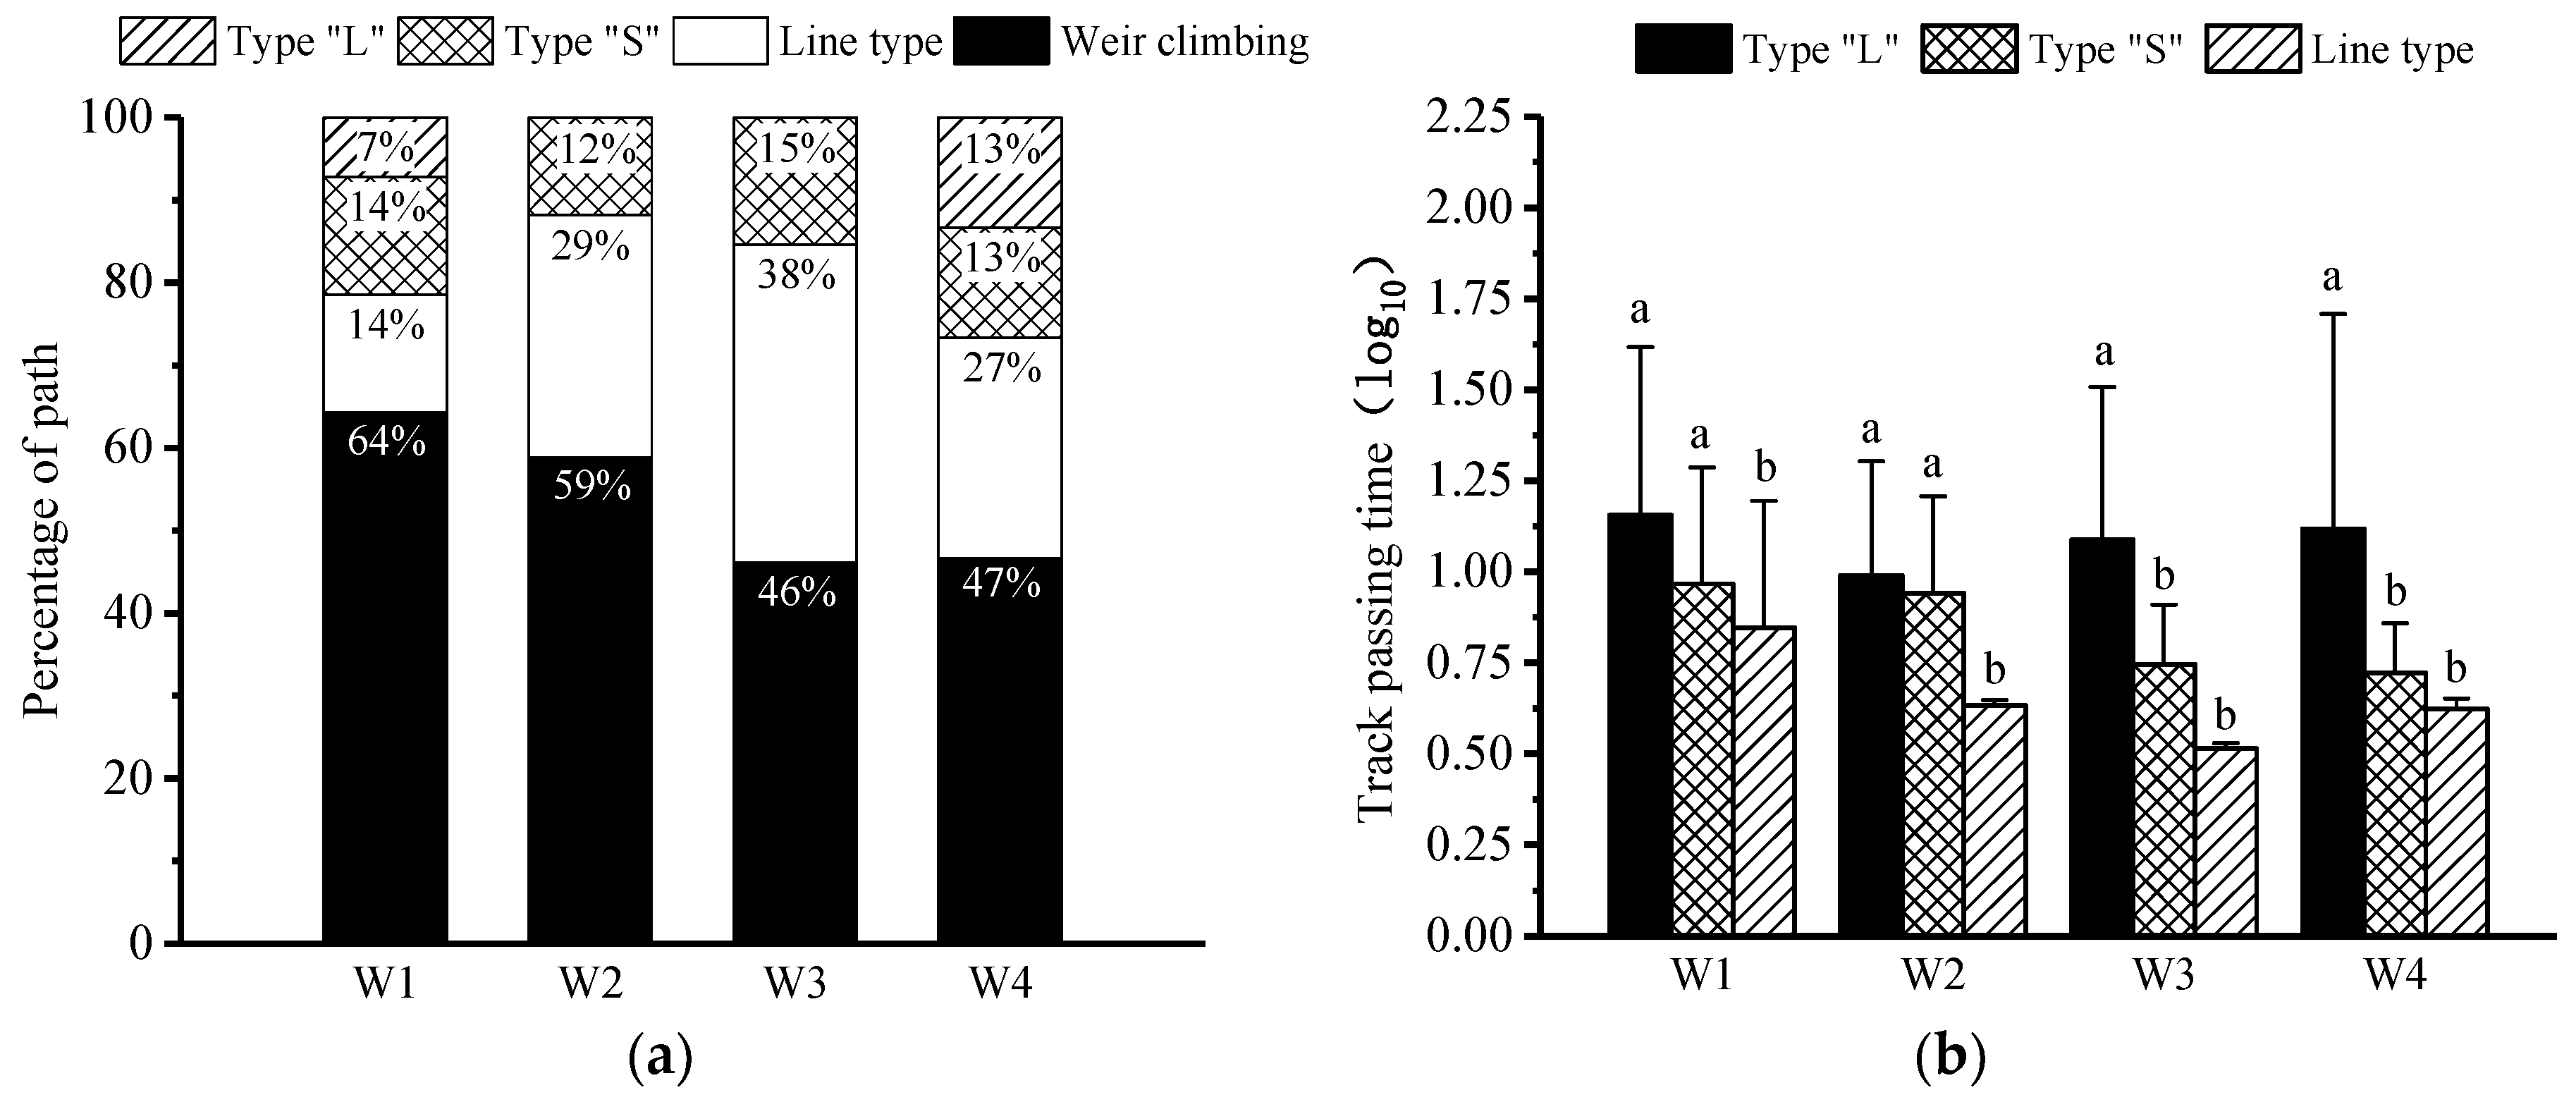
Figure 8 shows the proportion of eels choosing the trajectory type under each working condition. The proportion of the “linear” trajectory in the four working conditions did not change significantly with the change in the working conditions. In the analysis of the representative pool chamber, the trajectory over the weir was only extracted in the lower flow condition 1 and the lower overall water depth condition 4. In general, the eels still mainly swam in their unique wall-adhesive style when moving upstream, and the change in the hydraulic conditions affected their upstream swimming strategy to a certain extent.
The infrared camera recorded the upstream swimming time of each eel in pool 3*, aiming to study the differences in the upstream swimming times of different trajectories. The analysis of Figure 8 shows that, among the three trajectories, the eels with the “L” trajectory had a significantly longer travel time than those with the “S” and linear trajectories (p ˂ 0.05). Compared to the other trajectory types, the travel times of the individuals with the “L” trajectory were significantly longer than those with the “S” trajectory. The time difference for the individuals with the “L” trajectory was large compared to the other trajectory types, with the longest time reaching 144 s.
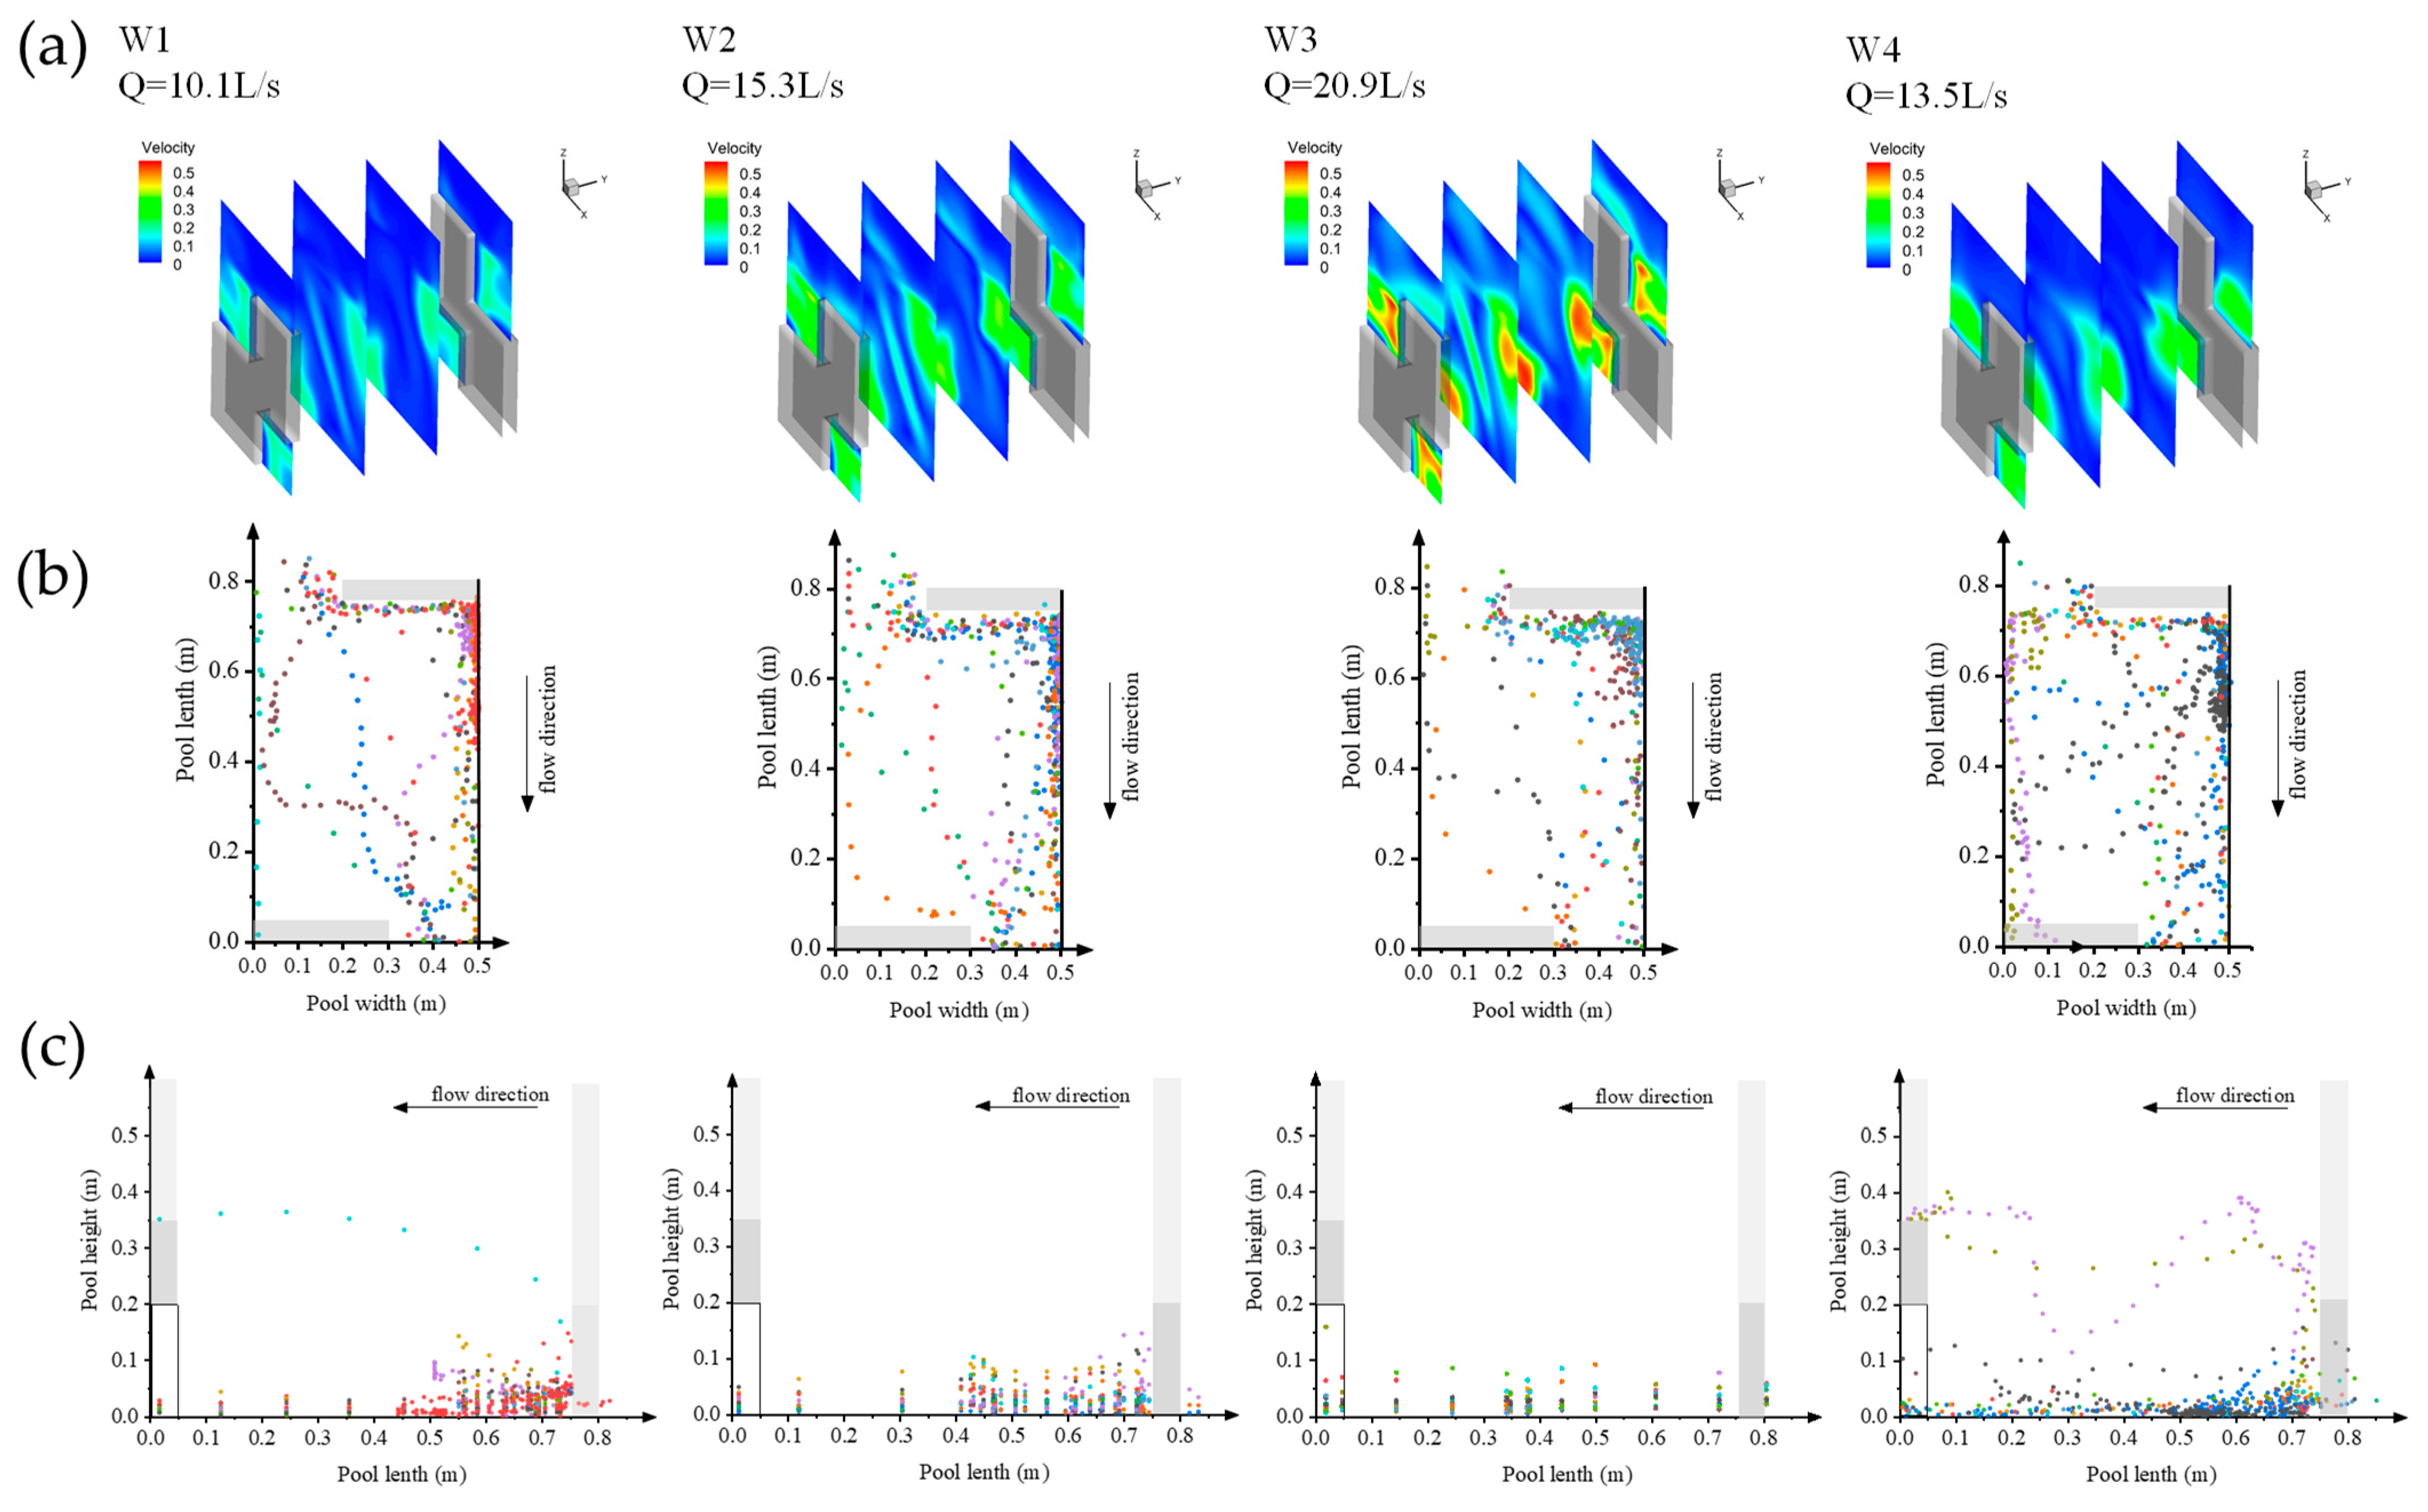
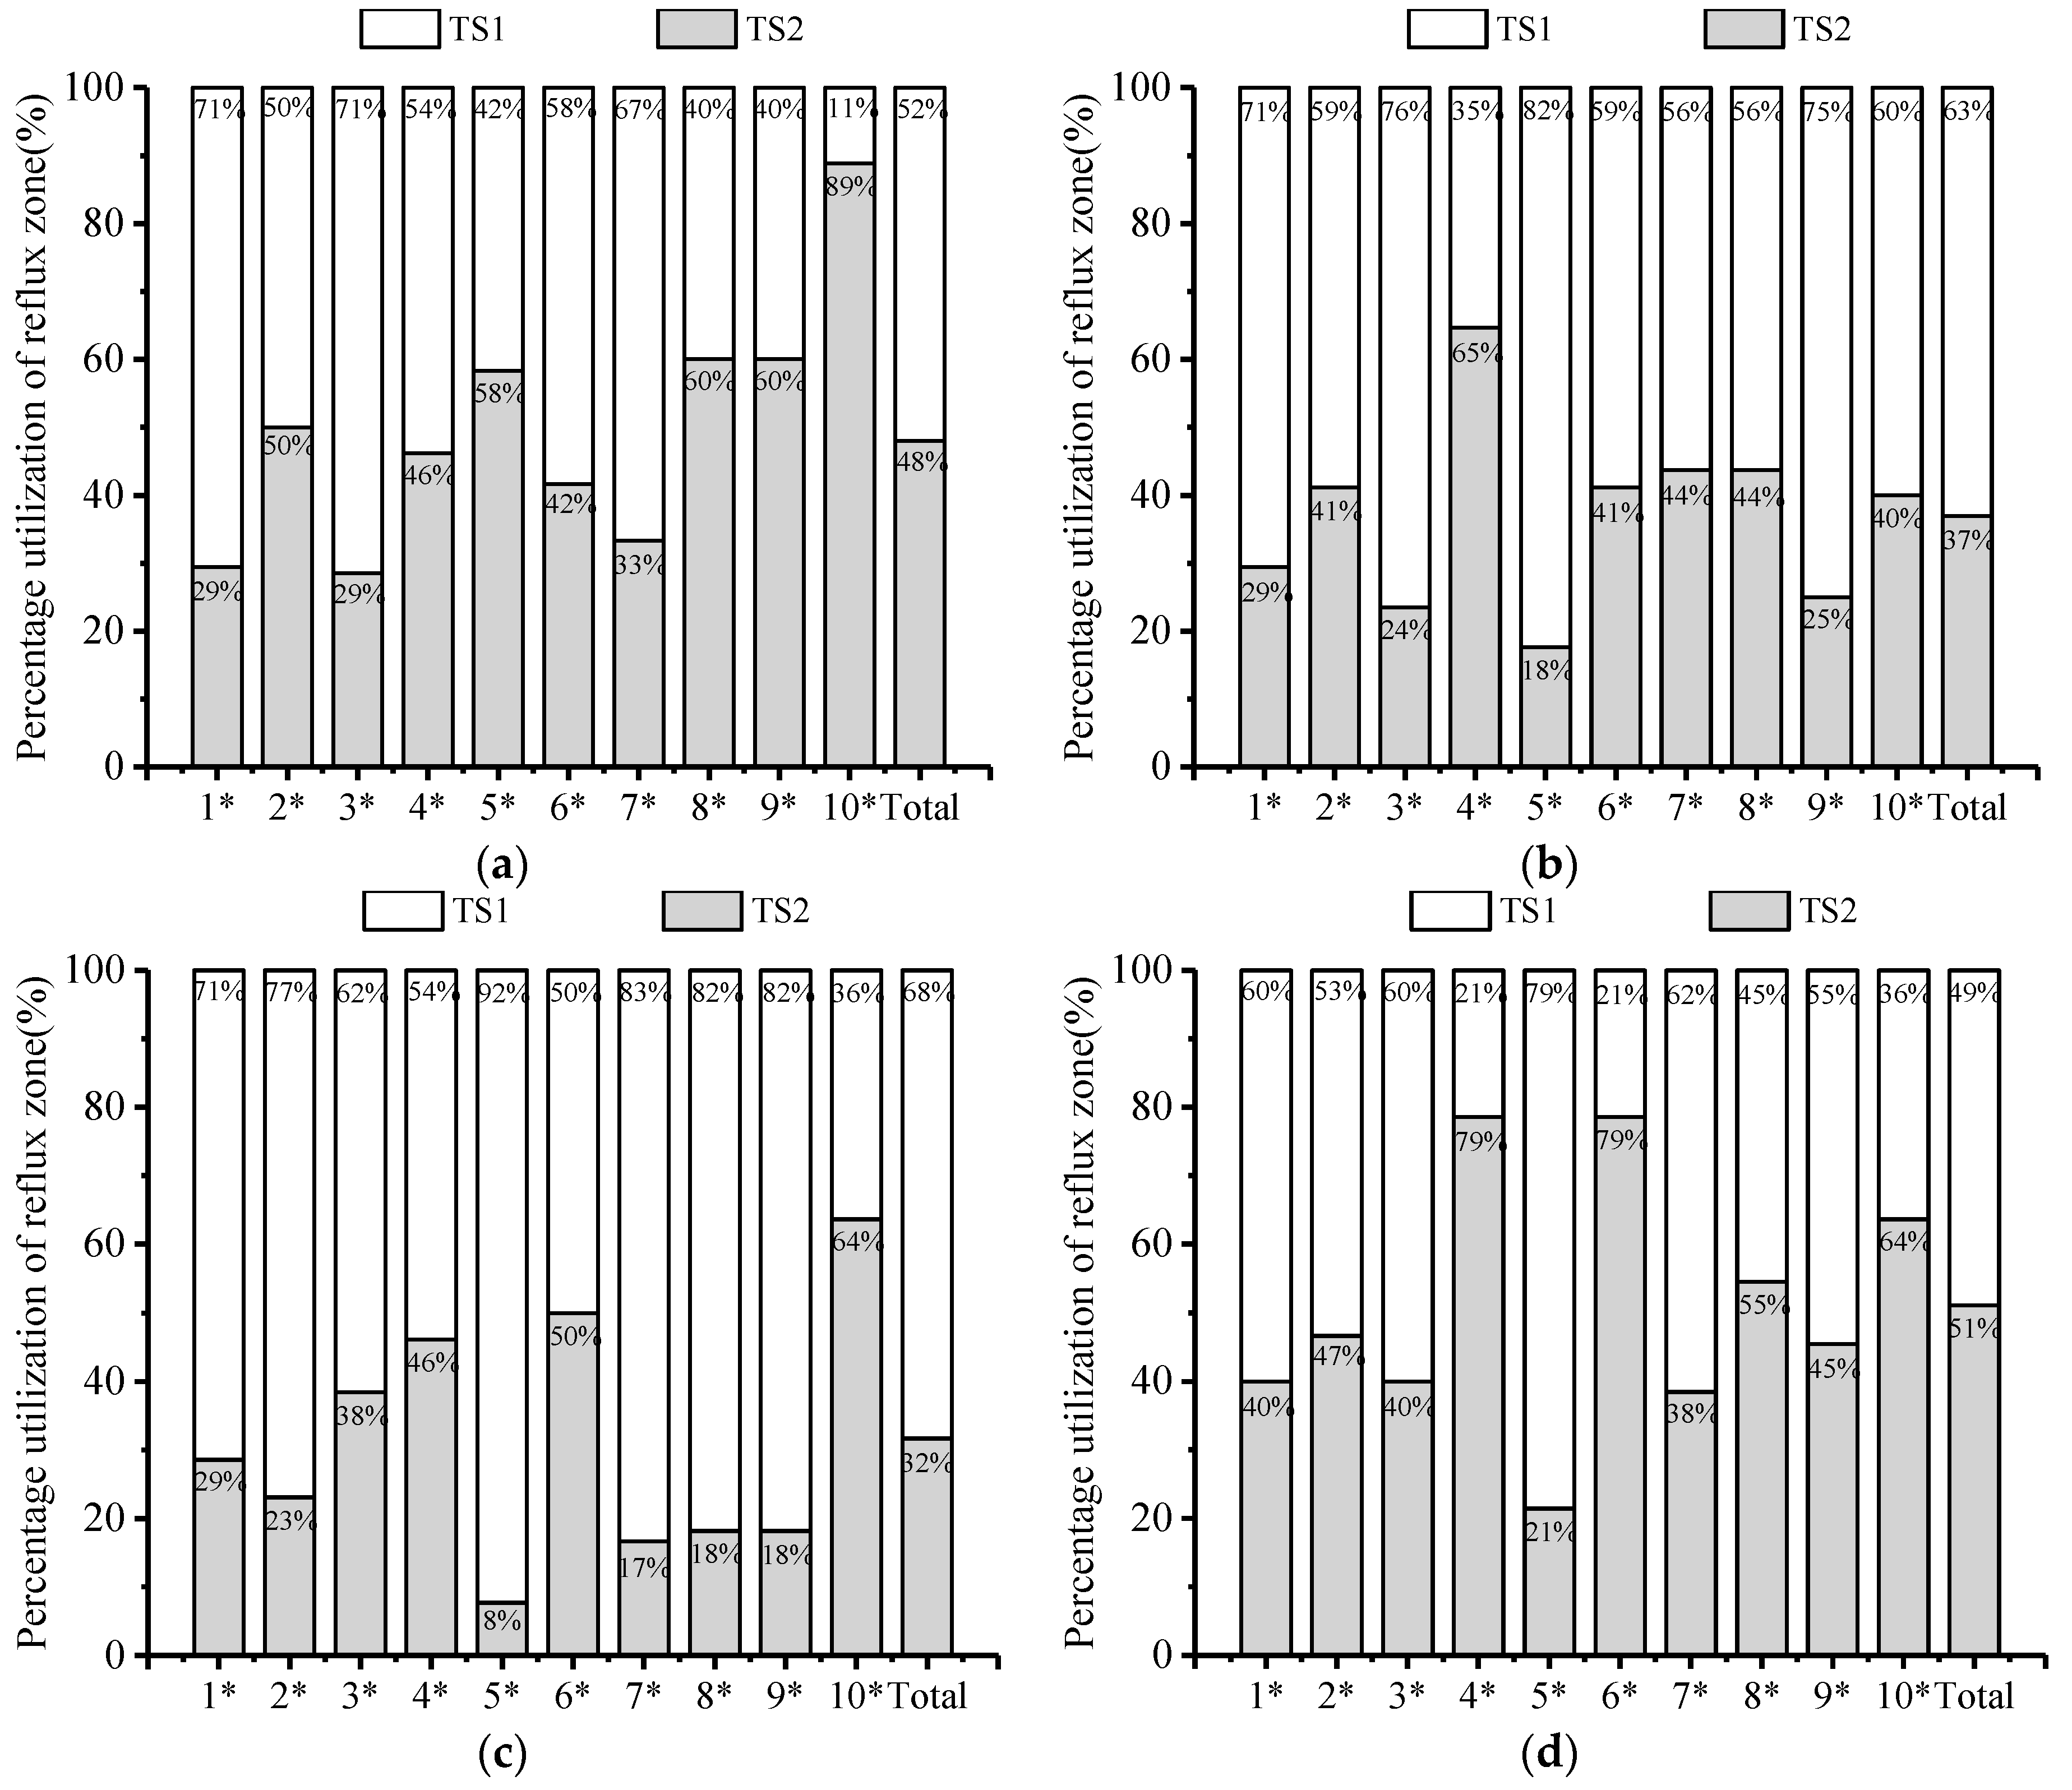
The flow slices in the fish passage system in Figure 9a reflect the three-dimensional distribution of water flow inside the fish passage, with the two jets spreading and mixing with each other. Analysis of the data collected from each section of the fishpond revealed (Figure 10) that, overall, the eels’ utilization of the reflux area increased with increasing flow, and they showed a sprint-rest pattern. Most eels chose to use the reflux zone to preserve their strength under the four groups of conditions, and compared to the inlet chamber (1*, 2*, and 3*) of the fish passage, the eels passed through the outlet chamber (10*) more easily. The spacing of points in Figure 9c reflects the passage speed of the eels (adjacent points Δt = 0.4 s). It can be seen that under all working conditions, the eels mainly moved at 0~4 cm from the bottom plate and chose to sprint through the mainstream of the bottom hole at a faster speed, slowing down before the next baffle. The overall swimming speed of the eels increased with the increase in flow.

3.4. Upward Preference

3.4.1. Flow Rate Selection Preference

According to our previous findings, the eels passing through the bottom hole were basically active at a height of 0~5 cm from the bottom of the pool, and the flow field data of the 2.5 cm height section (median) from the bottom of the pool were extracted as the background flow field of the eel’s upstream trajectory. The eels’ trajectories were imported and coupled with them. It can be seen in Figure 11 that after passing through the mainstream area of the upper bottom hole, only a small proportion of eels chose to pass through the mainstream area continuously, and most eels passed through the low-flow velocity area against the wall or along the edge of the mainstream. Under the high-flow velocity conditions, the eels hardly chose to pass through the center of the mainstream. The trajectory distribution of W4 appears to be relatively discrete compared to the first three groups. Many eels swam through the center of the reflux area, indicating that the hydraulic conditions of low water depth and low-flow velocity were indeed more likely to disorient the eels.
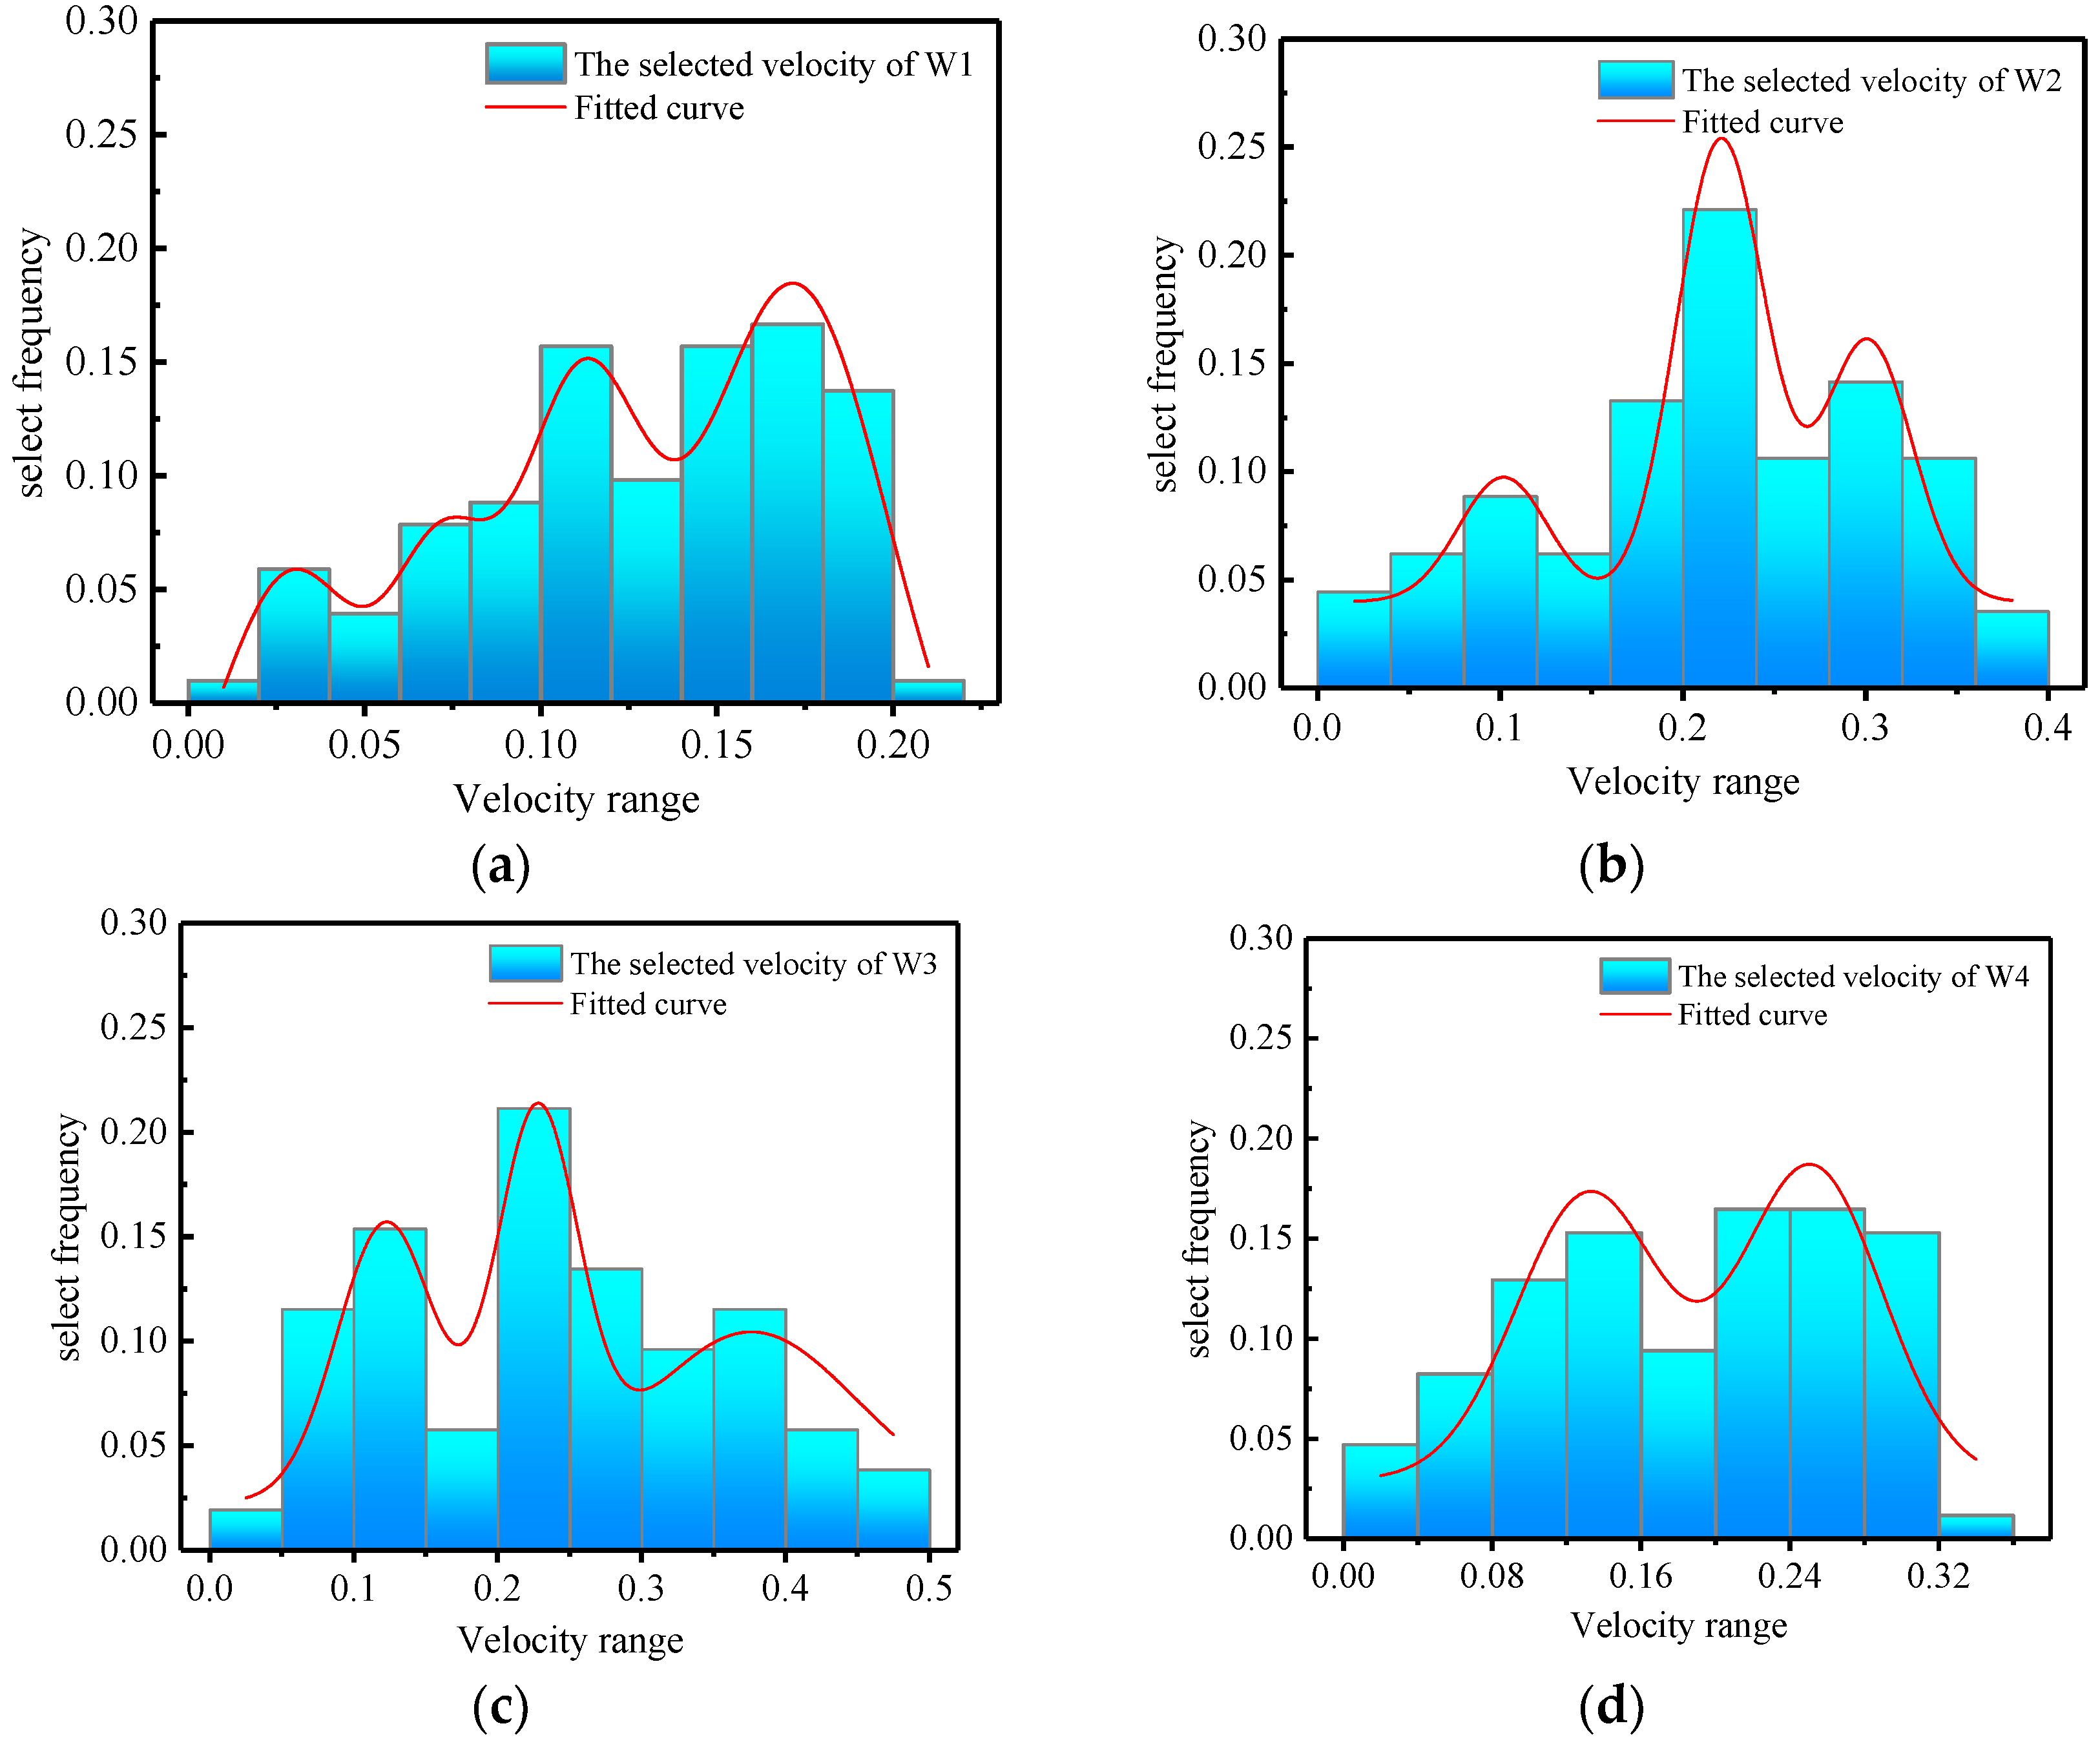
The upstream swimming strategy of fish can be attributed to the selection preferences of the hydraulic factors. When fish appear frequently or gather in a certain area, excluding resting midway in this area, it is generally because the flow field conditions in this area are more suitable for them to go upstream. Induction conditions can provide suitable turbulence, and fish can pass through with relatively less effort, thus being selected by the fish many times. By analyzing Figure 12, it can be seen that when crossing the mainstream of the bottom hole, the eels in the lower-flow velocity of W1 and W4 preferred to pass from the flow velocity of 0.12~0.18 m/s to the 0.10~0.30 m/s region, and as the flow continued to increase, the eel’s flow velocity preference increased to 0.20~0.36 m/s in W2, while in W3, where the flow was the largest, the mainstream flow velocity increased. The eels preferred to pass through the outer edge of the mainstream at 0.10~0.36 m/s. After passing through the bottom hole, the eels were driven by habit to go up along the wall. This stage was also the stage where the eels were most likely to become lost, and when they reached the next section of the bulkhead, they sensed the mainstream and continued to go up.

3.4.2. Disordered Turbulent Kinetic Energy Selection Preference

The overall turbulence of the model pool chamber was low, and the distribution of the turbulent kinetic energy (TKE) was similar to that of the mainstream (Figure 13). Under high-flow, the eels preferred to move up from the outer edge of the mainstream near a TKE of 0.002~0.005 m2/s2. The overall performance of the whole upward movement was as follows: when passing through the high-turbulence area, the preferred swimming path was towards the area with lower turbulence, and when the overall turbulence around the area was at a low level, the eels started to move towards the area with higher turbulence (looking for the mainstream).

3.4.3. Swimming Speed

The upstream movement of the eels in the flow field required them to overcome the flow velocity of the flow field itself and rely on their own muscle contractions to obtain forward momentum. The swimming velocity V was calculated according to Equation (2) by superimposing the relative motion velocity extracted from the ZooTracker software (https://www.microsoft.com/en-us/research/project/zootracer/, accessed on 16 May 2023) and the magnitude of the background flow velocity corresponding to the trajectory point:
V = V′ + u
In the above equation, u is the value of the flow velocity corresponding to the trajectory point in the background flow field, and V′ is the relative motion velocity of the eel and others.
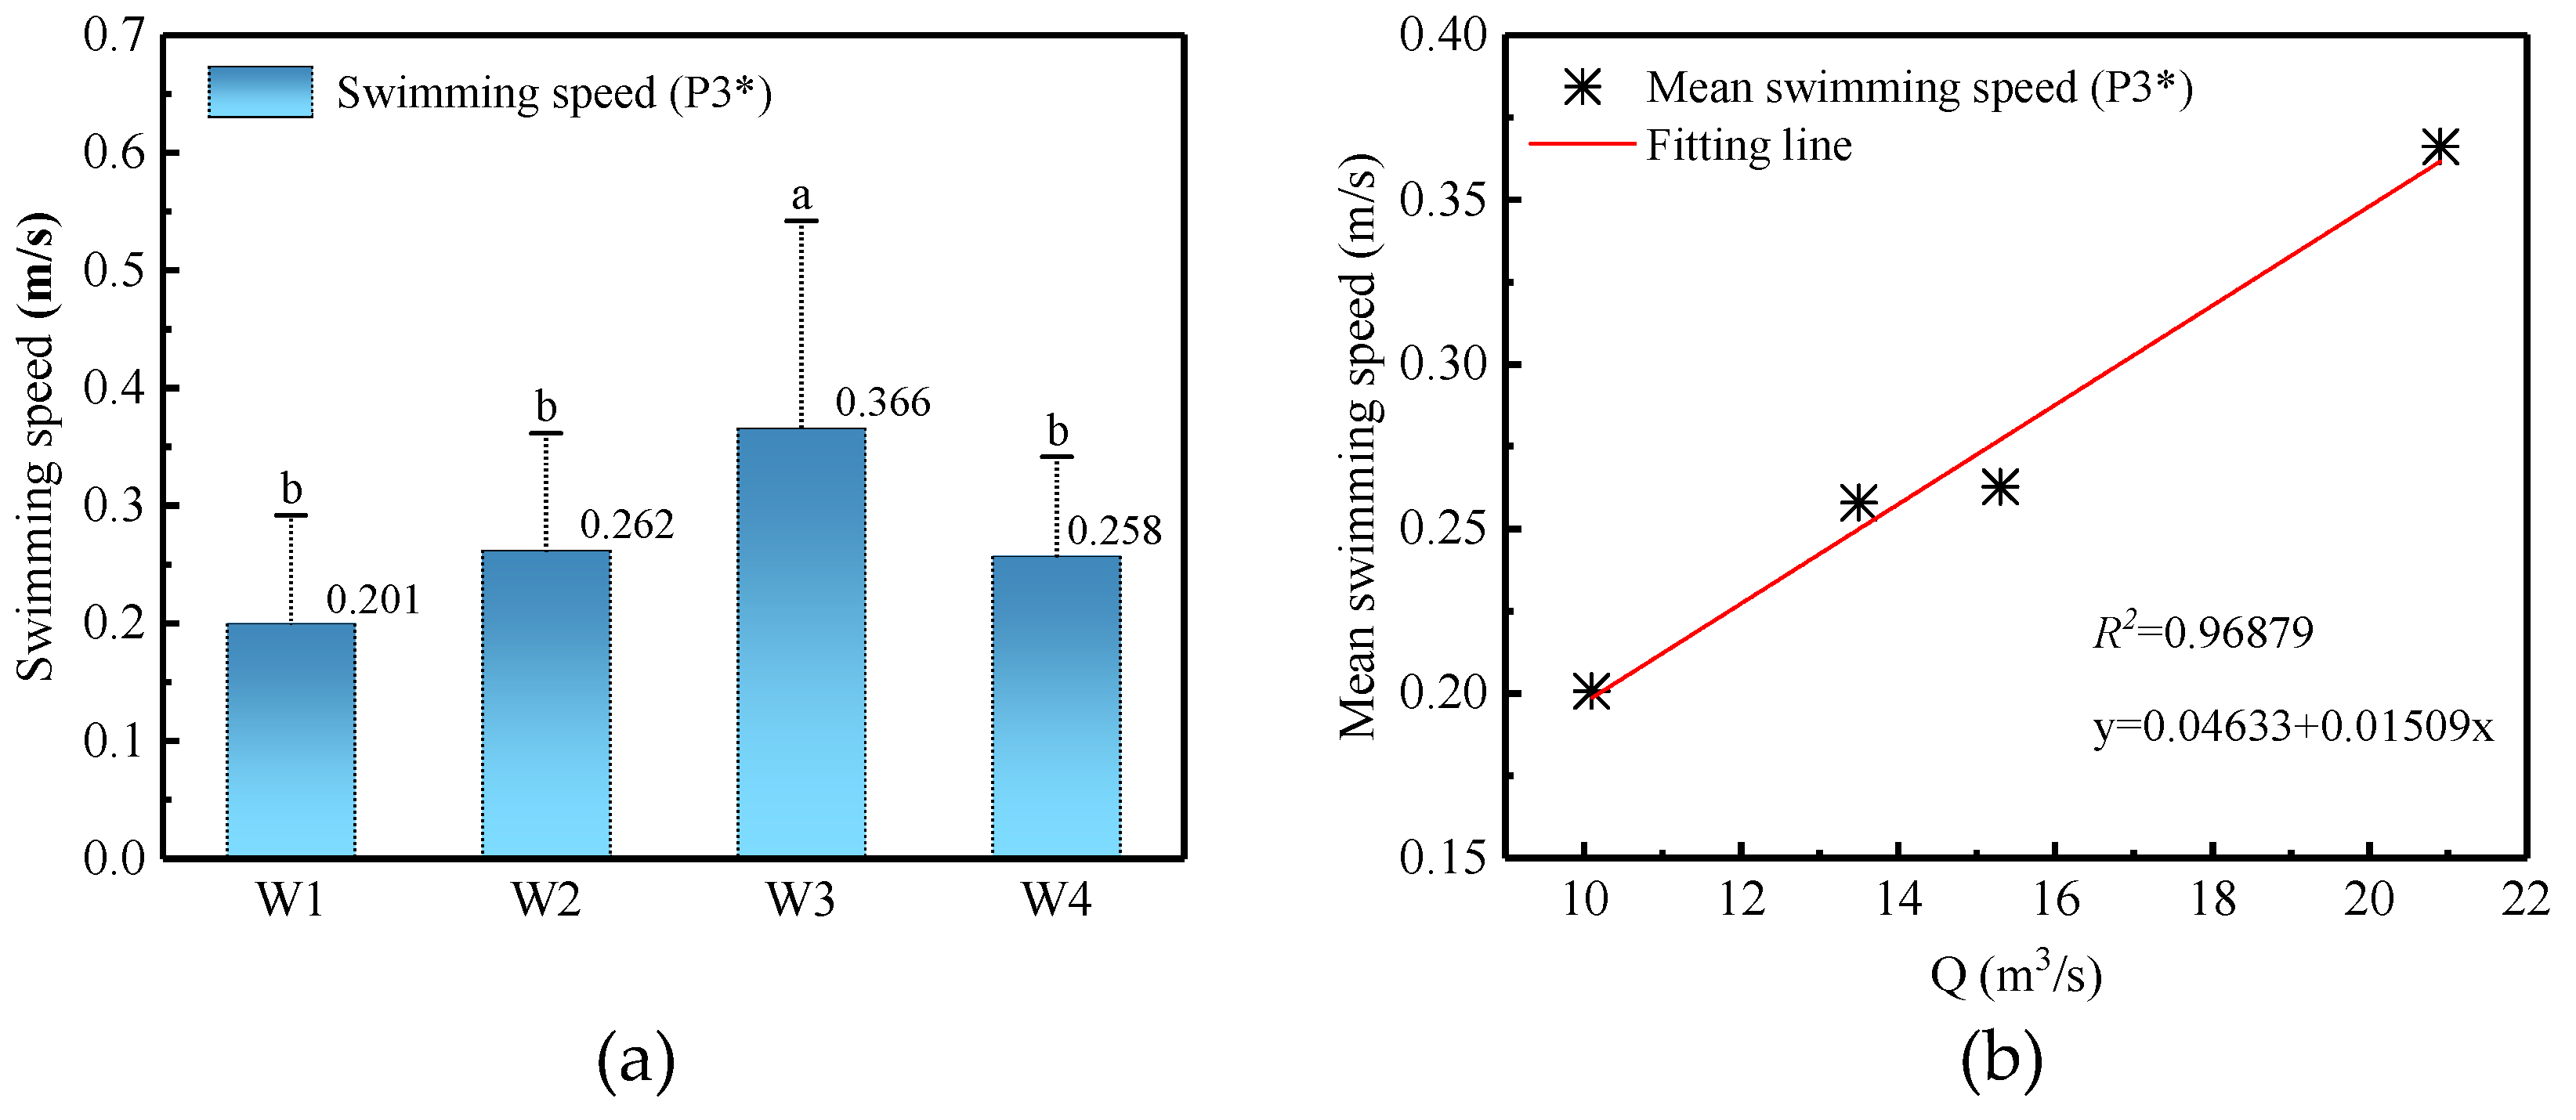
Figure 14 shows the average swimming speed of the eels in the four working conditions, and Figure 15 shows the statistical results of the swimming speed of the eels in each working condition at all trajectory points. It can be seen that the swimming speed of the eels in the test fish passage was basically proportional to the flow level of the working condition (Figure 15). The overall average swimming speed of the eels in W3 reached a maximum value of 0.37 m/s (p ˂ 0.05), while the swimming speed in W1 was the smallest at 0.20 m/s. The swimming speeds of the eels in W2 and W4 were close to each other, and there was no significant difference in the swimming speeds of the eels (p ˃ 0.05). The maximum swimming speed of the eels was 0.94 m/s near the bottom hole, and most eels preferred to maintain a swimming speed of 0.1~0.3 m/s to pass through the center of the mainstream. In addition, the swimming speed of the eels with a longer body length in the fish passage did not show any obvious advantage over the eels with a smaller body length (Figure 14), which indicates that the test flow velocity was less stimulating for the eels of such a body length while it was obviously stimulating for the eels with a smaller body length. Especially under W2 and W3, some of the eels swam at a speed of 0.60 m/s or more, which was higher than that of the eels with a longer body length in the unmodified bottom of the fish passage pool and the maximum bursting speed of eels of such a body length in the unmodified bottom of the fish passage [15].

4. Discussion

In this study, we established a scaled-down combination bulkhead fishway and carried out eel release tests to study the upstream behavior of eels. After verifying the accuracy of the numerical simulation, the results show that the combined bulkhead fishway was different from the vertical slit fishway, with obvious three-dimensional structural characteristics, which is consistent with the findings of Dong Z Y et al. [7].
There were also differences in the performance of different tide level combinations on the upstream response of yellow-phase Japanese eels. In this study, after referring to the observation results of the actual water level, four groups of working conditions with different flow rates and different water levels were set, and the lowest passage rate (45.45%) and the highest turnback rate (84.21%) of overfishing in W1 were due to the poor induction effect of the low-flow velocity and low turbulence in the pool chamber of the fishway for eels of the test body length, especially in the area behind the bulkhead. The flow velocity may have been lower than the induction velocity of the eels of this length, which may have easily disoriented the eels. This is similar to the results of Foulds [17] in a study on the effects of passing eels in a pool-weir fishway, in which this is a common problem. When the downstream tide level dropped slightly, these conditions improved, but when the tide level dropped further to the very low tide level of W3, the main current (V ˃ 0.5 m/s) began to become an obstacle to the passage of eels [15], and the eels reappeared with a low passage rate (50.00%) and high turnback rate (75.00%). Analysis of the video playback showed that most of the return of eels in this working condition was due to overcoming the high-flow velocity. We were surprised to find that, in comparison to W2, with the same head difference and better performance in fish crossing, the overall reduction of the water depth of the fishway still maintained a higher rate of turning, but the incidence of eels crossing the weir was significantly higher, so it seems that the reduction of the water depth of the fishway inlet may have increased the rate of turning and thus reduced the rate of successful upstream passage. The low water depth and low-flow rate induced more eels to cross the weir; six eels crossed the weir a total of nine times, and the incidence of crossing the weir was 37.50%.
Cai L and Li G et al. [22,35] studied the effects of different body lengths on the upstream swimming efficiency of grass carp juveniles in a vertical slit fishway. Kjærås [31] found that small-bodied eels showed a stronger intention to pass the weir than large-bodied eels by monitoring the three-dimensional trajectory of European eels passing in the Ätran River. In most cases, the fish swimming speed and body length showed a positive correlation [36,37], but in this study, eels in the large-length group did not show an advantage in passage time or passage rate relative to eels in the small-length group, which may be related to the fact that the model water flow conditions were not attractive enough for this type of body length eel.
The utilization of the reflux area by the Japanese eels increased with the increase in the flow rate, and they showed a strategy of sprinting, resting, and sprinting again during the upstream swimming process. The long-time length of the “L”-shaped trajectory (t ˃ 60 s) in the single-section cell was mostly related to the disorientation of the eels, and the retrospective video showed that the eels kept wandering in front of the bulkhead in search of the mainstream or resting in the reflux zone in front of the bulkhead. From the comparison of the working conditions, the low-flow speed in W1 affected the eels’ induction, and they were easily disoriented. The high-flow speed in W3 required a longer rest time after the eels overcame the mainstream, and the upstream swimming time was longer. Under the low water depth in W4, some eels also lost their direction in front of the bulkhead, and in general, the “L”-shaped trajectory of the eels under W2 had the shortest upstream swimming time and were the least disoriented. The “S” trajectory and the linear trajectory basically indicate that the eels did not lose their way during the upstream swimming process but chose to face the mainstream or quickly finish their upstream swimming against the edge of the mainstream. There was a large individual difference in the linear trajectory type only under W1, and there were no significant individual differences in the upstream swimming times under the other working conditions (p ˃ 0.05). The overall upstream swimming times were also close to each other. Thus, it seems that Japanese eels use the reflux area more than other fish, have a relatively weaker swimming ability, and prefer to choose the path with which they can preserve their physical strength, and which suits their swimming habits using the pool chamber strategy. In addition, there was obvious wall-hugging behavior in their upstream swimming.
By superimposing the upstream trajectory of the Japanese eel with the flow velocity and turbulent kinetic energy fields, it was found that, compared to the Iberian barbell preference (flow velocity range of 0.2~0.4 m/s and a TKE less than 0.05 m2/s2) studied by Silva [38], the preference of the Japanese eel for the flow velocity and turbulent energy appeared to be relatively low. The yellow-phase Japanese eel preferred a flow velocity range of 0.1~0.36 m/s and a turbulent energy range of 0.001~0.007 m2/s2 when crossing the mainstream. On the one hand, this may be related to the poor swimming ability of the Japanese eel, and on the other hand, it could be closely related to the structure of the model fishway itself, which had a low slope (0.21%) and produced a low level of turbulence.
Regarding the swimming speed of eels, Barbin G P and Mccleave J D [15,39] concluded that European and American eels of about 20 cm could maintain a swimming state for 30 min in a current of 0.26 m/s without fatigue, and when the flow speed continued to increase to 0.3 m/s, their maintained swimming state quickly shortened to 11 min, which indicates that eels prefer the former current. It is worth mentioning that the maximum swimming speed of the eels in this test reached 0.94 m/s, which is higher than the maximum swimming speed previously reported, but this swimming speed only lasted for a few seconds.
In addition, the structure and slope of the fish passage system also had a great influence on the water flow conditions, and these are the things to focus on in future studies in order to give full play to the system’s efficiency.

5. Conclusions

In this study, we established a physical model of a weir-hole combination bulkhead fishway, relied on the results of a refined fishway 3D numerical simulation, set up four different working conditions to create different water flow conditions, and used the behavior of Japanese eels as the basis for the response to the hydrodynamics. The main conclusions reached are as follows:
The success of Japanese eel passage through a fishway with a weir-hole combination bulkhead was affected by water depth and flow rate. When downstream tide levels were high or low, passage rates decreased to 45.45% and 50.00%, respectively, from the optimal rate of 68.18%. Shallow water depth at the fishway inlet not only reduced eel passage success but also increased the likelihood of eels climbing over the weir. As a result, the occurrence rate of eels climbing over the weir increased to 37.50%.
In the process of swimming upstream, the eels tended to stick to the wall and use the low-velocity zone to go upstream. Their overall performance was as follows: when passing through the high-turbulence zone, the preferred swimming path was towards the area with lower turbulence, and when the overall turbulence around was at a low level, the eels started to move towards the area with higher turbulence and look for the mainstream.
When crossing the mainstream, the yellow-phase Japanese eels preferred to choose the area with a flow velocity of 0.1~0.36 m/s and a turbulent kinetic energy range of 0.001~0.007 m2/s2, and they preferred to maintain a swimming speed of 0.1~0.3 m/s in the fish passage pool room to complete the upstream movement.

Author Contributions

Abstract section writing, Z.Y.; research methodology, X.L., F.B. and Z.F.; engineering research, F.B. and X.L.; numerical simulation, X.L.; data processing, D.H.; writing—original draft, X.L.; writing—review and editing, Z.Y. and F.B.; supervision, Z.Y. and D.L.; project management, Z.Y. and F.B. All authors have read and agreed to the published version of the manuscript.

Funding

This study was funded by the National Natural Science Foundation of China, grant number 51979249; the Joint Funds of the Zhejiang Provincial Natural Science Foundation of China, grant number LZJWZ22C030001; and the Water Resources of Science and Gechnology of the Zhejiang Provincial Water Resources Department of China, grant number RB2115.

Data Availability Statement

All data generated or analyzed during this study are included in this published article.

Acknowledgments

We are grateful to the Shaoxing Cao’e River Barrage Management Center for their help in our field research and especially to the Zhejiang Institute of Water Resources and Hydropower for providing the experimental site.

Conflicts of Interest

The authors declare no conflict of interest.

References

  1. Mao, X. Review of fishway research in China. Ecol. Eng. 2018, 115, 91–95. [Google Scholar] [CrossRef]
  2. Schilt, C.R. Developing fish passage and protection at hydropower dams. Appl. Anim. Behav. Sci. 2007, 104, 295–325. [Google Scholar] [CrossRef]
  3. Zielinski, D.P.; Freiburger, C. Advances in fish passage in the Great Lakes basin. J. Great Lakes Res. 2021, 47, S439–S447. [Google Scholar] [CrossRef]
  4. Brooks, D.A. The hydrokinetic power resource in a tidal estuary: The Kennebec River of the central Maine coast. Renew. Energy 2011, 36, 1492–1501. [Google Scholar] [CrossRef]
  5. Rolls, R.J.; Faggotter, S.J.; Roberts, D.T.; Burford, M.A. Simultaneous assessment of two passage facilities for maintaining hydrological connectivity for subtropical coastal riverine fish. Ecol. Eng. 2018, 124, 77–87. [Google Scholar] [CrossRef]
  6. Zielinski, D.P.; Gaden, M.; Muir, A.M. Editorial: Global fish passage issues. Aquac. Fish. 2021, 6, 111–112. [Google Scholar] [CrossRef]
  7. Dong, Z.Y.; Tong, J.L.; Huang, Z. Turbulence characteristics in a weir-orifice-slot combined fishway with an identical layout. J. Turbul. 2022, 23, 327–351. [Google Scholar] [CrossRef]
  8. Halvorsen, S.; Korslund, L.; Gustavsen, P.Ø.; Slettan, A. Environmental DNA analysis indicates that migration barriers are decreasing the occurrence of European eel (Anguilla anguilla) in distance from the sea. Glob. Ecol. Conserv. 2020, 24, e01245. [Google Scholar] [CrossRef]
  9. Kaifu, K. Challenges in assessments of Japanese eel stock. Mar. Policy 2019, 102, 1–4. [Google Scholar] [CrossRef]
  10. Kaifu, K.; Yokouchi, K. Increasing or decreasing?—Current status of the Japanese eel stock. Fish. Res. 2019, 220, 105348. [Google Scholar] [CrossRef]
  11. Kaifu, K.; Yokouchi, K.; Miller, M.J.; Washitani, I. Management of glass eel fisheries is not a sufficient measure to recover a local Japanese eel population. Mar. Policy 2021, 134, 104806. [Google Scholar] [CrossRef]
  12. Bernas, R.; Debowski, P.; Skora, M.; Radtke, G.; Morzuch, J.; Kapusta, A. Low mortality rate in silver eels (Anguilla anguilla L.) passing through a small hydropower station. Mar. Freshw. Res. 2017, 68, 2081–2086. [Google Scholar] [CrossRef]
  13. Heisey, P.G.; Mathur, D.; Phipps, J.L.; Avalos, J.C.; Hoffman, C.E.; Adanns, S.W.; De-Oliveira, E. Passage survival of European and American eels at Francis and propeller turbines. J. Fish Biol. 2019, 95, 1172–1183. [Google Scholar] [CrossRef]
  14. Trancart, T.; Carpentier, A.; Acou, A.; Charrier, F.; Mazel, V.; Danet, V.; Feunteun, E. When “safe” dams kill: Analyzing combination of impacts of overflow dams on the migration of silver eels. Ecol. Eng. 2020, 145, 105741. [Google Scholar] [CrossRef]
  15. McCleave, J.D. Swimming performance of European eel (Anguilla anguilla (L.)) elvers. J. Fish Biol. 1980, 16, 445–452. [Google Scholar] [CrossRef]
  16. Kerr, J.R.; Karageorgopoulos, P.; Kemp, P.S. Efficacy of a side-mounted vertically oriented bristle pass for improving upstream passage of European eel (Anguilla anguilla) and river lamprey (Lampetra fluviatilis) at an experimental Crump weir. Ecol. Eng. 2015, 85, 121–131. [Google Scholar] [CrossRef] [Green Version]
  17. Foulds, W.L.; Lucas, M.C. Extreme inefficiency of two conventional, technical fishways used by European river lamprey (Lampetra fluviatilis). Ecol. Eng. 2013, 58, 423–433. [Google Scholar] [CrossRef] [Green Version]
  18. Feunteun, E.; Acou, A.; Guillouet, J.; Laffaille, P.; Legault, A. Spatial distribution of an eel population (Anguilla anguilla L.) in a small coastal catchment of northern Brittany (France). Consequences of hydraulic works. Knowl. Manag. Aquat. Ecosyst. 1998, 349, 129–139. [Google Scholar] [CrossRef]
  19. Cowx, I.G.; O’Grady, K.T.; Knights, B.; White, E.M. Enhancing immigration and recruitment of eels: The use of passes and associated trapping systems. Fish. Manag. Ecol. 1998, 5, 459–471. [Google Scholar]
  20. Ballu, A.; Pineau, G.; Calluaud, D.; David, L. Experimental-Based Methodology to Improve the Design of Vertical Slot Fishways. J. Hydraul. Eng. 2019, 145, 04019031. [Google Scholar] [CrossRef]
  21. Cao, P.; Mu, X.; Li, X.; Baiyin, B.; Wang, X.; Zhen, W. Relationship between Upstream Swimming Behaviors of Juvenile Grass Carp and Characteristic Hydraulic Conditions of a Vertical Slot Fishway. Water 2021, 13, 1299. [Google Scholar] [CrossRef]
  22. Li, G.; Sun, S.; Liu, H.; Zheng, T. Schizothorax prenanti swimming behavior in response to different flow patterns in vertical slot fishways with different slot positions. Sci. Total Environ. 2021, 754, 142142. [Google Scholar] [CrossRef]
  23. Daneshfaraz, R.; Aminvash, E.; Bagherzadeh, M.; Ghaderi, A.; Kuriqi, A.; Najibi, A.; Ricardo, A.M. Laboratory Investigation of Hydraulic Parameters on Inclined Drop Equipped with Fishway Elements. Symmetry 2021, 13, 1643. [Google Scholar] [CrossRef]
  24. Daneshfaraz, R.; Aminvash, E.; Abraham, J. Hydraulic Characteristics of Fish-passes on Inclined Drops with Multifarious Configurations: An Experimental Study. Res. Dev. Sci. Technol. 2022, 4, 108–123. [Google Scholar] [CrossRef]
  25. Dockery, D.R.; McMahon, T.E.; Kappenman, K.M.; Blank, M. Evaluation of swimming performance for fish passage of longnose dace Rhinichthys cataractae using an experimental flume. J. Fish Biol. 2017, 90, 980–1000. [Google Scholar] [CrossRef] [PubMed]
  26. Kirk, M.A.; Caudill, C.C.; Syms, J.C.; Tonina, D. Context-dependent responses to turbulence for an anguilliform swimming fish, Pacific lamprey, during passage of an experimental vertical-slot weir. Ecol. Eng. 2017, 106, 296–307. [Google Scholar] [CrossRef]
  27. Newbold, L.R.; Shi, X.; Hou, Y.; Han, D.; Kemp, P.S. Swimming performance and behaviour of bighead carp (Hypophthalmichthys nobilis): Application to fish passage and exclusion criteria. Ecol. Eng. 2016, 95, 690–698. [Google Scholar] [CrossRef]
  28. Goring, D.G.; Nikora, V.I. Despiking Acoustic Doppler Velocimeter Data. J. Hydraul. Eng. 2002, 128, 117–126. [Google Scholar] [CrossRef] [Green Version]
  29. Fuentes-Pérez, J.F.; Quaresma, A.L.; Pinheiro, A.; Sanz-Ronda, F.J. OpenFOAM vs FLOW-3D: A comparative study of vertical slot fishway modelling. Ecol. Eng. 2022, 174, 106446. [Google Scholar] [CrossRef]
  30. Zhong, Z.; Ruan, T.; Hu, Y.; Liu, J.; Liu, B.; Xu, W. Experimental and numerical assessment of hydraulic characteristic of a new semi-frustum weir in the pool-weir fishway. Ecol. Eng. 2021, 170, 106362. [Google Scholar] [CrossRef]
  31. Kjærås, H.; Baktoft, H.; Silva, A.T.; Gjelland, K.Ø.; Økland, F.; Forseth, T.; Szabó-Mészáros, M.; Calles, O. Three-dimensional migratory behaviour of European silver eels (Anguilla anguilla) approaching a hydropower plant. J. Fish Biol. 2023, 102, 465–478. [Google Scholar] [CrossRef] [PubMed]
  32. Welsh, S.A.; Liller, H.L. Environmental Correlates of Upstream Migration of Yellow-Phase American Eels in the Potomac River Drainage. Trans. Am. Fish. Soc. 2013, 142, 483–491. [Google Scholar] [CrossRef]
  33. Dong, Z.Y.; Jiang, L.B.; Mao, B. Experimental study on turbulent flow structure of vertical slit type fish passage with heterolateral arrangement. J. Hydroecol. 2021, 42, 129–136. [Google Scholar] [CrossRef]
  34. Fuentes-Pérez, J.F.; Eckert, M.; Tuhtan, J.A.; Ferreira, M.T.; Kruusmaa, M.; Branco, P. Spatial preferences of Iberian barbel in a vertical slot fishway under variable hydrodynamic scenarios. Ecol. Eng. 2018, 125, 131–142. [Google Scholar] [CrossRef]
  35. Cai, L.; Chen, J.; Johnson, D.; Tu, Z.; Huang, Y. Effect of body length on swimming capability and vertical slot fishway design. Glob. Ecol. Conserv. 2020, 22, e00990. [Google Scholar] [CrossRef]
  36. Shiau, J.; Watson, J.R.; Cramp, R.L.; Gordos, M.A.; Franklin, C.E. Interactions between water depth, velocity and body size on fish swimming performance: Implications for culvert hydrodynamics. Ecol. Eng. 2020, 156, 105987. [Google Scholar] [CrossRef]
  37. Zhao, Z.; Liang, R.; Wang, Y.; Yuan, Q.; Zhang, Z.; Li, K. Study on the swimming ability of endemic fish in the lower reaches of the Yangtze River: A case study. Glob. Ecol. Conserv. 2020, 22, e01014. [Google Scholar] [CrossRef]
  38. Silva, A.T.; Santos, J.M.; Ferreira, M.T.; Pinheiro, A.N.; Katopodis, C. Effects of water velocity and turbulence on the behaviour of Iberian barbel (Luciobarbus bocagei, Steindachner 1864) in an experimental pool-type fishway. River Res. Appl. 2011, 27, 360–373. [Google Scholar] [CrossRef]
  39. Barbin, G.P.; Krueger, W.H. Behaviour and swimming performance of elvers of the American eel, Anguitta rostrata, in an experimental flume. J. Fish Biol. 1994, 45, 111–121. [Google Scholar] [CrossRef]
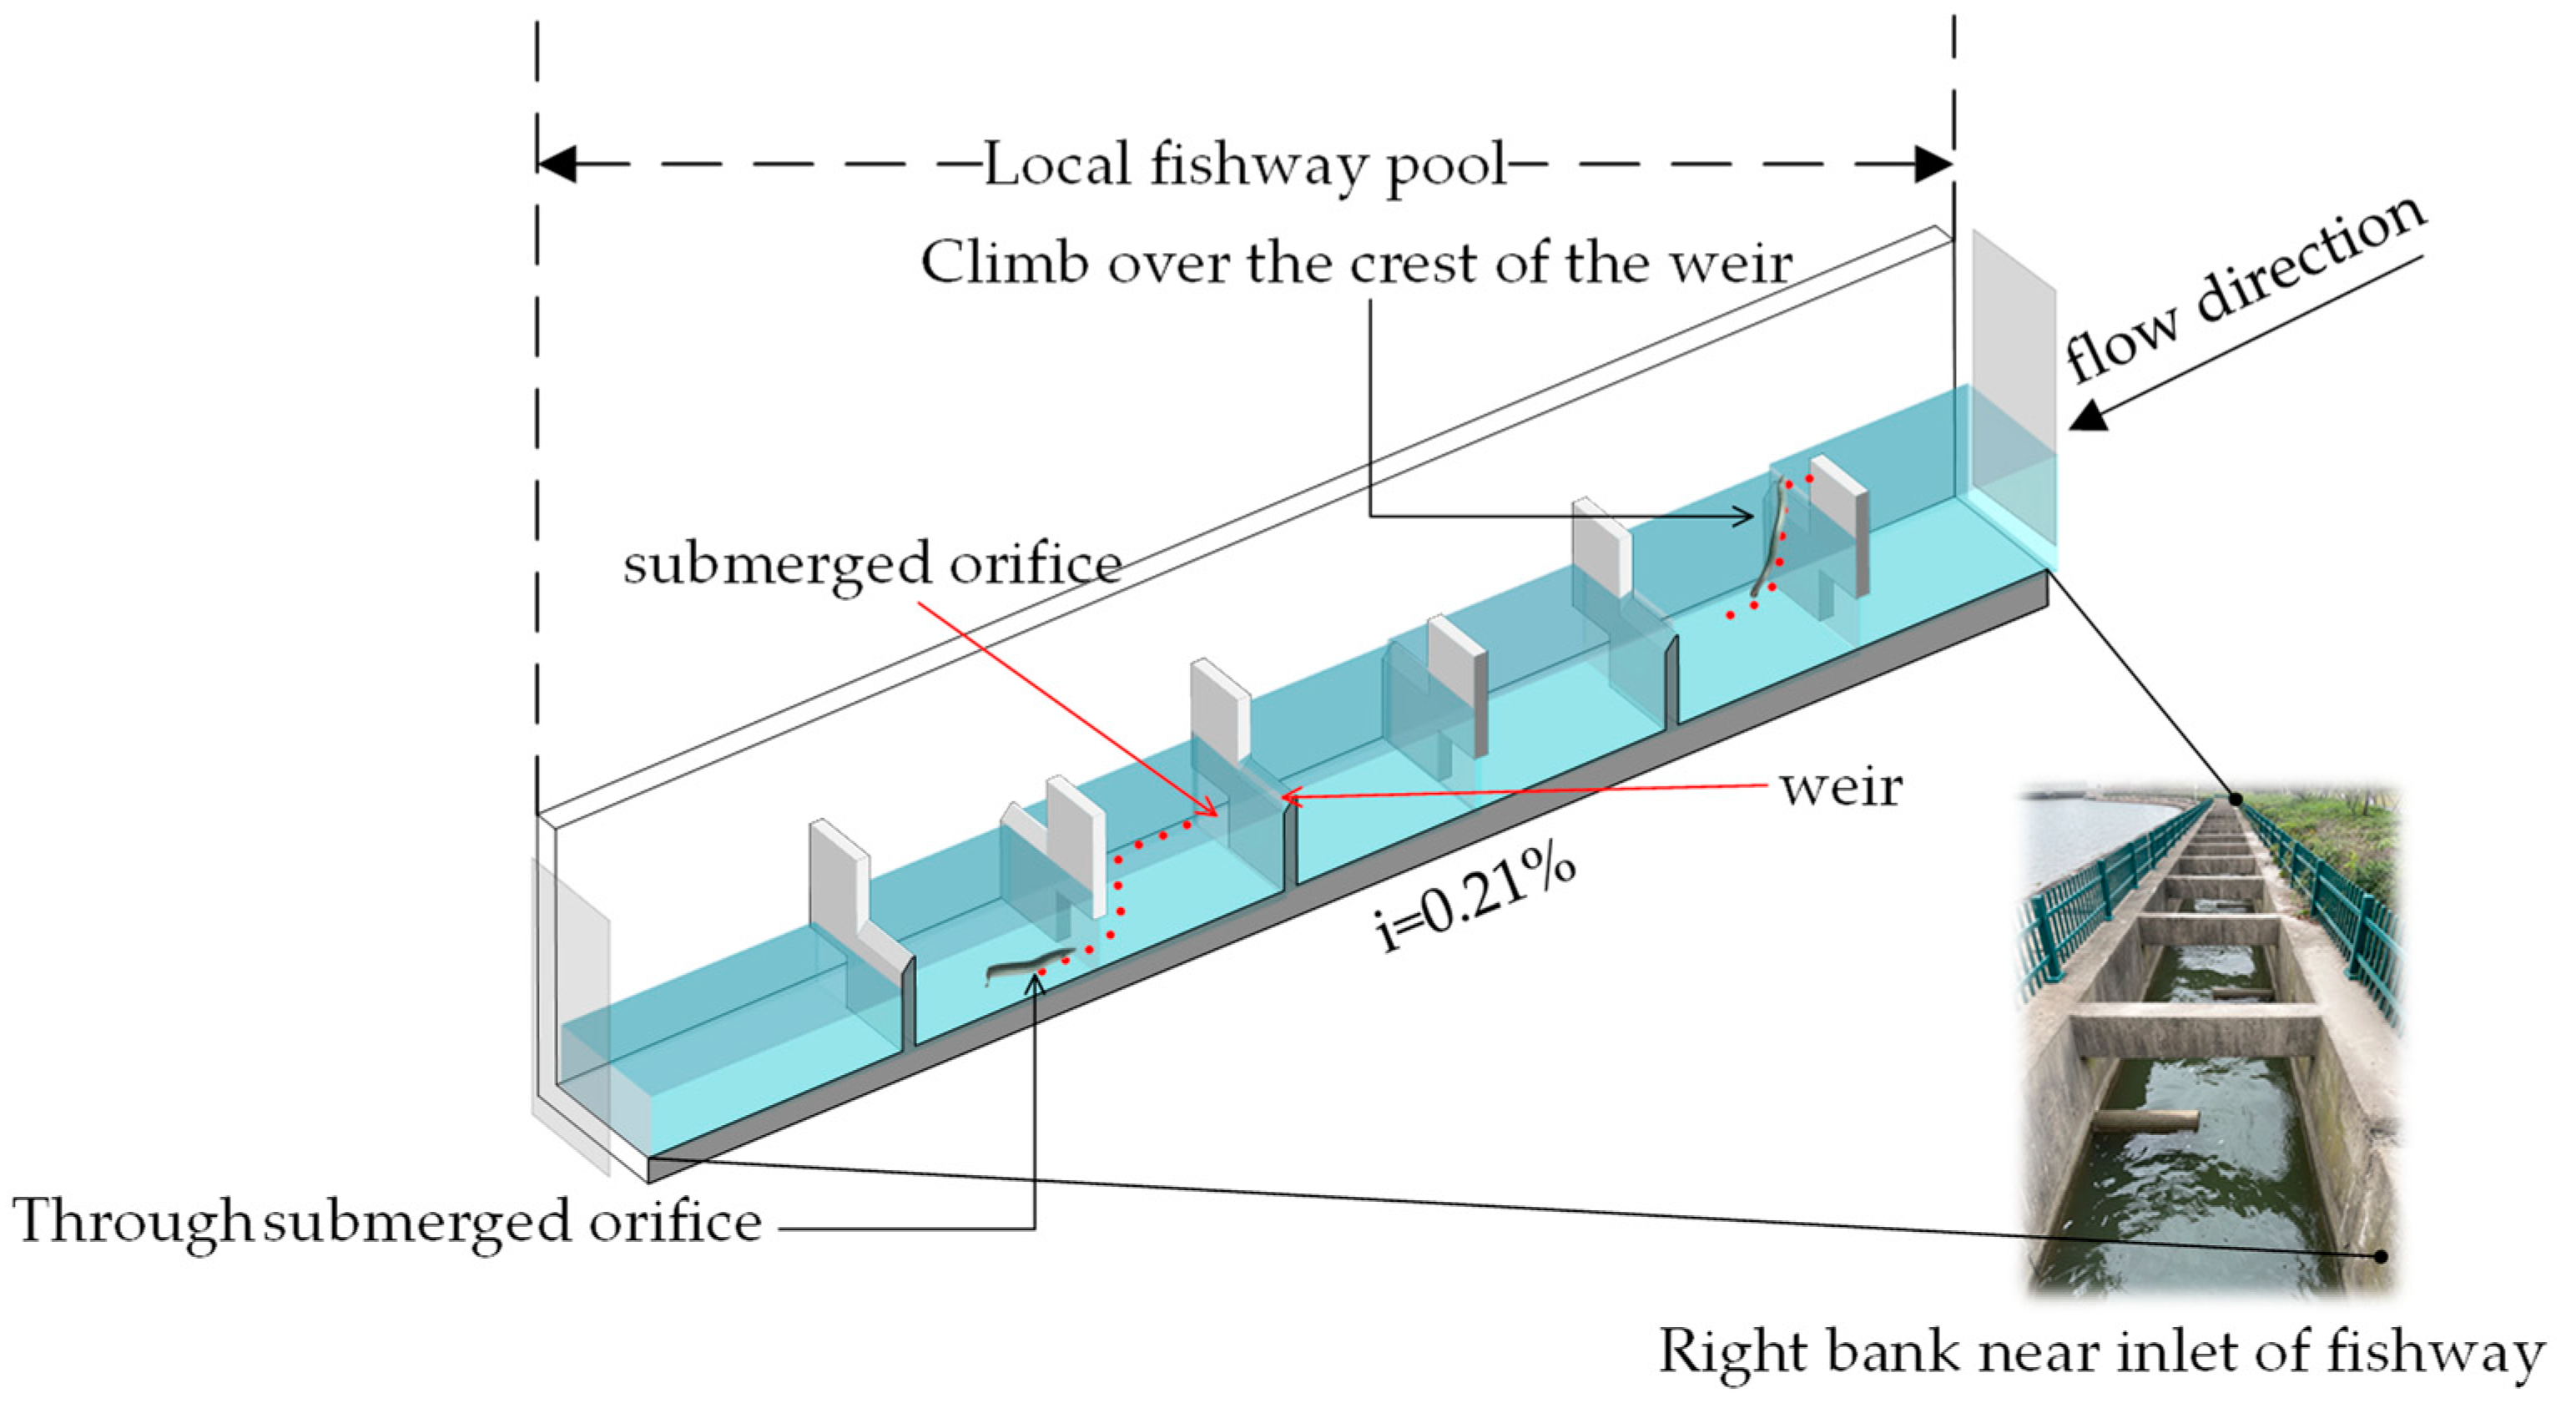
Figure 1. Design of fish passage structure and observed passage of eels at the Cao’e River sluice.
Water 15 02585 g001
Figure 2. Layout of the scaling experiment: hetero-lateral arrangement of partitions, with a total of 10 pool chambers set up and the 3* pool chamber as a representative pool for measuring flow. (a) Infrared water level meter suspended above the pool, six in total, 5 HZ; (b) infrared cameras used, four in total, two directly above the pool and two on the side; (c) pool chamber for experimental recording; (d) model partition size in m; (e) Japanese eel (yellow eel stage) used in the experiment.
Water 15 02585 g002
Figure 3. Distribution of measurement points in the plane of pool 3*. The black points are distributed at 0.2 H, 0.5 H, and 0.8 H heights; the red points indicate the measurement points at the weir and submerged holes; and the blue lines A and B are the measurement lines used to verify the accuracy of the numerical model.
Water 15 02585 g003
Figure 4. Flow measurement results of the 3* study pool. (a) Comparison between the measured and simulated values of the flow velocity of the A-line in the pool chamber area. (b) Comparison between the measured and simulated values of the flow velocity of the B-line at the top of the weir. (ce) Distribution of the plane flow field measurements at the surface layer 0.8 H, the middle layer 0.5 H, and the bottom layer 0.2 H under the working condition W1, respectively.
Water 15 02585 g004
Figure 5. Passage of eels in different body length groups and the total time of eel passage. (a) Passage of eels in different body length groups; the red line indicates the small body length group (17 eels were used randomly in each working group), and the blue line indicates the large body length group (5 eels were used in each working group). (b) Total time of eel passage, with a large extreme difference in upstream swimming time, and log10-processed.
Water 15 02585 g005
Figure 6. Three typical trajectories of the bottom passage. (a) L-type trajectory in the text eels. (b) S-type trajectory in the text eels. (c) line-type trajectory in the text eels. Between the red lines is the mainstream area, inside the blue circles is the reflux area, and the dashed lines indicate typical trajectories, from left to right: using reflux almost the entire time (L-type), using only the mainstream (line-type), and briefly using the low-speed reflux area for reflux (S-type).
Water 15 02585 g006
Figure 7. Typical behavior of eels passing the top of the weir.
Water 15 02585 g007
Figure 8. Percentages of various trajectories and corresponding upstream swimming times. (a) Percentages of trajectories collected by the 3* pool under different combinations of working tide levels. (b) The corresponding passage times of the trajectories. For the purpose of analysis, log10 was processed.
Water 15 02585 g008
Figure 9. Three-dimensional spatial distribution of the trajectory of the test eel. (a) Flow velocity clouds of sections in the long direction of each working pool. The initial and end sections on the left and right sides were taken at the middle axis of the thickness of the bulkhead (y = 0.025 m), and the sections were equally spaced with a spacing of 0.25 m. (b) Top view of the trajectory of the test eel (xy-axis). (c) Side view of the trajectory of the test eel (yz-axis). Different colors have been used to differentiate the tracks of each test fish.
Water 15 02585 g009
Figure 10. Utilization of the reflux zone by eels in each section of the pool chamber under various working conditions. (ad) refer to the utilization of the reflux zone by the test eel at working conditions W1, W2, W3 and W4, respectively.TS1 refers to eel passage utilizing the low-velocity reflux zone; TS2 refers to eel passage relying only on the mainstream to complete upstream swimming; the bottom axis number corresponds to the pool chamber number; and the rightmost column indicates the mean value of the low-velocity reflux zone utilization statistics of the test samples.
Water 15 02585 g010
Figure 11. Superimposed diagram of the trajectories and flow velocity fields of the eels in the 3* pool test. The flow velocity fields are W1, W2, W3, and W4 from left to right, and the red box in (a) is the area near the bottom hole. (ad) are the superimposed effects of the eels trajectories and background flow field cloud maps under the working condition W1, W2, W3 and W4.
Water 15 02585 g011
Figure 12. Selection of the background velocity fields by the test eels when passing through the mainstream of the bottom hole. (ad) are the eel′s choice of background flow rate for W1, W2, W3 and W4 conditions. Statistics from trajectory points in the red boxed area in Figure 12a, fitted curves obtained using multi-peak analysis, Gauss fit.
Water 15 02585 g012
Figure 13. Superposition of eel trajectories and TKE fields in the 3* pool test. The TKE fields are W1, W2, W3, and W4, from left to right. (ad) are the superimposed effects of the eels trajectories and background TKE field cloud maps under the working condition W1, W2, W3 and W4.
Water 15 02585 g013
Figure 14. (a) Average swimming speed (m/s) of the test eel in the 3* pool and (b) relationship between average swimming speed and flow rate (m3/s). (b) The scattered points in the figure are 10.1 L/s, 15.3 L/s, 20.9 L/s, and 13.5 L/s from left to right flow rate in order.
Water 15 02585 g014
Figure 15. Swimming speed (m/s) of the test eels through the 3* pool under each working condition. (ad) are the swimming speeds of each test eel under W1, W2, W3 and W4 conditions. The yellow bars indicate that the eels used belonged to the large body length group, while the dark blue bars indicate that they belonged to the small body length group. The vacancies indicate that the eels did not reach the 3* pool.
Water 15 02585 g015
Table 1. Test condition design.
GroupH1 a (m)H2 b (m)∆H c (cm)∆Z d (cm)
W10.5750.5611.50.6
W20.52551.8
W30.475103.6.
W40.5000.45051.8
Notes: a Denotes the model upstream water level; b denotes the model downstream water level; c denotes the model upstream and downstream water level difference; d and denotes the average water level difference of the bulkhead before scaling.
Table 2. Body length and weight of test eels.
Group IDL
cm
L ± SE
cm
W
g
W ± SE
cm
I26.6~39.54.480.0~119.29.8
II42.5~68.47.8131~33462.2
Notes: I—Denotes the small-bodied long yellow-phase Japanese eel; II—denotes the large-bodied long yellow-phase Japanese eel; L denotes the body length of the test eel; and W denotes the weight of the test eel.
Table 3. Passage data of test eels.
GroupNumber of SamplesPassage RateTotal Number of Turns BackTurnback RateNumber of Weir CrossingsOver-Weir Occurrence Rate
W12245.45%3284.21%210.53%
W22268.18%1531.82%312.50%
W32250.00%2575.00%1218.75%
W42254.55%2362.50%937.50%
Notes: The groups represent the working conditions in Table 1: W1, W2, W3, and W4. The turnback rate was calculated as the percentage of the eels that turned back out of the eels that swam upstream; The over-weir occurrence rate was calculated as the percentage of eels that went over the weir out of those that swam upstream.
Disclaimer/Publisher’s Note: The statements, opinions and data contained in all publications are solely those of the individual author(s) and contributor(s) and not of MDPI and/or the editor(s). MDPI and/or the editor(s) disclaim responsibility for any injury to people or property resulting from any ideas, methods, instructions or products referred to in the content.