Article

Land–Water Transition Zone Monitoring in Support of Drinking Water Production

by
Afroditi Kita
1,*,
Ioannis Manakos
1,*,
Sofia Papadopoulou
1,
Ioannis Lioumbas
2,
Leonidas Alagialoglou
1,
Matina Katsiapi
2 and
Aikaterini Christodoulou
2
1
Centre for Research and Technology Hellas, Information Technologies Institute, 57001 Thessaloniki, Greece
2
Thessaloniki Water Supply & Sewerage Co. S.A., 54622 Thessaloniki, Greece
*
Authors to whom correspondence should be addressed.
Water 2023, 15(14), 2596; https://doi.org/10.3390/w15142596
Submission received: 10 June 2023 / Revised: 8 July 2023 / Accepted: 13 July 2023 / Published: 17 July 2023

Abstract

:
Water utilities often use extended open surface water reservoirs to produce drinking water. Biotic and abiotic factors influence the water level, leading to alterations in the concentration of the dissolved substances (in cases of flood or drought), entry of new pollutants (in case of flooding) or reduction in the availability and inflow speed of water to the treatment plant (in case of drought). Spaceborne image analysis is considered a significant surrogate for establishing a dense network of sensors to monitor changes. In this study, renowned inundation mapping techniques are examined for their adaptability to the inland water reservoirs’ conditions. The results, from the Polyphytos open surface water reservoir in northern Greece, showcase the transferability of the workflows with overall accuracies exceeding—in cases—98%. Hydroperiod maps generated for the area of interest, along with variations in the water surface extent over a four-year period, provide valuable insights into the reservoir’s hydrological patterns. Comparison among different inundation mapping techniques for the surface water extent and water level reveal challenges and limitations, which are related to the spatial resolution, the data take frequency and the influence of the landscape synthesis beyond the water reservoir boundaries.

1. Introduction

The transition zone between land and water is an important area to consider for water utilities, as it can influence the quality and quantity of water resources. The extent of the water can provide insight into the volume of water resources available, which can be affected by changes in climate and management practices. Additionally, the increase or decrease in the water level can be related to eutrophication possibly leading to toxic concentrations of dissolved material in the water and can also be affected by sudden flood events that may bring along debris from the land [1]. Thus, it is crucial both in time and space to effectively assess the quality of water resources and ensure regular and accurate monitoring of the surface water extent (as proxy to the water volume). There are several methods that can be used to detect and monitor the land–water transition zone fluctuation, including remote sensing, field observations and geospatial analysis.
Mapping the open surface water reservoirs from spaceborne multispectral earth observation data can be achieved by leveraging the physical properties of water’s reflection across the Visible (VIS) to Short-wave Infrared (SWIR) ranges of the electromagnetic spectrum. In this context, the Normalized Difference Water Index (NDWI) [2], Modified NDWI [3] and Automated Water Extraction Index (AWEI) [4] have been extensively used for the delineation of water bodies. For example, Acharya et al. [5] utilized Landsat 8 imagery of eastern Nepal to calculate the NDWI, MNDWI, Normalized Difference Vegetation Index (NDVI) [6] and AWEI, and evaluated their performance across various surface water bodies with distinct characteristics. In Quang et al. [7], NDWI, MNDWI and the Water Frequency Index (WFI) [8] calculated from Sentinel-2 (S2) and Landsat imagery were utilized to estimate the surface water extent in Vietnam’s Quang Nam province from 1990 to 2020 and support monitoring of the water level, river morphological changes and flood extent across the years. In the study by Schwatke et al. [9], optical satellite data (i.e., Landsat and S2) were employed for the extraction of the water body surface with the use of five indexes and automatic thresholding.
Beyond the multispectral applications, the backscattering values and patterns in radar imagery can provide valuable information for the detection of water-covered areas. Smooth water surfaces return weaker radar signals in contrast to rough surfaces, which exhibit high backscattering values and usually represent land features. For example, Bourgeau-Chavez et al. [10] used Synthetic Aperture Radar (SAR) satellite imagery to remotely detect, monitor and map regional scale spatial and temporal changes in wetlands. It was found that SAR imagery can be successfully used to create inundation maps of relative soil moisture and flooding in non-woody wetlands. A time-series change detection approach based on SAR polarimetry (S1-omnibus) was examined in [11]. The study investigated the feasibility of methodologies based on SAR data to capture the temporal and spatial variations and reveal patterns in dynamically changing ecosystems, such as wetlands. SAR imagery was also used in [12] to register variations in the intra-monthly water surface extent at Poyang Lake during the wet and dry periods. In [13], Binh Pham-Duc et al. explored the variations in the surface water extent in NUi Coc Lake, Vietnam with S1 imagery as well. The results were compared with the water extent estimated by multispectral S2 and ancillary data, available from the Global Surface Water (GSW) Dataset [14].
Multiple studies have attempted to combine radar and multispectral data with the aim of obtaining comprehensive information about surface water dynamics in inland water systems by leveraging the advantages of both information sources. In [15], Binh Pham-Duc et al. calculated monthly variations in the surface water volume of Thac Mo hydroelectric reservoir, located in Vietnam, by extracting the surface water extent from S1 observations and the water level from Jason-3 altimetry data. In a similar context, Weidong Zhu et al. [16] proposed a new method based on multisource remote sensing data to calculate the changes in water level, surface area and storage capacity of Ngoring Lake, located in Tibetan Plateau in Qinghai Province. In [9], Schwatke et al. also used satellite altimetry data to extract the water level, and along with in situ water level measurements, they evaluated the performance of the inundation maps generated with multispectral satellite data. In addition, the article by Sadiq I. Khan et al. [17] discusses how satellite remote sensing data can be combined with hydrologic modeling to map inundation in the Lake Victoria basin. The study aims to show the potential of this approach for predicting hydrologic conditions for basins lacking in situ hydrological data.
Decision support systems for water utilities can use the information obtained from the aforementioned methods to help formulate informed water management decisions. For example, by understanding the water extent changes, utilities can better manage their water resources and identify areas or forecast cases, where additional treatment or conservation efforts may be needed. Moreover, areas where frequent land–water transition zone temporal changes occur may indicate potential issues such as erosion or sedimentation that need to be addressed.
In this study, existing inundation mapping methods [18,19,20] were applied over the area of Polyphytos reservoir and examined for their credibility towards covering the needs of the water utility (EYATH), which exploits the water resources for drinking water production and supply of the city of Thessaloniki (Greece). The best-performing ones were adapted and integrated into the Water Quality emergency Monitoring Service (WQeMS) platform for the needs of the LWTZ change detection service. The service was developed to generate maps indicating the transition zone between two dates or for a continuous period (i.e., hydroperiod maps). Furthermore, hydroperiod maps and variations in the annual water surface extent are included in the results to explore the dynamics of the hydrological cycles within the reservoir. Comparison tests were performed against inundation maps originating from the widely used NDWI. Moreover, the correlation between the surface water extent and water utility estimated water level measurements is examined for the capacity of the latter to derive credible proxy results, as this is a common practice used by EYATH water utility.

2. Materials and Methods

2.1. Study Area

Polyphytos’s open surface water reservoir (Figure 1) is located in the course of the Aliakmon River in West Macedonia, Northern Greece (Kozani province), and covers a surface area of 75 km2. It was created in 1975, following the construction of a dam on the Aliakmon River, near Polyphytos village. The maximum length of the reservoir is 31 km, and the maximum width is 2.5 km. It is the largest of the five reservoirs constructed along the river with a drainage area of 5630 km2, receiving water from surface runoff and various torrents.
Polyphytos is used for hydroelectric energy production, irrigation, and since 2003, as a drinking water supply for the second largest city in Greece, the city of Thessaloniki (~1,050,000 citizens). Approximately 145,000 m3 of surface water is withdrawn daily from the Polyphytos Reservoir as inflow to Thessaloniki’s Drinking Water Treatment Plant (TDWTP).
The area of Polyphytos experiences a continental climate, characterized by cold winters and mild summers. The region does not receive exceptionally high rainfall, but previous studies [21] showcased that precipitation levels do not significantly decrease during the summer months. The period between June and September is considered dry due to the relatively low average rainfall depth. Conversely, the months from October to May exhibit the highest levels of precipitation.
The water inflow into the reservoir is dominated by the management of the Aliakmon dam upstream, and the Polyphytos dam downstream, while surface runoff from the drainage area, rainfall and groundwater recharge are contributing as well. The transition zone between land and water is determined by the reservoir’s morphological and hydrodynamic characteristics [22]. In the Polyphytos reservoir, EYATH designated three subregions of interest, i.e., Region A, Region B and Region C (Figure 2a). Region A is situated near the deltaic area of the Aliakmon River and presents frequent land–water changes in shallow waters (Figure 2b), while Regions B and C represent the main water-covered areas inside Polyphytos over deep and deeper areas, respectively.

2.2. Dataset

A total of 135 atmospherically corrected S2 Level-2A (L2A) products of Polyphytos reservoir were downloaded from the Copernicus European Space Agency (ESA) hub [23] between 2017 and 2021 (tile ID: T34TEK). Table 1 sums up the dates of the products used in this study for the evaluation of the methodologies, the hydroperiod estimation, as well as the water surface extent calculation.
S1 data are additionally acquired to increase the frequency of the monitoring capacity. S1 Ground Range Detected (GRD) data were retrieved from the Copernicus Open Access Hub on the dates provided in Table 2. Dates in bold indicate the specific dates, on which an inundation map was generated according to [20]. Following the preprocessing steps as described in [20], the inundation mapping was performed by using a swarm of S1 products before and after the target date and S2-derived inundation maps.

2.3. Reference Data

Acquiring precise ground truth or reference data, required for properly assessing remote sensing accuracy, can be a challenging task [24]. Previous studies [18,19,25] employed different reference data sources to verify the validity of the classification methods discussed in this study. For instance, in [18], Landsat imagery was utilized as a reference, while [25] incorporated in situ data from water level monitoring stations along with the Scene Classification Layer (SCL) from S2. The utilization of very high-resolution (VHR) satellite imagery is progressively expanding, particularly for generating reference datasets through visual interpretation or on-screen digitization [26]. For instance, the utilization of satellite imagery from Planet Labs [27] featuring a spatial resolution of 3 m and a daily repeat-pass time can enhance the validation process and provide valuable support in mapping the dynamic changes in the water extent of open surface water reservoirs.
In this study, Google Earth (GE) ProTM 7.3.3 (Google Inc., Menlo Park, CA, USA) is utilized, an open-source tool that offers visual access to very high-resolution (VHR) satellite imagery. GE Pro has been widely employed in traditional land use/cover mapping due to its capability to provide detailed visual information [28]. Two to four VHR images for each sub-region within the Polyphytos reservoir with matching dates were utilized, as indicated in Table 3. Furthermore, official bathymetric maps of the Polyphytos open surface water reservoir were obtained from the Public Power Corporation of Greece to verify and fine-tune—where applicable—the delineated boundaries.
The reliability of the inferred ground reference maps was further assessed by overlaying them with seven additionally acquired WorldView-2 (WV2) satellite imagery subsets [29]. These were registered over targeted Areas of Interest (AOI) at locations where the boundary between land and water in the Google Earth (GE) imagery was not easily distinguishable through on-screen digitizing. Specifically, Ortho-Ready Standard–Level 2A (ORStandard 2A) products of panchromatic imagery were utilized with a resolution of 0.46 m and multispectral imagery with 8 bands and a resolution of 1.84 m. The AOIs (A1–A4, B1, C1–C2) are located within the sub-regions A, B, and C of Polyphytos open surface water reservoir and each one covers 1 km2 (Table 4).
The land–water boundary was extracted from each available image through on-screen digitizing by employing the GE Pro tool or GIS software, and the information was exported as a vector layer. The vector layers were then converted into raster format to conduct a pixel-wise comparison between the predicted and reference data. A buffer zone surrounding the boundary was selected and ensured that the number of assessed land pixels does not exceed three times the number of water pixels so that enough water neighboring land features (e.g., dark or wet vegetation, manmade constructions, shadows, inclined regions, various land covers) are taken into consideration, while overfitting to land in comparison with water would not bias the result. It is worth noting that the buffer polygons may vary for certain dates for the same region, depending on the availability of images from GE imagery. In addition, the polygons were deliberately chosen to cover a broader extent of the transition zones. In Figure 3a, examples of the buffer polygons for the Regions A, B and C are illustrated. With respect to the evaluation incorporating the AOIs from MAXAR (presented in Table 4), the number of land and water pixels is almost similar and the pixel-wise comparison is conducted specifically within the whole extent of these AOIs, which are depicted in Figure 3b.

2.4. Methods

2.4.1. Inundation Mapping

For the discrimination of the inundated area from land at a specific date, S2 data were initially employed following [18]. The approach (named as WaterMask) detects automatic thresholds on the SWIR band and on a Modified-Normalized Difference Vegetation Index (MNDVI) and combines them in a meaningful way based on a knowledge base coming out of an iterative trial and error process. As a first step, an initial threshold Tinit, corresponding to the first deep valley of the SWIR histogram, separates coarsely inundated from non-inundated pixels. Subsequently, the S2 image is segmented into non-overlapping segments. Expanding patches are set around the segments’ centroids with a high percentage of inundated pixels. The median of the “splitting” thresholds of all patches is the optimal threshold per segment. The final threshold Tfinal is estimated as the median of optimal thresholds (Figure S1, Supplementary Material). The method has been successfully applied to different types of wetlands in the Doñana Biosphere Reserve study area in southwest Spain. It was further enhanced in [19] by introducing different alternatives regarding the input band (or band combinations) and the algorithm used for the splitting thresholds calculation both in the same area in Spain and in Camargue Biosphere Reserve in France. In particular, the input S2 bands investigated were the following: (i) SWIR-1 band (Band 11), which is denoted as Alt1, (ii) a product (per pixel multiplication) of SWIR-2 (Band 12) and NIR (Band 8A), which is denoted as Alt2 and (iii) a product of SWIR-1 (Band 11) and NIR (Band 8A), which is denoted as Alt3. To estimate the optimal threshold, the Minimum Cross Entropy Thresholding (MCET) [30] algorithm, the OTSU’s algorithm [31], and the average between those were examined. Results obtained additionally in Kerkini Lake [25] have consistently demonstrated the high accuracy and generalization capacity of the methodology.
In order to overcome unfavorable atmospheric conditions for multispectral earth observation from space and increase the mapping frequency capability, this study adopted the fusion method presented by Manakos et al. [20] for the creation of inundation maps by using information from both S1 data and S2 map products. A pixel-centric approach is followed, which exploited the varying backscatter values of each pixel through a time series of Sentinel-1 images to train local Random Forest classification models per 3 × 3 pixels using as reference S2 derived inundation maps, and classified each pixel in the target S1 image (Figure S2, Supplementary Material). Results revealed high rates of accuracy even for a continuous 30-day cloud-covered period.

2.4.2. Hydroperiod Estimation

Sequentially produced inundation maps were input into the HydroMap module [32] to generate a hydroperiod map. The value of each pixel represents there the duration (in days) of the open surface water presence within a specified time range. The interpolation method employed considered a given pair of dates separated by n days. If a pixel is observed to be inundated on both dates, it is considered to be inundated for a period of n days. If a pixel is not inundated on both dates, it is assumed to be inundated for a period of n/2 days. By accumulating the inundation maps over the desired period, the hydroperiod map records the total number of days each pixel remains inundated.

2.4.3. Inundation Mapping with NDWI

For comparison reasons, the widely applicable inundation mapping via strict thresholding of the NDWI [3] histogram was applied. The use of the Green (B3) and NIR (B8) bands of S2 in NDWI offers the advantage of utilizing solely input bands with 10 m spatial resolution. A strict threshold of TNDWI = 0.2 was identified through visual interpretation following an iterative histogram thresholding trial and error analysis across the series of images. Pixels (p), which show NDWI values greater than this threshold (NDWI(p) > TNDWI), were considered covered with water.

2.4.4. Inundation Mapping in Support of Water-Level Data Extraction

Business-as-usual practices for the delineation of the water extent boundary line rely on aligning time-stamped satellite imagery with bathymetric maps of the Polyphytos reservoir. This is a low computational cost operationally used practice, which this study examined for its performance. A Spearman correlation was applied between the water extent derived from WaterMask (in km2) and the water level (in altitude m) derived from the suggested practice since the relationship between the two variables is considered to be monotonic [13,16].
The water level derivation practice is specifically designed to monitor water level variations in the Polyphytos Reservoir over a predetermined interval. It leverages on the visual interpretation of Landsat 8–9 L2 satellite pseudocolor imagery (bands 5, 4 and 3) with the incorporation of bathymetric data. The utilized bands enhance the differentiation between terrestrial and aquatic areas within the Polyphytos reservoir. A time-sensitive repository of satellite images is generated from [33] and water level readings were retrieved at distinct regions in the reservoir, where bathymetric isolines exhibit clear sequential patterns (a continuously smoothly descending relief). This feature is particularly evident in the shallower reservoir sections (e.g., in the south region of the reservoir). The increased inter-isoline distances enable clearer delineation. In circumstances where the coastline is devoid of an isoline, linear interpolation is executed between the two encompassing bathymetric lines.

3. Results

3.1. Inundation Maps Derivation from Multispectral Data

Inundation maps were generated for all the different alternatives (see Section 2.4.1) with the aim to explore the behavior of different S2 input bands and thresholding approaches across the whole Polyphytos area, i.e., the 522.4 km2 visible in the Figure 3 map. The predicted inundation maps were juxtaposed against the reference layers, i.e., the Regions A, B and C polygons and the AOIs visible in Figure 3. Details about the schematic flow diagram of the validation procedure can be found in Figure S3 (Supplementary Material). Overall Accuracy (OA), Producers Accuracy (PA), User’s Accuracy (UA) and Kappa Coefficient (Kappa) for all the nine alternatives are demonstrated in relation to the GE reference layers (Table 5).
The findings demonstrate that all the methodologies exhibit a high level of accuracy in distinguishing water and land. However, focusing on the thresholding methodology, the MCET algorithm consistently yields a higher Kappa value for every input alternative (i.e., Alt1, Alt2, Alt3). Moreover, MCET outperforms in terms of UA, which means that the False Positive (FP) values are less in comparison with the rest of the approaches. The OTSU algorithm tends to overestimate the water class and results not only in a higher water extent prediction but also in FP inside the land area. An example is given in Figure 4, where the predicted maps from the different alternatives, for the date 31 August 2020, and for A and B Regions are presented.
Regardless of the employed thresholding methodologies (i.e., MCET, OTSU or Average), and in terms of UA, it is noticed that Alt3 performs better than Alt2, while Alt1 outperforms both. It is also worth mentioning that the utilization of Alt2 combined with the OTSU algorithm yields a UA value of 82.22%, while Alt1 and OTSU algorithm results in a UA value of 95.56%. This indicates that the input band, which determines the initial threshold, can significantly influence the performance when the OTSU algorithm is used. On the other hand, the MCET algorithm demonstrates consistent results across the different alternatives (i.e., input bands). For example, the UA values for Alt1-MCET and Alt2-MCET are 98.98% and 97.07%, respectively. Nonetheless, it is important to note that the use of Alt1-MCET demonstrates lower PA, supporting the previous assumption that an alternative combination, such as OTSU-Alt1, which tends to overestimate water pixels, may lead to a relatively small number of False Negative pixels. Similar outcomes regarding the tendency of some of the approaches to be more sensitive in water prediction have been outlined in [19]. In total, an overall accuracy of 98.8% and a Kappa coefficient of 0.974 were reported for Alt1-MCET in Polyphytos with the use of reference layers created by GE Pro images.
The previous procedure illustrated that the water body can be successfully mapped with minimal erroneous predictions beyond the expected water-covered area. At this point, the attention is directed towards the transition areas (i.e., Region A), where distinguishing between water and land becomes quite challenging. This difficulty arises due to the presence of shallow and muddy waters, which can result in ambiguity between the two classes. To gain a deeper understanding of these conditions, the results obtained by Alt1-MCET for each region and date are presented in Table 6. Region A exhibits the lowest performance across all metrics compared to Regions B and C. Specifically, for the dates 31 August 2020 and 17 October 2019, Alt1-MCET’s lowest values for PA are reported. Although this indicates that the methodology is challenged more in accurately classifying the pixels in Region A, the metric values are still high.
Throughout, the analysis areas are identified, which have demonstrated a higher mapping ambiguity. In this context, additional reference layers were utilized from WV-2 images, which were juxtaposed with the inundation maps. For comparison reasons, all layers (produced and validation) were clipped in the same areas as encompassed by the AOIs extracted from the images of Maxar Technologies (as described in Table 4). PA, UA and Kappa Coefficient for the same areas and dates using (i) the reference layer from Maxar, and (ii) the reference layer from GE are provided in Table 7.
According to the results in Table 7, the various alternatives perform similarly, i.e., the ones exhibiting the highest performance with the Maxar reference layer, showcase the highest performance with the GE layer as well, and so on. Additionally, it is noticeable that the layer with GE exhibits slightly higher values across all metrics. It is also worth noting that ALT1-MCET achieves the highest UA using the layers from either MAXAR Technologies or GE. Nonetheless, the approach seems to miss pixels in the boundary area, probably due to the presence of mixed signals, leading to an underestimation of the water border. For this study area, ALT1-MCET is selected as the preferred method, considering the priority of limiting false positive (FP) pixels in the wider region. It is worth noting that all three input bands exhibit comparable performance and can be effectively used in landscapes similar to Polyphytos.

3.2. Inundation Maps Derivation from S1 and S2 Fused Data

This paragraph includes the results obtained after evaluating the performance of the inundation maps, produced by the fusion of S1 data with S2 Alt1-MCET map products in Regions A and B of the Polyphytos reservoir. Details about the workflow of the pre-processing and the validation procedure can be found in Figures S4 and S5, respectively (Supplementary Material). The reference layers, which were used for the validation, comprised the following:
  • Four inundation maps created from S2 imagery.
  • An on-screen digitized layer from GE Pro, namely the one on 16 October 2019.
The accuracy of 30 inundation maps (6 maps per target date), generated with the use of S1 imagery was examined. An important description and performance determination feature was the mean day difference (mdd), which is calculated by the mean difference between the two S2 reference inundation maps and the target date. Figure 5 shows the variation of the Kappa coefficient for different mdd values across each target date. In most cases, the consistently decreasing Kappa values indicate changes in the landscape towards a consistent flooding or a consistent water withdrawal direction in the time scale.
The sharper decrease at higher mdd values, e.g., on 16 October 2019, is mainly due to inundation fluctuations in Region A, i.e., the shallow water transition area of Rymnio between the Aliakmonas river and the Polyphytos reservoir. In this area, the water cover dynamics provoke inundation regime changes frequently, and the pixel-based random forest classifiers fail consequently to make predictions for dates that have a mdd of more than 30 days. However, a Kappa coefficient of over 0.95 for a mdd up to 25 is an excellent result (Figure 6). This is in line with the findings of [20].

3.3. Hydroperiod Estimation

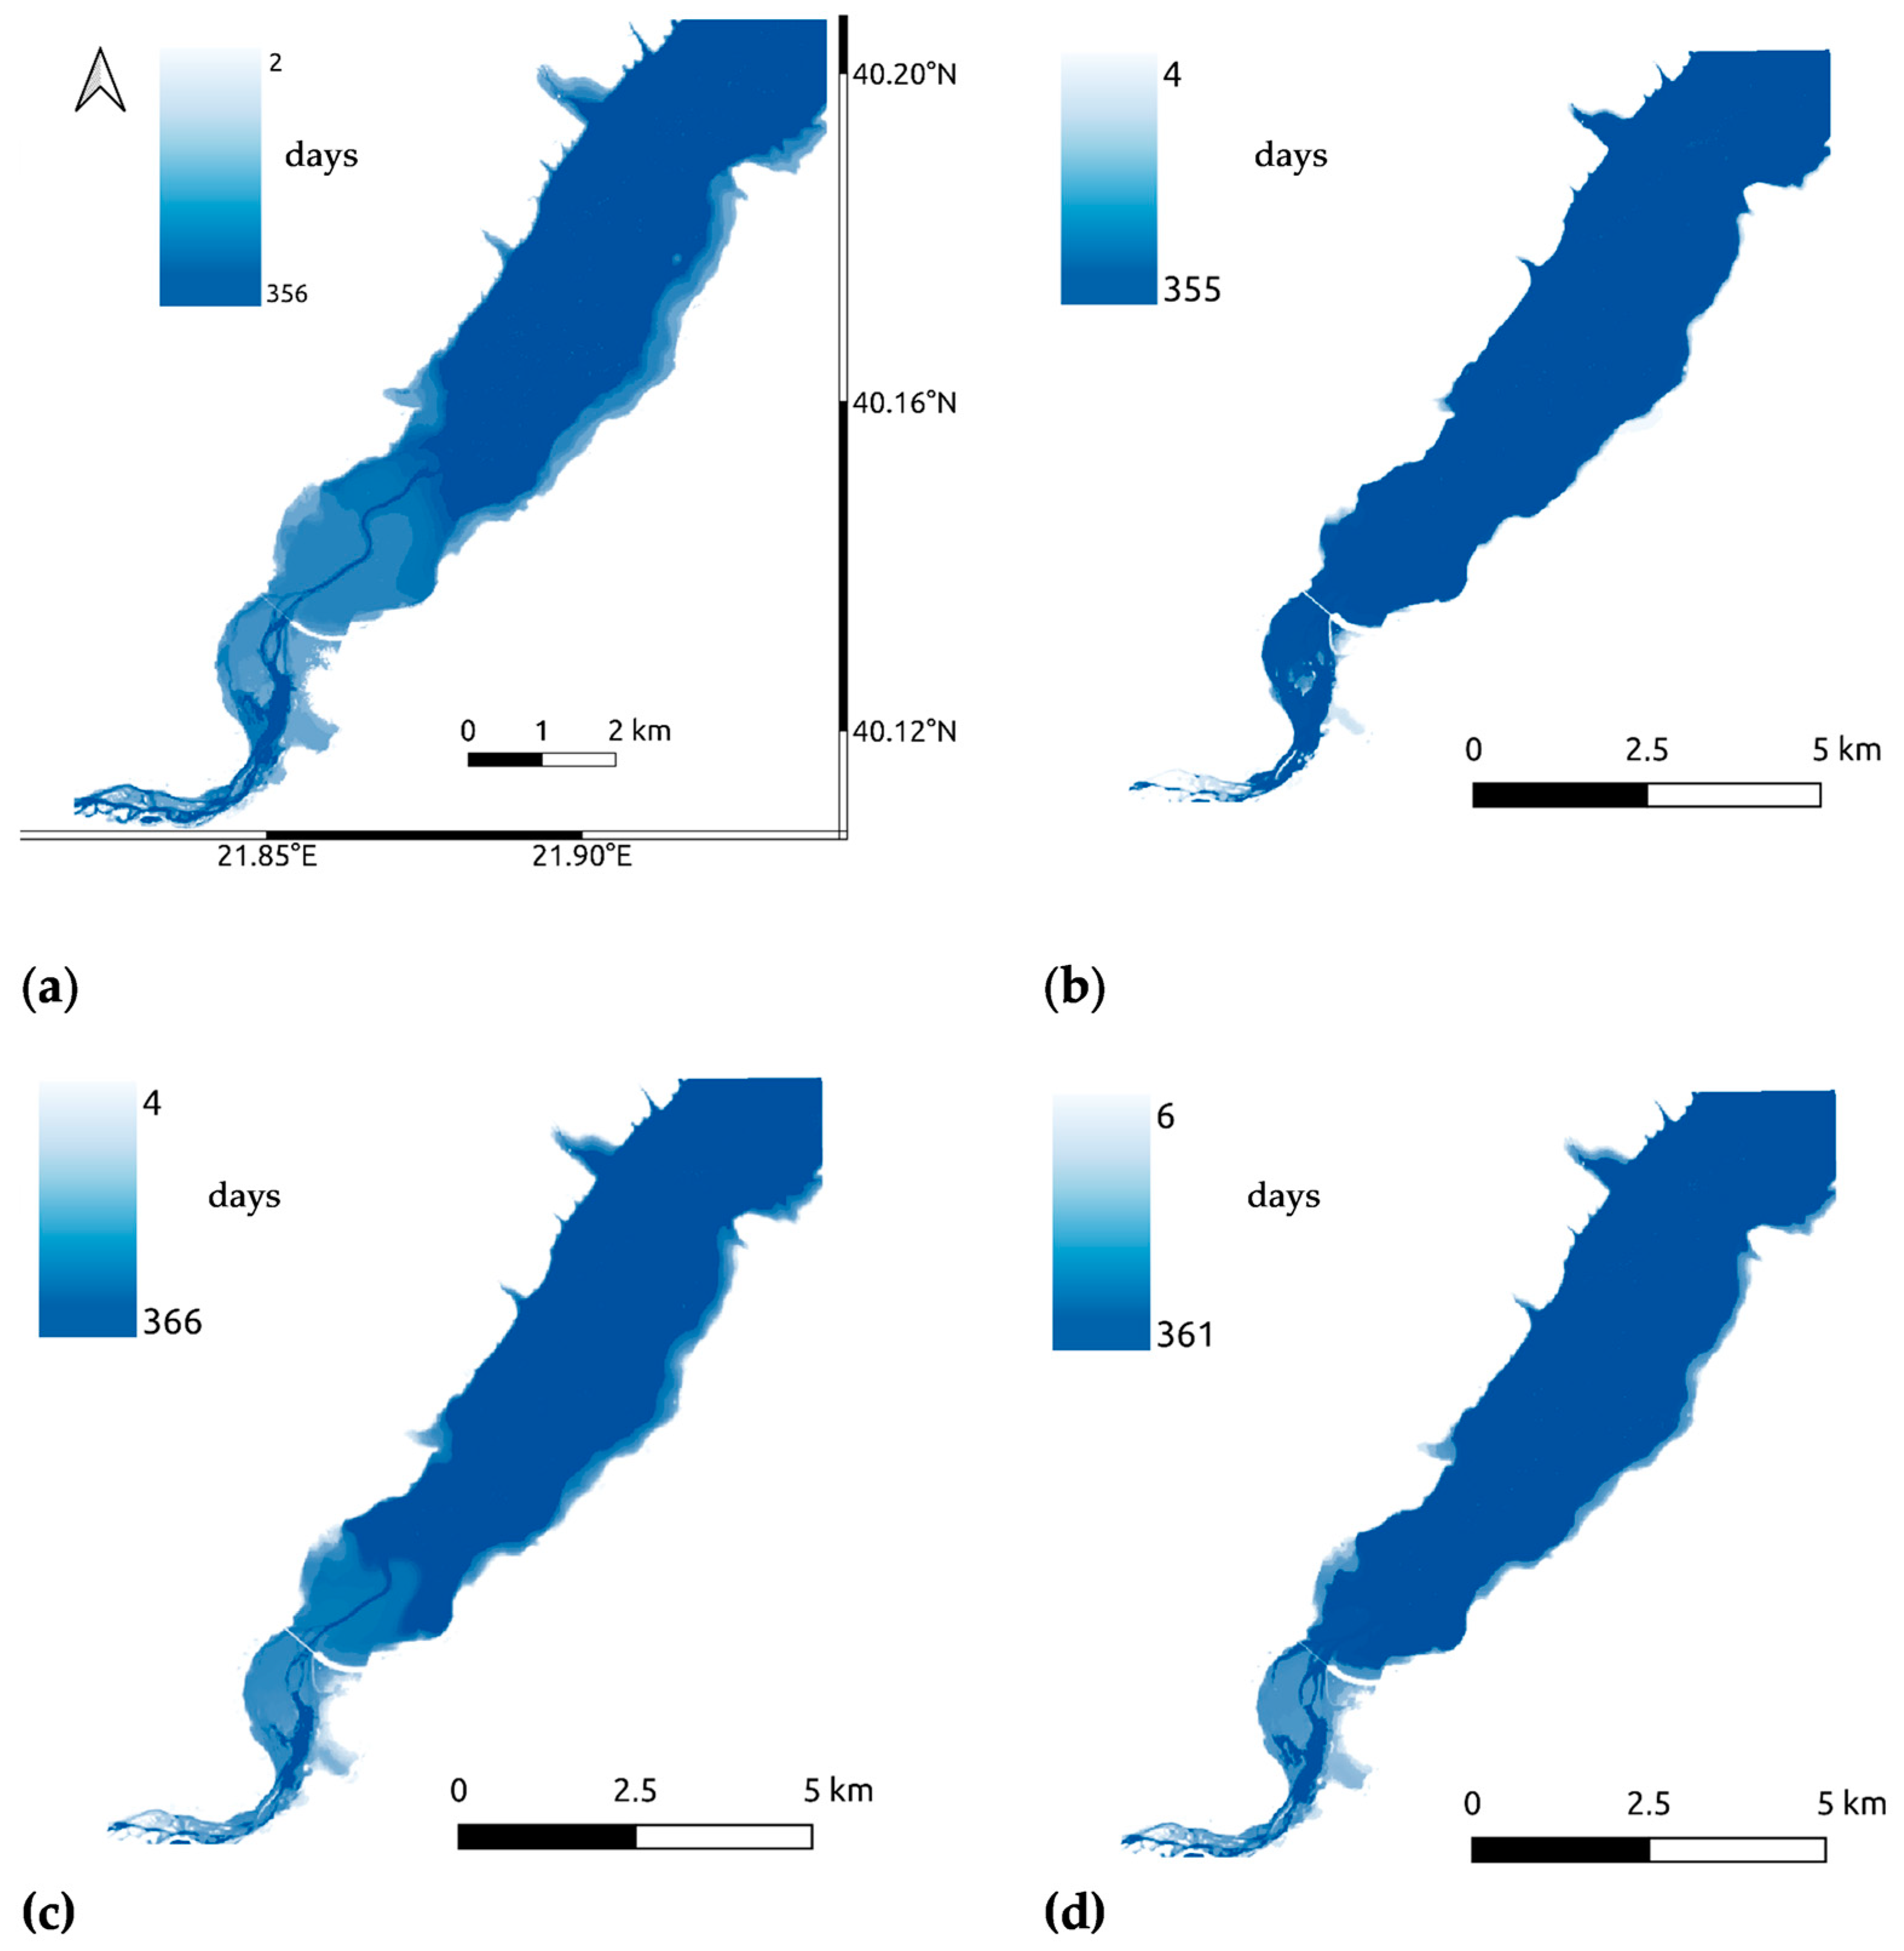
Annual hydroperiod maps were estimated by utilizing the generated inundation maps from S2 L2A products included in Table 1. These maps provide information about the changes in the transition zone and can reveal annual patterns. In Figure 7, hydroperiod maps are demonstrated, covering the period from September 2017 to August 2021. Throughout the months, the boundary between seasonal and permanent water remains visible, allowing the detection of areas, where the water gradually recedes. Notably, during the period from September 2017 to August 2018, the extent of permanent water, representing days with continuous inundation, reaches its lowest value compared to other years. In contrast, from September 2018 to August 2019, the permanent water covers the area where water typically recedes. These results may showcase varying management practices across the dam series of Aliakmon and/or the effect of drier or more humid annual cycles.
Time series analysis of the water surface extent is presented in Figure 8. Upon examining the values specifically for the period of autumn in each year, it is evident that in autumn 2017 the lowest water surface extent was recorded (47.7 km2 on 26 October), possibly indicating a relatively drier period. On the contrary, during the autumn of 2018, the highest values of the water surface extent are observed (58.7 km2 on 21 October), suggesting a period of increased water coverage in the reservoir.

3.4. Results Comparison with the NDWI

The NDWI [2] was calculated to provide a comparative assessment of advantages and limitations in accurately extracting the water surface extent (Figure S6, Supplementary Material). The Pearson correlation coefficient was estimated for 110 water extent values over a four-year period. The results, presented in Figure 9, indicate a good agreement between the methodologies. However, the presence of outliers (labeled as A–E) indicates some inconsistency. In the following paragraphs, these cases are explained with the aim of revealing possible causes that affect the methodologies in accurately extracting the water surface extent of the reservoir across varying environmental contexts.
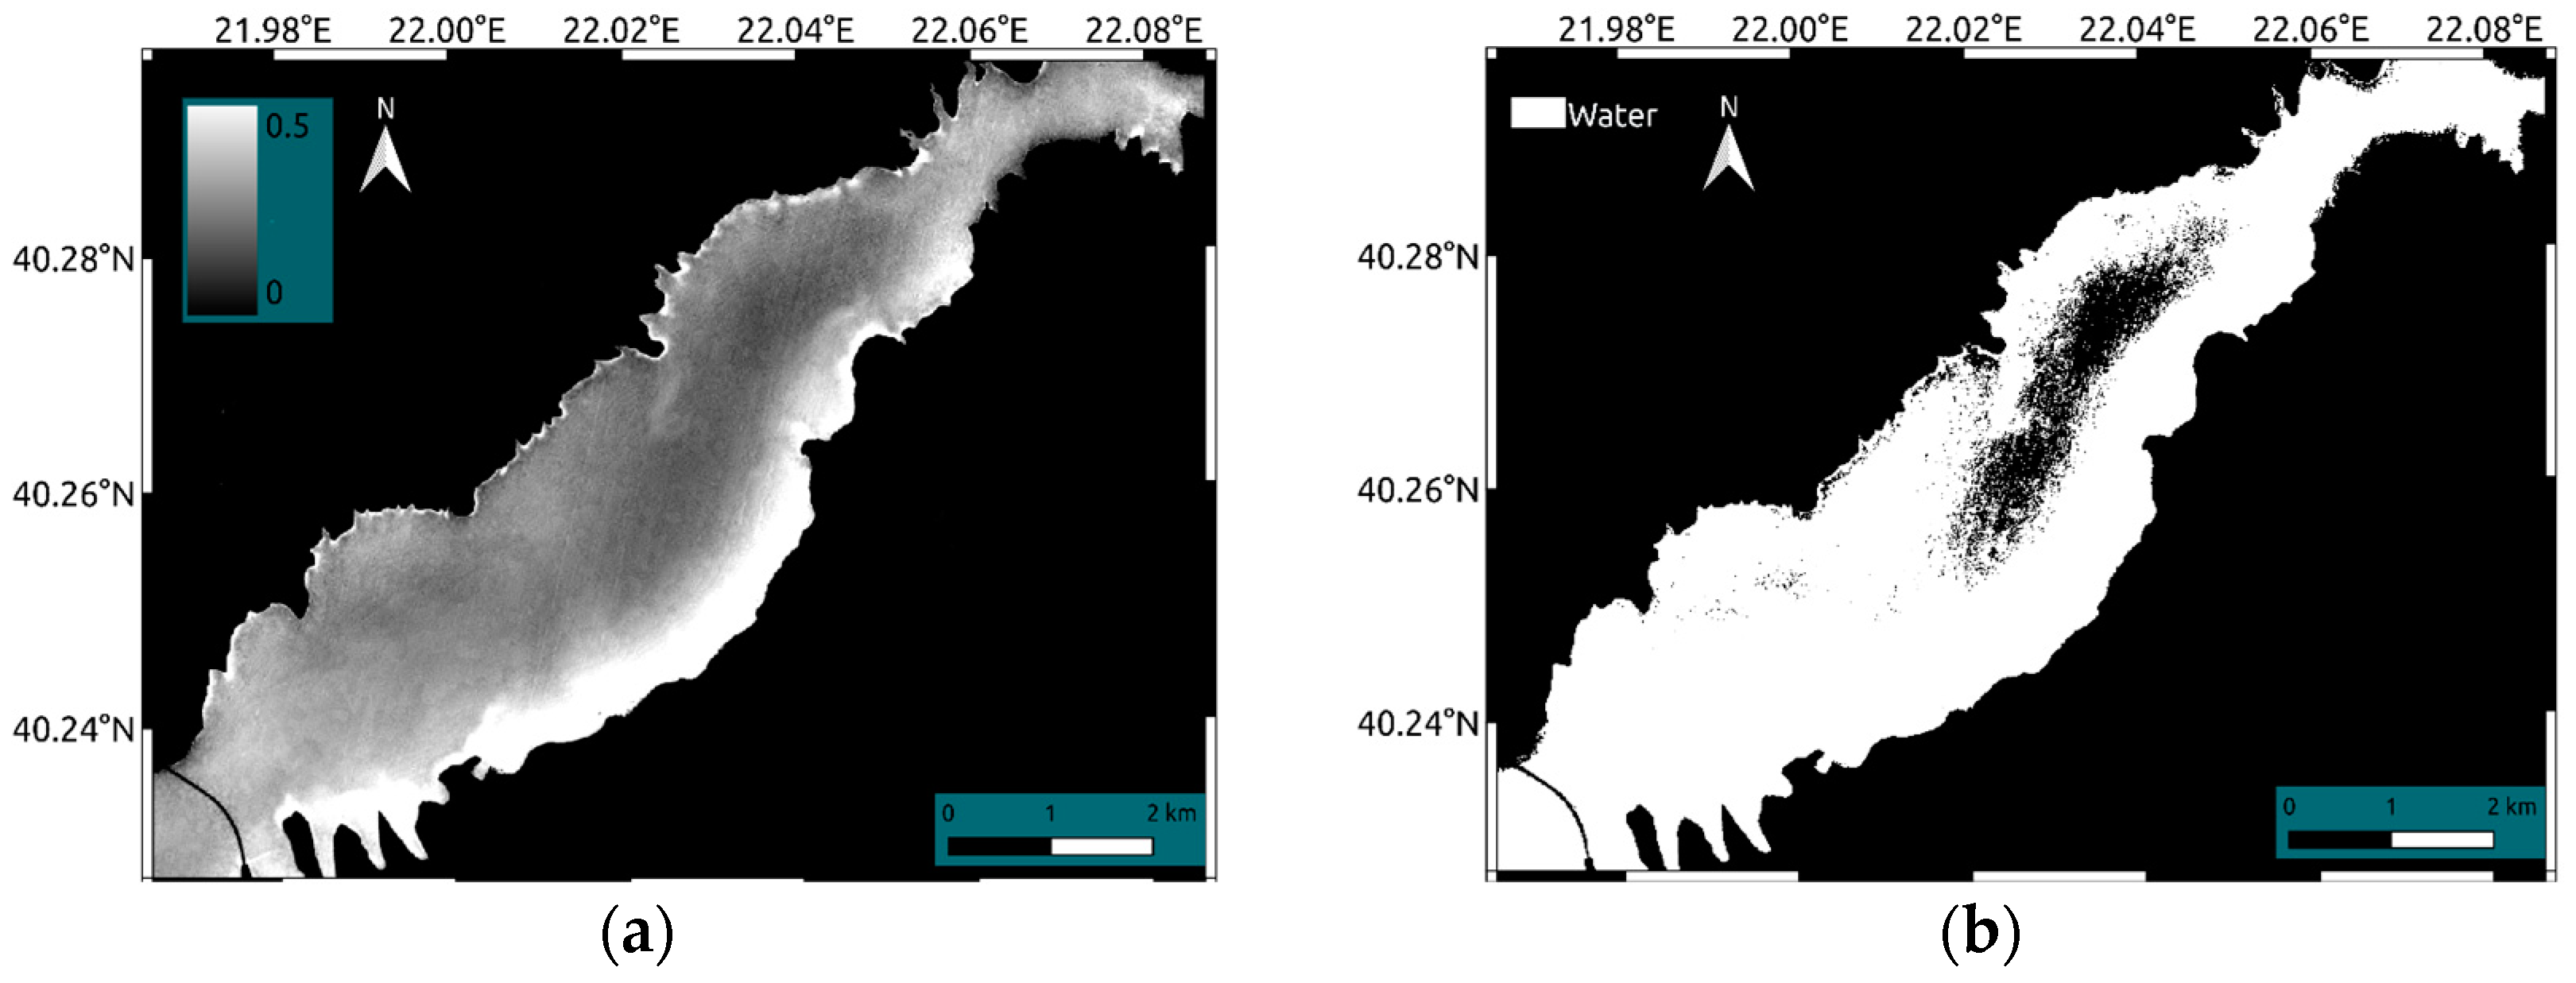
For instance, in point A (58.3768, 64.1647), which corresponds to the date 23 May 2021, applying a strict threshold in the NDWI map leads to the exclusion of water pixels, resulting in an underestimation of the water extent for that specific date. To provide further clarification, Figure 10a displays the specific area that was excluded from the water body based on the strict threshold in the NDWI map. This exclusion is visually evident in the True Color Image (TCI) of S2 shown in Figure 10b. The area in question, which typically belongs to the permanent water body, exhibits an unusual lighter green hue in the TCI, indicating a deviation from the normal water characteristics. Compared to the pixels included in the water body, this region exhibits increased reflectance across all VIS bands, but a noticeable difference is observed specifically in the NIR band. As a result, the values of the NDWI decrease, as depicted in Figure 10c, falling below the threshold value of TNDWI = 0.2. Consequently, these pixels are excluded from the water body. On the other hand, the use of the SWIR band allows for a more accurate estimation of the water body extent, as it remains unaffected by this phenomenon.
A similar scenario is observed for point C (55.673, 58.6456) corresponding to the date 1 August 2021. The presence of lower NDWI values, as shown in Figure 11a, caused by increased reflectance in the NIR band, leads to the exclusion of water pixels, as depicted in Figure 11b. In contrast, for point E (61.5059, 59.252) and the date 18 January 2021, a higher value of the water surface is estimated by the NDWI. This issue arises because the wider area is covered by snow. Specifically, ice water on rocky surfaces presents NDWI values greater than 0.4, which results in being identified as water, considering that the threshold value was set to 0.2.
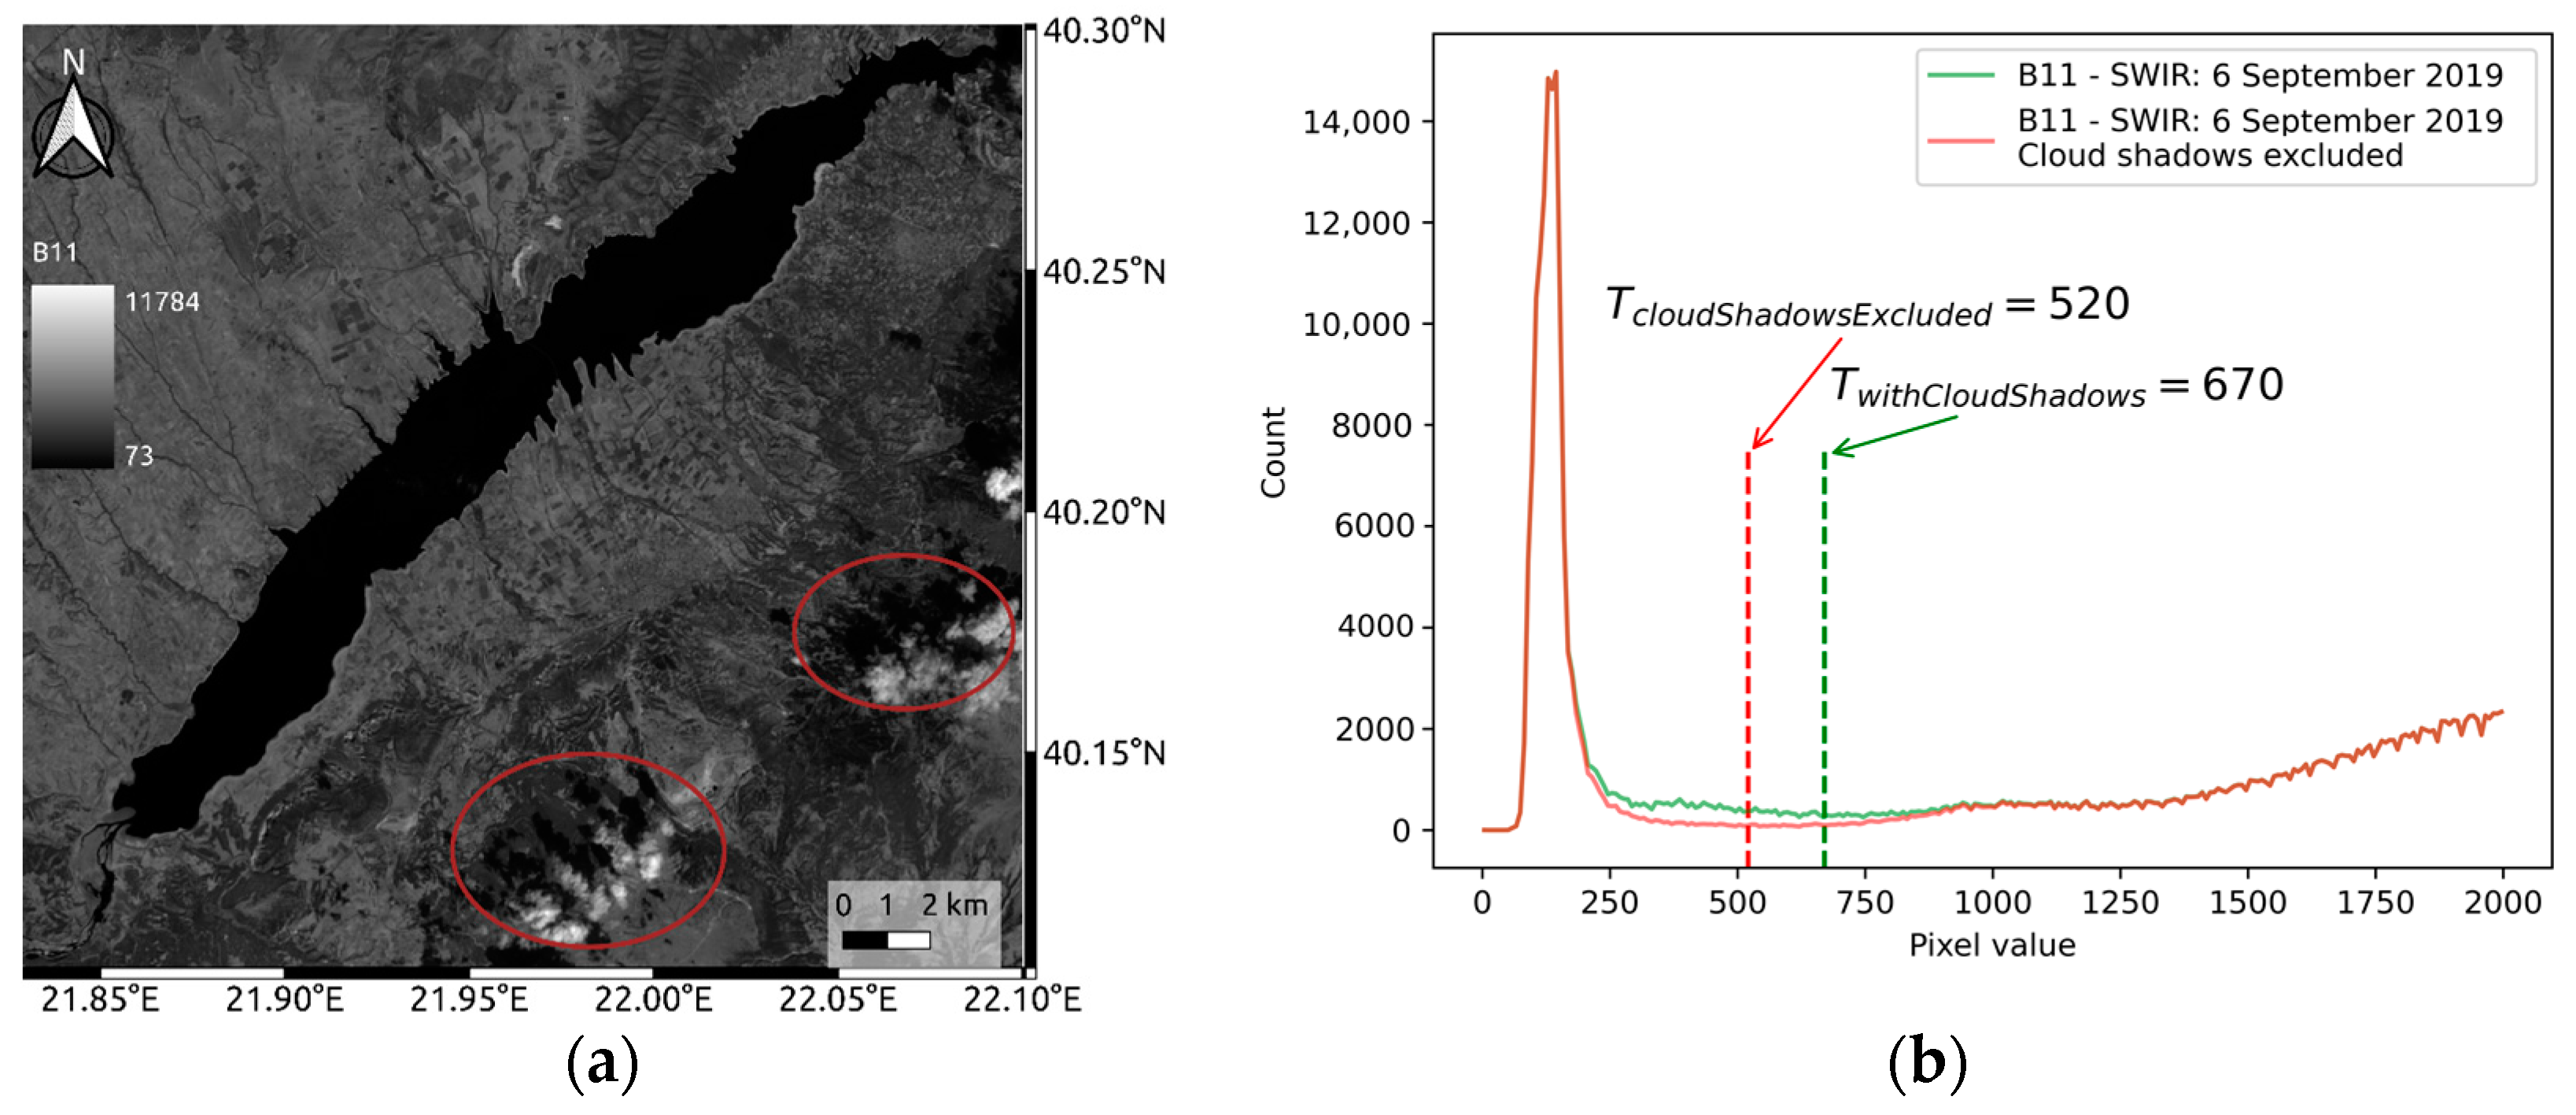
With regards to cases B: 27 June 2020 and D: 6 September 2019, the WaterMask methodology exhibits a higher water surface extent value, primarily due to the inclusion of false-positive pixels along the border. This implies that a higher Tinit has been selected, which permits the inclusion of pixels presenting a higher reflectance in the SWIR-1 band compared to water. For example, in the case of point D (52.0672, 54.8768), the presence of cloud shadows with similar and a bit higher reflectance values to the ones of the water shifts the first valley of the histogram to higher values leading to the automatic selection of a higher value for Tinit. To illustrate this, Figure 12a displays the reflectance of the SWIR-1 band, with red frames highlighting the presence of cloud shadows. In addition, the histogram of the image containing the cloud shadows is shown in green in Figure 12b, while the histogram of the same image with the cloud shadows excluded is shown in red. The impact of the cloud shadows on the histogram formation and the determination of the Tinit value becomes evident when comparing the two curves. The S2 Scene Classification layer (SCL) was used to filter out the cloud shadows. As the threshold value increases, pixels associated with features, which typically reflect the radiation in the SWIR part of the spectrum slightly higher than water, are also included in the initial classification phase. This category includes pixels near the land–water boundary, where their mixed spectral signature results in higher SWIR reflectance compared to pure water. Consequently, the water surface extent appears to increase due to the inclusion of these mixed pixels, such as muddy water, along the border. Similar noise in the process may be induced by the presence of dark vegetation or shadows in mountainous terrain, which can also affect the histogram formation.

3.5. Comparison of the Water Surface Extent and Water Level Data

Water level data for the years 2019–2021 were obtained by visually analyzing Landsat L2 imagery and isolines of the Polyphytos reservoir. Since the Landsat and S2 satellites pass over the area of interest on different dates, the comparison was conducted using data derived from images taken within a maximum time difference of 5 days, which is the average S2 data acquisition interval for the area. The data revealing the Spearman correlation between the two datasets are shown in Figure 13.
The correlation is high. However, it is evident that for certain water level values, such as 282 m or 284 m, the extent value can vary up to 3.17 km2. This variation is likely due to the lower spatial resolution of Landsat imagery, the limitations of the corresponding bathymetric maps (e.g., year of production, inherent mapping errors, etc.), and the accuracy of the inundation maps. More data are necessary to gain a deeper understanding of the relationship between the two variables. Nonetheless, these preliminary results suggest that water level data can be obtained in a fast and cost-saving manner; however, with a lower accuracy.

4. Discussion

The aim of this study was to examine the performance of established workflows [18,19,20] utilized for generating inundation maps in wider wetland water bodies for open surface water reservoirs utilized for drinking water production towards covering the needs of water utilities. In particular, in the first part of the study, the adaptability of the workflows is evaluated in the Polyphytos open surface water reservoir, and the outcomes obtained from the use of various input bands and thresholding algorithms are analyzed. The combination that showed the highest accurate results was utilized for the calculation of the surface water extent in Polyphytos reservoir over four years, which provides useful insights for the transition zone changes to the water utilities. The surface water extent values were compared with those extracted from NDWI maps, allowing for the identification of scene features in the Polyphytos area that introduce noise and affect the surface water extent calculation.
The broader area of the Polyphytos open surface water reservoir is primarily characterized as dry, and emergent vegetation is not typically present. It is demonstrated that the combination of the MCET algorithm with Alt1 (SWIR-1), Alt2 (pixel-wise multiplication of SWIR-2 and NIR) or Alt3 (pixel-wise multiplication of SWIR-1 and NIR) results in the highest OA and Kappa values. In particular, Alt1-MCET shows a slightly better performance in terms of UA, and this implies that it is the most effective in minimizing false predictions of non-water pixels in the broader boundary region. If the focus is given on the transition zone, one of the other two combinations, (i.e., Alt2-MCET and Alt3-MCET) may be preferred while they result in higher PA values. In contrast to the MCET algorithm, the OTSU algorithm tends to choose a higher threshold value, resulting in an overestimation of the water area. The results are in accordance with [19], in which, by examining the performance in a wider area of Doñana, the authors have concluded that for wetlands, including large parts of dry areas, the MCET algorithm results in higher accuracy. Particularly, Alt2-MCET and Alt3-MCET are recommended for similar applications. Moreover, in [19], the fact that Avg helps to balance the possible underestimation and overestimation of water pixels when employing MCET and OTSU, respectively, is outlined. In [25], the WaterMask algorithm was applied to the reservoir of Kerkini in Greece, which shows similar landscape characteristics to Polyphytos. The MCET algorithm demonstrated the best performance.
Successful results are also obtained with the fusion methodology, where S1 data are jointly used with S2 products. They are in line with the finding in [20], where a mdd of 30 days is considered a time threshold for an accurate result, showing even a tendency of maintaining higher accuracy rates than in the Doñana case for longer periods of time (mdd) due to the prevailing biogeographical and management conditions at the reservoir. Considering the estimation of a hydroperiod, the incorporation of S1-derived inundation maps can be beneficial for water utilities, as the water land boundary may be derived more frequently, i.e., during periods with persistent cloud coverage.
Along with the successful results, noise-inflicting landscape features need to be considered to improve the accuracy of water extent mapping. Cloud shadowing effects, inclined areas or dark vegetation canopies might interfere with the major discriminative spectral range (SWIR) and histogram threshold criterion, i.e., the first valley for the selection of Tinit. Consequently, apart from predicting non-water pixels outside of the water body, pixels along the border with slightly higher reflectance values will be also included in the water body area. A possible way to enhance the accuracy of border detection in the transition zones could involve prior filtering in the entire scene, targeting dark surfaces that show similar spectral characteristics, such as mountainous shadows, cloud shadows and dark vegetation.
Noise, introduced by features in the scene, has also been reported in numerous studies, which incorporated NDWI and MNDWI [5,34,35]. For instance, in [4], with the introduction of AWEI, two indices were explored, the water index with shadows (AWEIsh) and without shadows (AWEIns), with the aim of eliminating the undesirable shadow effects. With regards to the estimation of NDWI in the Polyphytos reservoir, as explained earlier, experimentation led to the selection of a strict threshold value of 0.2. In relative studies, values in the range of −0.2 to 0.3 have been reported [35,36]. The specific threshold value resulted in effectively extracting the water body and excluding features of landscape noise for most of the dates. Among other factors, the presence of snow and ice water led to falsely estimating non-water pixels.
Cases in which permanent water area was excluded from the water body were evident with the use of the NDWI but were not reported with WaterMask. In these areas, a higher value of NIR may be caused by sun glint. Sun glint is a known issue increasing the reflectance in the water surface area due to the reflection of the light at the same angle that the satellite sensor is viewing the scene. It has been reported that the increased spatial resolution can introduce errors in the water body detection of the surface water extent [35]. In addition, S2 L2A products do not include a sun glint algorithm correction and previous studies stated that the bands of SWIR-1 or SWIR-2 of S2, with a lower spatial resolution, can be used to reduce the phenomenon over inland waters [35,37]. This, on top of the adaptive thresholding method, may also explain the WaterMask algorithm’s better performance on these dates.

5. Conclusions

This study demonstrates that the WaterMask workflow, originally developed for wetlands, can be successfully adapted for water extent mapping of open water surface reservoirs used for drinking water production across various dates and seasons, especially exhibiting landscape, biogeographical and land management features as in the Polyphytos reservoir. The generalization capacity of the methodology is associated with (i) the automated thresholding, which adjusts the threshold and outperforms approaches relying on strict thresholds, (ii) the local-thresholding second-phase approach, which can further improve the results by taking into consideration information derived from clusters inside the image, (iii) the flexibility to employ multiple input bands and thresholding techniques to enhance the adaptation to the specific area and (iv) the capacity to fuse SAR data in the process. Research and development outcomes supported service elements generation within the WQeMS Copernicus evolution project (grant agreement No. 101004157) towards operational usage of the LWTZ maps to cover water utilities’ needs.
Results at further open surface water reservoirs at various locations in WQeMS revealed similar successful results. However, experimentations from this study showcased that for further improving the applicability at various landscapes and expanding towards dynamically changing riverbeds, initial filtering of noise-inflicting land features has to be introduced and the input of higher spatial and temporal resolution images is required. Radar altimetry data could be complementary as well.

Supplementary Materials

The following supporting information can be downloaded at: https://www.mdpi.com/article/10.3390/w15142596/s1 (incorporated in a single file), Figure S1: Schematic flow diagram of the automatic thresholding methodology adapted from [19]; Figure S2: Schematic flow diagram of the pixel-centric classification approach with S1 and S2 data, adapted from [20]; Figure S3: Schematic flow diagram of the validation process of the inundation maps generated with the automated thresholding methodology (Section 3.1); Figure S4: Graph for S1 products processing, created in Sentinel Application Platform (SNAP) [38]; Figure S5: Schematic Flow diagram of the validation process of the pixel-centric approach (Section 3.2); Figure S6: Inundation mapping with NDWI (Section 3.4).

Author Contributions

Conceptualization, A.K., I.M. and I.L.; methodology, A.K., I.M., S.P. and I.L.; software, A.K., I.M. and L.A.; validation, A.K. and S.P.; formal analysis, A.K., I.L. and M.K.; investigation, A.K., I.M., S.P., I.L., L.A., M.K. and A.C.; data curation, A.K., S.P., I.L., L.A. and M.K.; writing—original draft preparation, A.K., I.M., S.P., I.L., L.A. and A.C.; writing—review and editing, A.K. and I.M.; visualization, AK. and I.M.; supervision, A.K. and I.M.; project administration, I.M.; funding acquisition, I.M. and A.C. All authors have read and agreed to the published version of the manuscript.

Funding

This research has received funding from the European Union’s Horizon 2020 Research and Innovation Action program under grant agreement 101004157—WQeMS.

Data Availability Statement

The data presented in this study are available upon request from the corresponding authors. The data are not publicly available due to their use for ongoing research and intended publications on the topic by the authorship working teams.

Conflicts of Interest

The authors declare no conflict of interest.

References

  1. Teng, J.; Jakeman, A.J.; Vaze, J.; Croke, B.F.; Dutta, D.; Kim, S. Flood inundation modelling: A review of methods, recent advances and uncertainty analysis. Environ. Model. Softw. 2017, 90, 201–216. [Google Scholar]
  2. McFeeters, S.K. The use of the Normalized Difference Water Index (NDWI) in the delineation of open water features. Int. J. Remote Sens. 1996, 17, 1425–1432. [Google Scholar] [CrossRef]
  3. Xu, H. Modification of normalised difference water index (NDWI) to enhance open water features in remotely sensed imagery. Int. J. Remote Sens. 2006, 27, 3025–3033. [Google Scholar] [CrossRef]
  4. Feyisa, G.L.; Meilby, H.; Fensholt, R.; Proud, S.R. Automated Water Extraction Index: A new technique for surface water mapping using Landsat imagery. Remote Sens. Environ. 2014, 140, 23–35. [Google Scholar] [CrossRef]
  5. Acharya, T.D.; Subedi, A.; Lee, D.H. Evaluation of Water Indices for Surface Water Extraction in a Landsat 8 Scene of Nepal. Sensors 2018, 18, 2580. [Google Scholar] [CrossRef] [Green Version]
  6. Goward, S.N.; Markham, B.; Dye, D.G.; Dulaney, W.; Yang, J. Normalized difference vegetation index measurements from the advanced very high resolution radiometer. Remote Sens. Environ. 1991, 35, 257–277. [Google Scholar] [CrossRef]
  7. Quang, D.N.; Linh, N.K.; Tam, H.S.; Viet, N.T. Remote sensing applications for reservoir water level monitoring, sustainable water surface management, and environmental risks in Quang Nam province, Vietnam. J. Water Clim. Chang. 2021, 12, 3045–3063. [Google Scholar] [CrossRef]
  8. Xu, N. Detecting coastline change with all available landsat data over 1986–2015: A case study for the state of Texas, USA. Atmosphere 2018, 9, 107. [Google Scholar] [CrossRef] [Green Version]
  9. Schwatke, C.; Scherer, D.; Dettmering, D. Automated Extraction of Consistent Time-Variable Water Surfaces of Lakes and Reservoirs Based on Landsat and Sentinel-2. Remote Sens. 2019, 11, 1010. [Google Scholar] [CrossRef] [Green Version]
  10. Bourgeau-Chavez, L.L.; Smith, K.B.; Brunzell, S.M.; Kasischke, E.S.; Romanowicz, E.A.; Richardson, C.J. Remote monitoring of regional inundation patterns and hydroperiod in the greater everglades using synthetic aperture radar. Wetlands 2005, 25, 176–191. [Google Scholar]
  11. Muro, J.; Canty, M.; Conradsen, K.; Hüttich, C.; Nielsen, A.A.; Skriver, H.; Remy, F.; Strauch, A.; Thonfeld, F.; Menz, G. Short-Term Change Detection in Wetlands Using Sentinel-1 Time Series. Remote Sens. 2016, 8, 795. [Google Scholar] [CrossRef] [Green Version]
  12. Zeng, L.; Schmitt, M.; Li, L.; Zhu, X. Analysing changes of the Poyang Lake water area using Sentinel-1 synthetic aperture radar imagery. Int. J. Remote Sens. 2017, 38, 7041–7069. [Google Scholar] [CrossRef]
  13. Binh, P.D.; Son, T.S. Monitoring spatial-temporal dynamics of small lakes based on SAR Sentinel-1 observations: A case study over Nui Coc Lake (Vietnam). Vietnam. J. Earth Sci. 2021, 43, 1–17. [Google Scholar] [CrossRef]
  14. Pekel, J.F.; Cottam, A.; Gorelick, N.; Belward, A. High-resolution mapping of global surface water and its long-term changes. Nature 2016, 540, 418–422. [Google Scholar] [CrossRef]
  15. Pham-Duc, B.; Frappart, F.; Tran-Anh, Q.; Si, S.T.; Phan, H.; Quoc, S.N.; Le, A.P.; Viet, B.D. Monitoring Lake Volume Variation from Space Using Satellite Observations-A Case Study in Thac Mo Reservoir (Vietnam). Remote Sens. 2022, 14, 4023. [Google Scholar] [CrossRef]
  16. Zhu, W.; Zhao, S.; Qiu, Z.; He, N.; Li, Y.; Zou, Z.; Yang, F. Monitoring and Analysis of Water Level-Water Storage Capacity Changes in Ngoring Lake Based on Multisource Remote Sensing Data. Water 2022, 14, 2272. [Google Scholar] [CrossRef]
  17. Khan, S.I.; Hong, Y.; Wang, J.; Yilmaz, K.K.; Gourley, J.J.; Adler, R.F.; Brakenridge, G.R.; Policelli, F.; Habib, S.; Irwin, D. Satellite remote sensing and hydrologic modeling for flood inundation mapping in Lake Victoria basin: Implications for hydrologic prediction in ungauged basins. IEEE Trans. Geosci. Remote Sens. 2010, 49, 85–95. [Google Scholar] [CrossRef] [Green Version]
  18. Kordelas, G.A.; Manakos, I.; Aragonés, D.; Díaz-Delgado, R.; Bustamante, J. Fast and automatic data-driven thresholding for inundation mapping with Sentinel-2 data. Remote Sens. 2018, 10, 910. [Google Scholar] [CrossRef] [Green Version]
  19. Kordelas, G.A.; Manakos, I.; Lefebvre, G.; Poulin, B. Automatic Inundation Mapping Using Sentinel-2 Data Applicable to Both Camargue and Doñana Biosphere Reserves. Remote Sens. 2019, 11, 2251. [Google Scholar] [CrossRef] [Green Version]
  20. Manakos, I.; Kordelas, G.A.; Marini, K. Fusion of Sentinel-1 data with Sentinel-2 products to overcome non-favourable atmospheric conditions for the delineation of inundation maps. Eur. J. Remote Sens. 2020, 53, 53–66. [Google Scholar] [CrossRef] [Green Version]
  21. Gikas, G.D.; Tsihrintzis, V.A.; Akratos, C.S.; Haralambidis, G. Water quality trends in Polyphytos reservoir, Aliakmon River, Greece. Environ. Monit. Assess. 2009, 149, 163–181. [Google Scholar] [CrossRef]
  22. Tian, K.; Yang, W.; Zhao, Y.W.; Yin, X.A.; Cui, B.S.; Yang, Z.F. Development of a Hydrological Boundary Method for the River–Lake Transition Zone Based on Flow Velocity Gradients, and Case Study of Baiyangdian Lake Transition Zones, China. Water 2020, 12, 674. [Google Scholar] [CrossRef] [Green Version]
  23. Copernicus SciHub. Available online: https://scihub.copernicus.eu/ (accessed on 2 June 2023).
  24. Congalton, R.G. A review of assessing the accuracy of classifications of remotely sensed data. Remote Sens. Environ. 1991, 37, 35–46. [Google Scholar] [CrossRef]
  25. Kanj, M.; Manakos, I.; Tsolakidis, I.; Katselas, N.; Kalaitzidis, C. Empirical estimation of surface water quality parameters in Lake Kerkini using Landsat ETM+/OLI. In Proceedings of the Eighth International Conference on Enviromental Management, Engineering, Planning and Economics (CEMEPE) and SECOTOX Conference, Skiathos Island, Greece, 5–9 June 2021; pp. 110–121. [Google Scholar]
  26. Lesiv, M.; See, L.; Laso-Bayas, J.C.; Sturn, T.; Schepaschenko, D.; Karner, M.; Moorthy, I.; McCallum, I.; Fritz, S. A global snapshot of the spatial and temporal distribution of very high resolution satellite imagery in Google Earth and Bing Maps as of 11th of January, 2017. Pangea 2018, 10, 1594. [Google Scholar] [CrossRef]
  27. Planet Labs. Available online: https://www.planet.com/products/monitoring/ (accessed on 7 July 2023).
  28. Hu, Q.; Wu, W.; Xia, T.; Yu, Q.; Yang, P.; Li, Z.; Song, Q. Exploring the Use of Google Earth Imagery and Object-Based Methods in Land Use/Cover Mapping. Remote Sens. 2013, 5, 6026–6042. [Google Scholar] [CrossRef] [Green Version]
  29. Maxar. Available online: https://www.maxar.com/ (accessed on 18 May 2023).
  30. Kullback, S. Information Theory and Statistics; Dover Publications: New York, NY, USA, 1968. [Google Scholar]
  31. Otsu, N.A. Threshold selection method from gray-level histograms. IEEE Trans. Syst. Man Cybern. 1979, 9, 62–66. [Google Scholar] [CrossRef] [Green Version]
  32. Manakos, I.; Kordelas, G.; Marini, K.; Bakratsas, M.; Chantziaras, G.; Simionesei, L.; Bramos, T.; Bonet García, F.J.; Herrero Lantarón, J.; Polo Gómez, M.J.; et al. Online Monitoring Data Services for Ecosystem Indicators. Project Deliverable D6.3. Centre for Research & Technology–Hellas (CERTH), 2018. Available online: https://ec.europa.eu/research/participants/documents/downloadPublic?documentIds=080166e5cd724649&appId=PPGMS (accessed on 14 May 2023).
  33. Sentinel Hub Authentication Page. Available online: https://apps.sentinel-hub.com/ (accessed on 12 July 2023).
  34. Zhou, Y.; Dong, J.; Xiao, X.; Xiao, T.; Yang, Z.; Zhao, G.; Zou, Z.; Qin, Y. Open Surface Water Mapping Algorithms: A Comparison of Water-Related Spectral Indices and Sensors. Water 2017, 9, 256. [Google Scholar] [CrossRef]
  35. Wang, Z.; Liu, J.; Li, J.; Zhang, D.D. Multi-Spectral Water Index (MuWI): A Native 10-m Multi-Spectral Water Index for Accurate Water Mapping on Sentinel-2. Remote Sens. 2018, 10, 1643. [Google Scholar] [CrossRef] [Green Version]
  36. Du, Y.; Zhang, Y.; Ling, F.; Wang, Q.; Li, W.; Li, X. Water Bodies’ Mapping from Sentinel-2 Imagery with Modified Normalized Difference Water Index at 10-m Spatial Resolution Produced by Sharpening the SWIR Band. Remote Sens. 2016, 8, 354. [Google Scholar] [CrossRef] [Green Version]
  37. Harmel, T.; Chami, M.; Tormos, T.; Reynaud, N.; Danis, P.A. Sunglint correction of the Multi-Spectral Instrument (MSI)SENTINEL-2 imagery over inland and sea waters from SWIR bands. Remote Sens. Environ. 2018, 204, 308–321. [Google Scholar] [CrossRef]
  38. ESA SNAP (Sentinel Application Platform), Version 9.0.3; European Space Agency: Frascati, Italy, 2021. Available online: https://step.esa.int/main/toolboxes/snap/(accessed on 12 July 2023).
Figure 1. Polyphytos open surface water reservoir with a study area of 75 km2.
Water 15 02596 g001
Figure 2. (a) Study regions within Polyphytos reservoir: A, B and C; (b) inundated area contours in Region A (note that Oct = October, Sept = September).
Water 15 02596 g002
Figure 3. Regions within Polyphytos reservoir, where validation was performed: (a) Examples of polygons in Regions A, B and C, where reference layers from GE were utilized; (b) the subset AOIs presented in Table 4, where validation conducted with WV2 MAXAR imagery.
Water 15 02596 g003
Figure 4. Visualization of the results on 31 August 2020 for Regions A and B: (a) results obtained by Alt1-MCET; (b) results obtained by Alt1-OTSU.
Water 15 02596 g004
Figure 5. Kappa coefficient as a function of the mdd on five different dates (note that Oct = October, Aug = August, Sep = September, Jul = July).
Water 15 02596 g005
Figure 6. Kappa coefficient as a function of the mdd on the target date of 16 October 2019.
Water 15 02596 g006
Figure 7. Annual hydroperiod maps for (a) September 2017–August 2018; (b) September 2018–August 2019; (c) September 2019–August 2020; (d) September 2020–August 2021.
Water 15 02596 g007
Figure 8. The water surface extent of Polyphytos reservoir from September to August over a period of 4 years.
Water 15 02596 g008
Figure 9. Correlation between the water surface extent calculated by NDWI and WaterMask; outliers are labeled as A–E.
Water 15 02596 g009
Figure 10. Waterbody region incorrectly identified as non-water, when applying a strict threshold in the NDWI map on 23 May 2021 (Point A of Figure 9): (a) inundation map of Polyphytos reservoir produced by NDWI; (b) True Color Image of the region where pixels considered as non-water; (c) NDWI map on the entire scene and focus on the area; (d) histogram of NDWI map on 23 May 2021.
Water 15 02596 g010
Figure 11. Waterbody region incorrectly identified as non-water when applying a strict threshold in the NDWI map on 1 August 2021 (Point C): (a) NDWI map focused on the region of interest; (b) inundation map.
Water 15 02596 g011
Figure 12. An example showcasing the influence of cloud shadows, which introduce noise and alter the histogram formation, observed on 6 September 2019 (Point D): (a) SWIR-1 grey values, with cloud shadows indicated within the red frames; (b) comparison of the histograms of SWIR-1 band, considering the presence and absence of cloud shadows.
Water 15 02596 g012
Figure 13. Correlation between water surface extent data, calculated by WaterMask, and water level data of Polyphytos reservoir.
Water 15 02596 g013
Table 1. Dates of annually employed cloud-free S2 acquisitions over Polyphytos artificial lake.
CycleSeptemberOctoberNovemberDecemberJanuaryFebruaryMarchAprilMayJuneJulyAugust
2017–20181, 6, 166, 21-5, 20, 2519, 29-10, 304, 9, 19, 249, 148, 183, 23, 2817, 22
2018–20191, 6, 11, 211, 16, 26, 31-20-8, 18, 285, 10, 25, 304, 29298, 13, 18, 283, 8, 13, 18, 282, 7, 12, 17
2019–20201, 6, 11, 16, 261, 6, 11, 16, 21, 265, 10, 15154, 9, 243, 8, 13, 18198, 13, 188, 13, 18, 232, 72, 7, 12, 17, 22, 2711, 16, 21, 26, 31
2020–20215, 10, 15, 25109, 14, 24-18, 282, 12, 17, 274, 14, 103, 283, 8, 13, 18, 23, 282, 12, 22, 272, 12, 17, 22, 271, 16
Table 2. Dates of S1 acquisitions.
YearFebruaryMarchAprilMayJuneJulyAugustSeptemberOctoberNovemberDecember
2019 11
23
04
16
28
16
22
03
15
27
09
21
2020 24
30
12
24
16
29
10
22
28
10
22
28
04
16
28
09
20211208
14
26
14
19
08
13
31
06
12
25
07
12
18
24
05
17
29
05
17
Table 3. Selected VHR satellite images from Google Earth for Polyphytos reservoir.
RegionDateImage Source/Copyrights
A31 August 2020Maxar Technologies 2022 (Westminster, CO, USA)
9 April 2020Maxar Technologies 2022
17 October 2019Landsat/Copernicus
30 March 2018CNES/Airbus, 2022
B31 August 2020Maxar Technologies 2022
9 April 2020Maxar Technologies 2022
17 October 2019Landsat/Copernicus
30 March 2018Maxar Technologies 2022
C31 August 2020
9 April 2020
Maxar Technologies 2022
Maxar Technologies 2022.
CNES/Airbus, 2022
Table 4. Selected VHR satellite images from Maxar Technologies for Polyphytos reservoir (A: region indicative, 1: reference number of AOI within a region).
RegionDate
AOI A131 August 2020
AOI A231 August 2020
AOI A39 April 2020
AOI A49 April 2020
AOI B131 August 2020
AOI C131 August 2020
AOI C29 April 2020
Table 5. Accuracy assessment results for Polyphytos in relation to the GE reference layers.
Alt (Input Band)Thresholding MethodOA (%)PA (%)UA (%)Kappa
Alt1MCET98.8397.6798.980.974
Alt1Avg98.6098.3397.660.969
Alt1OTSU97.9898.8195.560.956
Alt2MCET98.6398.7397.070.967
Alt2Avg97.7699.1791.840.927
Alt2OTSU95.8199.4482.220.838
Alt3MCET98.5198.7697.380.970
Alt3Avg96.6299.2194.660.951
Alt3OTSU92.2798.9590.090.910
Table 6. Results of the inundation maps produced by Alt1-MCET for all dates and regions of Polyphytos.
RegionDate of GE ImagesDate of S2OA (%)PA (%)UA (%)Kappa
A30 March 201830 March 201898.097.496.80.956
A9 April 20208 April 202098.696.498.40.965
A31 August 202031 August 202097.892.598.70.94
A17 October 201916 October 201998.289.497.90.92
B30 March 201830 March 201899.399.698.70.985
B31 August 202031 August 202099.598.799.80.989
C9 April 20208 April 202099.097.999.80.98
C31 August 202031 August 202098.896.899.90.975
Table 7. Results from validation with reference layers from different sources.
Ref. Layers from MaxarRef. Layers from GE
AltThresh. MethodPA (%)UA (%)KappaPA (%)UA (%)Kappa
Alt1MCET86.7596.810.87688.4998.180.8993
Alt1Avg89.7895.420.8991.7896.970.9161
Alt1OTSU92.1393.890.89594.0995.440.9222
Alt2MCET91.3994.480.89593.5296.130.9230
Alt2Avg93.5192.310.89495.6693.890.9216
Alt2OTSU94.9786.320.85497.0187.670.8792
Alt3MCET91.5494.570.89793.6896.220.9249
Alt3Avg93.6792.300.89595.8893.930.9234
Alt3OTSU90.8594.790.89392.9696.430.921
Disclaimer/Publisher’s Note: The statements, opinions and data contained in all publications are solely those of the individual author(s) and contributor(s) and not of MDPI and/or the editor(s). MDPI and/or the editor(s) disclaim responsibility for any injury to people or property resulting from any ideas, methods, instructions or products referred to in the content.