Article

The Effect of Gravel and Sand Mining on Groundwater and Surface Water Regimes—A Case Study of the Velika Morava River, Serbia

by
Milan Kresojević
1,*,
Vesna Ristić Vakanjac
2,
Dragan Trifković
1,
Jugoslav Nikolić
3,
Boris Vakanjac
4,
Dušan Polomčić
2 and
Dragoljub Bajić
2
1
Military Academy, University of Defence in Belgrade, 11000 Belgrade, Serbia
2
Faculty of Mining and Geology, University of Belgrade, 11000 Belgrade, Serbia
3
Republic Hydrometeorological Service of Serbia, 11000 Belgrade, Serbia
4
Military Geographical Institute “General Stevan Bošković”, 11000 Belgrade, Serbia
*
Author to whom correspondence should be addressed.
Water 2023, 15(14), 2654; https://doi.org/10.3390/w15142654
Submission received: 12 May 2023 / Revised: 17 July 2023 / Accepted: 19 July 2023 / Published: 22 July 2023
(This article belongs to the Section Hydrogeology)

Abstract

:
This paper describes how uncontrolled and illegal mining of sand and gravel can affect surface water and groundwater regimes in places where there is a hydraulic connection between them, based on a case study of the Velika Morava River in Serbia. Also, a change in cross-profile geometry, as a result of anthropogenic and natural factors, hinders the preparation of this river for inclusion among Serbia’s waterways. The Velika Morava River’s navigability would enable the development of waterborne transportation for both merchant ships and vessels of the Serbian Armed Forces River Flotilla. Correlations between water levels at gauging stations, as well as correlations between groundwater levels and river water levels at gauging stations, are used to show the dependence of these parameters on the change in the river bed profile after sand and gravel mining at the locations near gauging stations. In addition, the homogeneity of time-series of average annual elevations and the variance of the water levels of the Velika Morava River, measured in gauging stations during different periods, are statistically analyzed. The deepening of the Velika Morava riverbed where it was indiscriminately excavated in the 1980s led to the disruption of the groundwater regime and the hydraulic connection with the river, which lowered the water table of the aquifer used for the public water supply, as well as causing a number of other negative consequences.

1. Introduction

Since the advent of mankind, ancient settlements, cultures, and civilizations have territorially been associated with large river valleys. This is also the case in the study area in Serbia. Namely, the Velika Morava River is the largest domestic river. Its vast basin occupies a central place in Serbia, extending to Serbia’s western, southern, and eastern borders. The land area of the watershed in Serbia is 36,638 km2, or 42% of its territory. According to the 2011 census (Statistical Office of the Republic of Serbia, 2014) [1], about 2,300,000 people live in the Morava River Basin in Serbia. Compared to the total amount of water available within that territory (6.32·109 m3), the water wealth of the population in the Velika Morava River basin is 2750 m3/resident/year, which ranks it among water-poor basins [2].
The Velika Morava River was navigable along its entire course in the 19th century. Unfortunately, it is currently navigable for only 3 km upstream from its confluence with the Danube River. If the navigability of the Velika Morava is re-established, conditions will be created for reviving a project that connects northern and southern Europe, namely the North Sea and the Aegean Sea, via the waterway corridor Main–Rhine–Danube–Velika–Morava–Južna Morava–Pčinja–Vardar [3]. By regulating the flow of the Velika Morava, the percentage of irrigated arable land would increase, accelerating the agricultural development of this region. On the other hand, the re-alignment of the riverbed and the control of gravel and sand excavation would enhance the development of industry and waterborne transportation. The shipping of goods via inland waterways is still the most economical and the most environmentally friendly method of transportation.
Given that sand and gravel are in high demand, primarily in the construction industry, as well as the fact that the Velika Morava River is rich in gravel and sand sediments, the mining of these materials has intensified to a considerable scale. Considering the number of inhabitants, the demand for these materials is extremely high.
Due to intensive erosion along its constituent rivers and main tributaries, the Velika Morava River features large reserves of gravel and sand which have been used by the construction industry. However, uncontrolled gravel excavation usually disrupts the natural appearance of riverbanks, and riverbeds become a series of craters, further endangering the existing biocoenoses whose survival is connected to the river itself or its banks [4]. This also largely affects the stability of the hydraulic infrastructure (primarily bridges and dykes) and greatly increases the risk of natural disasters. Considering everything mentioned above, it is necessary to re-align the riverbed to minimize the impact of primarily flood waves. It is important to emphasize that Serbia occasionally faces such events. The disastrous floods of May 2014, among other things, necessitated the evacuation of 25,000 residents of the city of Obrenovac with available military and police vessels [5]. By re-aligning the riverbed of the Velika Morava, the overtopping of its banks would be avoided or reduced, as would inundation during periods of heavy precipitation.
The Velika Morava River basin and its environs constitute one of the most economically active areas in Serbia. Crop farming, animal husbandry, orchardry, and mining are well-developed. As a result of the creation of new agricultural areas, by cultivating crops at higher altitudes, today the Velika Morava River basin comprises fields and pastures. The public water supply generally relies on groundwater, which is in active hydraulic connection with the Velika Morava River, to a greater or lesser extent. However, sewage, stormwater, industrial discharges, and other types of wastewaters are polluters that have permanently altered the water quality of the rivers and alluvial aquifers. An additional problem especially associated with groundwater quality is farming, which is intensive in the alluvium because of the good quality of the soil, given that fertilizers, insecticides, and pesticides are applied. During dry periods, the groundwater used for irrigation reduces aquifer reserves and additionally affects groundwater quality.
This problem is generally prevalent in underdeveloped countries. For instance, many research papers state that among the most significant environmental aspects related to artisanal and small-scale mining are deforestation, changes in landscape structures, influences on geomorphological processes and the hydrological regime, and the chemical pollution of soil and watercourses, which affects soil productivity [6,7,8,9,10,11,12,13,14,15]. Liu et al. state that the nitrate contamination of surface water and groundwater is an environmental problem in many regions of the world where there is intensive farming and high population density [16]. This applies to the Velika Morava alluvium as well. Zhang et al. highlight the problem of nitrates reaching groundwater via wastewater or a mixture of pig manure and wastewater used for irrigation. According to their case study of Shijiazhuang City, where suburban and surrounding rural areas are devoid of centralized water supply systems, groundwater is the primary water resource, and although it features elevated nitrate concentrations, it is the only water supply solution available to that population [17].
Addressing water resource management, Brunner, Cook, and Simmons (2011) point out that it is necessary to determine hydraulic connections between surface waters and aquifers, providing a critique of the definition of that concept. They emphasize the spatial and temporal variations of such connections, as well as the fact that field studies are needed to gain insight, including detailed monitoring of both surface water and groundwater in parts of the river basin where the extent of the hydraulic connection between the two needs to be identified [18]. Frei et al. (2009) analyzed existing hydraulic connections related to the Cosumnes River, whose lower course represents an alluvial river/aquifer system with a deep water table, typical of semiarid and arid regions [19]. Kotowski et al. (2023) studied the surface water/aquifer connection of mountain streams [20].
Saravanan et al. [21] present the test results of sediment samples from two major rivers in China, indicating heavy metal pollution. This problem is a result of population growth and river traffic. Similar research is reported by Aguilar Pesantes et al. [22], focusing on the impact of mining in the Ponce Enríquez area (Ecuador) on river sediments and groundwater in terms of pollution by heavy metals. Čmelík et al. [23] discuss the effects of repeated flood waves of the Bílina River (Czechia), resulting in elevated concentrations of heavy metals in river sediments, which originate from industrial facilities located along the studied river.
Wrzesiński and Sobkowiak [24] describe the effects of natural factors and human activity on groundwater resources in a case study of the Vistula River (Poland), contributing to river basin management and hydrological forecasting. The same topic is discussed by Abebe et al. [25], using a case study of the Gumara River (Ethiopia). Rempel and Church [26] show the impact of gravel mining from a large alluvial river on the environment of the Fraser River (Canada).
Other aspects that affect surface water regimes have also been studied. For example, Zhang et al. [27] examine hydrological regime changes in a river–lake system and their influence on the ecological environment and groundwater. Wang et al. [28] present the effects of river channel reconstruction on the hydrological regime. Braud et al. [29] assess the impact of urbanization on the hydrological regime in a case study of the city of Lyon (France).
Researchers have also studied river basins and changes in certain components of the mineral composition over time in connection with heavy metals as a result of geological evolution. Wang et al. [30] analyze sediment changes in the Yellow River (China), identifying nine river terraces created by the uplifting of the Tibetan Plateau and climate change through geologic history. Similar research is reported by Llena et al. [31], who analyze the effect of geomorphological processes over time on mountain rivers. Zhu et al. [32] characterize rainfall, surface water, and groundwater in the Heihe River Basin (China) using a combination of isotopic and chemical indicators. Mrokowska et al. [33] present the contribution of laboratory studies of the key processes of sediment transport observed in alluvial rivers, ephemeral streams, and flows below dams, focusing on sediment transport in gravel streams.

2. Study Area

The study area selected for this research was the lower basin of the Velika Morava River. As shown in Figure 1, the Velika (Greater) Morava River originates at the junction of the Južna (South) Morava River and the Zapadna (West) Morava River, near the town of Stalać. It is 245 km long. The Velika Morava flows into the Danube River in the city of Smederevo, with an average discharge of ~300 m3/s. It is a meandering river. The ratio of the length of its actual course and the distance from the origin to the mouth as the crow flies is 245:118, which ranks the Velika Morava River among the most meandering European rivers. It flows through central Serbia, where the soil is very fertile and the population density is the highest. Downstream from Stalać, the river flows through and connects the towns of Varvarin, Paraćin, Ćuprija, Jagodina, Lapovo, Svilajnac, Požarevac, Velika Plana, and Smederevo.
Systematic observation of surface waters in Serbia, primarily the Danube River, began in the first half of the 19th century. River stage and discharge monitoring of the Velika Morava River began between the two World Wars, such that mean daily stages over nearly one hundred years are available. Table 1 shows the existing gauging stations on the Velika Morava River where river stages and discharges are observed. Since the topic of this paper is the effect of sand and gravel mining on groundwater and surface water regimes, and given that mining is widespread in the lower part of the Velika Morava River Basin, the upstream stations (Varvarin and Ćuprija) were not considered. Consequently, the river stage data used in the case study came from the stations at Bagrdan, Žabarski Most, and Ljubičevski Most, and the discharge data from Bagrdan and Ljubičevski Most (no hydrometric observations had been made at Žabarski Most). The abovementioned gauging stations considered in the paper are shown in Table 1. The studied observation period is from 1952 to 2018, for which river stage data are available from all three stations. Discharge data came from Bagrdan and Ljubičevski Most only.
Groundwater level monitoring began after World War II, mainly in Vojvodina Province, the Mačva District, and the valleys of large rivers, including the Velika Morava. Groundwater monitoring in the Velika Morava alluvium was initiated in the late 1970s and early 1980s. Depths to groundwater have been and still are monitored at observation wells every five or ten days. New observation wells were installed in 2002 with diver data loggers that continually record groundwater levels. Even though the new observation wells provide daily data, they were not included in the case study. Namely, the changes that resulted in the deepening of the Velika Morava River occurred before the year 2000, so the data from the new observation wells were not relevant. The “old” observation wells which were considered are described in Table 2.

3. Research Method

The Pearson correlation coefficient, also called correlation coefficient—r [37], was used to quantify the strength of correlation between the random variables, namely the water levels of the Velika Morava River recorded at Bagrdan, Žabarski Most, and Ljubičevski Most, and the groundwater levels recorded by the accompanying observation wells located to the left and right of the Velika Morava River.
A statistical analysis was also conducted of the homogeneity of the time-series of average annual water levels of the Velika Morava River recorded at the abovementioned gauging stations in the selected period. Time-series homogeneity was analyzed by testing statistical parameters, specifically those of average value with Student’s t-test and distortion with Fisher’s F-test.
To apply the above methods, it was first necessary to gather all relevant data (average daily water levels and discharges of the Velika Morava River, as well as average daily groundwater levels). The data were obtained from the Hydrometeorological Service of Serbia, which monitors quantitative parameters of surface waters at points of interest as needed by the Republic of Serbia. River water level variations are monitored by water meters and automatic water level dataloggers, whereas occasional hydrometric measurements are undertaken for constructing new or checking existing flow curves. Groundwater levels are monitored by diver dataloggers installed in observation wells.

4. Results

Even though the monitoring of river stages and discharges began between the two World Wars, there have been many interruptions due to combat operations and post-war reconstruction. Consequently, the time period addressed in this study is from 1952 to 2018. The period after 2018 is not relevant for this research because there were no significant changes in profile. Figure 2 compares the stages recorded at Bagrdan, Žabarski Most, and Ljubičevski Most; Figure 3a the hydrographs of the Velika Morava River at Bagrdan and Ljubičevski Most; and Figure 3b the correlations between the discharges observed at Ljubičevski Most and Bagrdan from 1952 to 2018.
With regard to the effect of the Velika Morava River regime on groundwater, Figure 4 shows the water levels of the Velika Morava and piezometric levels on the right bank, and Figure 5 those on the left bank.
As shown in Figure 2, at Bagrdan (green line) the lowest water level elevations were the same (relatively stable river channel or minor changes due to natural factors/flood waves) up to 1982. In the 1980s, the river channel at that station gradually deepened by ~1.2 m due to river channel re-alignment when highway E75 was being built. The situation was similar at Žabarski Most (red line). The river channel was stable up to the 1980s and the water levels during a 30-year period (1952–1982) were approximately the same. The cross-sectional geometry was influenced by natural factors (flood waves and dry years). The channel at this station became deeper by ~1 m from 1982 to 1989, most likely due to the upstream re-alignment of the river. There was also a minor but noticeable deepening after 1990, which continued through to 2018 (by another ~1 m at Žabarski Most). The situation was the most complex at Ljubičevski Most (blue line), where the river channel was relatively stable from 1952 to 1962, with the lowest water levels at ~75 m a.s.l. The river channel deepened at this station by ~1 m between 1963 and 1965, likely as a result of two flood waves (two historic peaks). Namely, on 21 February 1963, a discharge of 2530 m3/s was recorded at Ljubičevski Most, and the absolute maximum was 2670 m3/s on 16 May 1965. From 1965 to 1982, the river channel of the Velika Morava River relatively stabilized at Ljubičevski Most, with the lowest water levels at ~74 m a.s.l. In the 1980s (or more precisely from 1982 to 1990), the minimum water levels declined by 1 m, resulting in the re-alignment and deepening of the Velika Morava River at Bagrdan. After 1990, the water levels gradually decreased through to 2000. During that period, there was a decline by another ~3–4 m, this time due to intensified, uncontrolled, and largely illegal sand and gravel mining near Ljubičevski Most.
It is apparent in Figure 3a that river discharge remained unchanged during the monitoring period, and from Figure 3b we can conclude that the discharge correlation coefficient between Ljubičevski Most and Bagrdan is high (r = 0.959, Figure 3b). Based on these data, the deepening of the riverbed near Ljubičevski Most occurred due to anthropogenic factors (sand and gravel mining).
Figure 4 shows that the influence of river stages is more pronounced the closer the well is to the river. It is also apparent that the water table declined at all the considered observation wells by ~2 m.
According to Figure 5, the situation is similar on the left bank, with the observation wells installed perpendicular to the Velika Morava River at Ljubičevski Most. The examined observation wells, 1NP904A and 1NP974, showed a groundwater level decline of ~2 m (from 1977 to 2018). The most pronounced decrease was recorded at 1NP904A, which was the closest to the river (910 m). The water table at 1NP904A up to the year 1999 was always below the stage of the Velika Morava River, such that the river recharged groundwater throughout the year. After 1999, during periods of low and later medium discharges, the direction of groundwater flow changed in this area and groundwater recharged the river. The reason is the Jezava River, which flows parallel to the Velika Morava, along the right side of its valley at a distance of 5–6 km. Prior to the drastic deepening of the Velika Morava, the river recharged groundwater during flood stages. At such times, the water table was always below the water levels of the Velika Morava River. After 1999 or, in other words, after the river channel deepened, groundwater near observation wells 1NP974 and 1NP901A recharged the river for most of the year (the direction of groundwater flow was from the Jezava River to the Velika Morava River). Only during times of extreme flood waves did the Velika Morava River recharge groundwater for short periods of time. Unfortunately, the Jezava River has not been gauged, so no water level data were available.

5. Discussion

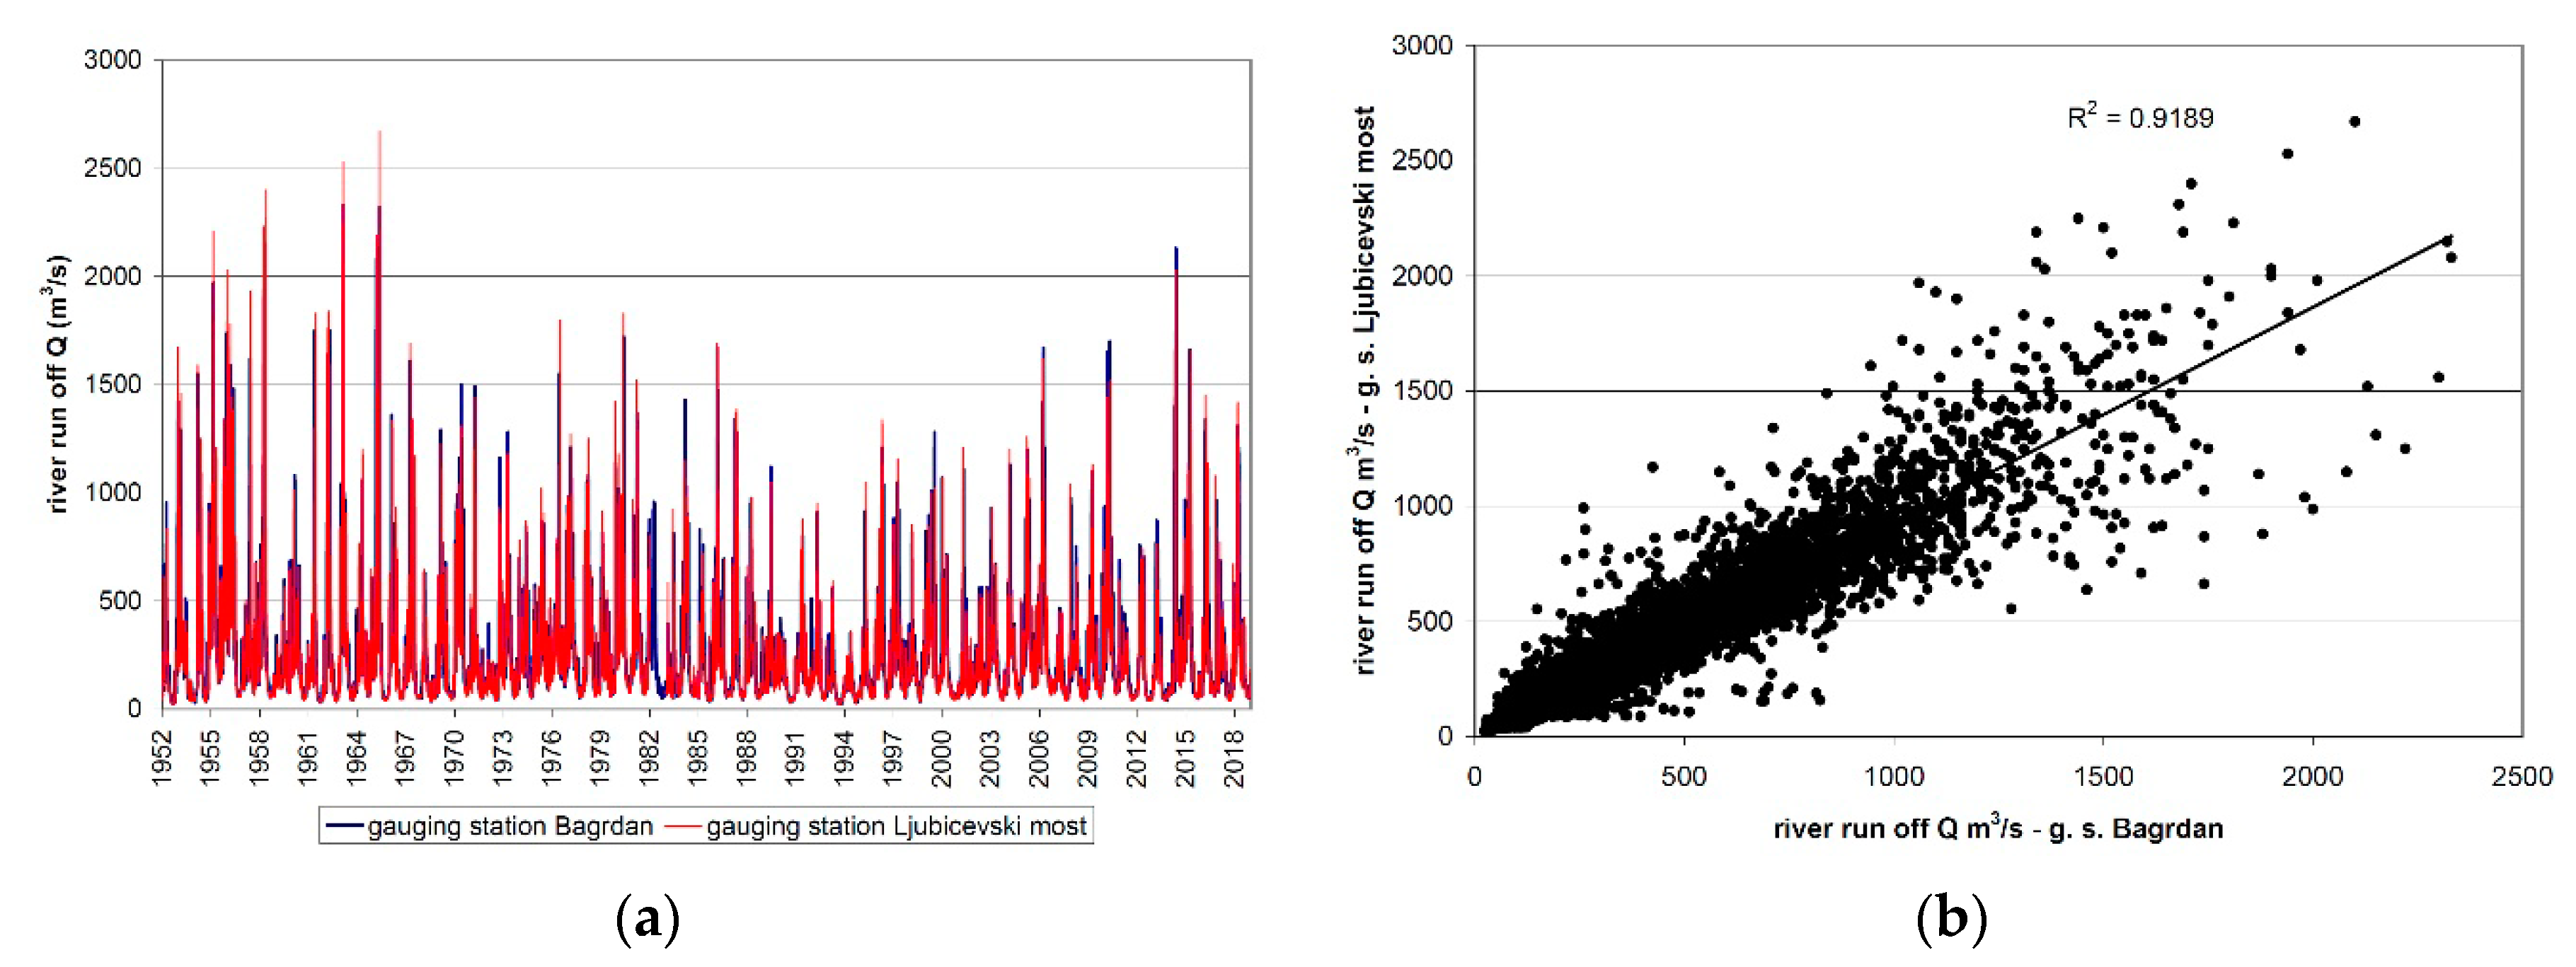
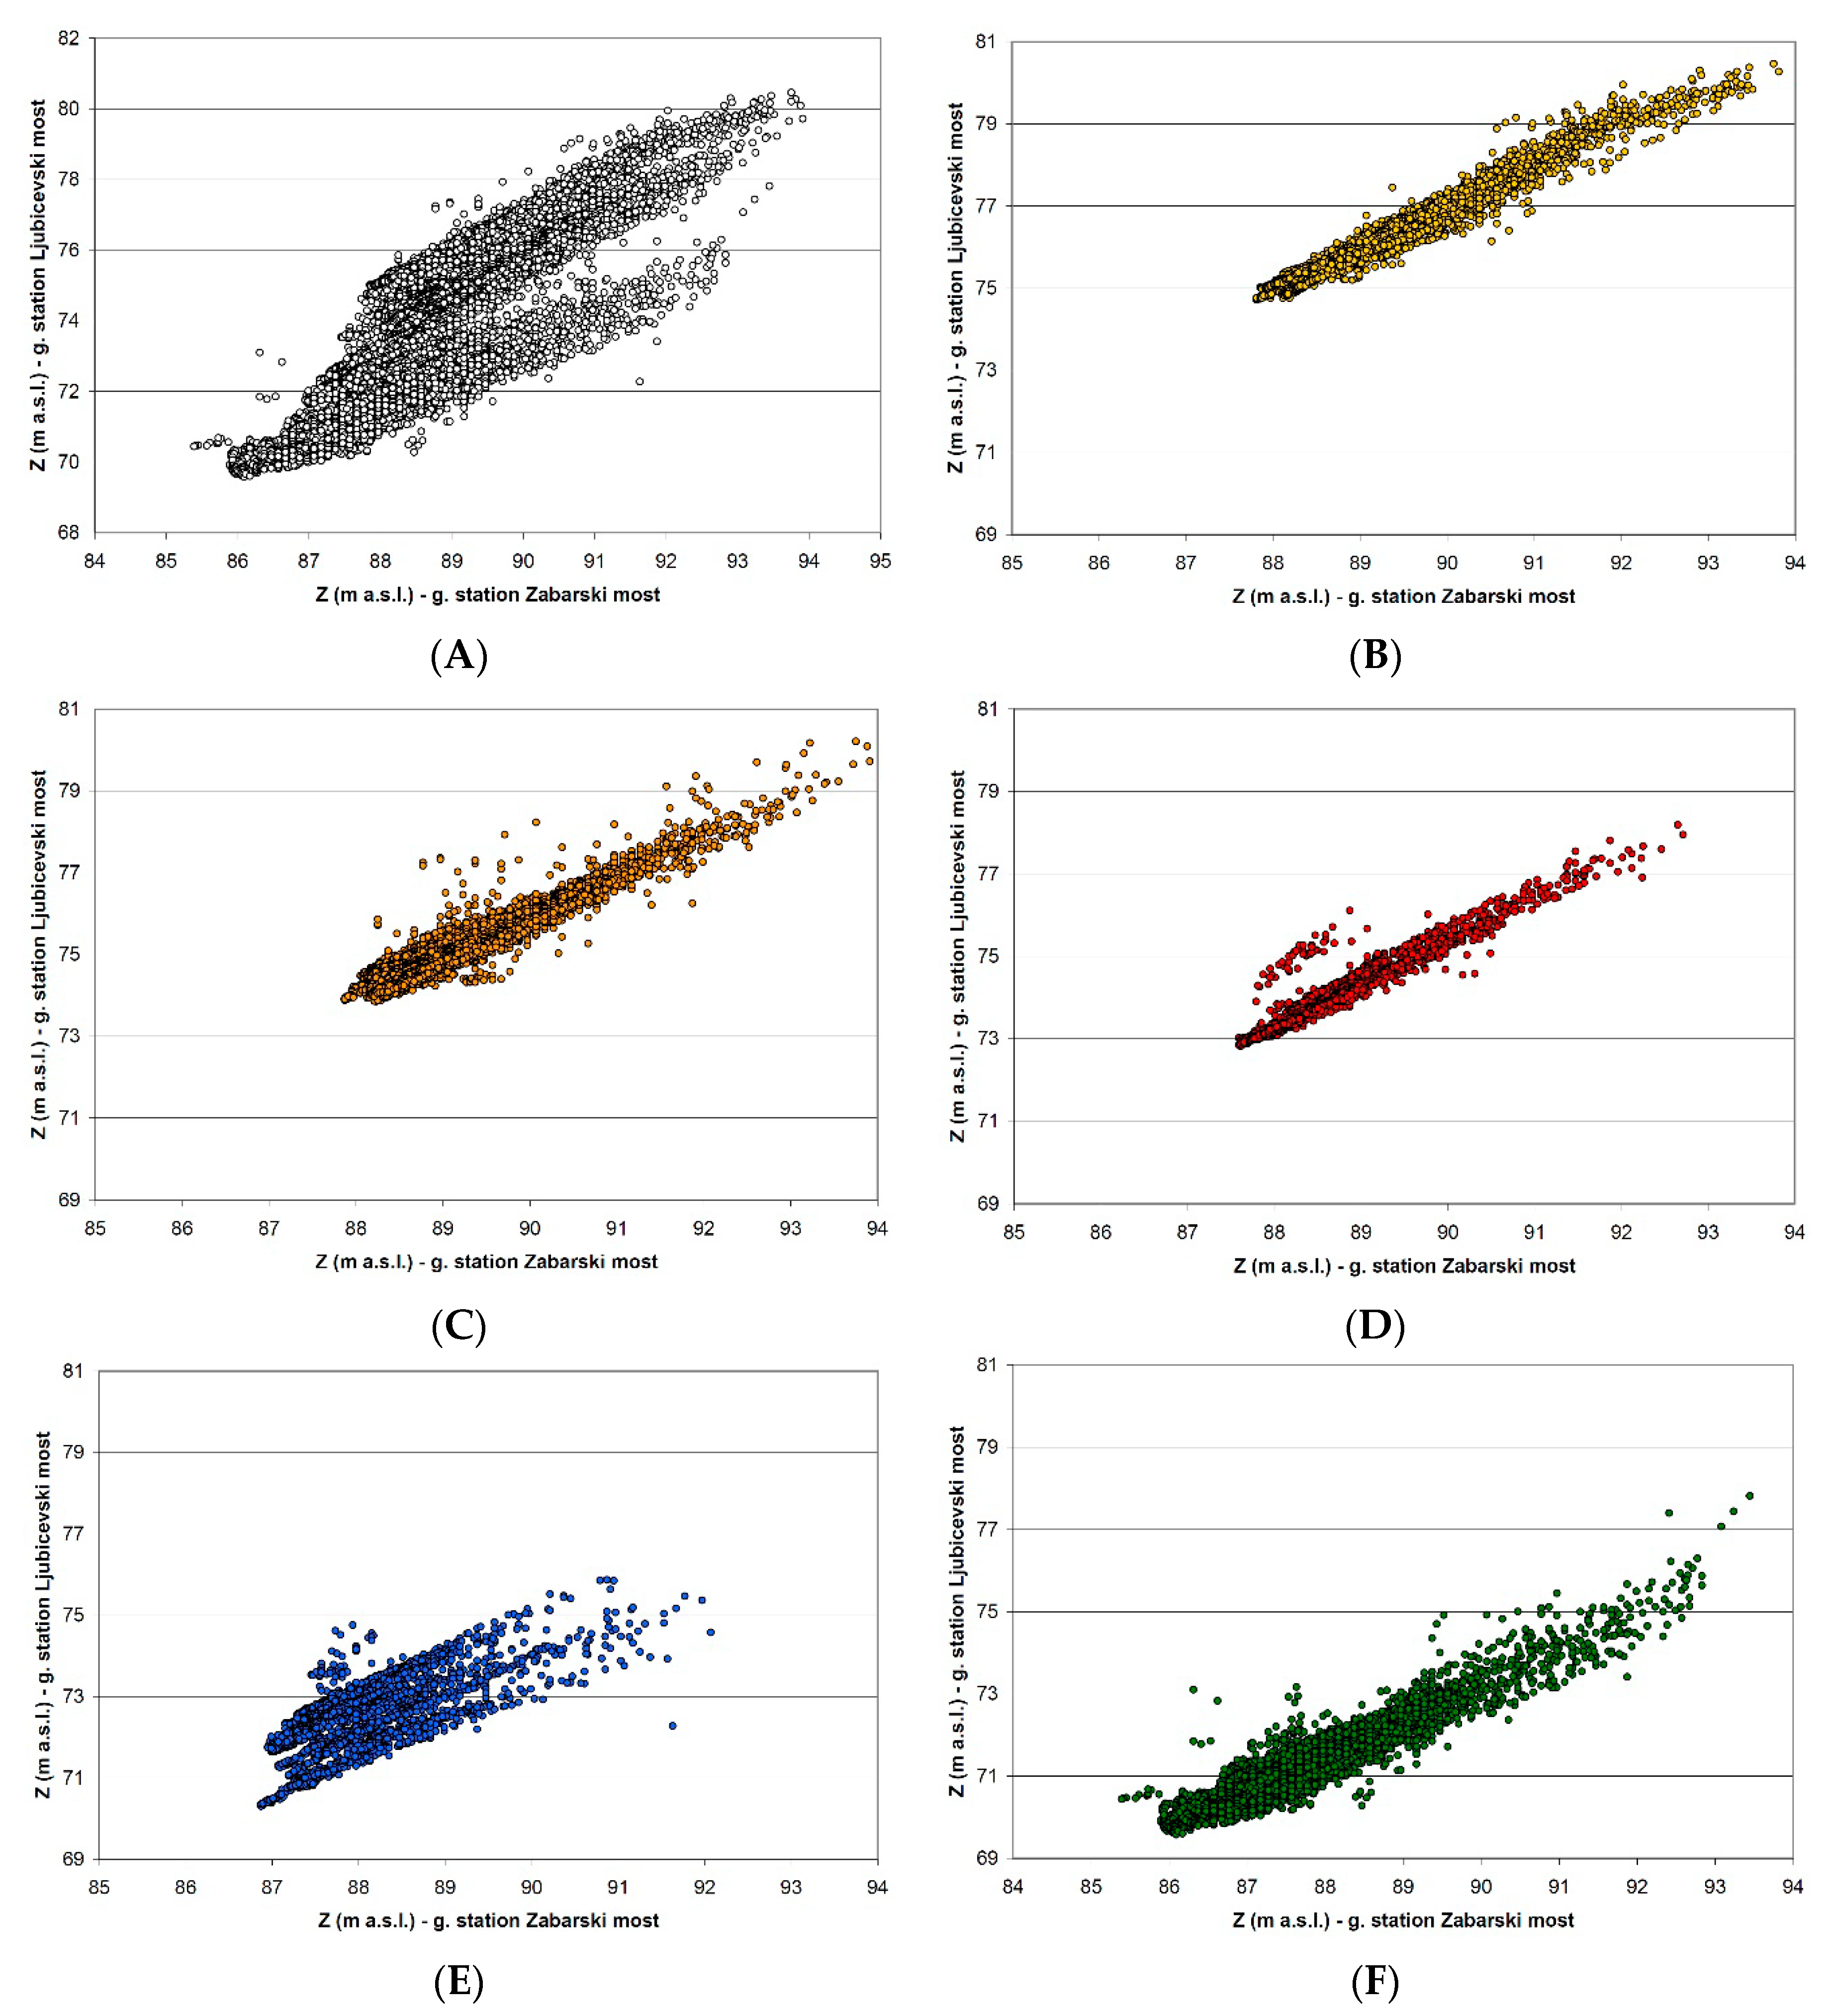
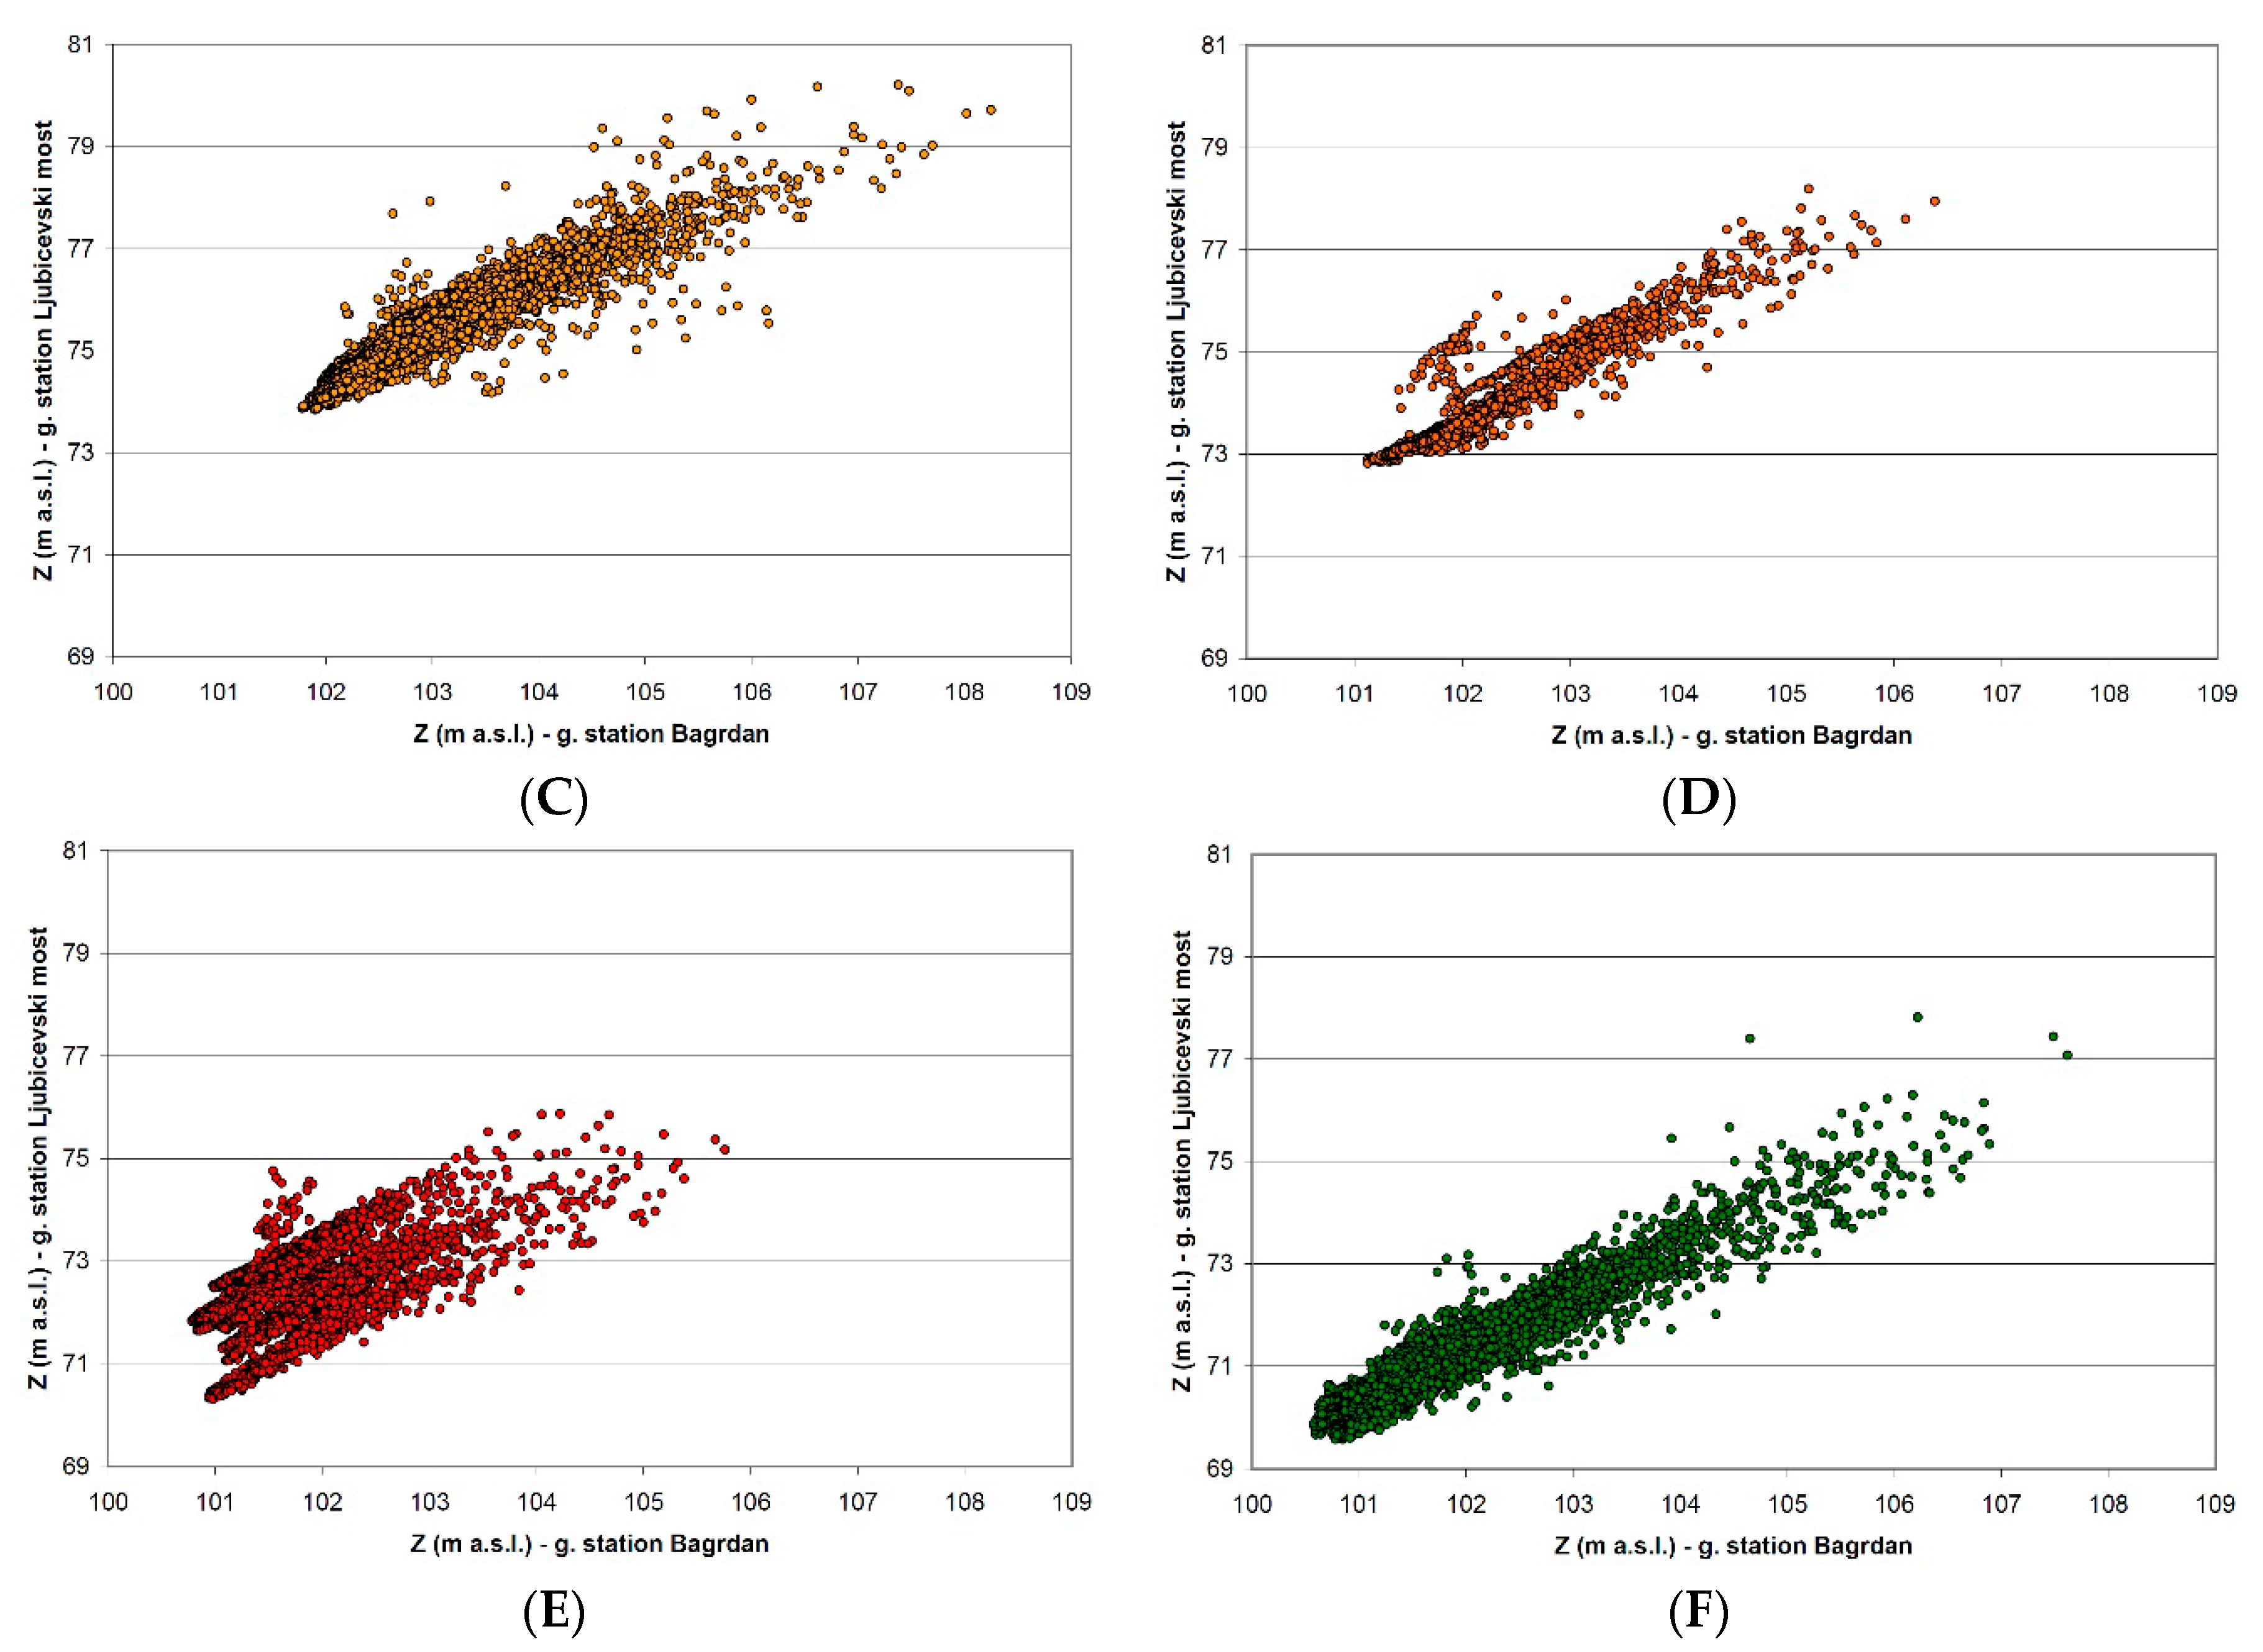
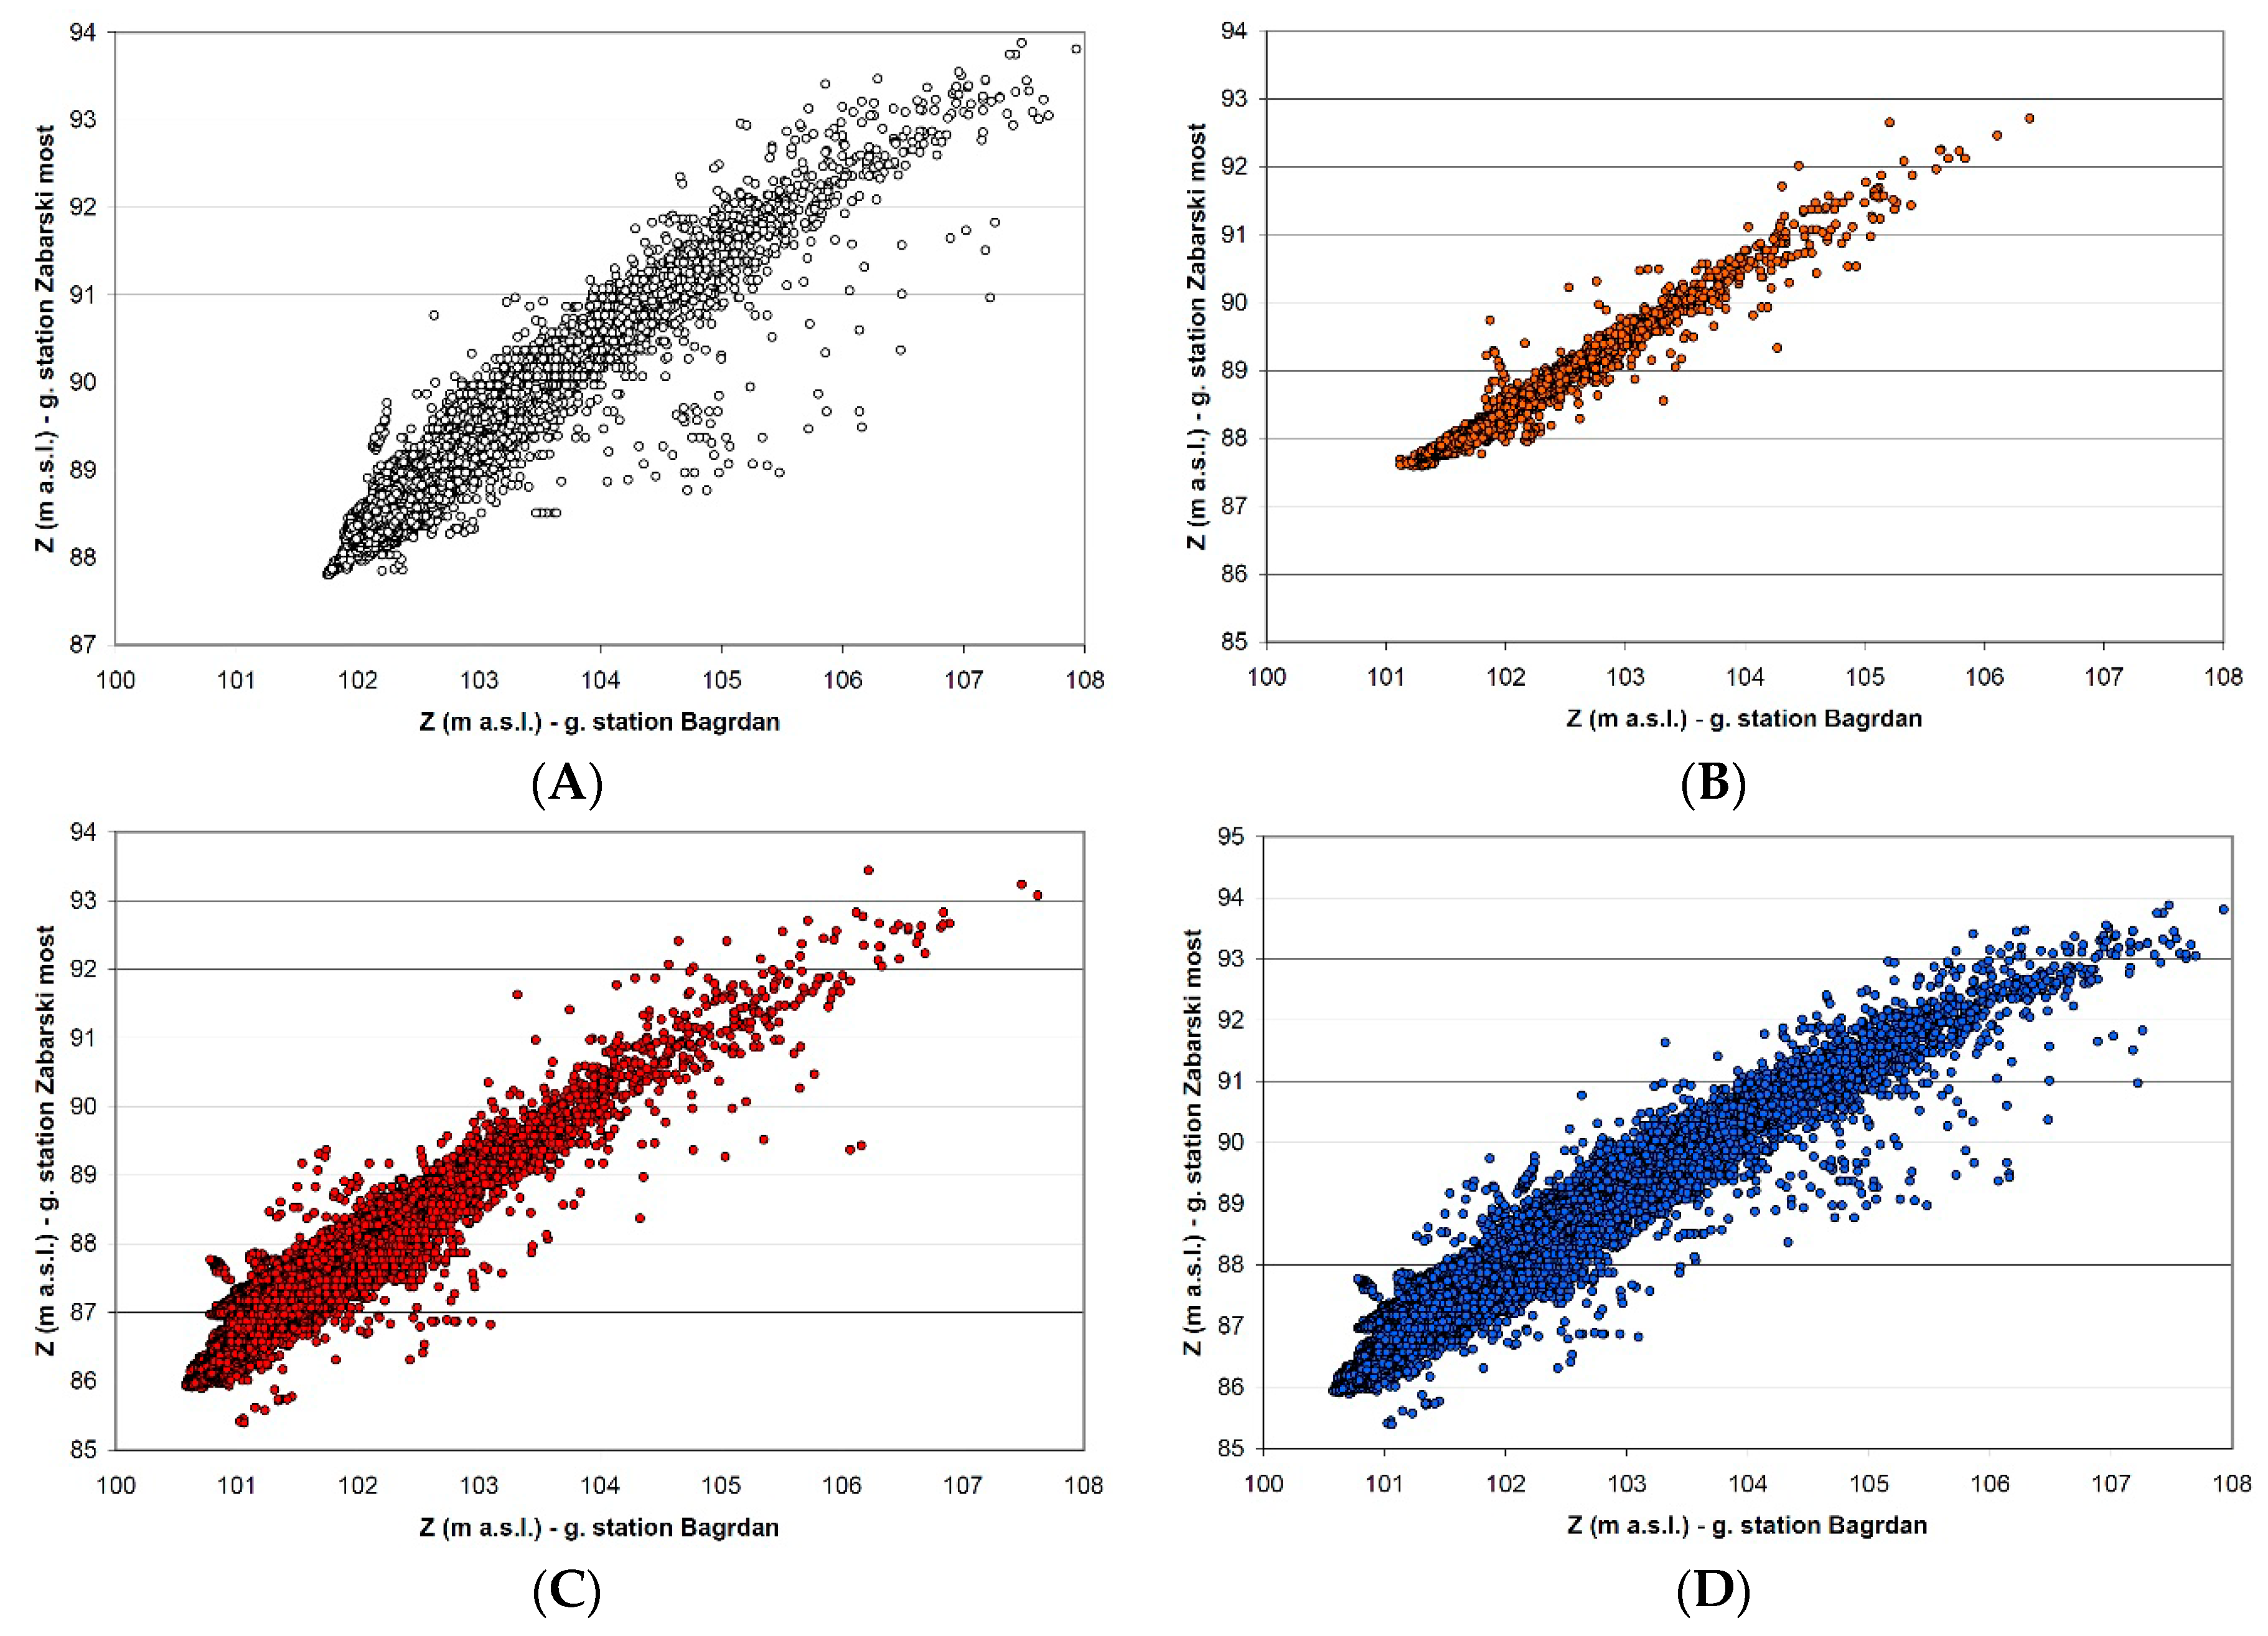
5.1. Analysis of the Surface Water Regime—The Velika Morava River

Based on the above comparative plots of the Velika Morava River stages (Figure 2), it appears that in the early 1980s, there was a slight change in the water level regime at all the gauging stations, especially at Bagrdan. This is a result of the re-alignment of the river channel in the part where the original Bagrdan station used to be. The river channel was re-aligned in 1980 and 1981 when highway E75 was built from Batočina to Ćuprija. After the re-alignment, the Velika Morava established a natural regime.
All of this intensified illegal and uncontrolled sand and gravel mining led to the further deepening of the considered river reach by nearly 4 m. Based on river channel geometry data obtained for the Hydrometeorological Service of Serbia, from 1980 to 2000 the river channel at Ljubičevski Most was ~5 m deeper (Figure 6).
On the other hand, the discharge regime remained unchanged, corroborating that the change/deepening of the river channel along certain reaches was due to natural and anthropogenic causes (Figure 3). This claim is supported by the correlation coefficients shown in Table 3. Even though the discharge regime of the Velika Morava River had not altered (Figure 2 and Figure 3, the correlation coefficient between Bagrdan and Ljubičevski Most was as high as 0.959 in the 1952–2018 period), the correlation coefficients between the water levels of the Velika Morava River differed. Table 3 shows these coefficients for the entire monitoring period (1952–2018).
According to the results in Table 3, the strongest water level correlations were between Bagrdan and Žabarski Most (0.96), suggesting that either the changes occurred synchronously, or the cross-sections had not changed at any of the stations. Conversely, the correlation coefficient between the water levels at Bagrdan and Ljubičevski Most was the lowest, certainly because the cross-section had changed at one of the stations (Ljubičevski Most) as a result of natural factors and/or anthropogenic impact.
For better insight into the changes in certain intervals of the monitoring period, correlation analyses between water levels were undertaken as follows: period I 1952–1962, period II 1963–1981, period III 1982–1989, period IV 1990–1999, and period V 2000–2018. However, in the correlation analysis between the water levels at Bagrdan and Žabarski Most, the 1952–1962 and 1963–1981 intervals were combined into a single period (1952–1981), as were 1990–1999 and 2000–2018 (1990–2018). The reason for this was that the river channel changes at these stations were noted only between 1982 and 1989 (Figure 2, green and red lines). The results of the correlation analyses are shown in Table 3. Comparative plots of the Velika Morava water levels, for the total period and the various intervals, are shown in Figure 7A–F for Ljubičevski Most and Žabarski Most, Figure 8A–F for Ljubičevski Most and Bagrdan, and Figure 9A–D for Žabarski Most and Bagrdan.
It is apparent from Table 3 that the highest correlation coefficients are between the Velika Morava water levels at Bagrdan and Žabarski Most. All the correlation coefficients were greater than 0.946. The highest correlation coefficient (0.98) by time interval was from 1982 to 1989, during which the river channel at Bagrdan was re-aligned. The high coefficient indicates that the re-alignment also affected downstream discharges and that the river channel deepened there as well.
The correlation coefficients between Žabarski Most and Ljubičevski Most were similar, from 0.946 (1963–1981) to 0.981 (1952–1962), except for the 1990–1999 interval (0.687), as were those between Bagrdan and Ljubičevski Most, but the values were lower—from 0.599 (1990–1999) to 0.963 (1952–1962).
Statistical parameters were calculated to establish whether there were any statistically significant changes in water levels (the homogeneity of the observed water level time-series of the Velika Morava was analyzed). These parameters included average values and the standard deviations for the specified time periods. The values are shown in Table 4.
Since the size of the specified samples (periods) was smaller than 30, Student’s t-test was used to analyze the homogeneity of the time-series. The evaluation criterion for average values according to Student’s t-test was as follows:
t = n 1 n 2 ( n 1 + n 2 2 ) n 1 + n 2 X ¯ 1 X ¯ 2 n 1 σ x 1 2 + n 2 σ x 2 2
where:
  • n 1 —size of sample 1 (number of years),
  • n 2 —size of sample 2 (number of years),
  • X ¯ 1 —sample 1 average value,
  • X ¯ 2 —sample 2 average value,
  • σ X 1 —sample 1 standard deviation,
  • σ X 2 —sample 2 standard deviation.
The variable t has Student’s arrangement S ν t with ν = n 1 + n 2 2 degrees of freedom.
The null hypothesis was applied, namely the time-series was homogenous if:
t α 2 < t < t 1 α 2
where α is the significance threshold, in the specific case α = 5 % .
Based on Equation (1), the values of the calculated criterion for Student’s t-test are shown in Table 5.
It is apparent from the results that the examined samples in the considered time periods at Bagrdan and Žabarski Most were homogenous, whereas the results for Ljubičevski Most show that it was necessary to adopt an alternative hypothesis. Namely, the specified samples did not belong to the same population, or, more precisely, the time-series were not homogenous.
Fisher’s F -test was used to test the variance. The criterion for equality of two variances was the F statistic, calculated by applying the following equation:
F = σ 1 2 σ 2 2
taking into account that condition σ 1 > σ 2 must be fulfilled, and if vice versa, then the F statistic was calculated:
F = σ 2 2 σ 1 2
Therefore, the F statistic, which has Fisher’s arrangement with the degrees of freedom calculated as ν 1 = n 1 1 and ν 2 = n 2 1 , always had a value higher than 1.
The null hypothesis was adopted if:
F < F 1 α ν 1 , ν 2
The values obtained by applying Fisher’s F-test are numerically represented in Table 6.
Based on the results, variance testing showed homogenous time-series in all three cases (i.e., the variances were homogenous).

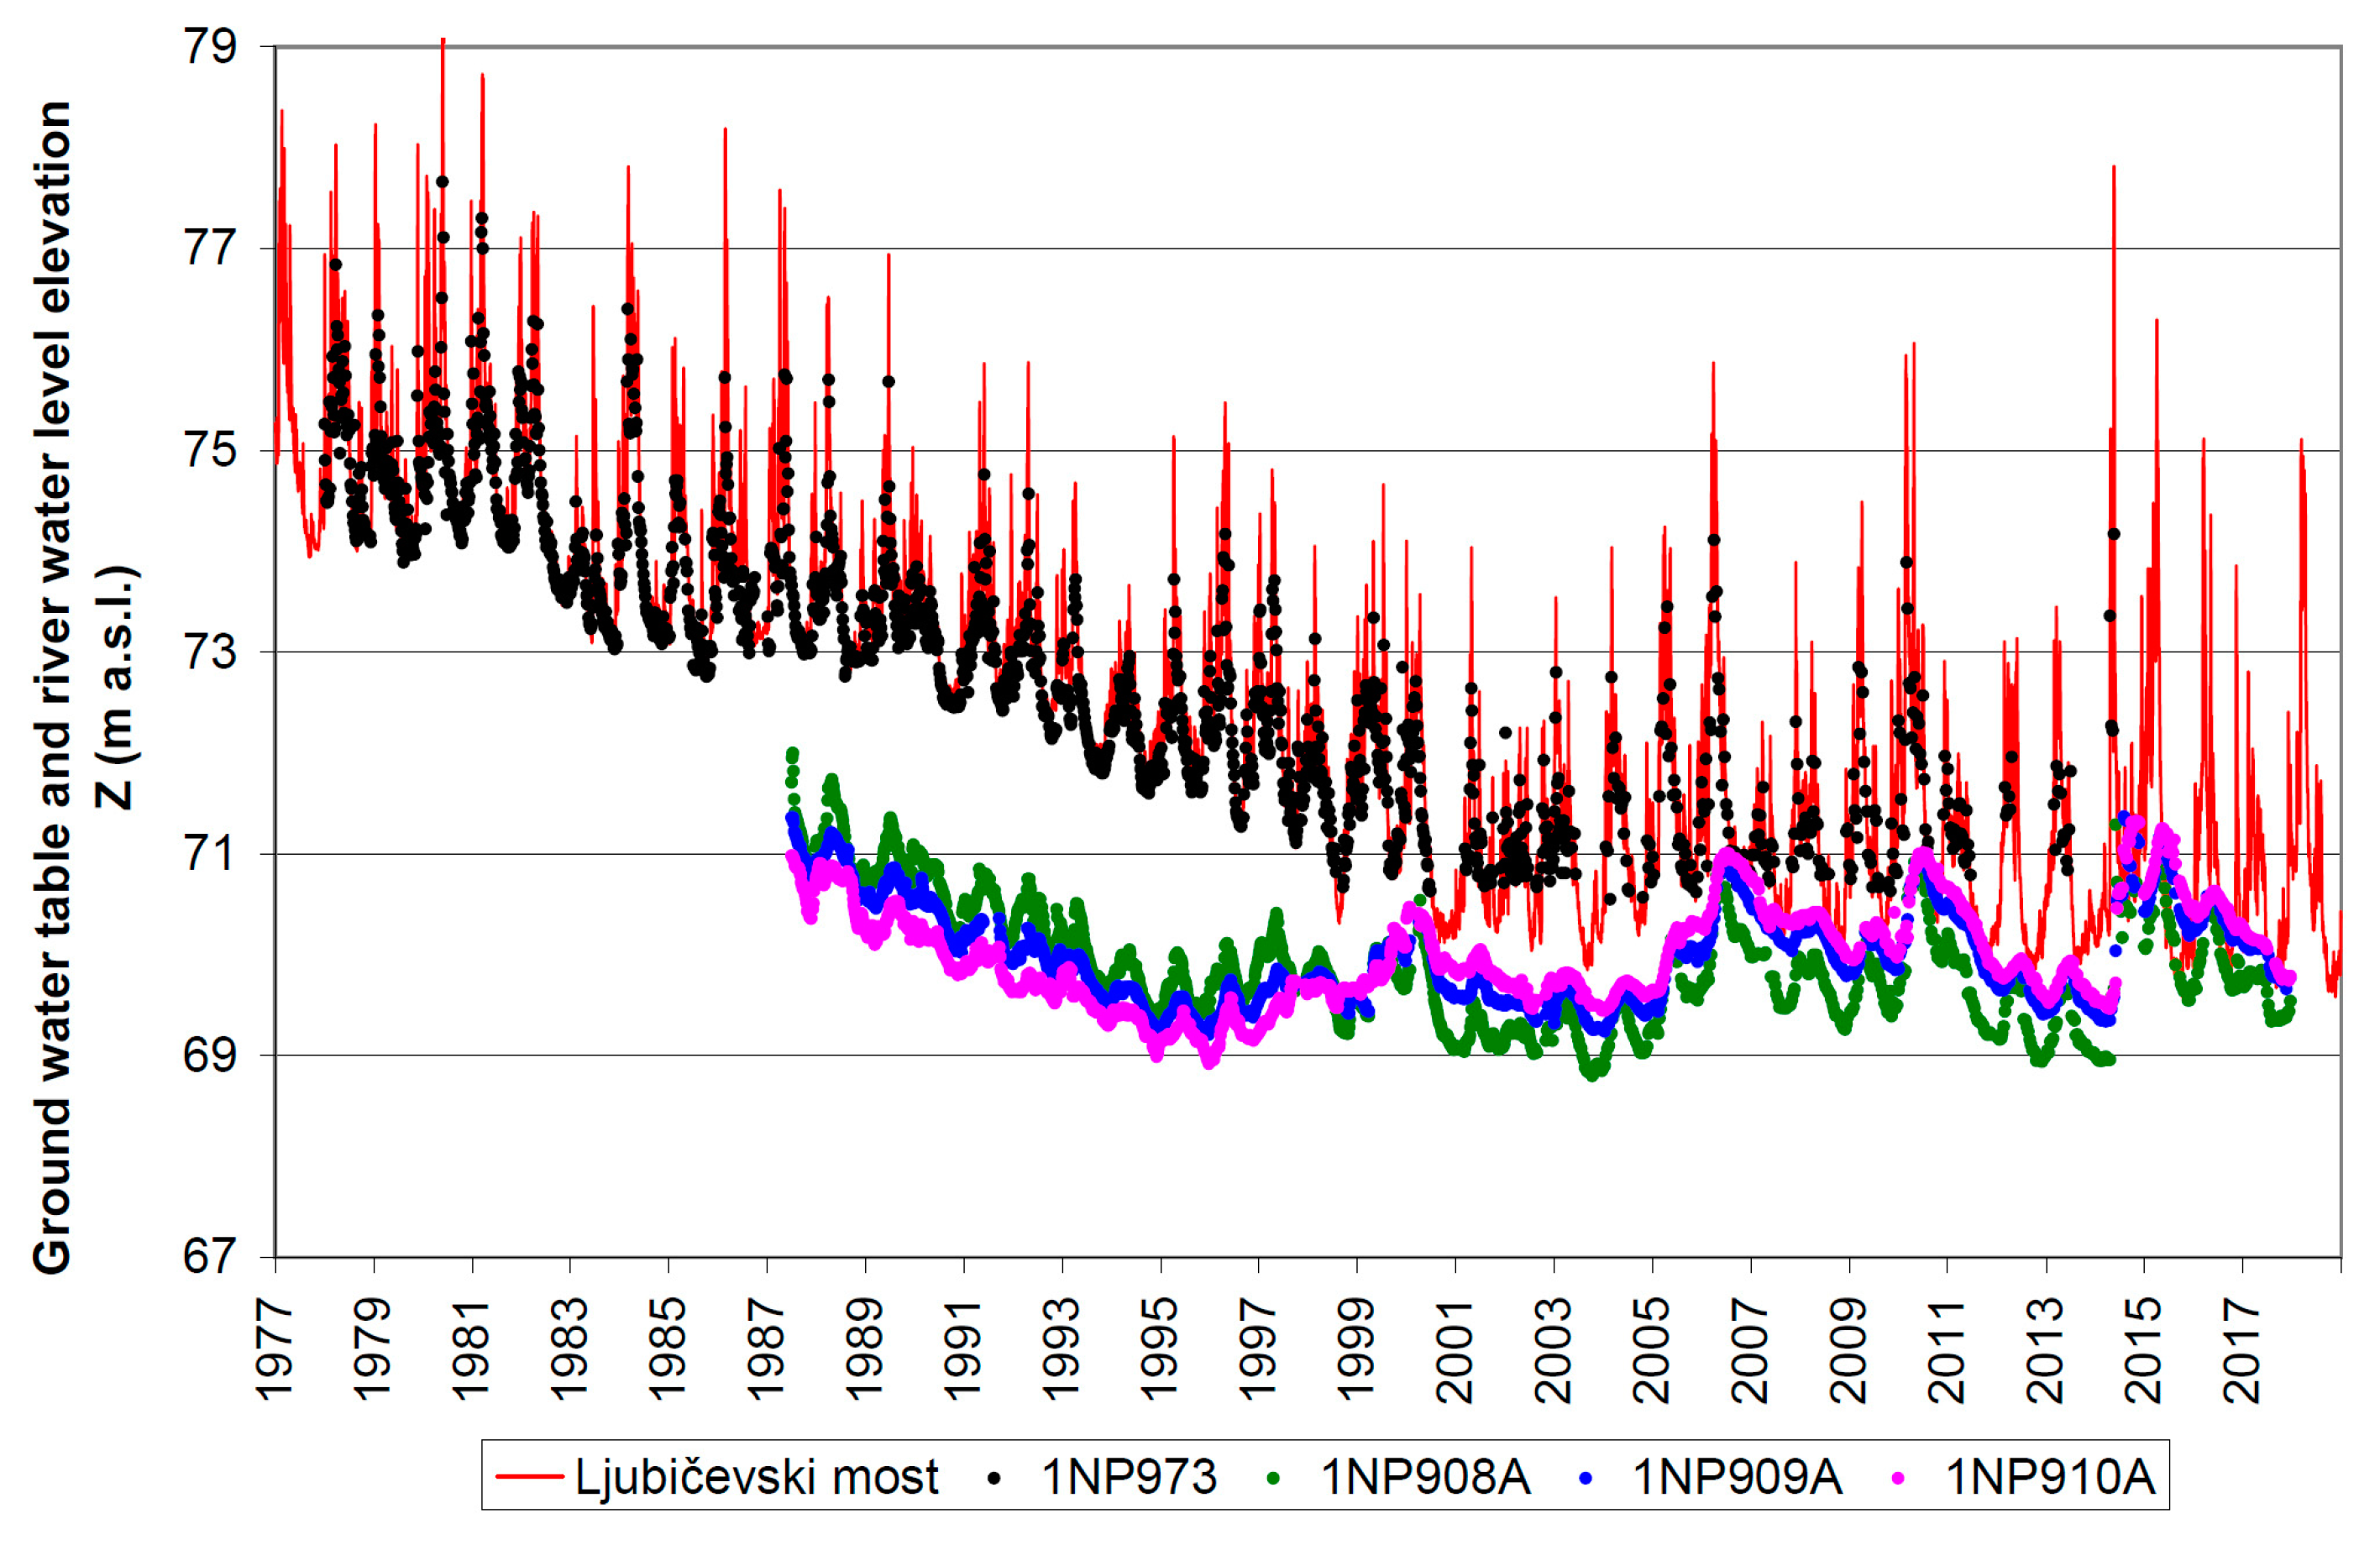
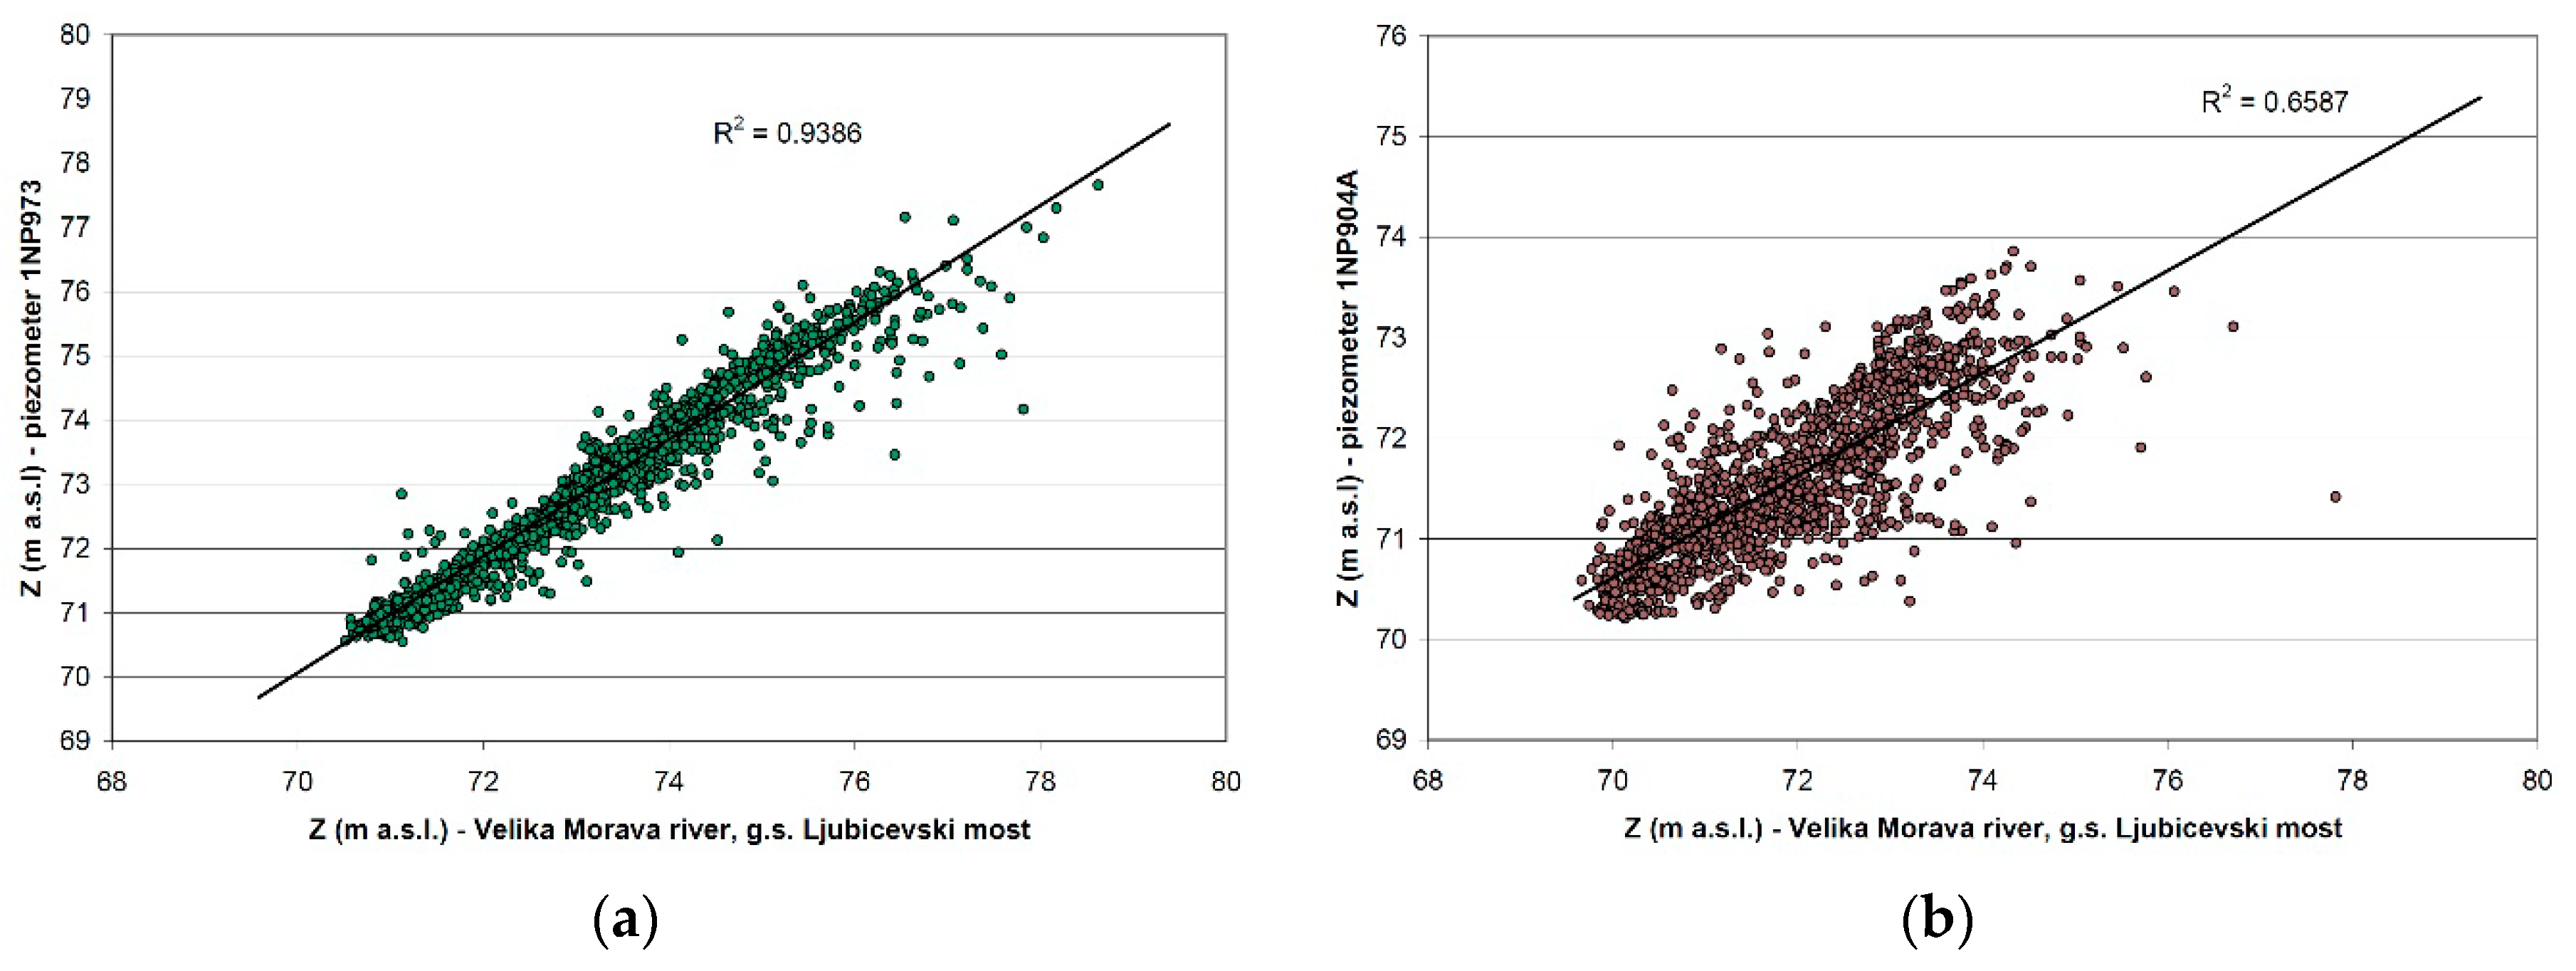
5.2. Analysis of the Groundwater Regime

Given that there is an active hydraulic connection between the Velika Morava River and the alluvial groundwater of the shallow aquifer, lower river stages resulted in reduced groundwater levels. The most significant water level decline of the Velika Morava River was observed at Ljubičevski Most, so the present case study focused on the water table in the immediate vicinity of that gauging station. On the right riverbank, the groundwater levels were monitored at observation well 1NP973, one of the oldest in the area (located at a distance of only 30 m from the river channel, near the gauging station at Ljubičevski Most), as well as observation wells 1NP908A (1160 m from the river) and 1NP909A (2010 m from the river). They all indicated a good hydraulic connection between the Velika Morava and the groundwater.
To clarify the hydraulic connection between the river and the aquifer, Figure 10 and Figure 11 show vertical sections through the Velika Morava at Ljubičevski Most, along with observation wells on the left and right banks. They reflect the years in which the cross-sectional geometry was monitored at Ljubičevski Most. The year 1988 was selected because it preceded intensive sand and gravel mining (1990–2000) (Figure 10), and the year 2008 because it was after the cessation of sand and gravel mining (Figure 11). Both figures show groundwater levels calculated from annual averages by year, as well as extreme circumstances (wet and dry periods).
It is apparent in Figure 10 and Figure 11 that there is a hydraulic connection between the rivers (Velika Morava and Jezava) and the shallow unconfined aquifers within the Velika Morava alluvium. The figures clearly show that on the left side of the river valley, groundwater flows from the Velika Morava and the Jezava to observation well 1NP904A, where the lowest groundwater levels were recorded in 1988. This flow direction was typical of all river discharges (low, medium, and high). However, after the river channel was deepened (e.g., in 2008), the water table in contact with the Velika Morava (observation well 1NP904A) was lowered and the direction of groundwater flow between observation well 1NP904 and the Velika Morava changed. More precisely, Figure 11 clearly shows that the water levels of the Jezava were the highest on the left side of the Velika Morava valley and that groundwater flowed from the Jezava to the Velika Morava (when discharges were low or medium). At flood discharges, the Velika Morava continued to recharge the aquifers in the alluvium, in the river’s immediate proximity (up to 1 km, see Figure 11).
On the right-hand side of the river valley, groundwater flow remained the same, from the river to observation well 1NP908 and onward to observation wells 1NP909A and 1NP910A (Figure 10 and Figure 11). As such, before 1990, groundwater flowed from the Velika Morava to the hinterland. However, as the channel of the Velika Morava deepened and the water table in the immediate vicinity declined, the direction of groundwater flow changed from observation well 1NP910A to observation well 1NP908. Namely, the direction of groundwater flow is now from the hinterland to the river, up to about 1 km from the Velika Morava (up to 1NP908).
Figure 4, Figure 10 and Figure 11 show that the closer the observation well is to the river, the more pronounced the influence of the river stages is. This was corroborated by the correlation coefficients. The highest correlation coefficient was 0.969 (observation well 1NP973), reflecting a near instantaneous increase in groundwater levels in that location (Figure 12a). As the distance of the observation wells from the river increased, the correlation coefficient decreased. At a distance of 1160 m from the Velika Morava River, the connection between surface water and groundwater was weaker (correlation coefficient 0.719); at 2 km, the correlation coefficient was 0.346; and at 2.83 km there was no correlation (r = 0.025). At larger distances, the correlation coefficient became negative. All the observation wells registered a decline in groundwater levels commensurate with the decline in the river stages of the Velika Morava River at Ljubičevski Most. The greatest decrease was registered at observation well 1NP973, where the water table declined by ~4 m from 1977 to 1999. It is safe to say that the drawdown in that area is even greater. However, the depth of observation well 1NP973 is such that it dried out during dry periods and this parameter was not recorded. Consequently, there is no information on the minimum groundwater levels in the respective area. In view of that situation, the impression was that during the periods of low discharges between 2000 and 2014, the groundwater recharged the river and not vice versa. Monitoring of observation well 1NP973 was discontinued in 2014 because it was dry for most of the year. In addition to that observation well, Figure 4 shows that the water table declined at all the considered observation wells by ~2 m.
The correlation coefficients attest to a good hydraulic connection between groundwater and the Velika Morava River. At observation well 1NP904A (910 m from the river), the correlation coefficient between the river stages and the groundwater levels is 0.811 (Figure 12b), and at observation well 1NP974 (1500 m from the river) it is 0.736. There was no correlation (r = 0.021) at observation well 1NP901A. That observation well is located only 200 m from the Jezava River, and good hydraulic connectivity is associated with the Jezava River, not the Velika Morava.

6. Conclusions

The last decade of the 20th century was turbulent in Serbia, often with illegal or uncontrolled economic activity. One such activity was sand and gravel mining from riverbanks and river channels, which have impacted the environment and a number of industries that rely on water resources (public water supply, agriculture, navigation, etc.). In this regard, the paper discussed the impact of illegal and indiscriminate sand and gravel mining on surface water and groundwater dynamics. The presented case study addressed the Velika Morava River, whose river basin occupies 42% of Serbia’s territory. The Velika Morava River is Serbia’s largest domestic river, discharging 300 m3/s of water into the Danube River in the city of Smederevo. The lower course of the Velika Morava forms a wide alluvial plain, where the population density is relatively high and there is intensive farming. Public water supply and irrigation rely on groundwater. This water resource is renewable because of a good hydraulic connection between the Velika Morava and the shallow unconfined aquifer. At some 20 km from the mouth of the Velika Morava, in the Ljubičevski Most (Ljubičevo Bridge) area, the Velika Morava and the Jezava rivers are the primary sources of aquifer recharge. The Jezava flows left of and parallel to the Velika Morava, at a distance of 6–7 km. Groundwater flow used to be from the rivers to the hinterland (right-hand side of the valley).
Sand and gravel mining intensified in the 1990s and was unfortunately uncontrolled and largely illegal. The end result of this activity over a period of ten years was the deepening of the Velika Morava channel by about 4 m, and consequently the commensurate lowering of the river water levels. Because of the good hydraulic connection with groundwater, the water table of the shallow aquifer close to the Velika Morava also declined by about 4 m (at observation well NP973). In view of all the above, the direction of groundwater flow changed in some areas. On the right-hand side of the valley, the groundwater levels at about 1 km from the Velika Morave are now lower than those in the hinterland, such that groundwater from there flows to the Velika Morava (up to 1 km from the river). On the left side of the valley, based on recorded levels, groundwater flows from the Jezava to the Velika Morava at average and low river discharges. Water levels of the Velika Morava are higher than the water table only during flood discharges, at which time aquifer recharge comes from the river.
Many shallow wells (5–10 m) in this part of the study area, used for farmland irrigation, run dry during dry periods, which was an additional challenge for farmers. The public water supply situation was similar. The capacity of water wells decreased and groundwater quality deteriorated. More specifically, intensive farming in the area relies on pesticides, insecticides, and fertilizers, which affected groundwater quality, although the monitored parameters had never exceeded threshold values. However, a nitrate problem became evident in the 1990s, with concentrations in some samples as high as 120 mg/l [38]. This was caused by reduced groundwater reserves due to the lowering of the water table, causing nitrate concentrations to rise even though the nitrogen content of the soil had not increased. The change in groundwater flow direction was a factor that further aggravated groundwater quality, leading to the decommissioning of certain public water supply sources (such as Ključ in the city of Požarevac) [39].
The lowering of the Velika Morava water level and the water table by 1.5 m in the alluvial plain of the Velika Morava (according to the state hydrogeological map of Požarevac and data from 1975 to 1985) has resulted in estimated groundwater “losses” of 150.5 × 10⁶ m3 (16.5%), compared to estimated permanent reserves of 756 × 106 m3 [40]. With that in mind, and considering the additional drawdown of 3.5–4 m in the 1990s, the shallow aquifer is threatened in terms of both reduced groundwater reserves and groundwater quality in this part of the Velika Morava alluvium, caused by anthropogenic factors.
The reduced water levels of the Velika Moraa at Ljubičevski Most, unlike at upstream gauging stations, has increased gradients and enhanced erosion along the upstream course of the Velika Morava, which further deepens the river channel of the Velika Morava, as well as of its tributaries.
From the point of view of national defense, the disturbance of the riparian area caused in this specific instance by uncontrolled gravel and sand mining is hindering national defense capabilities against natural disasters, primarily floods. Besides flood management itself, excavation has created depressions in the riparian belt, which are filled with water when the work is completed, forming ponds or small lakes. They impede access to areas affected by a natural disaster. All of this also hinders the possibility of timely response and engagement of search and rescue forces. One of the missions of the Serbian Armed Forces and River Flotilla, as part of the national defense system, is to provide assistance to the population in the event of natural disasters, such as floods. Altered riverbanks hinder access and assistance.
In closing, it should be noted that gravel and sand mining is a major environmental problem in riparian areas, disturbing the entire biosphere and damaging the environment.
The results of the case study showed that over the past 20 years (specifically from 2000 to 2018), the channel of the Velika Morava River had not deepened any further because sand and gravel extraction was prohibited in the study area after the Regulation on Establishing River Sediment Extraction Plans was adopted in 2021 [41]. This was a positive step. However, sand and gravel mining should not be stopped in general, but rather need to be controlled so that the adverse effects discussed in this paper are avoided.

Author Contributions

Conceptualization, D.P.; Methodology, V.R.V. and D.B.; Resources, J.N.; Writing—original draft, M.K.; Writing—review & editing, V.R.V. and B.V., Supervision, D.T. All authors have read and agreed to the published version of the manuscript.

Funding

This research received no external funding.

Data Availability Statement

The data presented in this study are available on request from the corresponding author.

Conflicts of Interest

The authors declare no conflict of interest.

References

  1. RZSS; Statistical office of the Republic of Serbia, Belgrade. Comparative Overview of the Number of Inhabitants 1948, 1953, 1961, 1971, 1981, 1991, 2002 and 2011; RZSS: Belgrade, Serbia, 2014. [Google Scholar]
  2. Urošev, M. Hydrological Droughts in the Velika Morava Basin. Ph.D. Thesis, Department of Geography, Tourism and Hotel Management, Faculty of Sciences, University of Novi Sad, Novi Sad, Serbia, 2016; pp. 1–159. [Google Scholar]
  3. Bjelajac, Ž.; Dukić-Mijatović, M.; Počuča, M. Dunav-reka saradnje i afirmacije bezbednosti, zaštite životne sredine i privrednog razvoja”, The 21st International Scientific Conference “Danube—River of Cooperation” The Role of Civil Society in Promotion of the Danube Basin Potential in the Light of the EU Strategy for Danube Region. In Institute of International Politics and Economics International Scientific Forum “Danube—River of Cooperation”, Belgrade, Serbia; Institute of International Politics and Economics and International Scientific FOrmu “Danube—River of Cooperation”: Belgrade, Serbia, 2011; pp. 43–55. ISBN 978-86-7067-161-4. [Google Scholar]
  4. Simić, V.; Bănăduc, D.; Curtean-Bănăduc, A.; Petrović, A.; Veličković, T.; Stojković-Piperac, M.; Simić, S. Assessment of the ecological sustainability of river basins based on the modified the ESHIPPOfish model on the example of the Velika Morava basin (Serbia, Central Balkans). Front. Environ. Sci. 2022, 10, 952692. [Google Scholar] [CrossRef]
  5. Government of the Republic of Serbia. Report on the Natural Disaster—Floods that Struck the Republic of Serbia and Measures Taken to Rescue the Population and Defend Endangered Areas from Floods; Government of the Republic of Serbia: Belgrade, Serbia, 2014.
  6. Macháček, J. Typology of Environmental Impacts of Artisinal and Small-Scale Mining in African Great Lakes Region. Sustainability 2019, 11, 3027. [Google Scholar] [CrossRef] [Green Version]
  7. Hilson, G.M. The Future of Small-scale mining: Environmental and socioeconomic perspectives. Futures 2002, 34, 863–872. [Google Scholar] [CrossRef]
  8. Hilson, G. The Socio-Economic Impacts of Artisanal and Small-Scale Mining in Developing Countries, 1st ed.; Taylor & Francis: London, UK, 2003; ISBN 1135291225. [Google Scholar]
  9. Byizigiro, R.V.; Raab, T.; Maurer, T. Small-scale opencast mining: An important research field for anthropogenic geomorphology. Die Erde 2015, 146, 213–231.49. [Google Scholar]
  10. Jones, D.K.C. The Evolution of Hillslope Processes. In Geomorphological Processes and Landscape Change; Blackwell Publishers Ltd.: Oxford, UK, 2001; pp. 61–89. [Google Scholar]
  11. Kihampa, C.; Wenaty, A. Impact of Mining and Farming activities on Water and Sediment Quality of the Mara river basin, Tanzania. Res. J. Chem. Sci. 2013, 3, 15–24. [Google Scholar]
  12. Nelson, A.D.; Church, M. Placer mining along the Fraser River, British Columbia: The geomorphic impact. Geol. Soc. Am. Bull. 2012, 124, 1212–1228. [Google Scholar] [CrossRef] [Green Version]
  13. Piyadasa, R.U.K. Sediment Problems and Sediment Management in Asian River Basins, Proceedings of the Workshop Held at Hyderabad, India; IAHS Publication: Wallingford, UK, 2009; Volume 349. [Google Scholar]
  14. Pitchaiah, P.S. Impacts of Sand Mining on Environment—A Review. Int. J. Geo Inform. Geol. Sci. 2017, 4, 2393–9206. [Google Scholar]
  15. Amponsah-Dacosta, F.; Mathada, H. Study of Sand Mining and Related Environmental Problems along the Nzhelele River in Limpopo Province of South Africa. In Mine Water and Circular Economy; Wolkersdorfer, C., Sartz, L., Sillanpää, M., Häkkinen, A., Eds.; IMWA: Lakewood, CO, USA, 2017; pp. 1259–1266. [Google Scholar]
  16. Liu, J.; Cao, G.; Zheng, C. Sustainability of Groundwater Resources in the North China Plain. In Sustaining Groundwater Resources; Jones, J.A.A., Ed.; Springer: Berlin/Heidelberg, Germany, 2011. [Google Scholar] [CrossRef]
  17. Zhang, Y.; Zhou, A.; Zhou, J.; Liu, C.; Cai, H.; Liu, Y.; Xu, W. Evaluating the Sources and Fate of Nitrate in the Alluvial Aquifers in the Shijiazhuang Rural and Suburban Area, China: Hydrochemical and Multi-Isotopic Approaches. Water 2015, 7, 1515–1537. [Google Scholar] [CrossRef] [Green Version]
  18. Brunner, P.; Cook, P.G.; Simmons, C.T. Disconnected surface water and groundwater: From theory to practice. Ground Water 2011, 49, 460–467. [Google Scholar] [CrossRef] [Green Version]
  19. Frei, S.; Fleckenstein, J.H.; Kollet, S.; Maxwell, R.M. Patterns and dynamics of river–aquifer exchange with variably-saturated flow using a fully-coupled model. J. Hydrol. 2009, 375, 383–393. [Google Scholar] [CrossRef]
  20. Kotowski, T.; Najman, J.; Nowobilska-Luberda, A.; Bergel, T.; Kaczor, G. Analysis of the interaction between surface water and groundwater using gaseous tracers in a dynamic test at a riverbank filtration intake. Hydrol. Process. 2023, 37, e14862. [Google Scholar] [CrossRef]
  21. Saravanan, S.P.; Desmet, M.; Neelakanta Pillai Kanniperumal, A.; Ramasamy, S.; Shumskikh, N.; Grosbois, C. Geochemical Footprint of Megacities on River Sediments: A Case Study of the Fourth Most Populous Area in India, Chennai. Minerals 2019, 9, 688. [Google Scholar] [CrossRef] [Green Version]
  22. Aguilar Pesantes, A.; Peña Carpio, E.; Vitvar, T.; María Mahamud López, M.; Menéndez-Aguado, J.M. A Multi-Index Analysis Approach to Heavy Metal Pollution Assessment in River Sediments in the Ponce Enríquez Area, Ecuador. Water 2019, 11, 590. [Google Scholar] [CrossRef] [Green Version]
  23. Čmelík, J.; Brovdyová, T.; Trögl, J.; Neruda, M.; Kadlečík, M.; Pacina, J.; Popelka, J.; Sirotkin, A.S. Changes in the Content of Heavy Metals in Bílina River during 2012–2017: Effects of Flood and Industrial Inputs. Water 2019, 11, 481. [Google Scholar] [CrossRef] [Green Version]
  24. Wrzesiński, D.; Sobkowiak, L. Transformation of the Flow Regime of a Large Allochthonous River in Central Europe—An Example of the Vistula River in Poland. Water 2020, 12, 507. [Google Scholar] [CrossRef] [Green Version]
  25. Abebe, W.B.; Tilahun, S.A.; Moges, M.M.; Wondie, A.; Derseh, M.G.; Nigatu, T.A.; Mhiret, D.A.; Steenhuis, T.S.; Camp, M.V.; Walraevens, K.; et al. Hydrological Foundation as a Basis for a Holistic Environmental Flow Assessment of Tropical Highland Rivers in Ethiopia. Water 2020, 12, 547. [Google Scholar] [CrossRef] [Green Version]
  26. Rempel, L.L.; Church, M. Physical and ecological response to disturbance by gravel mining in a large alluvial river. Can. J. Fish. Aquat. Sci. 2009, 66, 52–71. [Google Scholar] [CrossRef]
  27. Zhang, J.; Huang, T.; Chen, L.; Liu, X.; Zhu, L.; Feng, L.; Yang, Y. Water-Exchange Response of Downstream River–Lake System to the Flow Regulation of the Three Gorges Reservoir, China. Water 2019, 11, 2394. [Google Scholar] [CrossRef] [Green Version]
  28. Wang, W.; Oswald, S.E.; Gräff, T.; Lensing, H.J.; Liu, T.; Strasser, D.; Munz, M. Impact of river reconstruction on groundwater flow during bank filtration assessed by transient three-dimensional modelling of flow and heat transport. Hydrogeol. J. 2019, 28, 723–743. [Google Scholar] [CrossRef] [Green Version]
  29. Braud, I.; Breil, P.; Thollet, F.; Lagouy, M.; Branger, F.; Jacqueminet, C.; Kermadi, S.; Michel, K. Evidence of the impact of urbanization on the hydrological regime of a medium-sized periurban catchment in France. J. Hydrol. 2013, 485, 5–23. [Google Scholar] [CrossRef] [Green Version]
  30. Wang, Z.; Zhang, H.; Garzanti, E.; Nie, J.; Peng, W.; Andò, S.; Hu, X.; Pan, B.; Pfaff, K. Evolution of the Upper Yellow River as Revealed by Changes in Heavy-Mineral and Geochemical (REE) Signatures of Fluvial Terraces (Lanzhou, China). Minerals 2019, 9, 603. [Google Scholar] [CrossRef] [Green Version]
  31. Llena, M.; Vericat, D.; Martínez-Casasnovas, J.A.; Smith, M. Geomorphic responses to multi-scale disturbances in a mountain river: A century of observations. Catena 2019, accepted. [Google Scholar]
  32. Zhu, G.F.; Su, Y.H.; Feng, Q. The hydrochemical characteristics and evolution of groundwater and surface water in the Heihe River Basin, northwest China. Hydrogeol. J. 2008, 16, 167–182. [Google Scholar] [CrossRef]
  33. Mrokowska, M.M.; Rowiński, P.M. Impact of Unsteady Flow Events on Bedload Transport: A Review of Laboratory Experiments. Water 2019, 11, 907. [Google Scholar] [CrossRef] [Green Version]
  34. Google Maps. Europe. 2023. Available online: https://www.google.com/maps/place/Great+Morava/@44.2043754,20.6671265,9z/data=!3m1!4b1!4m6!3m5!1s0x47508d41636cad5d:0x77e10775345770bc!8m2!3d44.2042121!4d21.1585618!16zL20vMDQzbTMz?hl=en (accessed on 13 March 2023).
  35. Ristić Vakanjac, V.; Nikolić, J.; Vakanjac, B.; Polomčić, D.; Bajić, D.; Čokorilo Ilić, M.; Kresojević, M. Surface water flow as impacted by sand and gravel mining: Case study of the Velika Morava River, Serbia. In Proceedings of the 7th International Symposium Mining and Environmental Protection, MEP 19, Vrdnik, Serbia, 15–28 September 2019; pp. 203–210. [Google Scholar]
  36. RHMZ. Republic Hydrometeorological Service of Serbia. 2023. Available online: https://www.hidmet.gov.rs/index_eng.php (accessed on 15 March 2023).
  37. Available online: Glen, S. “Correlation Coefficient: Simple Definition, Formula, Easy Steps” From StatisticsHowTo.com: Elementary Statistics for the rest of us! Available online: https://www.statisticshowto.com/probability-and-statistics/correlation-coefficient-formula/ (accessed on 10 July 2023).
  38. Stepanović, M.; Bajić., D.; Polomčić, D.; Avramović, A.; Mijatović, B. Kvalitativne Karakteristike Podzemnih Voda Izvorišta „Ključ“ u Požarevcu. In XVI Srpski Hidrogeološki Simpozijum sa Međunarodnim Učešćem; Univerzitet u Beogradu, Rudarsko-geološki fakultet: Beograd, Serbia, 2022; pp. 495–500. [Google Scholar]
  39. Popović, L.; Popović., Z.; Ristić Vakanjac, V.; Vakanjac, B.; Mandić, M. Trenutno stanje i moguće posledice nekontrolisane eksploatacije šljunka po životnu sredinu i vodosnabdevanje—Primer Velike Morave. In XV Srpski Hidrogeološki Simpozijum Sa Međunarodnim Učešćem; Univerzitet u Beogradu, Rudarsko-geološki fakultet: Beograd, Serbia, 2014; pp. 435–440. [Google Scholar]
  40. Marković, D. Tumač-a za Osnovnu Hidrogeološku Kartu Republike Srbije, List Požarevac 1:100,000; Geološki zavod Srbije: Beograd, Serbia, (revidovana verzija).
  41. Official Gazette of the Republic of Serbia. The Rulebook on the Establishment of the River Sediments Extraction Plan; Official Gazette of the Republic of Serbia: Belgrade, Serbia, 2021. [Google Scholar]
Figure 1. The Velika Morava River and the location of the gauging stations [34,35].
Water 15 02654 g001
Figure 2. Velika Morava River water levels at Ljubičevski Most, Žabarski Most, and Bagrdan (1952–2018).
Water 15 02654 g002
Figure 3. (a) Hydrographs of the Velika Morava River at Ljubičevski Most and Bagrdan from 1952 to 2018; and (b) correlation between discharges observed at Ljubičevski Most and Bagrdan (1952–2018).
Water 15 02654 g003
Figure 4. Velika Morava River water levels at Ljubičevski Most and groundwater levels at the observation wells on the right bank (1977–2018).
Water 15 02654 g004
Figure 5. Velika Morava River water levels at Ljubičevski Most and groundwater levels at the observation wells on the left bank (1977–2018).
Water 15 02654 g005
Figure 6. Elevations of the Velika Morava riverbed at Ljubičevski Most (1986–2008).
Water 15 02654 g006
Figure 7. Water levels of the Velika Morava River at Ljubičevski Most vs. Žabarski Most: (A)—total period, (B) 1952–1962, (C) 1963–1981, (D) 1982–1989, (E) 1990–1999, and (F) 2000–2018.
Water 15 02654 g007
Figure 8. Water levels of the Velika Morava River at Ljubičevski Most vs. Bagrdan: (A)—total period, (B) 1952–1962, (C) 1963–1981, (D) 1982–1989, (E) 1990–1999, and (F) 2000–2018.
Water 15 02654 g008aWater 15 02654 g008b
Figure 9. Water levels of the Velika Morava River at Bagrdan vs. Žabarski Most: (A)—total period, (B) 1952–1981, (C) 1982–1989, and (D) 1990–2018.
Water 15 02654 g009
Figure 10. Hydrogeological section at the Ljubičevski Most gauging station, including observation wells on the left and right banks. Groundwater levels reflect the calculated annual averages for 1988 (dark blue line) and extreme situations (flood discharges red line and dry period white line).
Water 15 02654 g010
Figure 11. Hydrogeological section at the Ljubičevski Most gauging station, including observation wells on the left and right banks. Groundwater levels reflect the calculated annual averages for 2008 (dark blue line) and extreme situations (flood discharges red line and dry period white line).
Water 15 02654 g011
Figure 12. Correlation between river stages of the Velika Morava River and groundwater levels at (a) observation well 1NP973, right bank; and (b) observation well 1NP904A, left bank.
Water 15 02654 g012
Table 1. Active river gauging stations on the Velika Morava River (data source: Hydrometeorological Service of Serbia) [36].
StationRiverYear Established“Zero” Altitude (m
Adriatic Sea Level a.s.l.)
Distance from River Mouth (km)Catchment Area (km2)
1VarvarinVelika Morava1924126.13177.2231,548
2ĆuprijaVelika Morava1923112.49145.4132,561
3BagrdanVelika Morava1952100.94118.5733,446
4Žabarski MostVelika Morava193587.3772.1535,496
5Ljubičevski MostVelika Morava192373.4221.7537,320
Note: Gauging stations 3, 4, and 5 were considered in this study.
Table 2. Observation wells in the Velika Morava River alluvium considered in the present study (data source: Hydrometeorological Service of Serbia) [36].
Observation WellDate EstablishedDistance from River (km)x
Coordinate
y
Coordinate
“Zero”
Altitude
(m a.s.l.)
Depth
(m)
11NP904A1 April 19880.914936914750979479.8116
21NP9741 August 19771.544934636750668178.729.2
31NP901A1 July 19870.2 *4933941750542778.3714.1
41NP9661 October 19770.094944990750598875.3111.5
51NP9731 January 19780.034937900751095080.459.2
61NP908A1 July 19871.164938752751166978.1813.73
71NP909A1 July 19872.014939200751247578.0611.05
81NP910A1 July 19872.834939725751305077.7511.21
91NPP-11 April 20026.424943425751362578.821
101NP929A1 July 19871.714911009751215793.2612.3
Note: * Distance from the Jezava River. The first three rows pertain to observation wells on the left bank and the other rows to observation wells on the right bank of the Velika Morava River.
Table 3. Correlation coefficients among the Velika Morava water levels at Bagrdan, Žabarski Most, and Ljubičevski Most in different time intervals.
Ljubičevski Most—Žabarski MostCorrelation coefficient—r
1952–19620.981
1963–19810.946
1982–19890.964
1990–19990.687
2000–20180.948
total period0.865
Ljubičevski Most—BagrdanCorrelation coefficient—r
1952–19620.963
1963–19810.941
1982–19890.946
1990–19990.599
2000–20180.955
total period0.803
Žabarski Most—BagrdanCorrelation coefficient—r
1952–19810.957
1981–19890.980
1990–20180.944
total period0.960
Table 4. Statistical parameters (average value and standard deviation) of the Velika Morava water levels characteristic of the specified periods.
PeriodSample SizeGauging Station BagrdanGauging Station
Žabarski Most
Gauging Station Ljubičevski Most
Average value
I: 1952–196211103.1489.4376.38
II: 1963–198119102.8589.2075.18
III: 1982–19898102.2988.6273.95
IV: 1990–199910101.8387.9972.52
V: 2000–201819101.8187.5871.10
Standard deviation
I: 1952–1962110.880.991.00
II: 1963–1981190.800.870.85
III: 1982–198980.710.770.82
IV: 1990–1999100.620.680.66
V: 2000–2018190.871.000.91
Table 5. Value of t statistics and criterion for adopting the null hypothesis (i.e., the homogeneity of the analyzed time-series).
Sample Homogeneity Test t α 2 t t 1 α 2 Time-Series Homogeneity
Gauging station at Bagrdan
I and II−2.0480.8432.048yes
II and III−2.061.6712.06yes
III and IV−2.121.3782.12yes
IV and V−2.0250.0632.025yes
Gauging station at Žabarski Most
I and II−2.0480.6152.048yes
II and III−2.061.5852.06yes
III and IV−2.121.7272.12yes
IV and V−2.0251.1342.025yes
Gauging station at Ljubičevski Most
I and II−2.0483.2742.048no
II and III−2.063.3262.06no
III and IV−2.123.8802.12no
IV and V−2.0253.8802.025no
Table 6. Values of F statistics and criterion for adopting null hypothesis (i.e., homogeneity of analyzed time-series).
Sample Homogeneity Test F F 1 α ν 1 , ν 2 F < F 1 α ν 1 , ν 2 Time-Series Homogeneity
Gauging station at Bagrdan
I and II1.2042.41< yes
II and III1.2703.44< yes
III and IV1.3263.14< yes
IV and V1.9572.46< yes
Gauging station at Žabarski Most
I and II1.3072.41< yes
II and III1.2923.44< yes
III and IV1.2853.14< yes
IV and V2.2082.46< yes
Gauging station at Ljubičevski Most
I and II1.3802.41< yes
II and III1.0913.44< yes
III and IV1.5403.14< yes
IV and V1.9012.46< yes
Disclaimer/Publisher’s Note: The statements, opinions and data contained in all publications are solely those of the individual author(s) and contributor(s) and not of MDPI and/or the editor(s). MDPI and/or the editor(s) disclaim responsibility for any injury to people or property resulting from any ideas, methods, instructions or products referred to in the content.

