Article

Variations of Runoff-Sediment Processes at Flood Event Scale at a Typical Catchment in the Loess Plateau of China

1
State Key Laboratory of Soil Erosion and Dryland Farming on the Loess Plateau, Institute of Soil and Water Conservation, Northwest A&F University, Xianyang 712100, China
2
State Key Laboratory of Soil Erosion and Dryland Farming on the Loess Plateau, Institute of Soil and Water Conservation, Chinese Academy of Sciences and Ministry of Water Resources, Xianyang 712100, China
3
University of Chinese Academy of Sciences, Beijing 100049, China
4
Taiyuan Dongxishan Forest Area Management and Protection Center, Taiyuan 030000, China
*
Author to whom correspondence should be addressed.
Water 2023, 15(15), 2690; https://doi.org/10.3390/w15152690
Submission received: 6 July 2023 / Revised: 22 July 2023 / Accepted: 23 July 2023 / Published: 25 July 2023
(This article belongs to the Section Hydrology)

Abstract

:
The flood season is the main period for runoff and sediment yield, and understanding the variations of runoff and sediment of flood events is of great significance for distinguishing the runoff-sediment processes in the Loess Plateau. In this study, we analyzed the variations of runoff and sediment at the flood event scale in the Qiaogou catchment and investigated the influencing factors. The results showed that runoff and sediment of flood events were mainly produced by rainfall with short rainfall duration and heavy rainfall intensity in the study area. Based on the 28 flood events and corresponding precipitation data from the reference period (P-I, 1986–1989) and the revegetation period (P-II, 2001–2009), we analyzed the variations of runoff-sediment processes at the flood event scale in the Qiaogou catchment, a typical catchment of the Loess Plateau. The results showed that the flood variables were lower in the revegetation period than those in the reference period, except for the flood peak discharge time and the flood duration. The sediment transport capacity per unit runoff depth in the revegetation period was weaker than that in the reference period. The hysteresis analysis indicated that the patterns of the hysteretic loop were dominated by the figure-of-eight pattern and the compound pattern, respectively, in the reference period and revegetation period. Compared to the reference period, runoff and sediment-related variables for flood events of counter-clockwise, figure-of-eight, and compound patterns were less in the revegetation period. With similar rainfall conditions, the main reason for the noticeable difference in runoff and sediment of flood events for the two periods was the variations in vegetation cover. The mentioned results indicated that revegetation performed a critical function in the variations of runoff and sediment at the flood event scale. This study revealed the variations of runoff-sediment processes of flood events and their responses to rainfall and revegetation in a typical catchment of the Loess Plateau, which can provide a basis for decision-making on soil erosion management and sustainable development of the ecological environment in the Loess Plateau.

1. Introduction

As one of the essential processes of the hydrological cycle, runoff-sediment processes in the watershed not only contribute significantly to the processes of surface material migration and energy conversion, but they also have an essential impact on the formation of landforms such as rivers, floodplains, and deltas [1]. The primary determinants of fluctuations in runoff and sediment are rainfall and human activity [2]. Rainfall is a crucial element in runoff production. Sediment transport is mostly fueled by runoff. With the rapid socio-economic development and the increase of people’s awareness of ecological and environmental issues, the intervention of human activities in runoff-sediment processes is gradually increasing. Among them, large-scale revegetation projects, water conservation projects, and rapid urbanization have caused huge variations in land use. These changes directly have an essential effect on the retention and infiltration capacity of the underlying surface, which has implications for runoff and sediment [3].
Currently, numerous scholars have studied the variations of hydrological conditions in different watersheds at different spatial and temporal scales. Li et al. found remarkable variations in 24% of water fluxes and 40% of sediment fluxes in large rivers around the world [4]. According to the data, 71% of the largest rivers around the world showed a remarkable correlation between fluctuations in rainfall and water flux. Compared to the period of 1966–1993, Shao et al. concluded that the average annual runoff decreased by 49.58% and the annual sediment load decreased by 77.77% in the period of 1994–2016 in the Jialing River [5]. Wang et al. concluded that the annual runoff and sediment load showed a downward trend during the period of 1970–2019 in the Min River basin [6]. Berkun et al. found that dams reduced water discharge by 7% and suspended sediment by 98% in the rivers located along the southeast Black Sea coast of Turkey and Georgia [7]. Ngo et al. found a decreasing trend in runoff and sediment yield from 2005 to 2010 in the Da River Basin of Hoa Binh province, Northwest Vietnam [8]. This change was attributed to the expansion of forest land and the enforcement of soil conservation measures. Sonu et al. analyzed the impact of land use and land cover change on flooding in the Kuttanad Wetland System in Kerala, India [9]. This work found that surface runoff rates will accelerate as vegetation decreases and built-up land and wasteland increase. Feng et al. selected seven typical sub-basins of the Haihe River Basin to analyze the changes in flood characteristics [10]. They found that the flood peak and volume in most of the sub-basins showed a decreasing trend. Mehmood et al. indicated that the risk of elevated flood peaks increases significantly with a significant reduction in forest area and a significant increase in the Kabul River Basin in Pakistan [11].
The Loess Plateau is located in the middle and upper reaches of the Yellow River. It is considered one of the most eroded areas in the world. The amount of incoming sediment in the loess hill and gully regions accounts for 90% of the amount of sediment entering the Yellow River from the Loess Plateau, due to its surface gullies and valleys, greater topographic undulations, and fragile ecological environment [12,13]. Severe soil erosion presents a great challenge to the sustainability of local socio-economic conditions and the restoration of the ecological environment. Since the 1970s, China has started to implement the Grain for Green Program (GGP) in the Loess Plateau. The underlying surface of this region has changed dramatically. Soil erosion has improved significantly [14,15]. A large number of scholars have studied the variations of runoff and sediment in this plateau. At the whole Loess Plateau scale, Zheng et al. concluded that the water discharge and sediment load decreased by 22% and 74%, respectively, during the period of 2008–2016, compared to the period of 1971–1987 [16]. Jia et al. suggested that the backbone check dams and the increase in vegetation were considered to be the predominant factors in the reduction of sediment load in the Loess Plateau [17]. At the typical watershed scale, Hu et al. revealed a significant downward trend in runoff and sediment load in the Yanhe basin from 1974 to 2013 [18]. Zhang et al. suggested that the annual runoff and sediment load of the Dali River basin was reduced by 29.76% and 84.87%, respectively, from 1960 to 2010 [19]. Xie et al. demonstrated that the runoff and sediment showed a remarkable decline with a 31.4% and 83.5% decrease, respectively, from 1960 to 2016 in the Beiluo River basin [20]. The decrease in sediment was particularly significant.
Previous studies have been devoted to analyzing the variations of annual-scale runoff and sediment in the Loess Plateau or in typical watersheds. However, they ignored the variations of runoff and sediment at flood event scales. It has been shown that in the Loess Plateau, flood events caused 49.6% and 91.8% of its average annual runoff and sediment load, respectively [21]. The research of runoff and sediment of flood events is an essential part of runoff and sediment research in watersheds. In addition, serious casualties, economic losses, and ecological damage can be caused by flood disasters. It brings significant threats to the sustainability of the Loess Plateau. Studying the dynamics of runoff and sediment of flood events is not only the foundation for studying runoff and sediment of the watersheds, but also can provide scientific guidance for flood mitigation and disaster reduction in this region.
We analyzed the variations of runoff-sediment processes using the data of 28 flood events and corresponding precipitation for the reference period (P-I, 1988–1989) and revegetation period (P-II, 2001–2009) in the Qiaogou catchment. The specific objectives were (1) to compare the variations of flood characteristics in the Qiaogou catchment and (2) to investigate the variations in the relationship between runoff and sediment at the flood event scale in the Qiaogou catchment as well as analyze the potential influencing factors. We hope to provide scientific guidance for flood prevention and mitigation in watersheds and for the management of erosion in the future.

2. Study Area

The Qiaogou catchment (37°29′41″ N, 110°17′56″ E) is located in the Peijiamaogou watershed, Suide County, Yulin City, Shaanxi Province, which is the first level branch ditch of the Peijiamaogou watershed (Figure 1). It is a typical loess hilly and gully region. The total area of this catchment is 0.45 km2. The topography of the catchment is fragmented, with a gully density of 5.41 km·km−2. Soil erosion is serious. The soil erosion types are dominated by hydraulic erosion and gravity erosion, with an average annual erosion modulus of 3423 t·(km2·a)−1. The topography of the study area runs from south to north, with elevations ranging from 838.8 to 990.3 m. The catchment has a temperate continental semi-arid climate with an average annual temperature of 10.2 °C and an average annual rainfall of about 486 mm. The precipitation is mainly concentrated in July and August, which is about 70.4% of the annual rainfall.

3. Material and Methods

3.1. Data Sources

We collected and compiled measured rainfall data and flood hydrological elements from control rain gauges and the hydrological station in the Qiaogou catchment for 1986–1988 and 2001–2009 based on the “Runoff Sediment Inspection Data for Soil and Water Conservation in the Middle reaches of the Yellow River” by the Yellow River Conservancy Commission. The flood events and rainfall were separated into two periods. In the reference period (P-I), ecological management was weak in the Qiaogou catchment. In the revegetation period (P-II), the Qiaogou catchment implemented the GGP, and the degree of ecological management was better.
Land-use data were obtained from Liu et al. [22]. Before 2000, the data were mainly obtained through hand-drawn land-use maps, written records, visual data, field surveys, and visiting farmers in the early days. After 2000, the data were mainly obtained by remote sensing and aerial photography by unmanned aerial vehicles and interpreted in ArcGIS. The results were verified by field sampling.

3.2. Methodologies

3.2.1. Statistical Analysis

For each flood event, different hydrologic variables were chosen to characterize the runoff-sediment processes of the flood event and the corresponding rainfall. The relevant variables were shown in Table 1.
For a specific flood event, the time interval of hydrological observation is considered to be Δ t , the instantaneous runoff is Q t , and the suspended sediment concentration is SSC t .
The event flood volume can be calculated as:
SY t 1 , t 2 = t 2 t 1 Q t · SSC t   dt = Q t · SSC t   Δ t
The equation for the total precipitation (P) is as follows:
P = i = 1 n P i F i F
where n is the number of rain gauges in the watershed; P is the total precipitation in the watershed, mm; P i is the event precipitation at the i -th rain gauge, mm; F i is the area of the polygon where the i -th rain gauge is located, km2; F is the watershed area, km2; F i F is the rain gauge weighting factor.

3.2.2. Classification of Rainfall Types

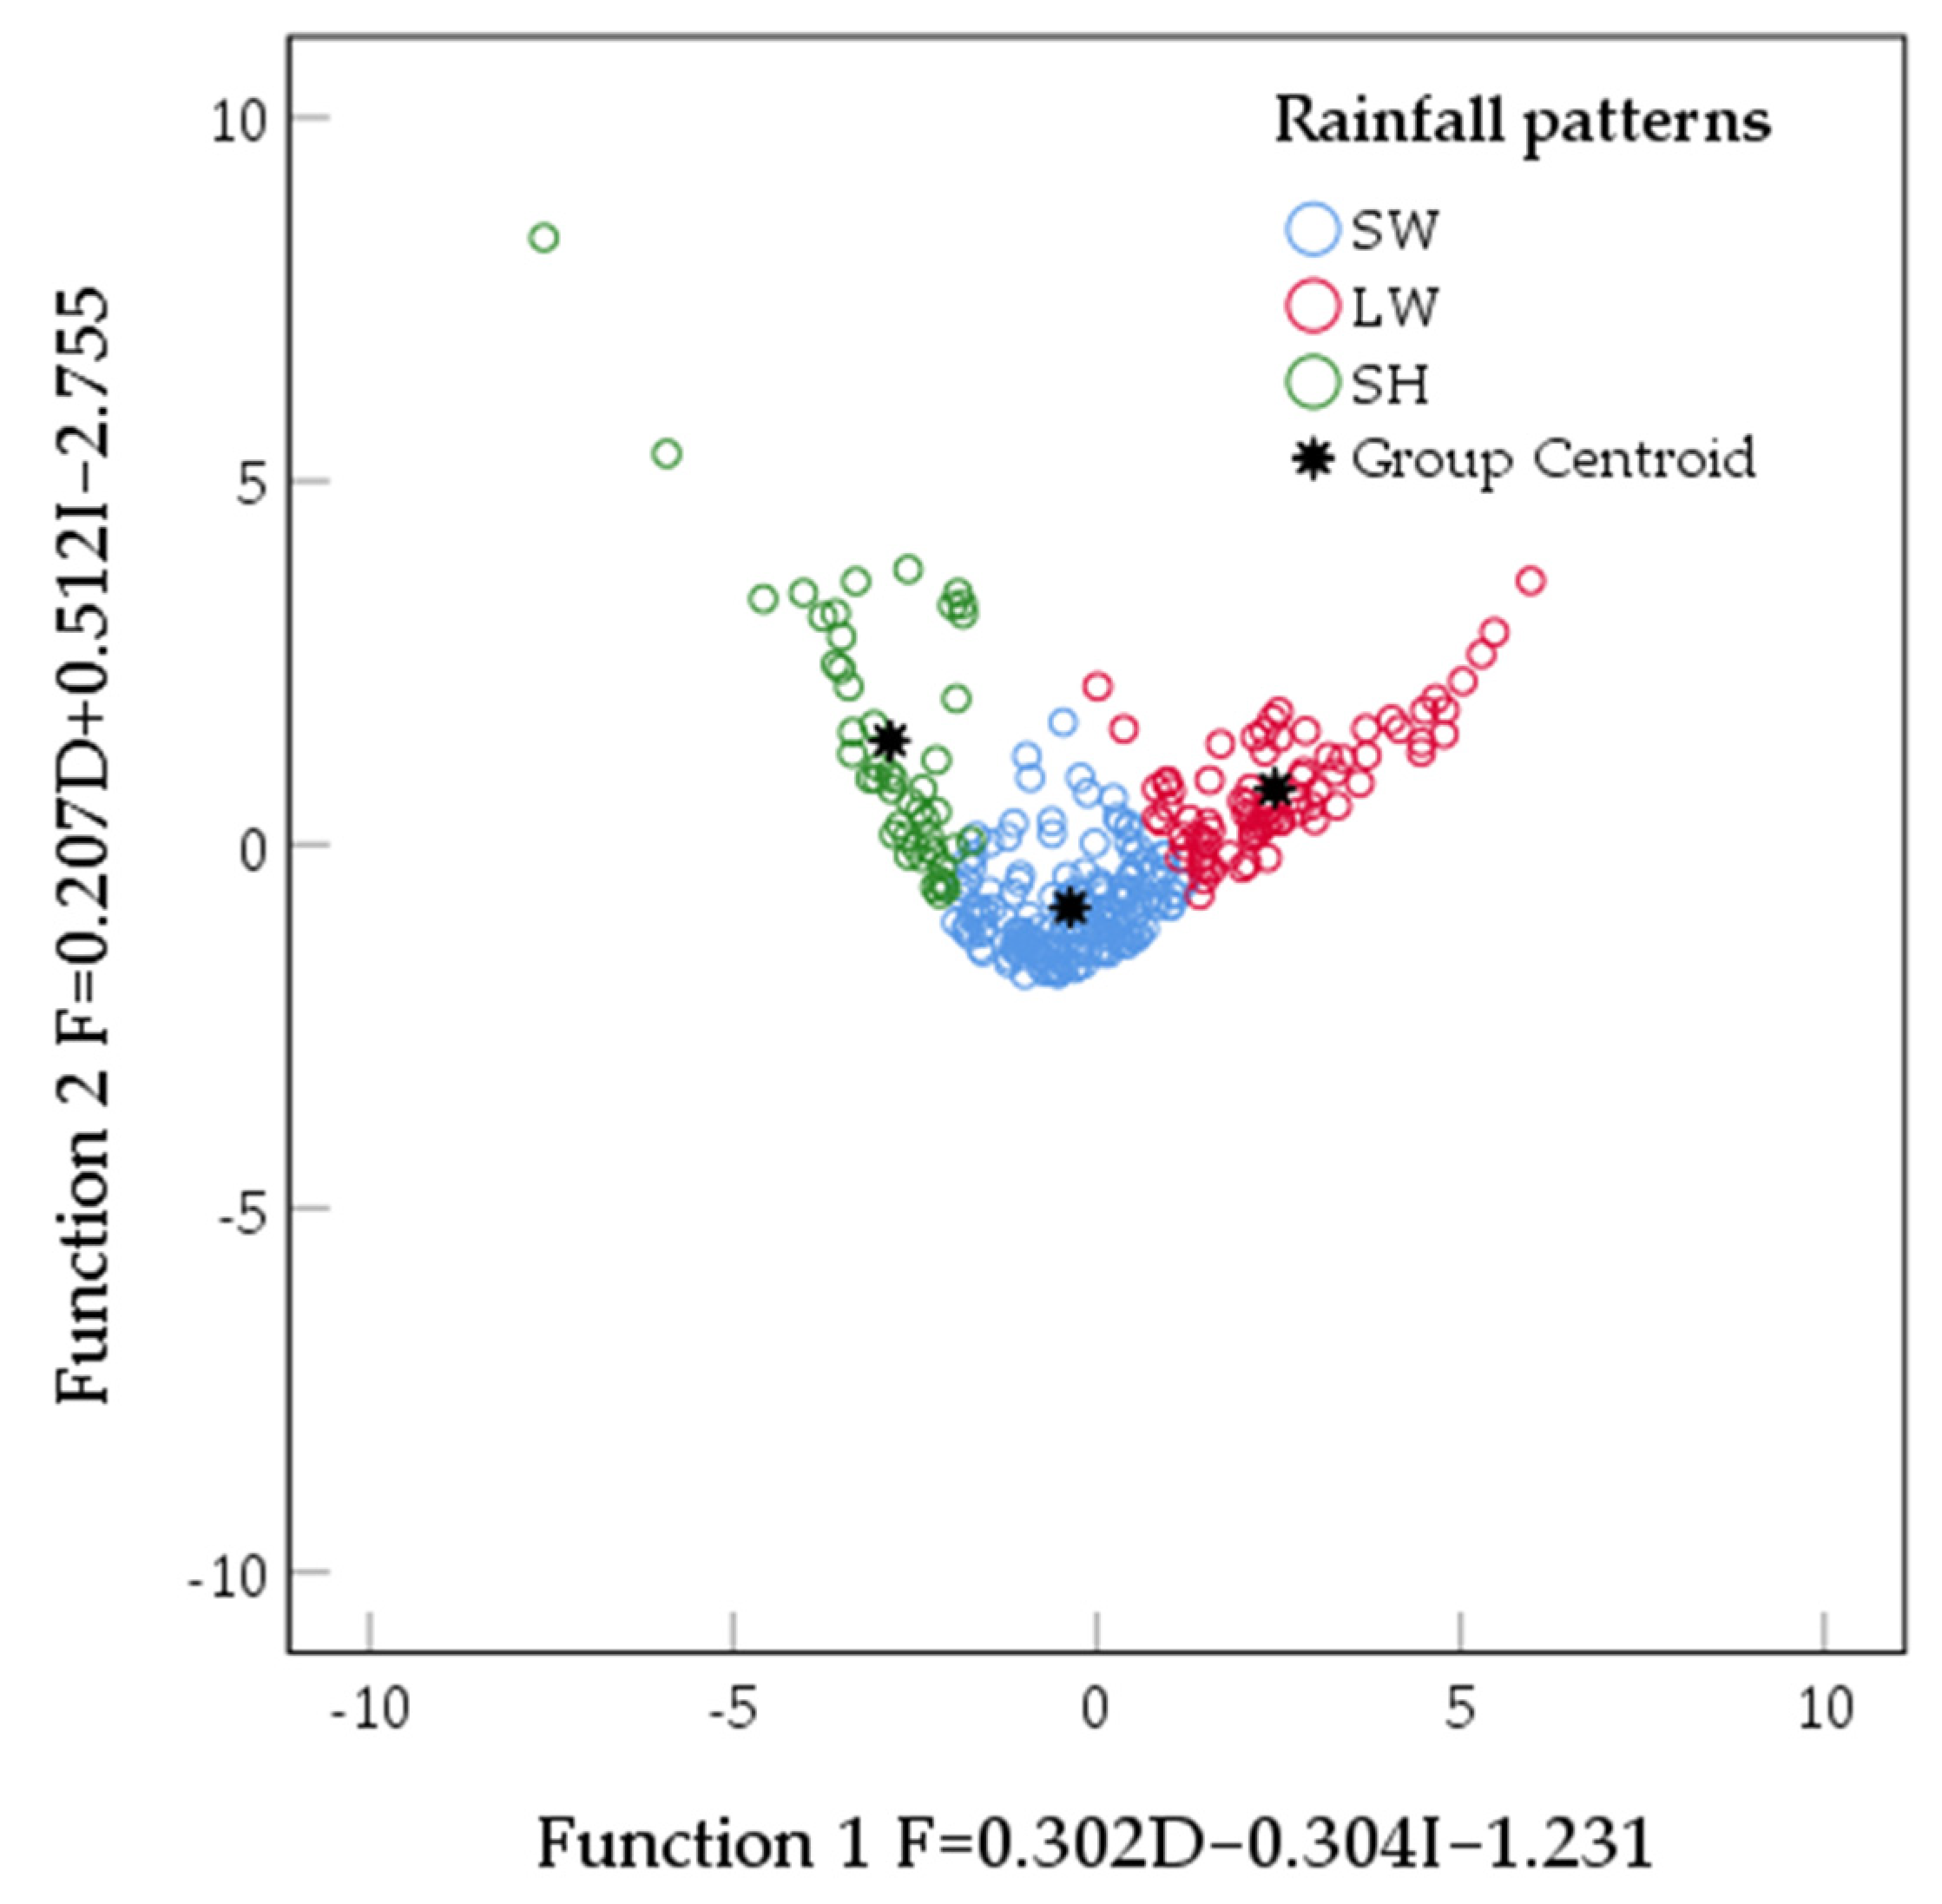
Cluster analysis is a method of classifying research objects according to their characteristics. According to this method, there is a high degree of similarity between similar objects and a high degree of difference between different classes of objects. We used the K-means clustering method combined with Fisher’s discriminant analysis to classify the rainfall types. The premise of the K-means clustering method is a given number of classifications. Fisher’s discriminant analysis was used to find the discriminant function based on the values of the variables of the object of study and the category to which they belong and to perform a discriminant analysis to determine the optimal clustering. We selected 282 rainfall events with precipitation ≥ 2 mm, combined with rainfall duration (D) and rainfall intensity (I) as clustering indicators, and used the K-means clustering method and Fisher’s discriminant analysis to classify the rainfall types in the Qiaogou catchment. The classification functions for different rainfall types were as follows:
G S W = 0.653 D + 0.707 I 3.264 G L W = 1.843 D + 0.688 I 14.085 G S H = 0.379 D + 2.634 I 11.165
where G S W , G L W , G S H are the classification scores for different rainfall types.

3.2.3. Hysteretic Loops

We used the SSC-Q hysteretic loops to represent the dynamics of the relationship between runoff and suspended sediment concentration at the flood event scale. The pattern of hysteretic loops of flood events is distinguished by calculating the ratio of suspended sediment concentration and flow discharge (SSC/Q) in the rising and falling phases of the flood. In general, the hysteretic loops contain four types: clockwise hysteretic loops, counter-clockwise hysteretic loops, figure-of-eight hysteretic loops, and compound hysteretic loops [23]. The type of hysteretic loops is related to the changes in sediment supply and sediment depletion.

4. Results

4.1. Classification of Rainfall Types

We used the K-means clustering method to classify the 282 rainfall events into three types, SW (short rainfall duration and weak rainfall intensity), LW (long rainfall duration and weak rainfall intensity), and SH (short rainfall duration and heavy rainfall intensity) (Figure 2). The classification functions of each type passed the significance test (p < 0.01), indicating a favorable clustering result. The distribution of the SW rainfall type was relatively concentrated, whereas LW and SH rainfall types were scattered. In addition, the boundaries between SH, LW, and SW rainfall types were blurred. The scatter distribution indicated that the rainfall characteristics of the SW rainfall type were more stable. The rainfall characteristics of LW and SH rainfall types were more variable. The rainfall characteristics of SH, LW, and SW rainfall types had certain similarities. The SW rainfall type (136 times) was the most common type, characterized by short rainfall duration (2.83~6.16 h) and weak rainfall intensity (0.88~2.07 mm·h−1) (Table 2). There were 85 rainfall events of the LW rainfall type, characterized by long rainfall duration (10.17~14.92 h) and weak rainfall intensity (0.77~1.69 mm·h−1). Sixty-one rainfall events belonged to the SH rainfall type, which is characterized by short rainfall duration (0.87~2.47 h) and heavy rainfall intensity (4.63~8.92 mm·h−1).
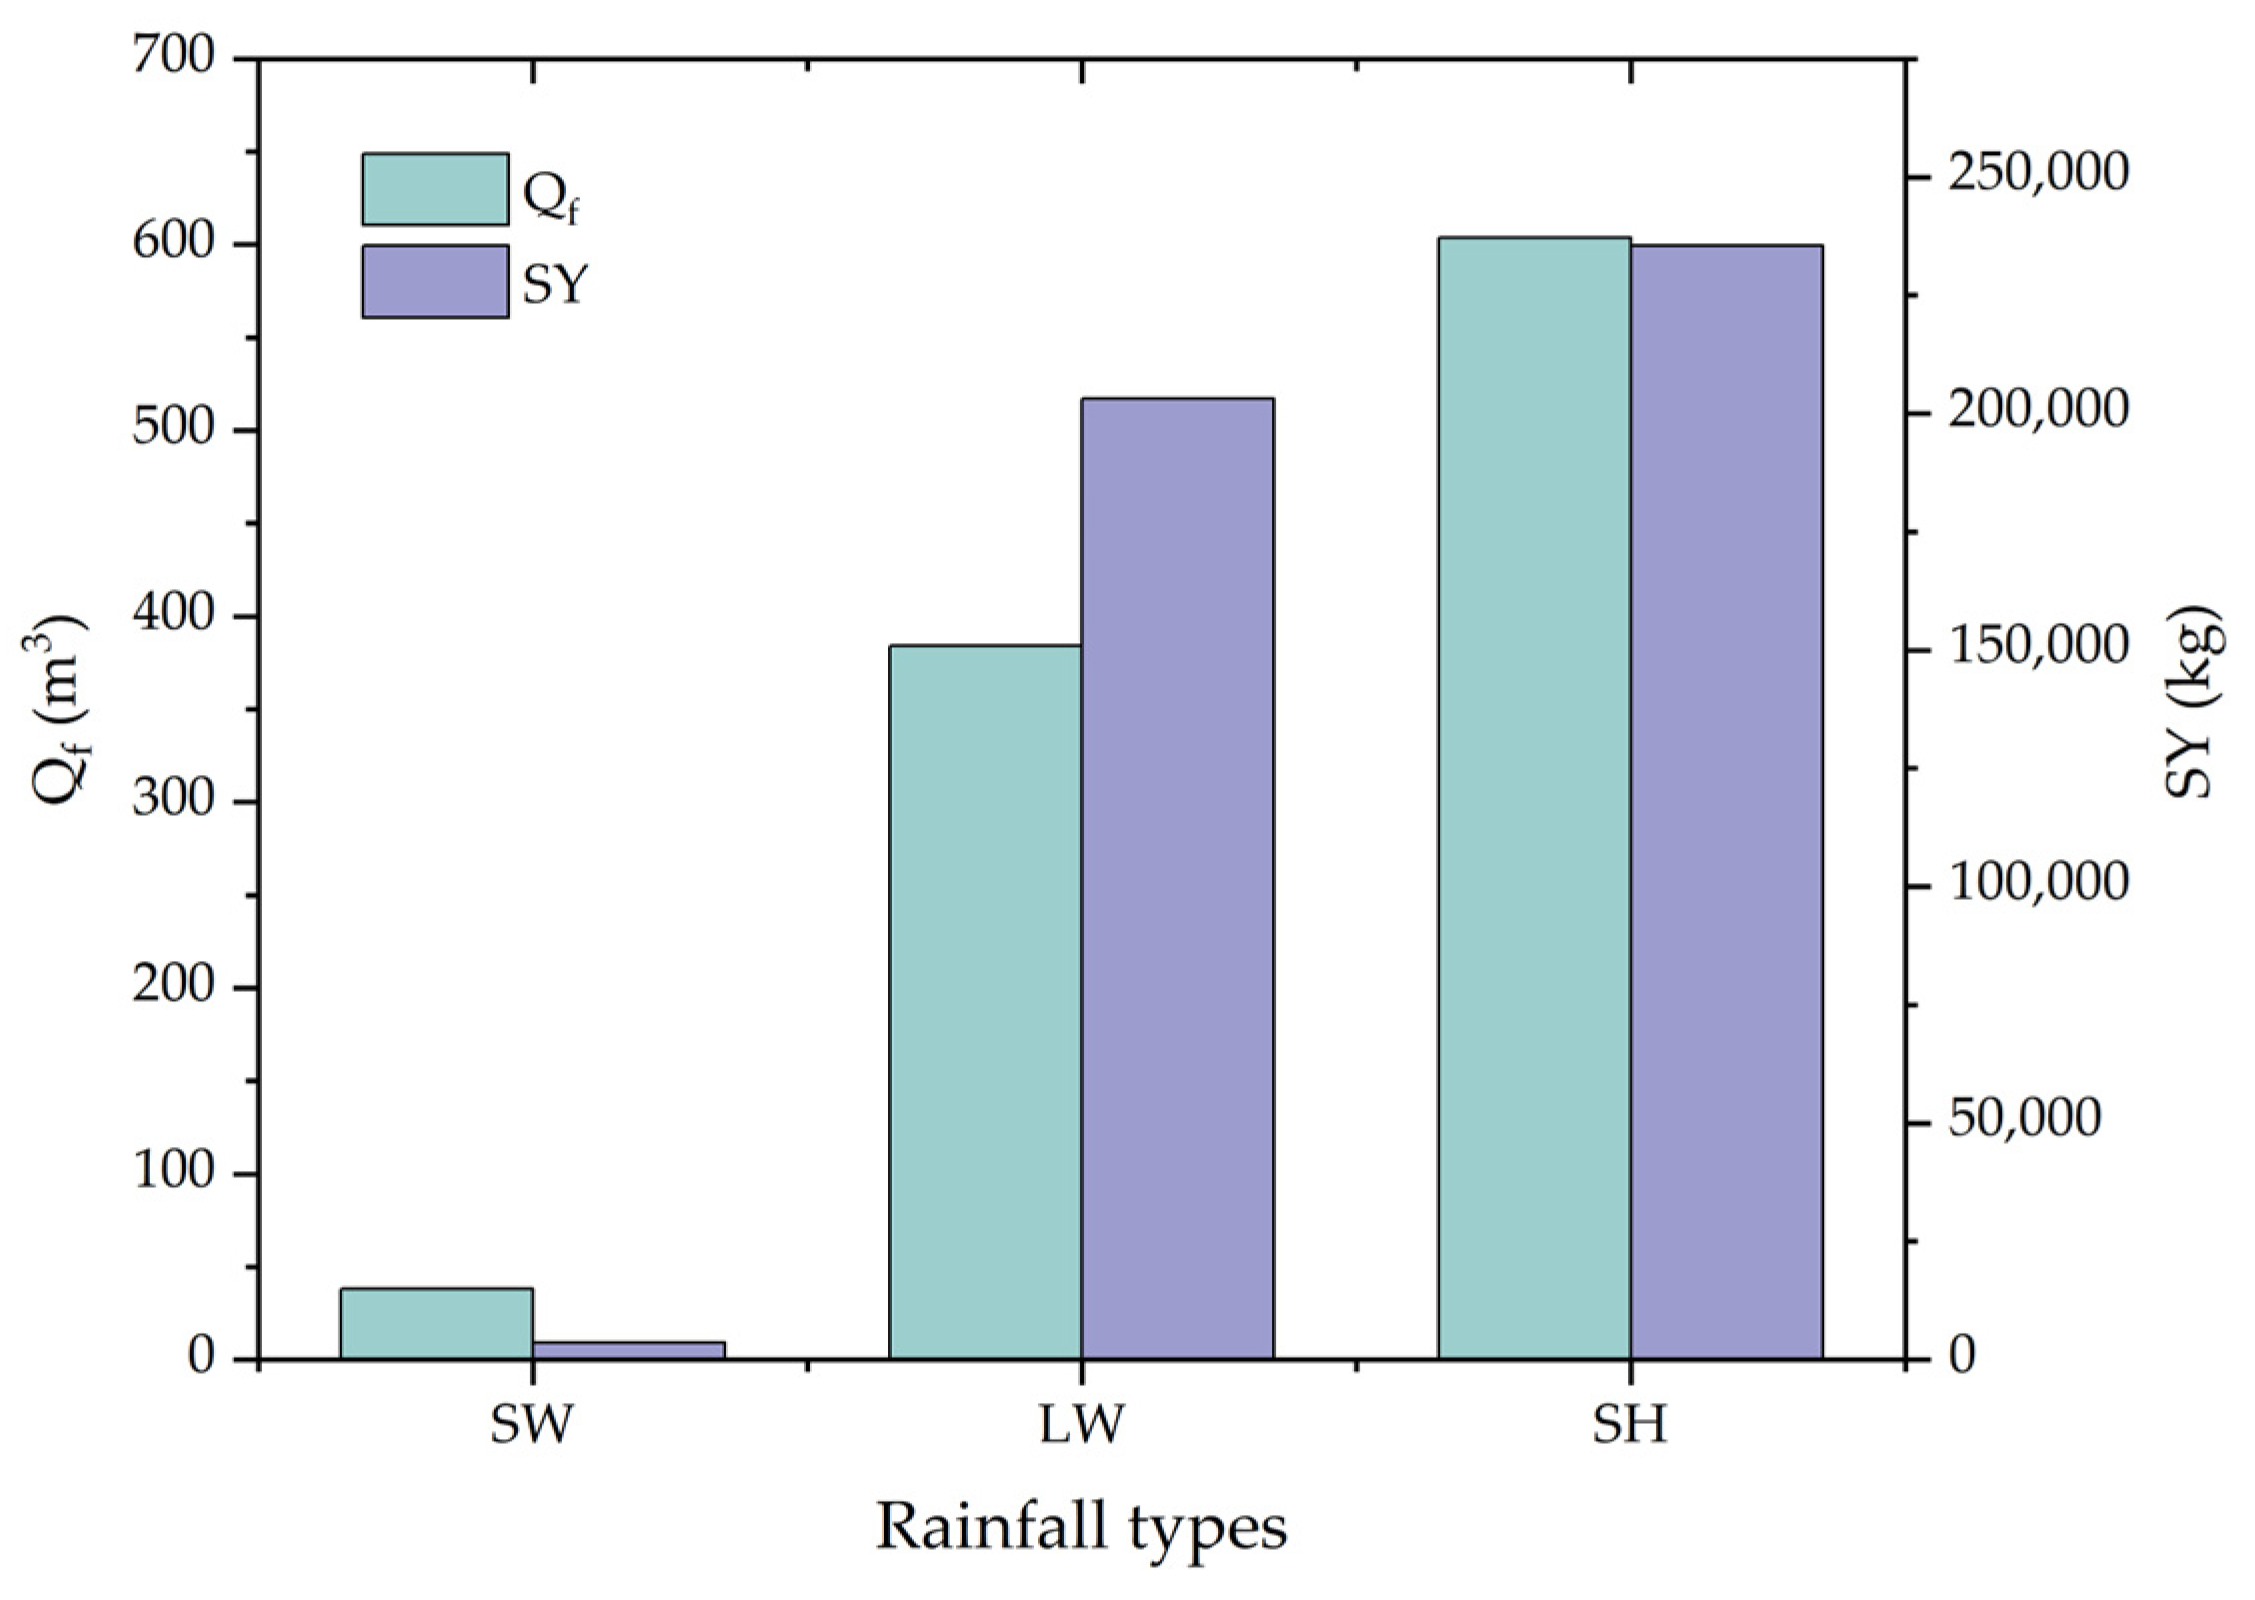
Figure 3 showed the Qf and SY of the three rainfall types for the study period. The maximum Qf and SY were observed for the SH rainfall type with 603.70 m3 and 235,470.47 kg, respectively. There were the minimum Qf and SY of the SW rainfall type with 38.25 m3 and 3560.60 kg, respectively.

4.2. The Variations of Flood Characteristics for Different Periods

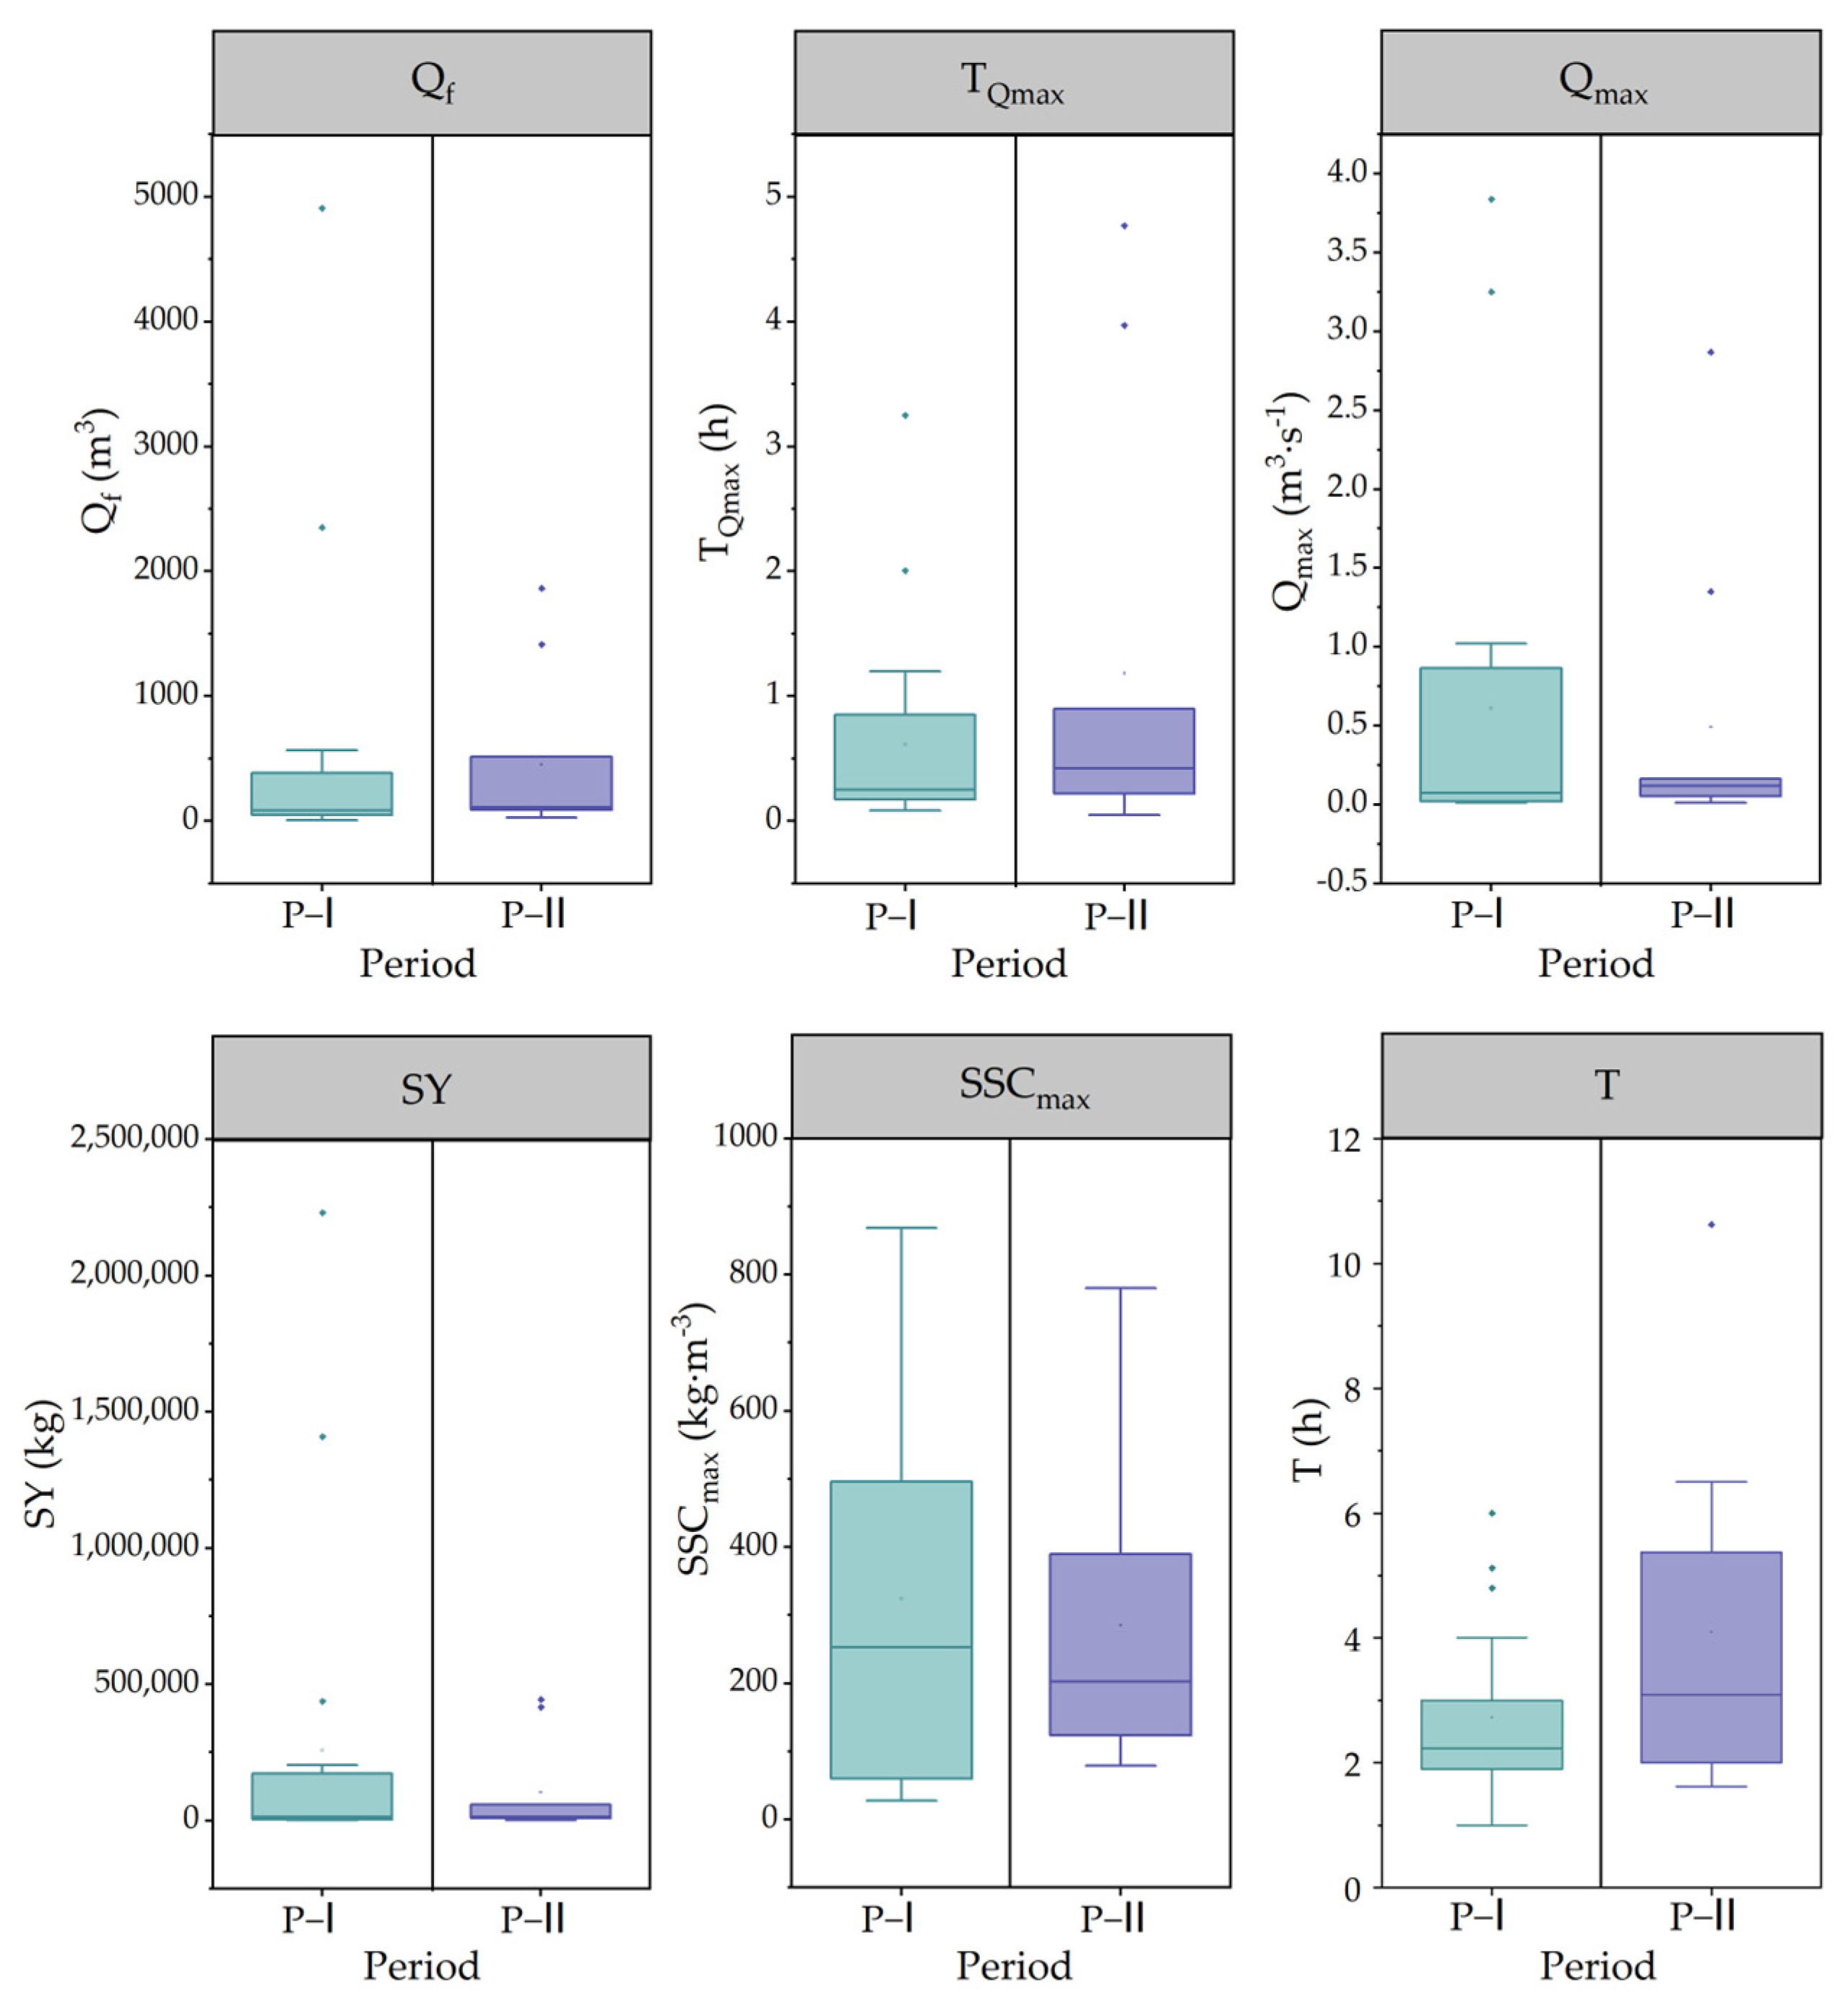
Figure 4 compared the flood characteristics for different periods. There were significant differences in flood characteristics for different periods. The Qf and SY in P-II were obviously lower than those in P-I. The average Qf and SY in P-I were 553.07 m3 and 256,648.33 kg, respectively. The average Qf and SY in P-II were reduced by 18.37% and 59.97%, respectively. The decrease in SY was greater than Qf. The average Qmax and SSCmax in P-I were 0.61 m3·s−1 and 323.86 kg·m−3, respectively. The average Qmax and SSCmax in P-II were reduced by 19.25% and 12.07%, respectively. The average TQmax was delayed by 0.57 h in P-II. The average T of P-II was 1.38 h longer than that of P-I. In addition, we can notice that the frequency of flood events was considerably lower than that in P-II. For P-I, there were 18 flood events, averaging about 4.5 events per year. The average annual frequency of flood events was only 1.11 in P-II.

4.3. The Relationship between Runoff Depth and Sediment Transport Modulus for Different Periods

We analyzed the regression relationship between runoff depth (H) and sediment transport modulus (STM) of flood events for different periods. As shown in Figure 5, a great linear relationship between H and STM was shown in P-I and P-II, with the coefficient of determination (R2) higher than 0.95. The regression coefficients of the fitting functions of H and STM can be used to express the sediment transport capacity per unit of runoff depth. It can be found that the regression coefficients of the fitted functions in P-I and P-II were 485.04 and 2.63, respectively. This demonstrated that the sediment transport capacity per unit of runoff depth in P-I was significantly stronger than that in P-II.

4.4. SSC-Q Hysteretic Loops for Different Periods

We chose the SSC-Q hysteretic loops to further investigate the variations of suspended sediment concentration in relation to runoff for different periods. The frequency of different patterns of hysteretic loops in P-I and P-II was shown in Table 3. In P-I, the counter-clockwise hysteretic loop appeared five times, the figure-of-eight hysteretic loop appeared eight times, the compound hysteretic loop appeared three times, and the clockwise hysteretic loop only appeared two times. In P-II, the SSC-Q hysteretic loops included three patterns. The figure-of-eight hysteretic loop appeared four times, the counter-clockwise hysteretic loop appeared one time, and the compound hysteretic loop appeared five times.
We selected four typical flood events to analyze the characteristics of different patterns of hysteretic loops. The typical clockwise hysteretic loop was observed for the flood event of 13 July 1988 (Figure 6a). The clockwise pattern was characterized by a rapidly rising phase and a relatively gentle falling phase for flow discharge and sediment concentration. There was only one peak that occurred for flow discharge and sediment concentration, in which these peaks occurred simultaneously. The SSC/Q in the rising phase of the flood was higher than the SSC/Q in the falling phase of the flood (Figure 6b).
The typical counter-clockwise hysteretic loop occurred on 9 July 1987 (Figure 6c). The peak that appeared for the flow discharge was earlier than that for the sediment concentration (Figure 6d). Unlike the clockwise hysteretic loop, for the counter-clockwise hysteretic loop, the SSC/Q in the rising phase of the flood was lower than the SSC/Q in the falling phase of the flood.
The flood of 20 July 1988 featured a relatively high sediment concentration when the flow discharge decreased rapidly. The SSC/Q in the rising phase of the flood was lower than that in the falling phase of the flood when the flow discharge was low (Figure 6f). When the flow discharge was higher, the SSC/Q in the rising phase of the flood was higher than that in the falling phase of the flood. The clockwise and counter-clockwise patterns coexisted in this flood event (Figure 6e). The pattern of this flood event was the figure-of-eight hysteretic loop.
The duration of the flood event of 31 July 2006 was 5.37 h. It was composed of three peaks that appeared for flow discharge and two peaks that appeared for sediment concentration, with large fluctuations in flow discharge and sediment concentration (Figure 6h). The hysteretic loop of this flood event exhibited multiple clockwise and counterclockwise patterns (Figure 6g).

5. Discussion

5.1. Effects of Rainfall on Hydrologic and Sediment at Flood Event Scale

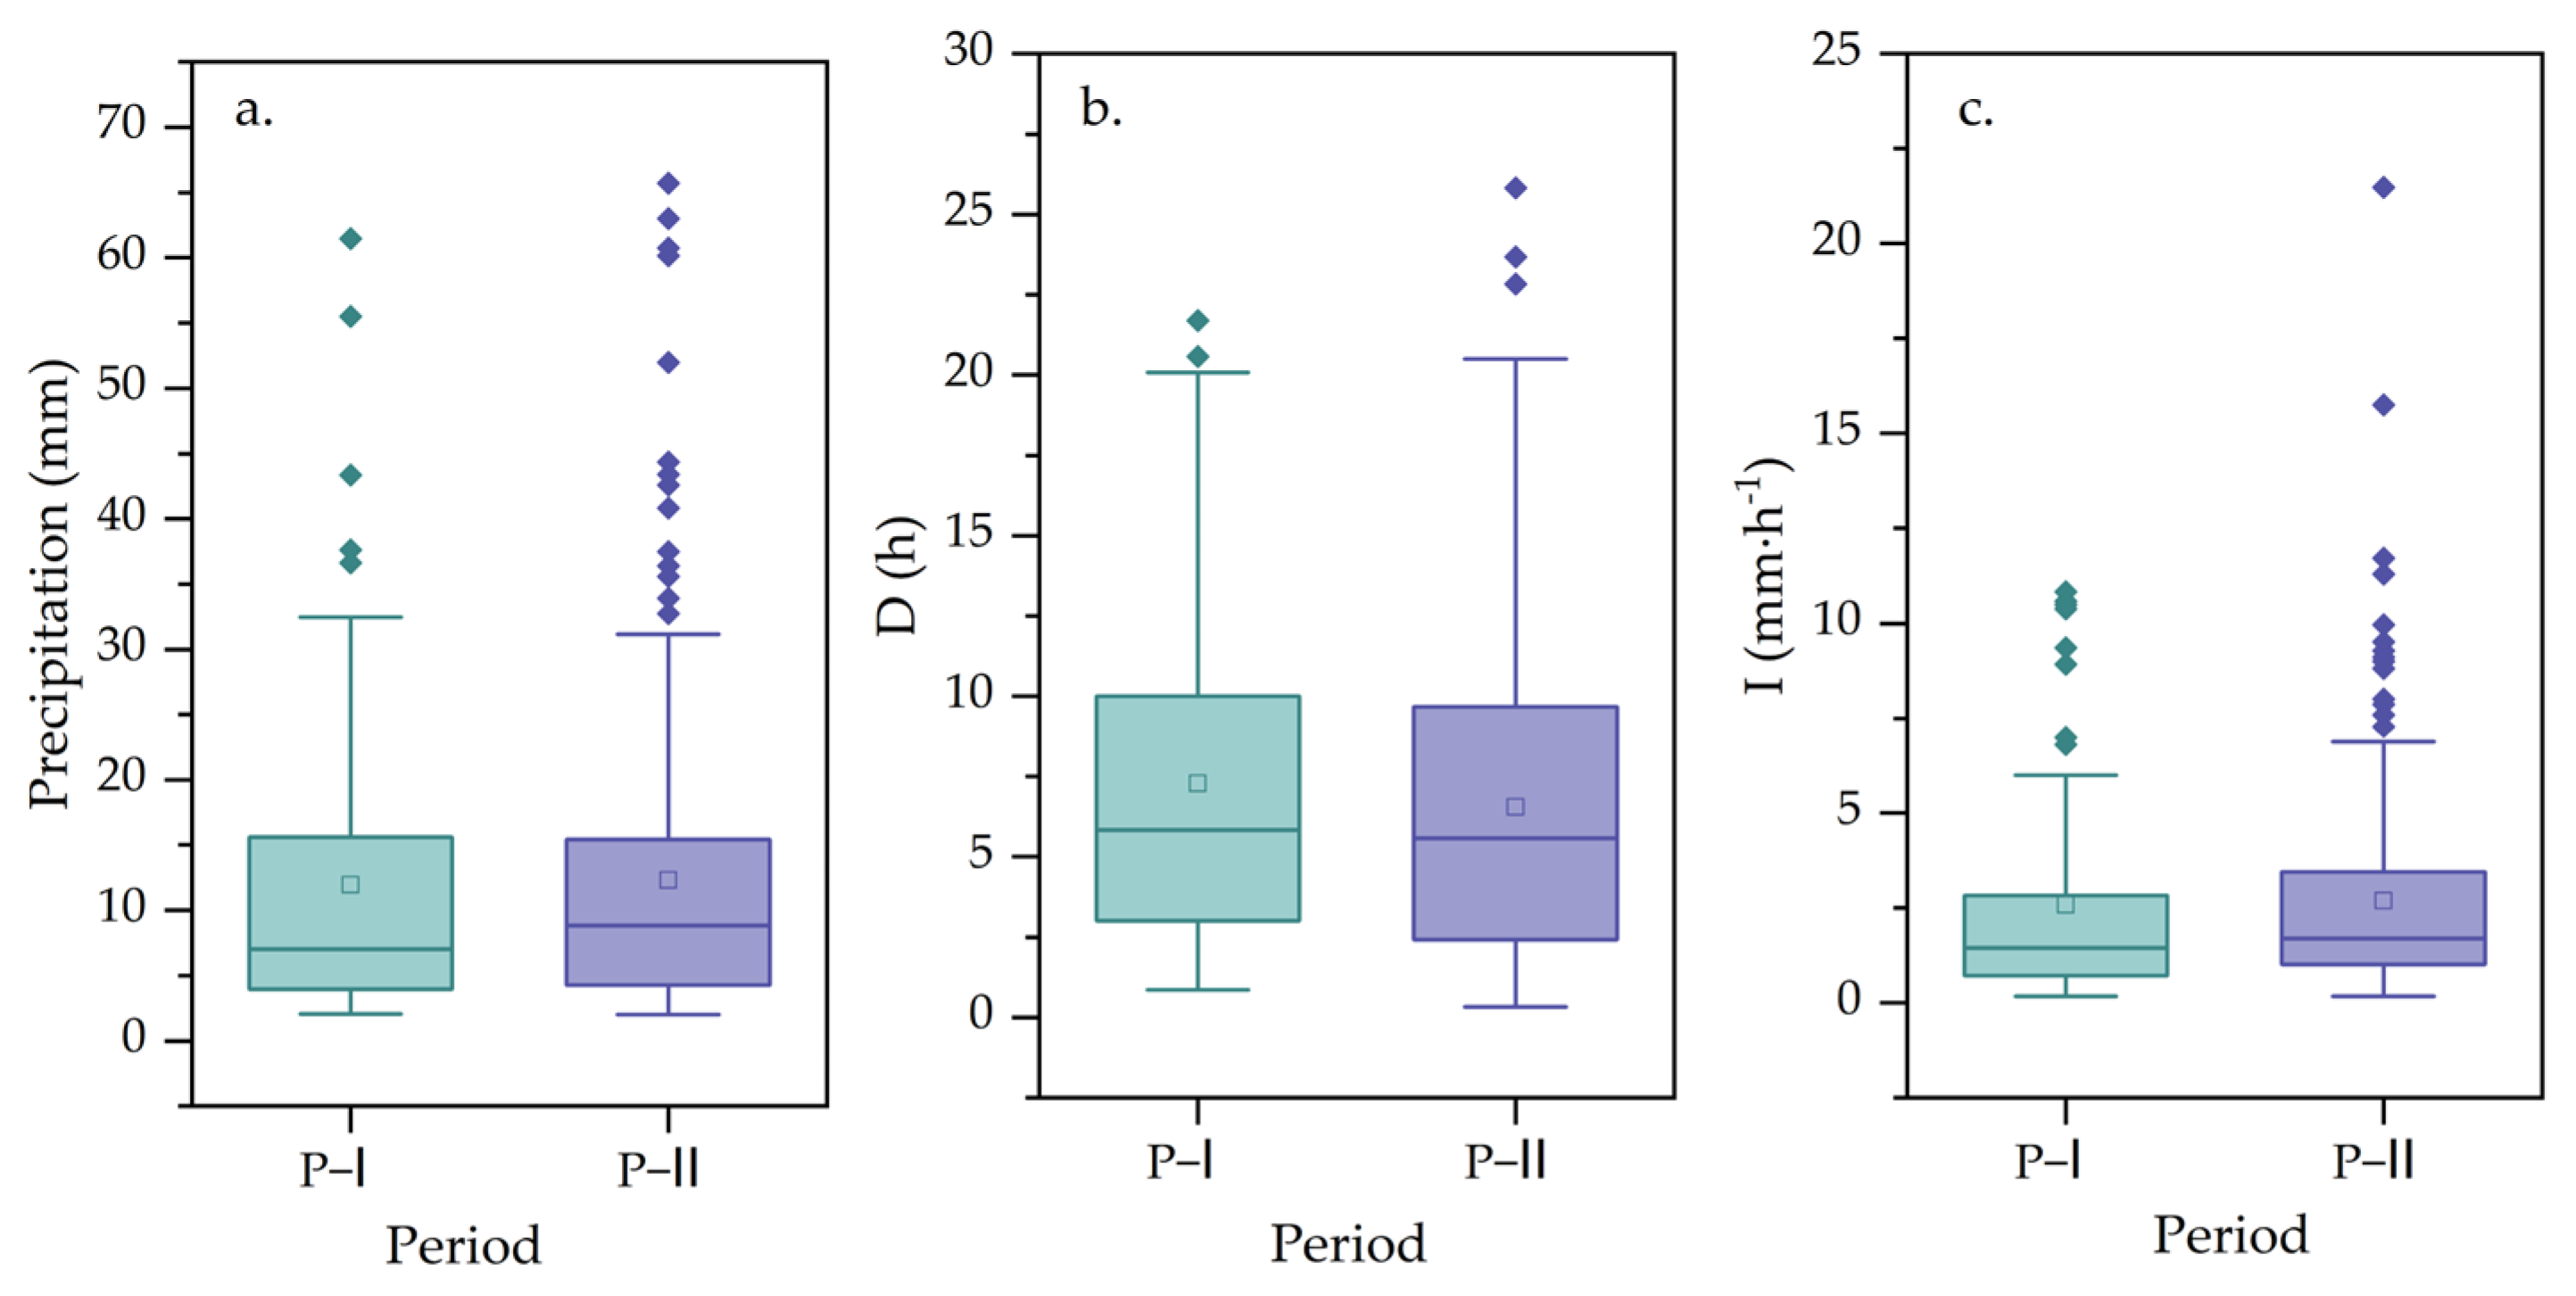
There is an intricate relationship between rainfall and hydrology in the watershed [24]. Under certain conditions, rainfall can cause soil erosion and form runoff [25]. There were significant variations in runoff and sediment because of changes in precipitation, rainfall duration, rainfall intensity, and rainfall frequency. Wan et al. found that the precipitation of the Loess Plateau changed modestly over recent years [26]. We observed similar results in the Qiaogou catchment. The average precipitation in P-I was 11.94 mm and that in P-II was 12.31 mm (Figure 7a). We also noticed that the variability of average rainfall duration and rainfall intensity was also slight, with 0.65 h and 0.11 mm·h−1, respectively (Figure 7b,c). Because of the large contribution of the SH rainfall type to runoff and sediment in the study area (Figure 3), it is worthwhile to analyze the variations in the frequency of this rainfall type and the changes in its Qf and SY for different periods. No significant change in the frequency of SH rainfall type was observed (Figure 8), and a significant decrease in Qf and SY was noticed for the two periods (Figure 9). Compared with the variations in precipitation characteristics and frequency, the decrease in Qf and SY was more remarkable.
Overall, the impact of precipitation on Qf and SY was limited due to the relatively minimal changes in precipitation characteristics and frequency for the two periods in the Qiaogou catchment. It was consistent with the results of an annual scale based on the study by Liu et al. [22].

5.2. Effects of Revegetation on Hydrologic and Sediment at Flood Event Scale

The Qiaogou catchment is located in the hilly and gully region of the Loess Plateau where soil erosion is severe, due to the broken topography and high gully density. Since the large-scale implementation of the GGP, the area of grassland and forest land has increased rapidly in the region. Figure 10 illustrated the changes in land use for two periods. In P-I, the main land-use types were sloping cropland and waste grassland, which accounted for 50.67% and 38.00%, respectively, in the Qiaogou catchment. In P-II, the implementation of the GGP led to the conversion of a massive portion of sloping cropland to forest land, shrubland, and waste grassland, accounting for 70.5%, 14.7%, and 3.0%, respectively. There were also conversions between some terraces to forest land, accounting for 11.8%. Overall, the main land-use types within the Qiaogou catchment in P-II were forest land and waste grassland, both of which increased by 1554.93% and 560.93%, respectively, compared to P-I.
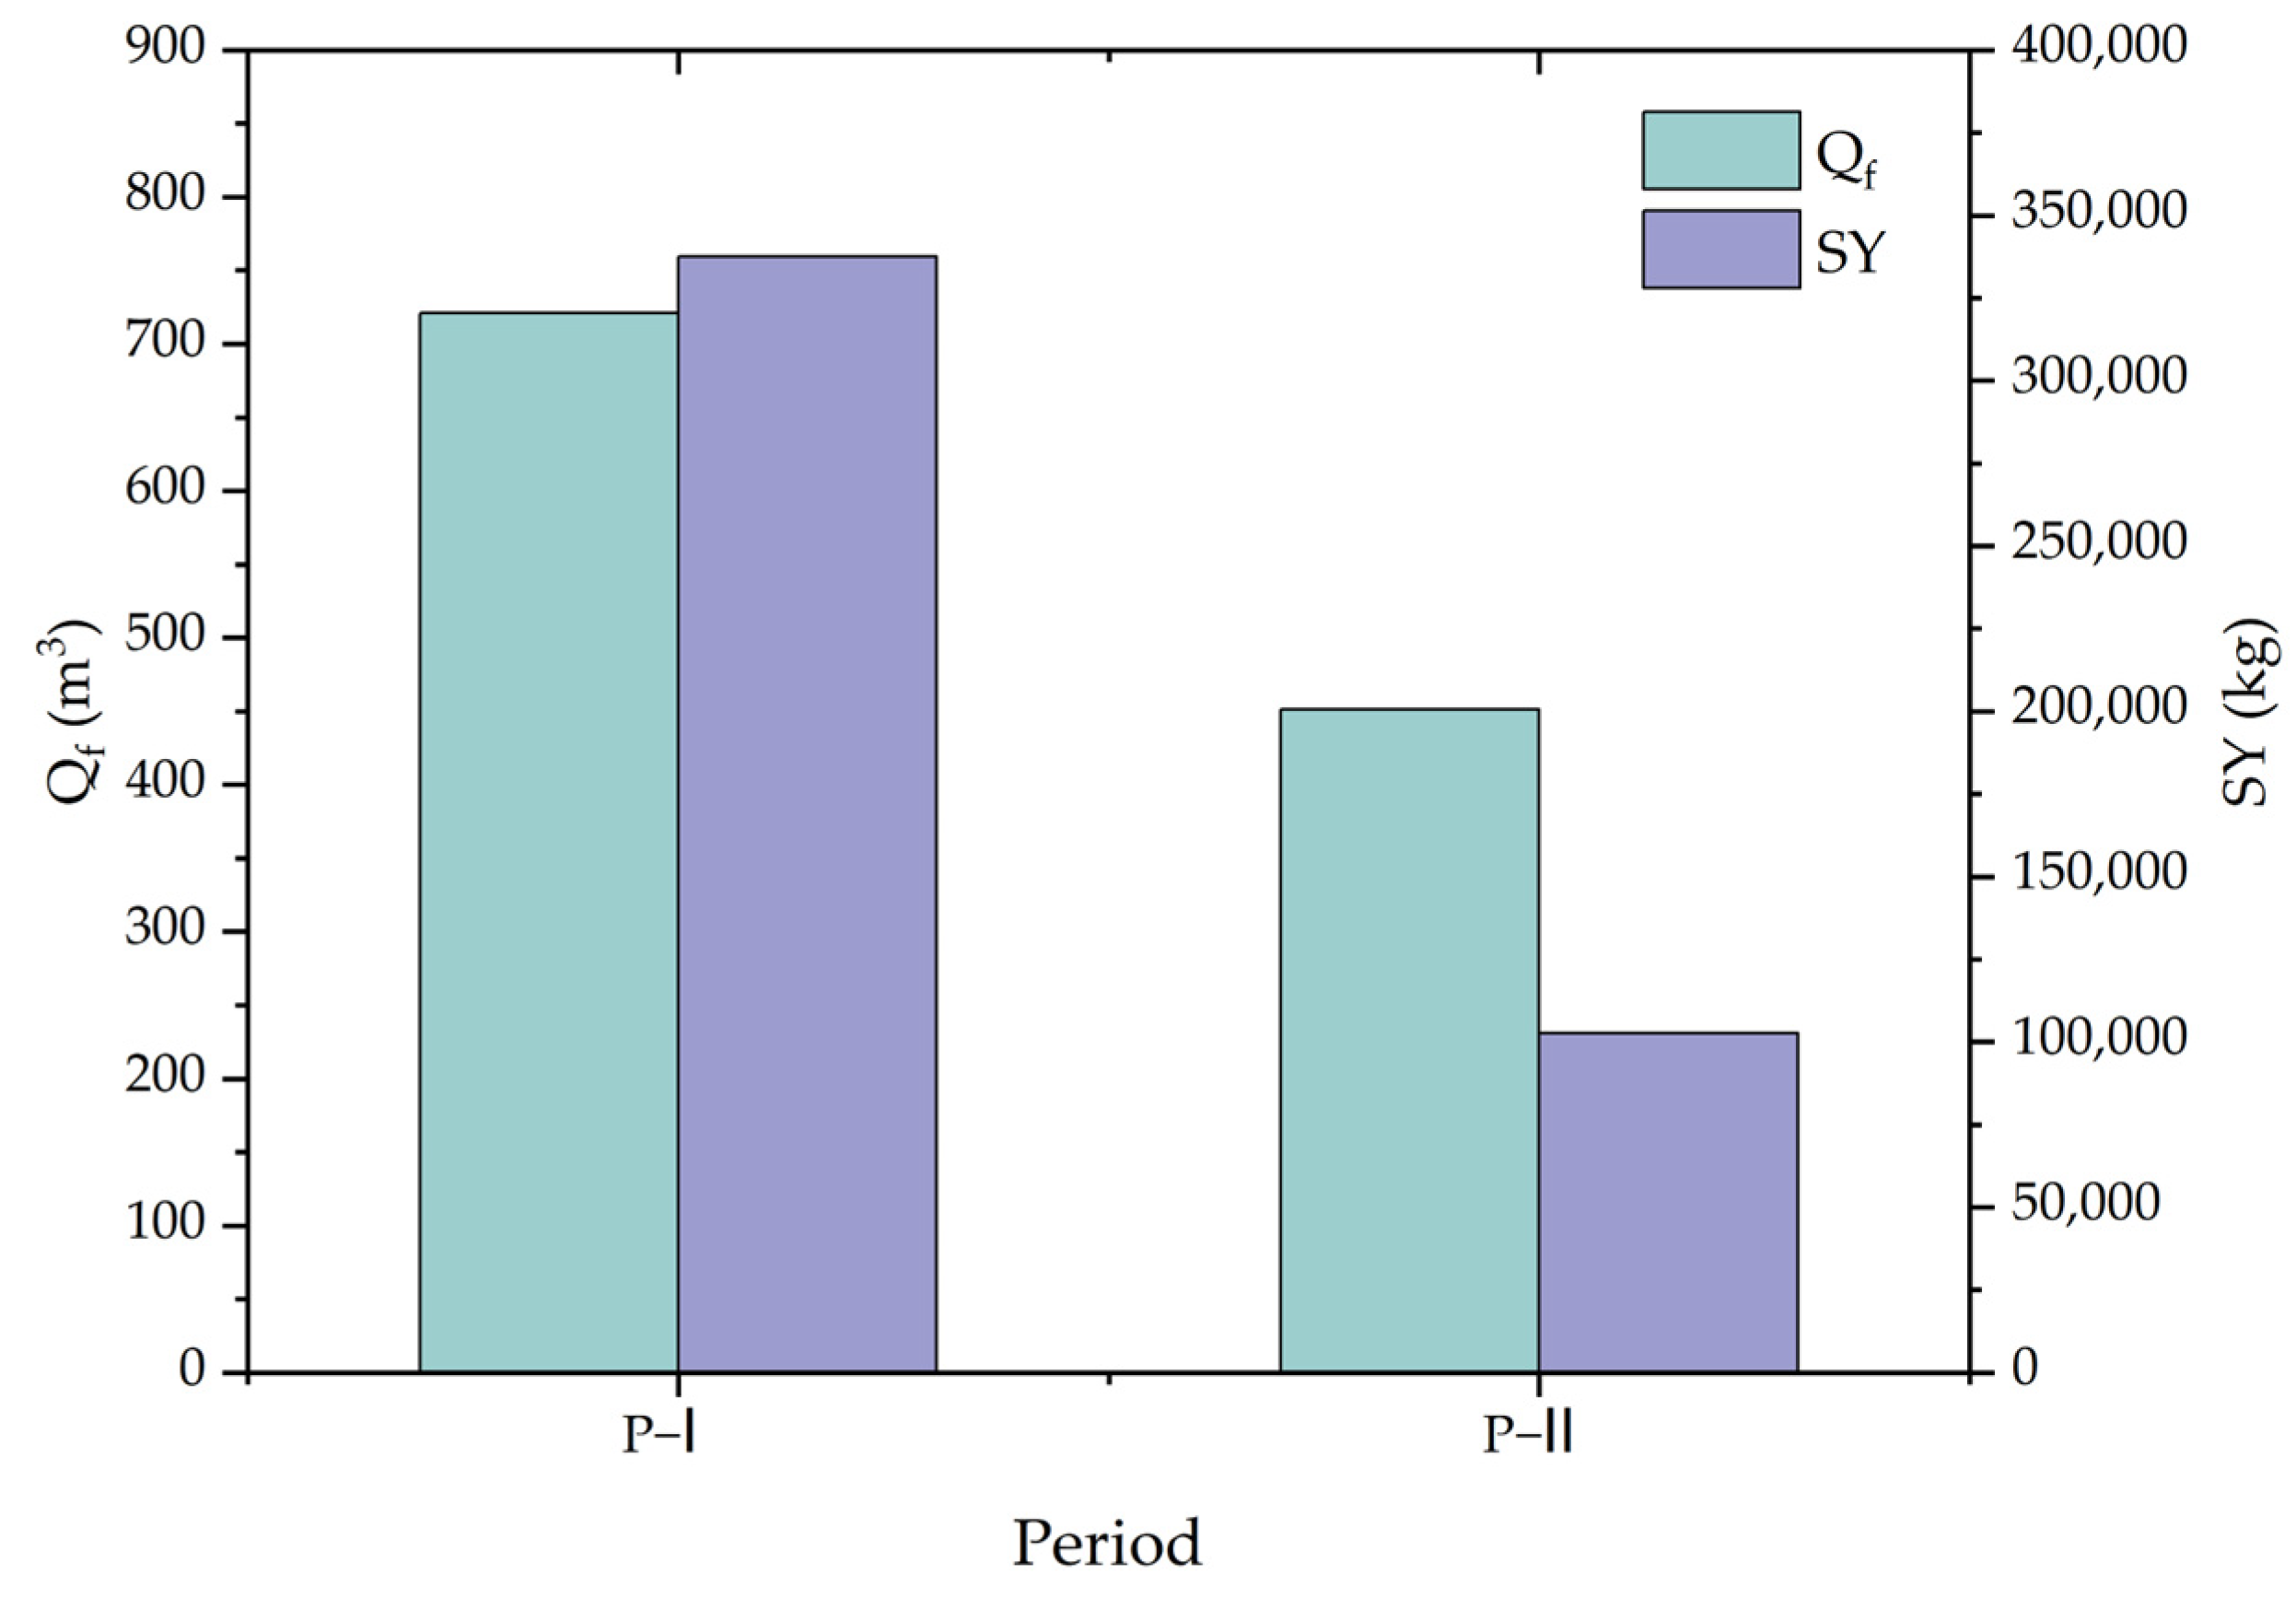
Consistent with land use, the flood characteristics changed dramatically in the Qiaogou catchment for the two periods. Compared to P-I, Qf and SY in P-II decreased by 18.37% and 59.93%, respectively. Qmax and SSCmax decreased by 19.67% and 12.07%, respectively. TQmax and T were delayed by 0.57 h and 1.38 h, respectively. In addition, the frequency of flood events triggered by the same rainfall type has changed dramatically in the Qiaogou catchment. The frequency of flood events triggered by SW, LW, and SH rainfall types was reduced by 100%, 100%, and 77.1%, respectively, in P-II, compared to P-I (Figure 11). The reason may be the reduction of soil erosion caused by the reduction of sloping cropland. The increased area of forest land and grassland can make the protection of the land surface. Vegetation can intercept rainfall, increase rainfall infiltration, reduce soil stripping, and reduce the conversion of rainfall to runoff. This led to a reduction in the flood volume, a diminishing of the flood peak discharge, and a prolongation of the flood duration [27]. Therefore, revegetation appeared to be the principal factor for the variations of runoff and sediment at the flood event scale in the Qiaogou catchment. This observation was also noted in other parts of the world. Zhang et al. analyzed the effects of forest disturbances on flood peak discharge in the Baker Creek watershed of Canada [28]. They indicated that compared to the control period (1964–1990), the flood peak discharge in the disturbance period (1990–2009) increased by 31.4% and the flood peak discharge time was advanced. Iroumé et al. studied the hydrological effects of deforestation in the La Reina watershed of Chile [29]. The findings showed that the average annual runoff increased by 110% and the peak flows increased by 33% in the watershed when the forest was fully harvested.
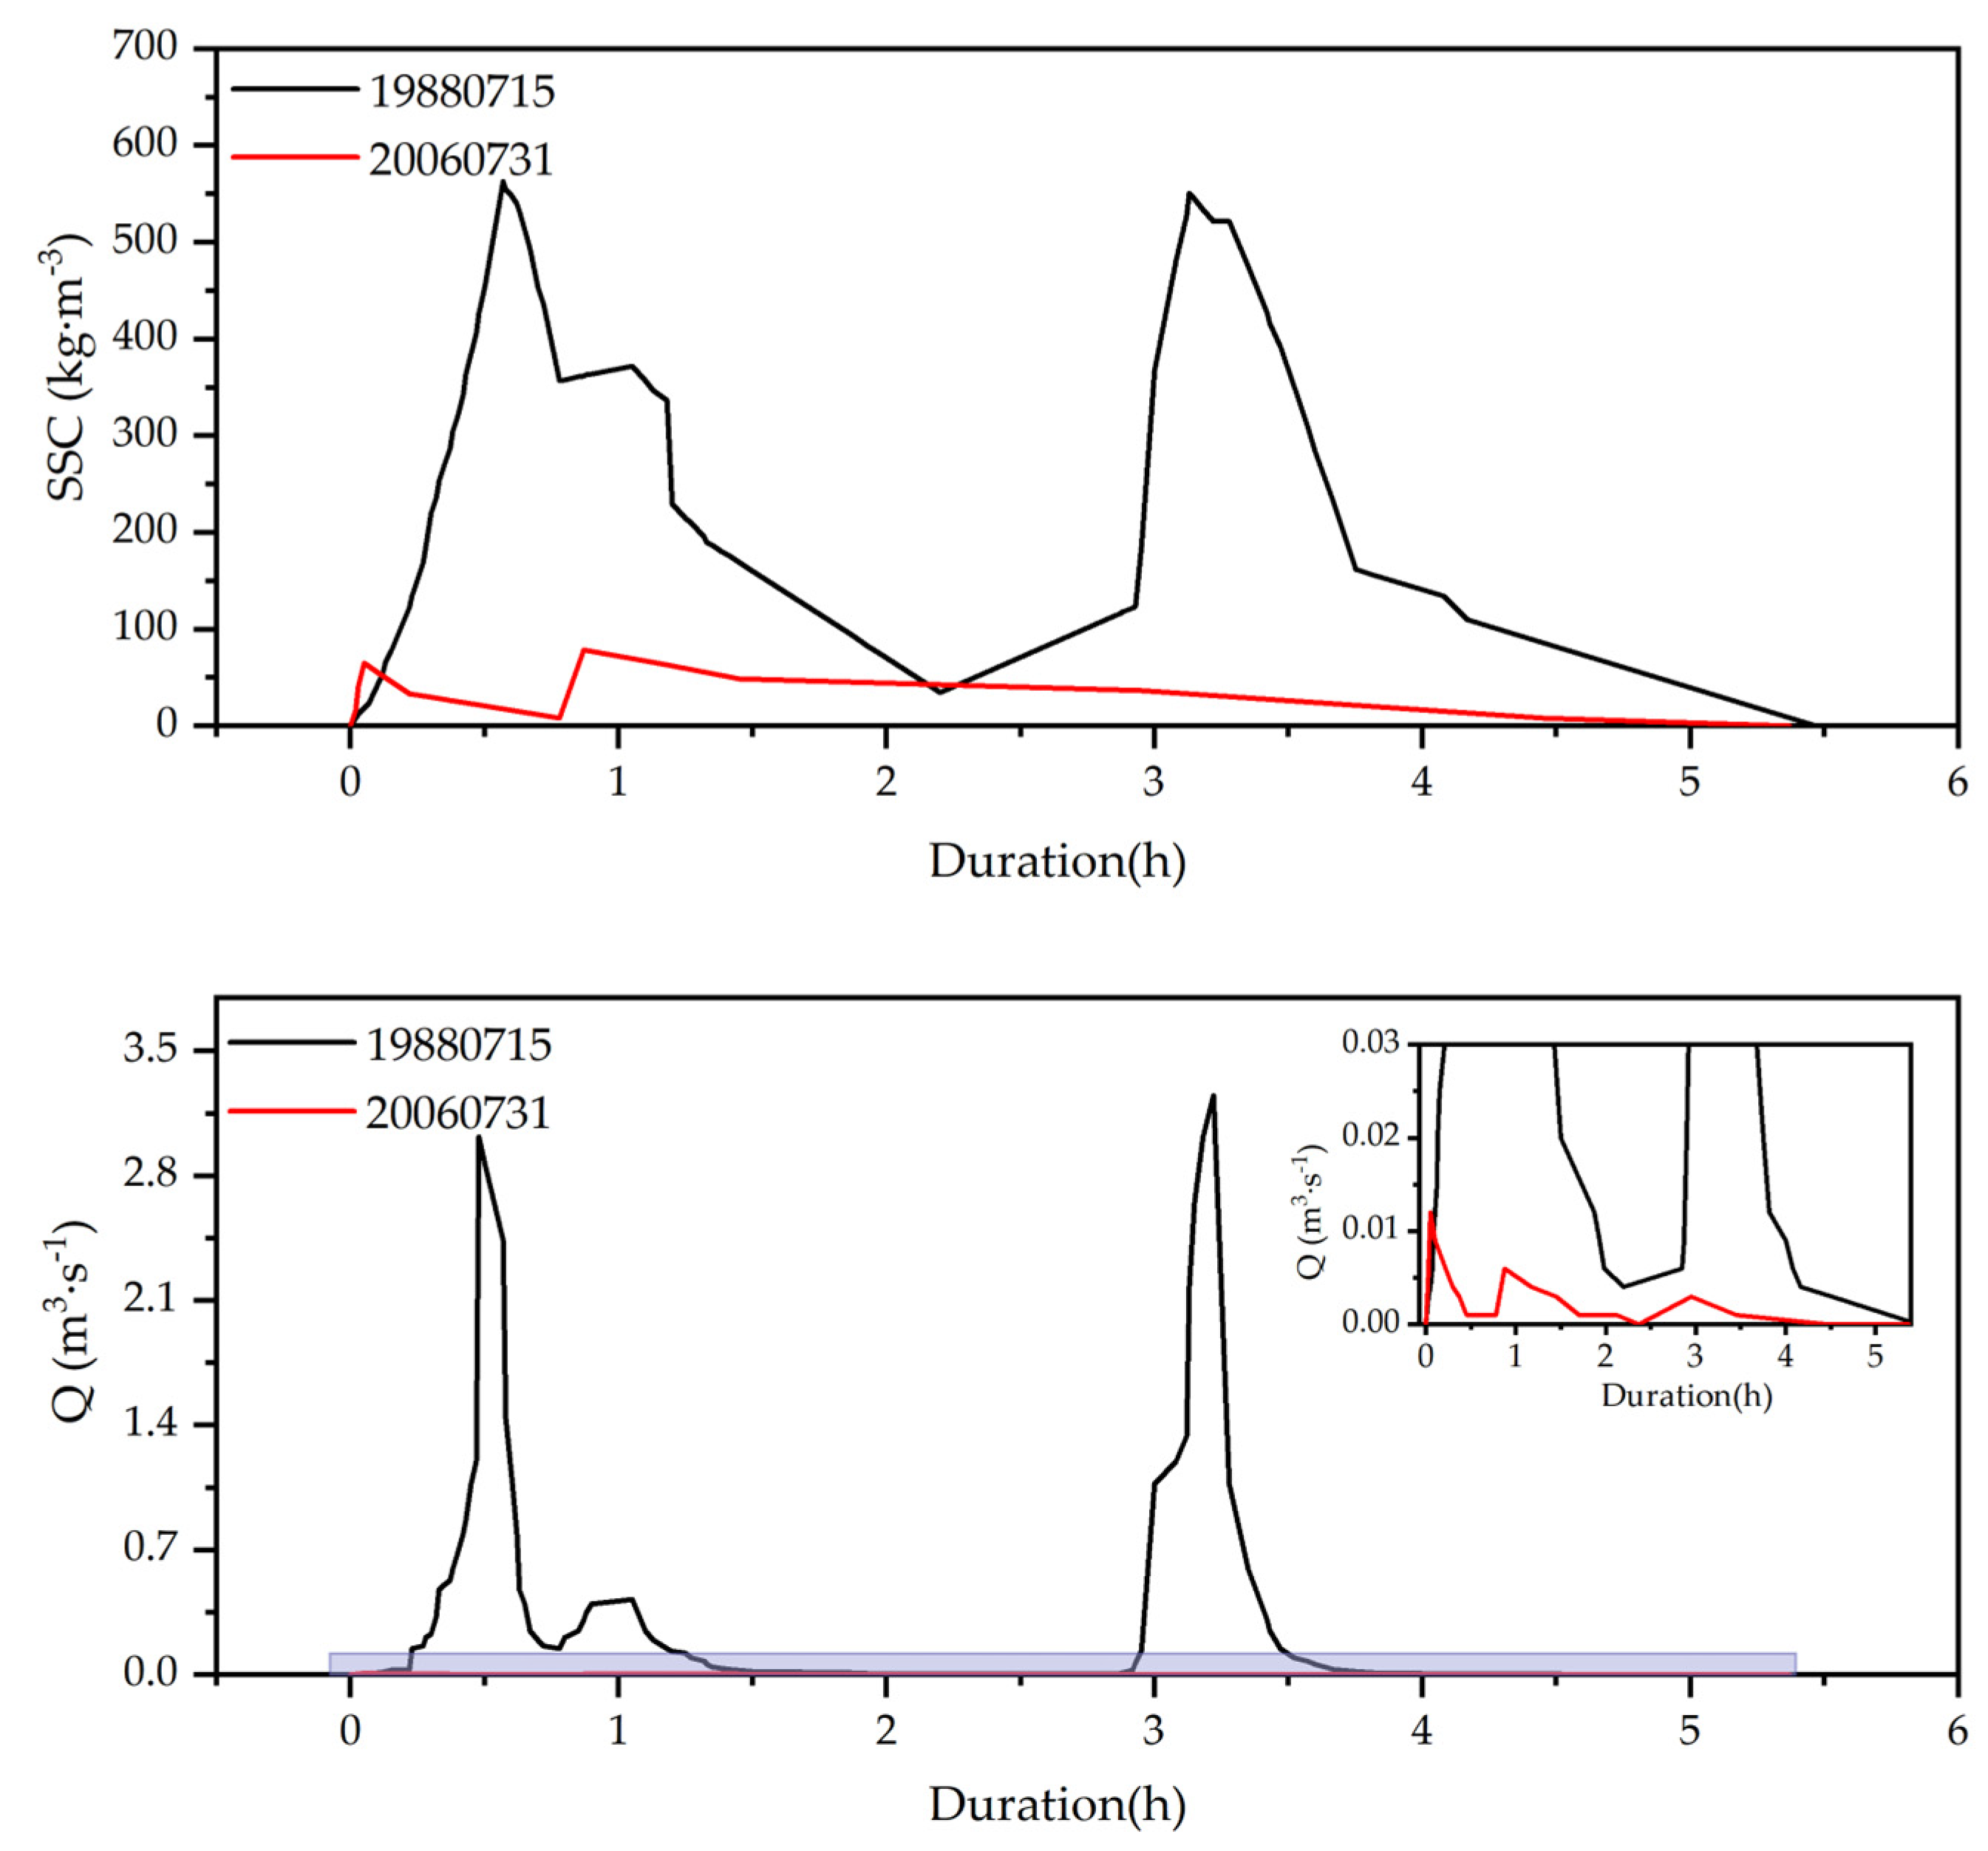
There were studies demonstrating that the corresponding variations of runoff and sediment under similar rainfall conditions can be considered as an effect of anthropogenic-induced changes in the underlying surface [18]. Taking the SH rainfall type, which mostly contributed to the runoff and sediment of the Qiaogou catchment, it was found that the Qf and SY were reduced by 37.36% and 69.57%, respectively, for P-II, compared to P-I (Figure 9). This consequence is in accordance with the study conducted by Bronstert et al. in the Rhine River Basin [30]. It was found that revegetation has a significant effect on the flooding process triggered by rainfall with short rainfall duration and heavy rainfall intensity. In addition, two typical flood events with similar rainfall characteristics distributed over two different periods, 19880715 and 20060731, were selected to compare the processes of flood and sediment transport (Figure 12). We found that the runoff and sediment concentration of the 19880715 flood event had a high peak and large volume, with the Qmax reaching 3.25 m3·s−1 and the SSCmax reaching 563 kg·m−3. The process of flood and sediment transport was steeply rising and falling, with sharp and thin peaks. For the 20060731 flood event, the process line of flood and sediment transport was reduced overall and gradually homogenized. The Qmax and SSCmax decreased dramatically to 0.012 m3·s−1 and 78.8 kg·m−3 respectively. It was calculated that the Qf and SY were 4907.82 m3 and 2,231,060.7 kg, respectively, in the 19880715 flood event (Table 4). Compared with the 19880715 flood event, the Qf and SY of the 20060731 flood event were reduced by 99.34% and 99.93%, respectively.
In general, the enforcement of the GGP has resulted in dramatic changes in land use in the Qiaogou catchment. These changes increased rainfall interception capacity, soil infiltration capacity, and runoff resistance [18,31]. And this measure reduced soil erosion and trapped sediment as it was transported from the hillside to the stream channel [32]. We believe that, as the country continued to manage soil erosion, the ecological environment of the underlying surface continued to improve and the frequency of flood events was greatly reduced. It indicated that revegetation performed an invaluable function in reducing runoff and sediment. The effects of soil erosion control were very significant. This was consistent with the works of Yang et al. and Zhao et al., which concluded that revegetation had an essential function in the reduction of Qf and SY [3,14].

5.3. Suspended Sediment Dynamics at Flood Event Scale

The SSC-Q hysteretic loops of flood events can not only reveal the dynamic processes of sediment deposition and transport but also can be used to characterize the sediment supply sources in the watersheds. The sediment in the clockwise pattern originates from the river or the gullies close to the river. The sediment of the counter-clockwise pattern originates from the upper parts of the watershed and the areas away from the river. After the peak appeared for the flow discharge, massive amounts of sediment are delivered into the river from remote areas. It results in the inconsistency between the peak that appeared for flow discharge and sediment concentration. The formation of the figure-of-eight hysteretic loops is related to the subsequent sediment supply of the clockwise hysteretic loops. It is the combination of the clockwise and counter-clockwise patterns [33]. The clockwise hysteretic loop is transformed into the figure-of-eight hysteretic loop when sufficient sediment is replenished in the falling phase of the clockwise hysteretic loop. The sediment of the compound pattern may originate from the whole basin, due to its long duration and wide range of corresponding rainfall processes.
Previous studies have shown that SSC-Q hysteretic loops were more common with clockwise patterns in small rivers [34,35]. However, the results of this study were different. In the Qiaogou catchment, the figure-of-eight pattern was dominant in P-I. This was closely related to the subsequent sediment supply in the catchment. In contrast to the “limited sediment supply” in most watersheds of the world, the Loess Plateau has abundant sources of sediment. After the peak appeared for the flow discharge, there would still be sediment input from other parts of the watershed, which tended to form the figure-of-eight pattern. Specifically, the topography of the Qiaogou catchment is fragmented, with gullies and ravines. Soil erosion is severe not only near the gullies but also on the slopes of the upper part of the catchment. This resulted in a sharp increase in SY with increasing runoff during the rising flood stage. Subsequently, after the peak appeared for the flow discharge, a large amount of sediment from the upper parts of the basin was transported into the river, which converted the clockwise hysteretic loop into the figure-of-eight hysteretic loop. In P-II, the highest percentage of the compound hysteretic loop was observed. Possible reasons for this were longer flooding duration and changes in land use, which make relationships between runoff and sediment tend to be more complex over time.
In addition, it was found by our calculations that the runoff and sediment of flood events of the same hysteretic loop for different periods differed greatly (Figure 13). The Qf, SY, Qmax, and SSCmax of counter-clockwise, figure-of-eight, and compound hysteretic loops were reduced in P-II. In addition, we found that the regression coefficient in P-I was considerably higher than that in P-II based on the results of linear regression between H and STM. It indicated that the sediment yield in the reference period was considerably higher than that in P-II at the equal flow discharge. The results confirmed that revegetation played an essential role in reducing the sediment transport capacity of runoff. Overall, we considered that, after the implementation of the GGP, the runoff and sediment of flood events was reduced due to the increase of forest land and waste grassland (compared with the reference period, the area of forest land and waste grassland in the revegetation period increased by 1554.93% and 560.93%, respectively). Revegetation reduced the scouring force of runoff formed by rainfall, decreased the sediment transport capacity per unit runoff depth, and reduced the scale of flood events. The benefits of reduction in runoff and sediment at flood scale were obvious with the implementation of the GGP in the Qiaogou catchment.

6. Conclusions

We analyzed the variations of runoff and sediment at the flood event scale using the data of 28 flood events and corresponding precipitation in the Qiaogou catchment. The study showed that rainfall with short rainfall duration and heavy rainfall intensity was the predominant rainfall type for producing floods and sediment yield in the Qiaogou catchment, and its average flood volume and sediment yield were 603.70 m3, 235,470.47 kg, respectively. Compared to the reference period, the flood volume and sediment yield of flood events in the revegetation period were reduced by 18.37% and 59.93%, respectively. The flood peak discharge and maximum suspended sediment concentration were reduced by 19.25% and 12.07%, respectively, the flood peak discharge time and flood duration were delayed by 0.57 h and 1.38 h. The regression coefficients of the fitted functions between runoff depth and sediment transport modulus in the revegetation period was lower than that in the reference period. It indicated that the sediment transport capacity per unit runoff depth in the revegetation period was lower than that in the reference period at the flood event scale. The figure-of-eight hysteretic loop and the compound hysteretic loop were the primary patterns in the reference period and the revegetation period in the Qiaogou watershed, accounting for 44% and 50% of the total floods in the two periods, respectively. Compared with the reference period, the flood volume, flood peak discharge, sediment yield, and maximum suspended sediment concentration of counter-clockwise, figure-of-eight, and compound hysteretic loops were reduced in the revegetation period. The variations in precipitation, rainfall duration, rainfall intensity, and rainfall frequency were not significant for the different periods. Rainfall contributed less to runoff and sediment of flood events. Significant variations in vegetation cover caused by the GGP were the principal reason for the dramatic reductions in runoff and sediment at the flood event scale for the two periods. The findings provided valuable information for the study of variations in flood-scale runoff and sediment processes under revegetation in the Loess Plateau. It can be used to offer a theoretical basis for soil erosion management as well as flood control and disaster mitigation in the Loess Plateau.

Author Contributions

X.F. performed the data analyses and wrote the manuscript; P.G. helped perform the analyses with constructive discussions; C.W. provided the references for the research methodology; X.C. contributed to the data analyses; X.M. contributed to the conception of the study. All authors have read and agreed to the published version of the manuscript.

Funding

This research was funded by the National Natural Science Foundation of China (U2243211; 42277354).

Data Availability Statement

The data presented in this study are available and contained within the article.

Conflicts of Interest

The authors declare no financial or scientific conflict of interest.

References

  1. Walling, D.E. Human impact on land–ocean sediment transfer by the world’s rivers. Geomorphology 2006, 79, 192–216. [Google Scholar] [CrossRef]
  2. Wei, W.; Chen, L.; Zhang, H.; Chen, J. Effect of rainfall variation and landscape change on runoff and sediment yield from a loess hilly catchment in China. Environ. Earth Sci. 2015, 73, 1005–1016. [Google Scholar] [CrossRef] [Green Version]
  3. Zhao, G.; Tian, P.; Mu, X.; Jiao, J.; Wang, F.; Gao, P. Quantifying the impact of climate variability and human activities on streamflow in the middle reaches of the Yellow River basin, China. J. Hydrol. 2014, 519, 387–398. [Google Scholar] [CrossRef]
  4. Li, L.; Ni, J.; Chang, F.; Yue, Y.; Frolova, N.; Magritsky, D.; Borthwick, A.G.L.; Ciais, P.; Wang, Y.; Zheng, C.; et al. Global trends in water and sediment fluxes of the world’s large rivers. Sci. Bull. 2020, 65, 62–69. [Google Scholar] [CrossRef]
  5. Shao, Y.; Mu, X.; He, Y.; Chen, K. Variations in runoff, sediment load, and their relationship for a major sediment source area of the Jialing River basin, southern China. Hydrol. Process. 2021, 35, e14297. [Google Scholar] [CrossRef]
  6. Wang, H.; Wang, W.; Hu, J.; Sang, Y.; Guo, W. Characterization of the evolution of runoff-sediment relationship in Min River based on coupling coordination theory. River Res. Appl. 2023, 39, 1067–1083. [Google Scholar] [CrossRef]
  7. Aras, E.; Berkun, M.; Akdemir, U.O. Water runoff, sediment transport and related impacts in the Southeastern Black Sea rivers. Environ. Eng. Manag. J. 2015, 14, 781–791. [Google Scholar] [CrossRef]
  8. Ngo, T.S.; Nguyen, D.B.; Rajendra, P.S. Effect of land use change on runoff and sediment yield in Da River Basin of Hoa Binh province, Northwest Vietnam. J. Mt. Sci. 2015, 12, 1051–1064. [Google Scholar] [CrossRef]
  9. Sonu, T.S.; Bhagyanathan, A. The impact of upstream land use land cover change on downstream flooding: A case of Kuttanad and Meenachil River Basin, Kerala, India. Urban Clim. 2022, 41, 101089. [Google Scholar]
  10. Feng, P.; Wu, J.; Li, J. Changes in flood characteristics and the flood driving mechanism in the mountainous Haihe River Basin, China. Hydrol. Sci. J. 2019, 64, 1997–2005. [Google Scholar] [CrossRef]
  11. Mehmood, A.; Jia, S.F.; Lv, A.F.; Zhu, W.B.; Mahmoodet, R.; Saifullah, A.; Ikram, R.M.A. Detection of spatial shift in flood regime of the Kabul river basin in Pakistan, causes, challenges, and opportunities. Water 2021, 13, 1276. [Google Scholar] [CrossRef]
  12. Ren, M. Sediment discharge of the Yellow River, China: Past, present and future—A synthesis. Acta Oceanol. Sin. 2015, 34, 1–8. [Google Scholar] [CrossRef]
  13. Liu, X.Y.; Li, X.Y.; Gao, Y.F.; Dang, S.Z. Changes of rainfall threshold for sediment producing in the loess hilly and gully region of the Loess Plateau. J. Hydraul. Eng. 2019, 50, 1177–1188. (In Chinese) [Google Scholar]
  14. Yang, S.; Kang, T.; Bu, J.; Chen, J.; Gao, Y. Evaluating the Impacts of Climate Change and Vegetation Restoration on the Hydrological Cycle over the Loess Plateau, China. Water 2019, 11, 2241. [Google Scholar] [CrossRef] [Green Version]
  15. Li, P.; Chen, J.; Zhao, G.; Holden, J.; Liu, B.; Chan, F.K.S.; Hu, J.; Wu, P.; Mu, X. Determining the drivers and rates of soil erosion on the Loess Plateau since 1901. Sci. Total Environ. 2022, 823, 153674. [Google Scholar] [CrossRef]
  16. Zheng, H.Y.; Miao, C.Y.; Wu, J.; Lei, X.; Liao, W.; Li, H. Temporal and spatial variations in water discharge and sediment load on the Loess Plateau, China: A high-density study. Sci. Total Environ. 2019, 666, 875–886. [Google Scholar] [CrossRef]
  17. Jia, L.; Yu, K.-X.; Li, Z.-B.; Li, P.; Zhang, J.-Z.; Wang, A.-N.; Ma, L.; Xu, G.-C.; Zhang, X. Temporal and spatial variation of rainfall erosivity in the Loess Plateau of China and its impact on sediment load. Catena 2022, 210, 105931. [Google Scholar] [CrossRef]
  18. Hu, J.; Zhao, G.; Mu, X.; Tian, P.; Gao, P.; Sun, W. Quantifying the impacts of human activities on runoff and sediment load changes in a Loess Plateau catchment, China. J. Soils Sediments 2019, 19, 3866–3880. [Google Scholar] [CrossRef]
  19. Zhang, Y.; Bi, Z.; Zhang, X.; Yu, Y. Influence of Landscape Pattern Changes on Runoff and Sediment in the Dali River Watershed on the Loess Plateau of China. Land 2019, 8, 180. [Google Scholar] [CrossRef] [Green Version]
  20. Xie, M.; Zhang, X.M.; Zhao, Y.; Wang, Z.Y. The mechanism of response of runoff and sediment yield to precipitation and LUCC in Beiluohe River basin. J. China Inst. Water Resour. Hydropower Res. 2019, 17, 39–44. (In Chinese) [Google Scholar] [CrossRef]
  21. Zhang, X.P.; Lin, P.F.; Chen, H.; Yan, R.; Zhang, J.J.; Yu, Y.P.; Liu, E.J.; Yang, Y.H.; Zhao, W.H.; Lv, D.; et al. Understanding land use and cover change impacts onrun-off and sediment load at flood events on the Loess Plateau, China. Hydrol. Process. 2018, 32, 576–589. [Google Scholar] [CrossRef]
  22. Liu, S.S.; Li, X.B.; Liu, S.J.; Du, X. Study on water and sediment variation of the typical small watershed in loess hilly and gully region at different spatial scales. J. Sediment. Res. 2022, 47, 51–58. (In Chinese) [Google Scholar] [CrossRef]
  23. Williams, G.P. Sediment concentration versus water discharge during single hydrologic events in rivers. J. Hydrol. 1989, 111, 89–106. [Google Scholar] [CrossRef]
  24. Morin, E.; Goodrich, D.C.; Maddox, R.A.; Gao, X.; Gupta, H.V.; Sorooshian, S. Spatial patterns in thunderstorm rainfall events and their coupling with watershed hydrological response. Adv. Water Resour. 2006, 29, 843–860. [Google Scholar] [CrossRef] [Green Version]
  25. Kinnell, P.I.A. Raindrop-impact-induced erosion processes and prediction: A review. Hydrol. Process. 2005, 19, 2815–2844. [Google Scholar] [CrossRef]
  26. Wan, L.; Zhang, X.P.; Ma, Q.; Zhang, J.J.; Ma, T.Y.; Sun, Y.P. Spatiotemporal characteristics of precipitation and extreme events on the Loess Plateau of China between 1957 and 2009. Hydrol. Process. 2014, 28, 4971–4983. [Google Scholar] [CrossRef]
  27. Gu, C.J.; Mu, X.M.; Sun, W.Y.; Gao, P.; Zhao, G.J. Comparative analysis of the responses of Rainstorm Flood and Sediment Yield to Vegetation Rehabilitation in the Yanhe River Basin. J. Nat. Resour. 2017, 32, 1755–1767. (In Chinese) [Google Scholar]
  28. Zhang, M.; Wei, X. Alteration of flow regimes caused by large-scale forest disturbance: A case study from a large watershed in the interior of British Columbia, Canada. Ecohydrology 2014, 7, 544–556. [Google Scholar] [CrossRef]
  29. Iroumé, A.; Mayen, O.; Huber, A. Runoff and peak flow responses to timber harvest and forest age in southern Chile. Hydrol. Process. 2006, 20, 37–50. [Google Scholar] [CrossRef]
  30. Bronstert, A.; Bárdossy, A.; Bismuth, C.; Buiteveld, H.; Disse, M.; Engel, H.; Fritsch, U.; Hundecha, Y.; Lammersen, R.; Niehoff, D.; et al. Multi-scale modelling of land-use change and river training effects on floods in the Rhine basin. River Res. Appl. 2007, 23, 1102–1125. [Google Scholar] [CrossRef]
  31. Gu, C.; Mu, X.; Gao, P.; Zhao, G.; Sun, W.; Tatarko, J.; Tan, X. Influence of vegetation restoration on soil physical properties in the Loess Plateau, China. J. Soils Sediments 2019, 19, 716–728. [Google Scholar] [CrossRef]
  32. Boix-Fayos, C.; Barberá, G.; López-Bermúdez, F.; Castillo, V. Effects of check dams, reforestation and land-use changes on river channel morphology: Case study of the Rogativa catchment (Murcia, Spain). Geomorphology 2007, 91, 103–123. [Google Scholar] [CrossRef]
  33. Lana-Renault, N.; Regüés, D. Seasonal patterns of suspended sediment transport in an abandoned farmland catchment in the Central Spanish Pyrenees. Earth Surf. Process. Landf. 2009, 34, 1291–1301. [Google Scholar] [CrossRef]
  34. Lenzi, M.A.; Marchi, L. Suspended sediment load during floods in a small stream of the Dolomites (northeastern Italy). Catena 2000, 39, 267–282. [Google Scholar] [CrossRef]
  35. Rovira, A.; Batalla, R.J. Temporal distribution of suspended sediment transport in a Mediterranean basin: The Lower Tordera (NE SPAIN). Geomorphology 2006, 79, 58–71. [Google Scholar] [CrossRef]
Figure 1. Location of rain gauges and the hydrological station in the Qiaogou catchment.
Water 15 02690 g001
Figure 2. Results of rainfall types discriminant analysis in the Qiaogou catchment.
Water 15 02690 g002
Figure 3. Qf and SY of different rainfall types for the study period in the Qiaogou catchment.
Water 15 02690 g003
Figure 4. Comparison of the flood characteristics for different periods in the Qiaogou catchment.
Water 15 02690 g004
Figure 5. Relationship between runoff depth and sediment transport modulus of flood events for different periods in the Qiaogou catchment.
Water 15 02690 g005
Figure 6. Different patterns of hysteretic loops.
Water 15 02690 g006
Figure 7. Characteristics of rainfall for different periods in the Qiaogou catchment. (a) Comparison of precipitation for different periods. (b) Comparison of rainfall duration for different periods. (c) Comparison of rainfall intensity for different periods.
Water 15 02690 g007
Figure 8. Frequency of different rainfall types for different periods in the Qiaogou catchment.
Water 15 02690 g008
Figure 9. Comparison of the Qf and SY of SH rainfall type for different periods in the Qiaogou catchment.
Water 15 02690 g009
Figure 10. Land-use changes in the Qiaogou catchment for different periods. (a) Percentage of different land-use types for different periods. (b) Net conversion of different land-use types. (T: Terrace; C: Sloping cropland; F: Forest land; S: Shrubland; W: Waste grassland).
Water 15 02690 g010
Figure 11. The frequency of different rainfall types triggering flood events for different periods in the Qiaogou catchment. (FR: The frequency of rainfall triggering flood events; NFR: The frequency of rainfall not triggering flood events).
Water 15 02690 g011
Figure 12. The processes of flooding and sediment transport of two typical flood events.
Water 15 02690 g012
Figure 13. Comparison of Qf, SY, Qmax, and SSCmax of counter-clockwise, figure-of-eight, and compound hysteretic loops for different periods. (CCW: Counter-clockwise hysteretic loops; FE: Figure-of-eight hysteretic loops; CP: Compound hysteretic loops).
Water 15 02690 g013
Table 1. Flood variables and correlated abbreviations.
Runoff-Relative VariablesSediment-Relative VariablesPrecipitation-Relative Variables
Event flood volume (Qf, m3)Event sediment yield (SY, kg)Event total precipitation (P, mm)
Event flood peak discharge (Qmax, m3·s−1)Event maximum suspended sediment concentration (SSCmax, kg·m−1)Event rainfall duration (D, h)
Event flood peak discharge time (TQmax, h) Event rainfall intensity (I, mm·h−1)
Event flood duration (T, h)
Table 2. Characteristics of different rainfall types in the Qiaogou catchment.
Rainfall TypesCharacteristics IndexFrequencyProportion/%
D/hI/(mm·h−1)
SWMean4.651.6213648.23
V252.830.88
V756.162.07
LWMean13.291.388530.14
V2510.170.77
V7514.921.69
SHMean2.226.906121.63
V250.874.63
V752.478.92
Table 3. The frequency of the hysteretic loops in different periods.
PeriodsHysteretic Loops
ClockwiseCounter-ClockwiseFigure-of-EightCompound
P-I (1986–1988)2583
P-II (2001–2009)0145
Table 4. Characteristics of rainfall and flood of two typical flood events.
Flood EventsD/hP/mmI/mm·h−1Qf/m3Qmax/m3·s−1SY/kgSSCmax/kg·m−3
198807155.9261.4510.384907.823.252,231,060.7563.0
200607315.5960.7310.8632.460.0121470.278.8
Disclaimer/Publisher’s Note: The statements, opinions and data contained in all publications are solely those of the individual author(s) and contributor(s) and not of MDPI and/or the editor(s). MDPI and/or the editor(s) disclaim responsibility for any injury to people or property resulting from any ideas, methods, instructions or products referred to in the content.