Article

Analysis of Dry-Wet Changes and the Driving Factors in Mainland China under Climate Change

1
Faculty of Geographical Science, Beijing Normal University, Beijing 100875, China
2
Zhuhai Branch of State Key Laboratory of Earth Surface Processes and Resource Ecology, Beijing Normal University at Zhuhai, Zhuhai 519087, China
3
State Key Laboratory of Simulation and Regulation of a Water Cycle in a River Basin, China Institute of Water Resources and Hydropower Research, Beijing 100875, China
4
College of Arts and Sciences, Beijing Normal University at Zhuhai, Zhuhai 519087, China
5
College of Education for the Future, Beijing Normal University at Zhuhai, Zhuhai 519087, China
*
Author to whom correspondence should be addressed.
Water 2023, 15(15), 2737; https://doi.org/10.3390/w15152737
Submission received: 24 June 2023 / Revised: 20 July 2023 / Accepted: 22 July 2023 / Published: 28 July 2023
(This article belongs to the Section Water and Climate Change)

Abstract

:
Evaluation of changes in dry-wet climate is crucial in the context of global climate change to ensure regional water resources, ecosystem stability, and socio-economic development. Long-term daily meteorological data, including temperature, precipitation, relative humidity, wind speed, sunshine duration, and air pressure data from 1680 stations across mainland China from 1971 to 2019, were collected to investigate the temporal and spatial variations in aridity index (AI), precipitation (P), reference evapotranspiration (ET0), and the underlying driving climatic factors. Results indicated that the Northwest, Northeast, and Huang-Huai regions were undergoing significant wetting processes, while the Southwest and Southeast China were undergoing significant drying processes. The changing AI was mainly decided by the changing trends of ET0. For most regions, ET0 has undergone significant increases. The average increasing rate over mainland China was 3.76 mm/10a. Stations with decreasing trends were mainly located in the Tibet Plateau, Huang-Huai, and northern Northeast China. Trends in ET0 were negatively affected by the increasing changes in relative humidity and positively affected by the decreasing changes in wind speed and sunshine duration and the increasing changes in air temperature. Wind speed and relative humidity were found to be the main dominant factors driving the changes in ET0, and their contribution varied with regions. Huang-Huai and northern Northeast China showed a significant downward trend in ET0, mainly driven by the decrease in wind speed, while the increase in relative humidity was the primary contributor to the significant upward trends in ET0 across all other regions in China.

1. Introduction

The global climate has undergone significant changes since the Industrial Revolution. In particular, the average global surface temperature of the Earth has risen by 0.99 °C between 2001 and 2020 compared to the average temperature between 1850 and 1900, with a 95% confidence interval ranging from 0.95 to 1.20 °C. According to the IPCC [1], this increase is projected to continue throughout the 21st century. The continuous surface warming is amplifying the water cycle, resulting in increased evaporation rates and a higher water vapor content in the atmosphere. This leads to heightened intensity of rainfall and floods in certain regions, while other regions are affected by more severe droughts than before. Observations and model outputs suggest that the rise in global temperatures is resulting in increased atmospheric water vapor, heightened thermal contrasts between land and sea, alterations in large-scale atmospheric circulation patterns, and variations in regional rainfall and evapotranspiration intensity. The wet-dry climate pattern is being impacted by these changes. It is essential to investigate the long-term trends in regional dry-wet conditions in the context of global climate change to ensure the security of regional water resources, ecological stability, and socio-economic development.
The assessment of regional dry-wet conditions and their variations typically involves the use of water balance and index methods [2]. The water balance approach takes into account the complex interactions among precipitation, soil moisture, and evapotranspiration. However, due to the limited availability of large-scale soil moisture data, the index method, which focuses on precipitation and evapotranspiration only, is more practical for quantifying regional dry-wet conditions. The index method includes several indexes, such as the Aridity Index (AI), Standardized Precipitation Evapotranspiration Index (SPEI), Palmer Drought Severity Index (PDSI), and Meteorological Drought Composite Index (CI) [2,3,4,5,6]. Among these, the aridity index (AI) is the most widely adopted, which reflects regional dry-wet conditions by comparing water inputs and outputs, as it is defined as the ratio of precipitation to evaporation. AI has been adopted by the United Nations Environment Programme (UNEP) to establish four classification standards for arid areas (UNEP, 1992). Hulme [7] further classified nine arid and semi-arid regions globally using the UNEP criteria.
The balance of regional water is governed by the principle that changes in precipitation and evaporation affect water receipts and expenditures and inevitably impact the dry-wet conditions in the region [5]. Precipitation measurement can be directly obtained through the use of rain gauges, while determining evapotranspiration, which includes water surface evaporation, soil evaporation, and plant transpiration, is more challenging, particularly at large spatial scales. Although evaporation pan measurements can only provide information on water surface potential evaporation, various empirical formulas have been developed to estimate evapotranspiration based on directly measurable meteorological elements. Several methods have been utilized to estimate reference evapotranspiration (ET0), which is defined as the potential evapotranspiration of a hypothetical actively grown and adequately irrigated green grass surface of uniform height, including water balance, mass transfer, radiation, and temperature-based equations [8,9,10,11,12]. The FAO-56 Penman-Monteith formula, which is based on energy balance and water vapor diffusion theory, is more accurate than other methods [13,14,15,16,17].
A significant body of literature has investigated precipitation variation trends in different regions, as precipitation data is diverse and readily available [18,19,20]. However, studies examining evapotranspiration trends are scarce, especially in developing countries, due to the high data requirements of the FAO-56 Penman-Monteith formula, which calls for temperature, wind speed, relative humidity, and sunshine duration data. There are limited stations that collect all these parameters for long time series, and even fewer stations have reliable data [21]. In China, existing research on evapotranspiration primarily focuses on arid and semi-arid regions in the Northwest, where Zhang et al. [22] found a consistent humidification trend since 1961, particularly since 1987, in the northern part of the Northwest and a switch from a drying trend to a wetting trend in the eastern part of the Northwest since 1998.
The variation of wet-dry conditions and its driving factors exhibit regional differences due to geographical variations [23]. China, with its vast study area and diverse climate types, experiences distinct impacts of climate change and region-specific responses. However, previous studies have primarily focused on specific regions of China, particularly northern China, where the variation of dry-wet conditions and its driving factors have been extensively investigated [24,25,26]. A comprehensive perspective of the entire country is lacking. Therefore, this study aims to assess the spatial-temporal variation trends in aridity index (AI), annual precipitation, and reference evapotranspiration in China using long-term (1971–2019) and abundant meteorological data (1680 stations). Furthermore, the study will explore the contributions of temperature, relative humidity, wind speed, and sunshine duration to ET0, aiming to provide a comprehensive understanding of the variations in dry and wet conditions in China within the context of global climate change and identify the dominant factors influencing these changes.

2. Data and Method

2.1. Study Area

The study area focuses on the mainland China, where climate is significantly influenced by the East Asian Monsoon, topography, and the position of land and sea. The variation in hydrothermal conditions is attributed to differences in longitude, latitude, and altitude, resulting in different climatic zones across the country [27]. According to the China National Standard of Meteorological and Geographical Division [28], eleven meteorological and geographical divisions were established, as shown in Figure 1a. These divisions include Northeast China (NEC), North China (NC), Huang-Huai (HH), Jianghan (JHA), Jiang-Huai (JHU), Jiangnan (JN), South China (SC), Inner Mongolia (IM), Northwest China (NWC), the Tibet Plateau (TP), and Southwest China (SWC). Further, each division was divided into several sub-divisions based on hydrothermal conditions, as indicated in Figure 2 by dashed lines. The meteorological geographical divisions range in land area from 130 × 103 km2 (JHA) to 2920 × 103 km2 (NWC) (as shown in Table 1).

2.2. Data Collection

Daily meteorological data, including temperature (°C), precipitation (mm), relative humidity (%), wind speed at 10 m height (m/s), sunshine duration (h), and air pressure (hPa), were collected from 1971–2019 across mainland China. The data was obtained from the National Meteorological Information Center (NMIC) of the China Meteorological Administration (CMA) and underwent basic quality control by the CMA [29]. Additional quality control was carried out based on the specifications for surface meteorological observation [30]. The criteria used to select stations with continuous data series during the study period were as follows: (1) if the number of missing days in a month exceeded seven, the month was considered missing; (2) if the number of missing months in a year was greater than one, the year was considered missing; (3) if one of the six meteorological elements of a station was missing for more than one year, the station was considered missing. A total of 1680 stations with continuous observations from 1971 to 2019 were selected after meeting the above criteria for all seven meteorological elements. The spatial distribution of the stations can be seen in Figure 1a.

2.3. Calculation of the Aridity Index and ET0

The aridity index (AI) is a dimensionless index used to describe the dry-wet conditions of regions. It is calculated as the ratio of precipitation (P) to reference evapotranspiration (ET0) as follows:
A I = P E T 0
where ET0 is defined as the potential evapotranspiration of a hypothetical surface of green grass of uniform height that is actively growing and adequately watered [12]. The value of AI reflects the wet-dry condition of a region to a certain extent, with a value greater than 1 indicating that regional water income is greater than water expenditure, and the larger the AI value, the wetter the area is. In contrast, a value less than 1 indicates that regional water income is less than regional water expenditure, and the lower the AI value, the dryer the area is. According to the United Nations Environment Programme (UNEP) classification criteria for wet-dry zones [31] and considering the climate characteristics of China, mainland China can be classified into the following zones based on AI: extreme arid zone (AI < 0.05); arid zone (0.05 ≤ AI < 0.2); semi-arid zone (0.2 ≤ AI < 0.5); sub-humid zone (0.5 ≤ AI < 1.0); and humid zone (AI ≥ 1.0).
In Equation (2), precipitation data were obtained from observations, while ET0 was calculated by the Penman-Monteith formula recommended by the FAO as follows [8,32]:
E T 0 = 0.408 × R n + γ 900 T + 273 u 2 e s e a + γ 1 + 0.34 u 2
where Rn is net radiation at the reference surface (MJ m−2d−1), 𝛾 is the psychrometric constant (kPa °C−1), Δ is the slope of the vapor pressure curve versus temperature (kPa °C−1), U2 is the wind speed at 2 m height (m s−1), T is the mean daily air temperature measured at 2 m (°C), e s and e a is the saturation vapor pressure (kPa) and the actual vapor pressure (kPa), which can be calculated as follows:
e s = 0.3054 exp 17.27 × T m a x 237.3 + T m a x + e x p ( 17.27 × T m i n 237.3 + T m i n )
e a = e s × R H
where T m a x and T m i n are the daily maximum and minimum air temperature at 2 m (°C), respectively, and RH is the relative humidity (%). Rn formula is as follows:
R n = R a × 1 α R b o × 1.35 × R a R m a x 0.35
where α is the albedo, which can be set to 0.23 under the condition of the standing crop. R b o can be calculated as follows:
R b o = 0.34 0.14 e a × 4.9 × 1 0 9 × T 4
As the wind speed collected from the meteorological station is observed at 10 m height, it should be converted to a 2 m height wind speed as follows:
u 2 = u 10 · 4.87 log 67.8 × 10 5.42  
According to precipitation observations from 1971 to 2019, the average annual precipitation in China varied from 8.6 mm to 2762 mm, with a mean of 933 mm, as depicted in Figure 1b. The distribution of precipitation decreased from the Southeast to the Northwest. The mean daily temperature ranged from −4.2–27.0 °C with a mean of 12.5 °C. The ET0 (reference evapotranspiration) ranged from 120.9 to 2564.7 mm, with an average of 705.9 mm. Unlike annual precipitation, the spatial distribution of ET0 in China increased from the Southeast to the Northwest. Northern Northwest China had the highest ET0 of 1029.8 mm, while Northeast China and central Southwest China had the lowest ET0 of 663.9 and 495.2 mm, respectively, as shown in Figure 1c.

2.4. Trend Analysis

The rank-based Mann-Kendall method has been adopted in this study to determine the long-term variation trends for meteorological indicators [33,34], and the Z statistics were calculated. It is an increasing trend if Z > 0, a decreasing trend if Z < 0, and no trend while Z = 0. The null hypothesis will be rejected at a 90% significant level, 95% significant level, or 99% significant level when the absolute value of Z is greater than 1.645, 1.96, or 2.576, respectively. The Theil-Sen Approach (TSA) was applied to calculate the trend slope of sequence β and the TSA slope β, as follows [35,36]:
β = M e d i a n x j x i j i , j > i
where a positive β indicates an ‘upward trend’, and vice versa. The changing trends were defined as the trend magnitude in 10 years as follows:
T r e n d V i = β × 10
Meanwhile, the relative changing trends were calculated as well using the following equation:
R T V i = T r e n d V i A v e v i
A v e v i represents the average during 1971–2019.
To determine the significance of variation over a specific region, the field significance test was conducted on AI, annual precipitation, annual ET0, the average daily temperature, relative humidity, wind speed, and sunshine duration. Renard et al. [37] suggested the resampling-based bootstrap and the FDR (False Discovery Rate) methods, as these two methods are both adequate and robust in detecting field significance. The resampling-based bootstrap procedure was applied to determine the field significance of the MK test for all indices [37,38]. The procedure can be found in Wang et al. [20].

2.5. Sensitivity and Contributors

The sensitivity coefficient measures the relationship between the rate of change in ET0 and the rate of change in meteorological factors [39]. The sensitivity coefficient is mathematically defined to assess the impact of climate variables on ET0 and identify the factors that drive long-term changes in evaporation [40]. Positive sensitivity coefficients indicate that ET0 increases with an increase in climate variables, while negative sensitivity coefficients indicate a decrease in ET0 with an increase in climate variables [12]. The contribution of climate variables to ET0 can be expressed as the relative change rate of climate factors over many years ( R V i ) multiplied by the sensitivity coefficient ( S V i ) [41,42], and the calculation formula is as follows:
G V i = S V i · R V i
The sensitivity coefficient ( S V i ) is calculated by the following equation:
S V i = E T 0 E T 0 V i V i = E T 0 V × V i E T 0
where Vi is the ith climate variable and S V i   is the sensitivity coefficient of ET0 related to Vi, E T 0 is the daily variation of ET0, V i is the daily variation of the ith climate variable. The relative change rate of climate factors over many years ( R V i ) is expressed as:
R V i = V i V i = n · β V i V i
where β V i is the Theil-Sen estimator [35] and 𝑛 is the years’ number. G V i > 0 represents a positive contribution and the increase of ET0 caused by climate factor change, G V i < 0 represents a negative contribution and the increase of ET0 caused by climate factor change.

3. Results

3.1. Trends in Regional Wet-Dry Climate

3.1.1. Trends in the Aridity Index

The aridity index (AI) in China varied between 0.01 and 6.47, with a gradual increase from Northwest to eastern China, as shown in Figure 2a. Based on the United Nations Environment Programme (UNEP) classification criteria, China can be categorized into five zones: extremely arid, arid, semi-arid, semi-humid, and humid. The northwestern region of China was classified as extremely arid and arid zones, the Southeast and northern Northeast as humid zones, and the semi-arid and sub-humid zones were situated in between (Figure 2a).
The aridity index in China from 1971 to 2019 ranged from −24.6 to 21.2%/10a, with an average of −0.2%/10a. The variation showed an increasing trend in Northeast China, Northwest China, and the Huang-Huai region, while a decreasing trend was seen in Southwest China and Southeast China. The AI increased significantly in Northwest China, Northeast China, and the Huang-Huai region and decreased significantly in Southwest and Southeast China. There are 17.5% of the 40 meteorological geographic division subregions showing a significant increase in AI, primarily located in northern Northeast China, the central Huang-Huai region, western Southwest China, and Northwest China, as well as the Tibet Plateau. In these regions, 20% to 50% of stations showed significant increases in AI. Conversely, 15% of the 40 subregions had a significant decrease in AI, including southern China and the west of Southwest China. In these regions, AI at more than 20% of stations showed a significant decrease (as shown in Table 2).
Shen et al. [2] conducted an analysis of the temporal and spatial variation of the AI in China using meteorological data from 616 geographic stations between 1975 and 2004. Their study revealed that the AI in China exhibited an increasing trend from Northwest to Southeast, with the main trend of aridification occurring in the semi-arid and sub-humid zones, Southeast of the humid zone, and in Chongqing and Sichuan provinces. These findings are consistent with the results of this study.

3.1.2. Trends in Annual Precipitation and ET0

As shown in Figure 3a,c, annual precipitation in most regions of China showed insignificant change during the past 50 years. Among all regions, notable upward trends can be found in northern Northwest China, western Southwest China, eastern Jiangnan, and northern Northeast China, with the ratios of 31.3%, 26.4%, 34.5%, and 19.7% stations showing significant increasing trends, respectively. A consistent downward trend, although insignificant in statistics, can be observed in a belt-like area stretching from southern Northeast China to eastern Southwest China. It can be inferred that the change in AI in China was more closely linked to the change in reference evapotranspiration (ET0), given the lack of a significant trend in precipitation across most regions of the country.
As illustrated in Figure 3b,d, ET0 in China over the past 50 years exhibited an overall increase, except for regions of the Tibet Plateau, Huang-Huai, and northern Northeast China. The increasing rates varied from −134.11 mm/10a to 288.58 mm/10a, with a mean value of 3.76 mm/10a. Among all regions, the regions of South China and Jiang-Huai showed the most pronounced increasing trends, with 42.9% and 46.8% stations showing significant increasing trends, and the average increasing rates were 14.9 mm/10a and 15.9 mm/10a, respectively. For the Tibet Plateau, Huang-Huai, and northern Northeast China, where ET0 showed a significant downward trend, 21%, 39%, and 17% of stations were experiencing significant decreasing trends, respectively (Table 2). The average decreasing trend over these three regions was −4.58 mm/10a, −10.11 mm/10a, and −2.50 mm/10a, respectively.
Previous studies conducted by Liu et al. [26] and Gao et al. [43] also investigated ET0 trends in specific regions of China. Liu et al. [26] explored the variation trends in ET0 in Northwest China, which is the driest region of China, using 80 stations during 1960–2010. ET0 in Northwest China showed an upward trend with an increasing rate of 48 mm/10a, and the increasing trend began in 1994. Gao et al. [43] estimated the variation trends in ET0 from 1960 to 2012 using 15 stations within the arid and semi-arid areas of the West Liao River basin and found a decreasing trend of 2.8 mm/10a during the study period. These findings are consistent with this study, although the rates of changing trends may differ due to study areas and the number of stations used.

3.2. The Driving Factors of ET0 Change

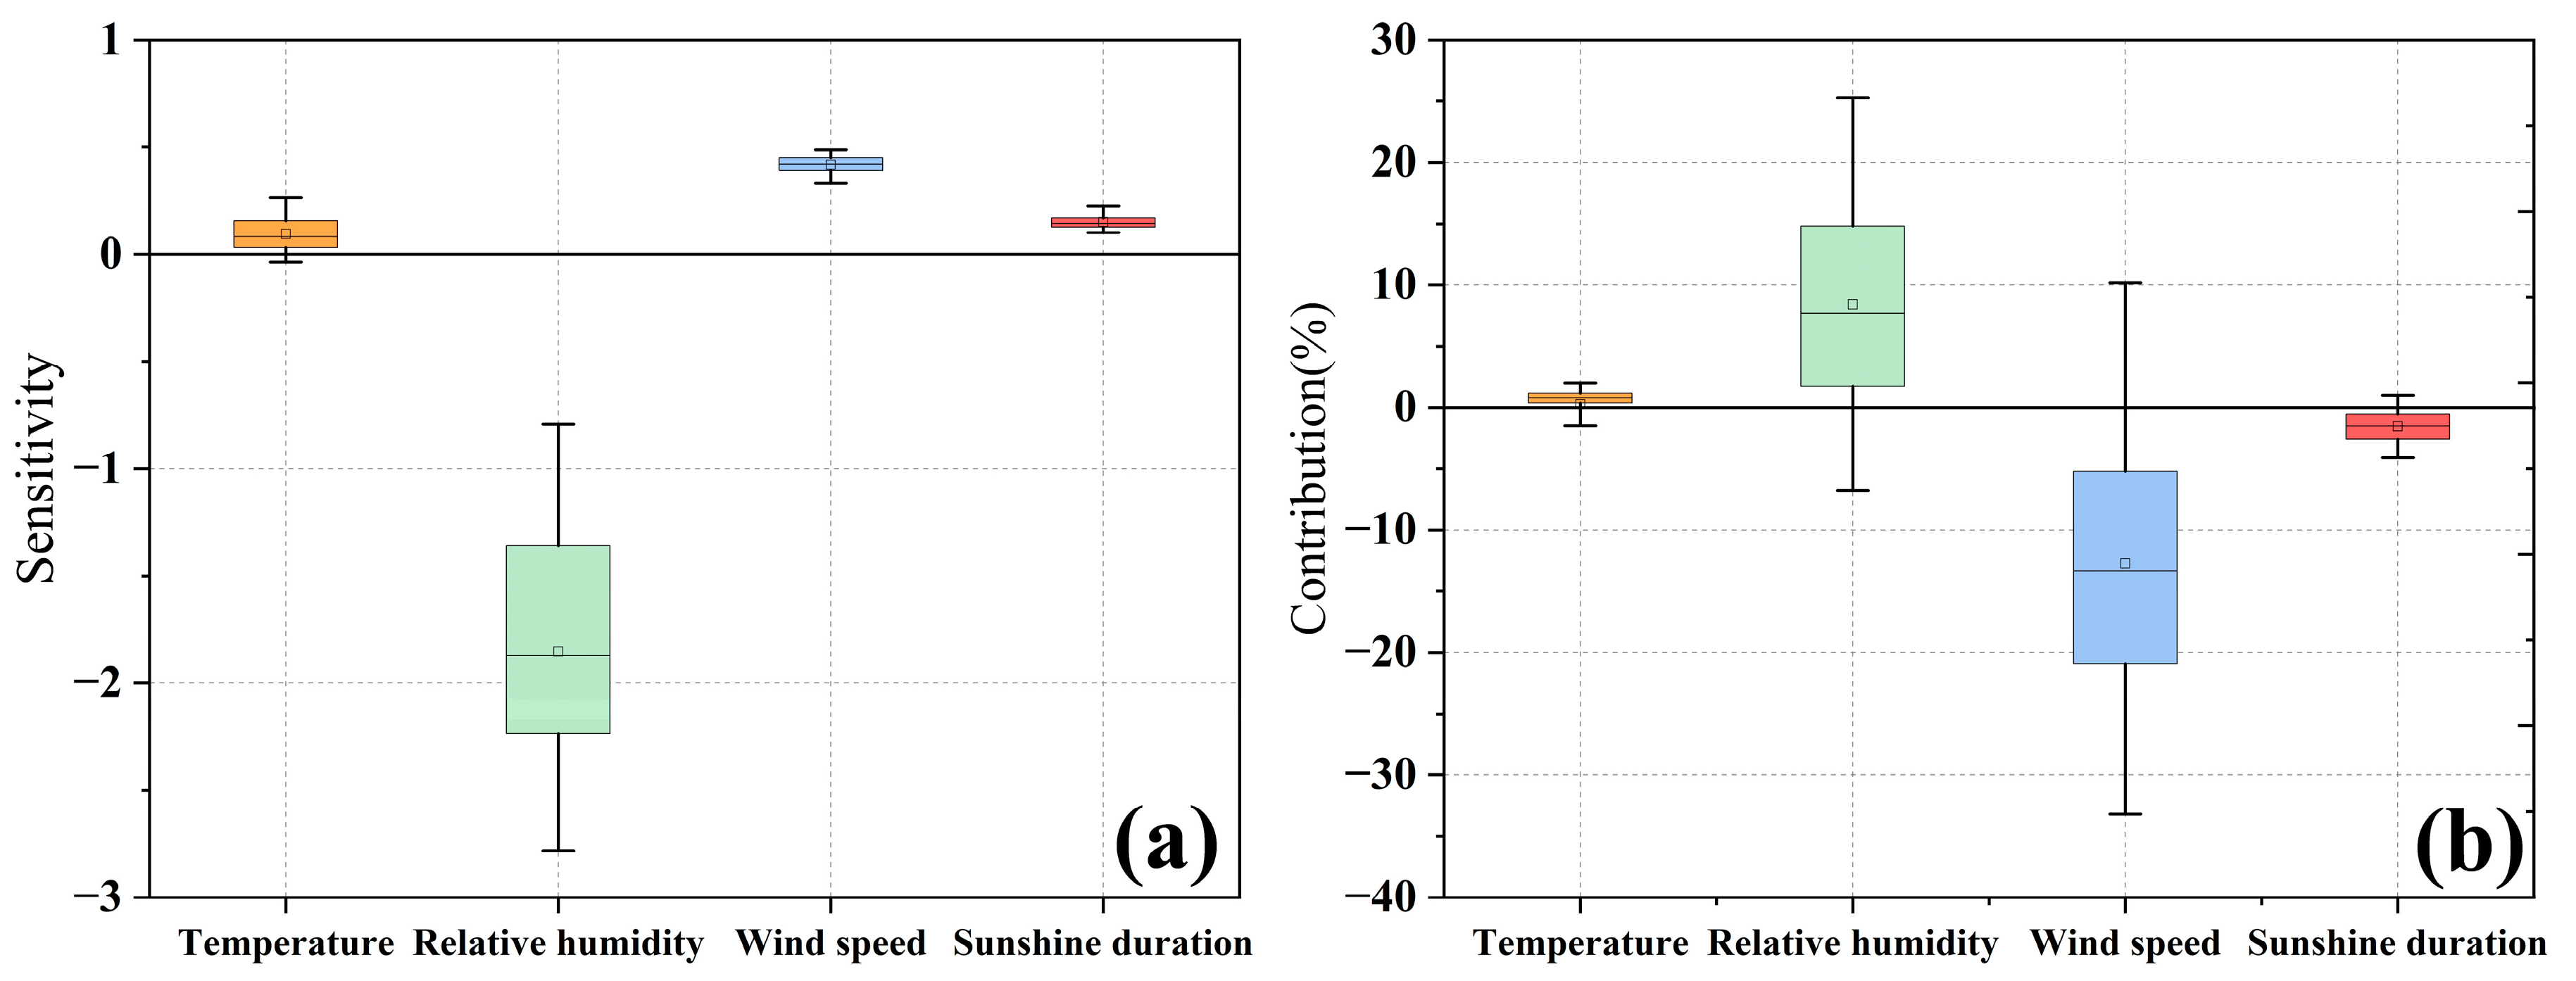
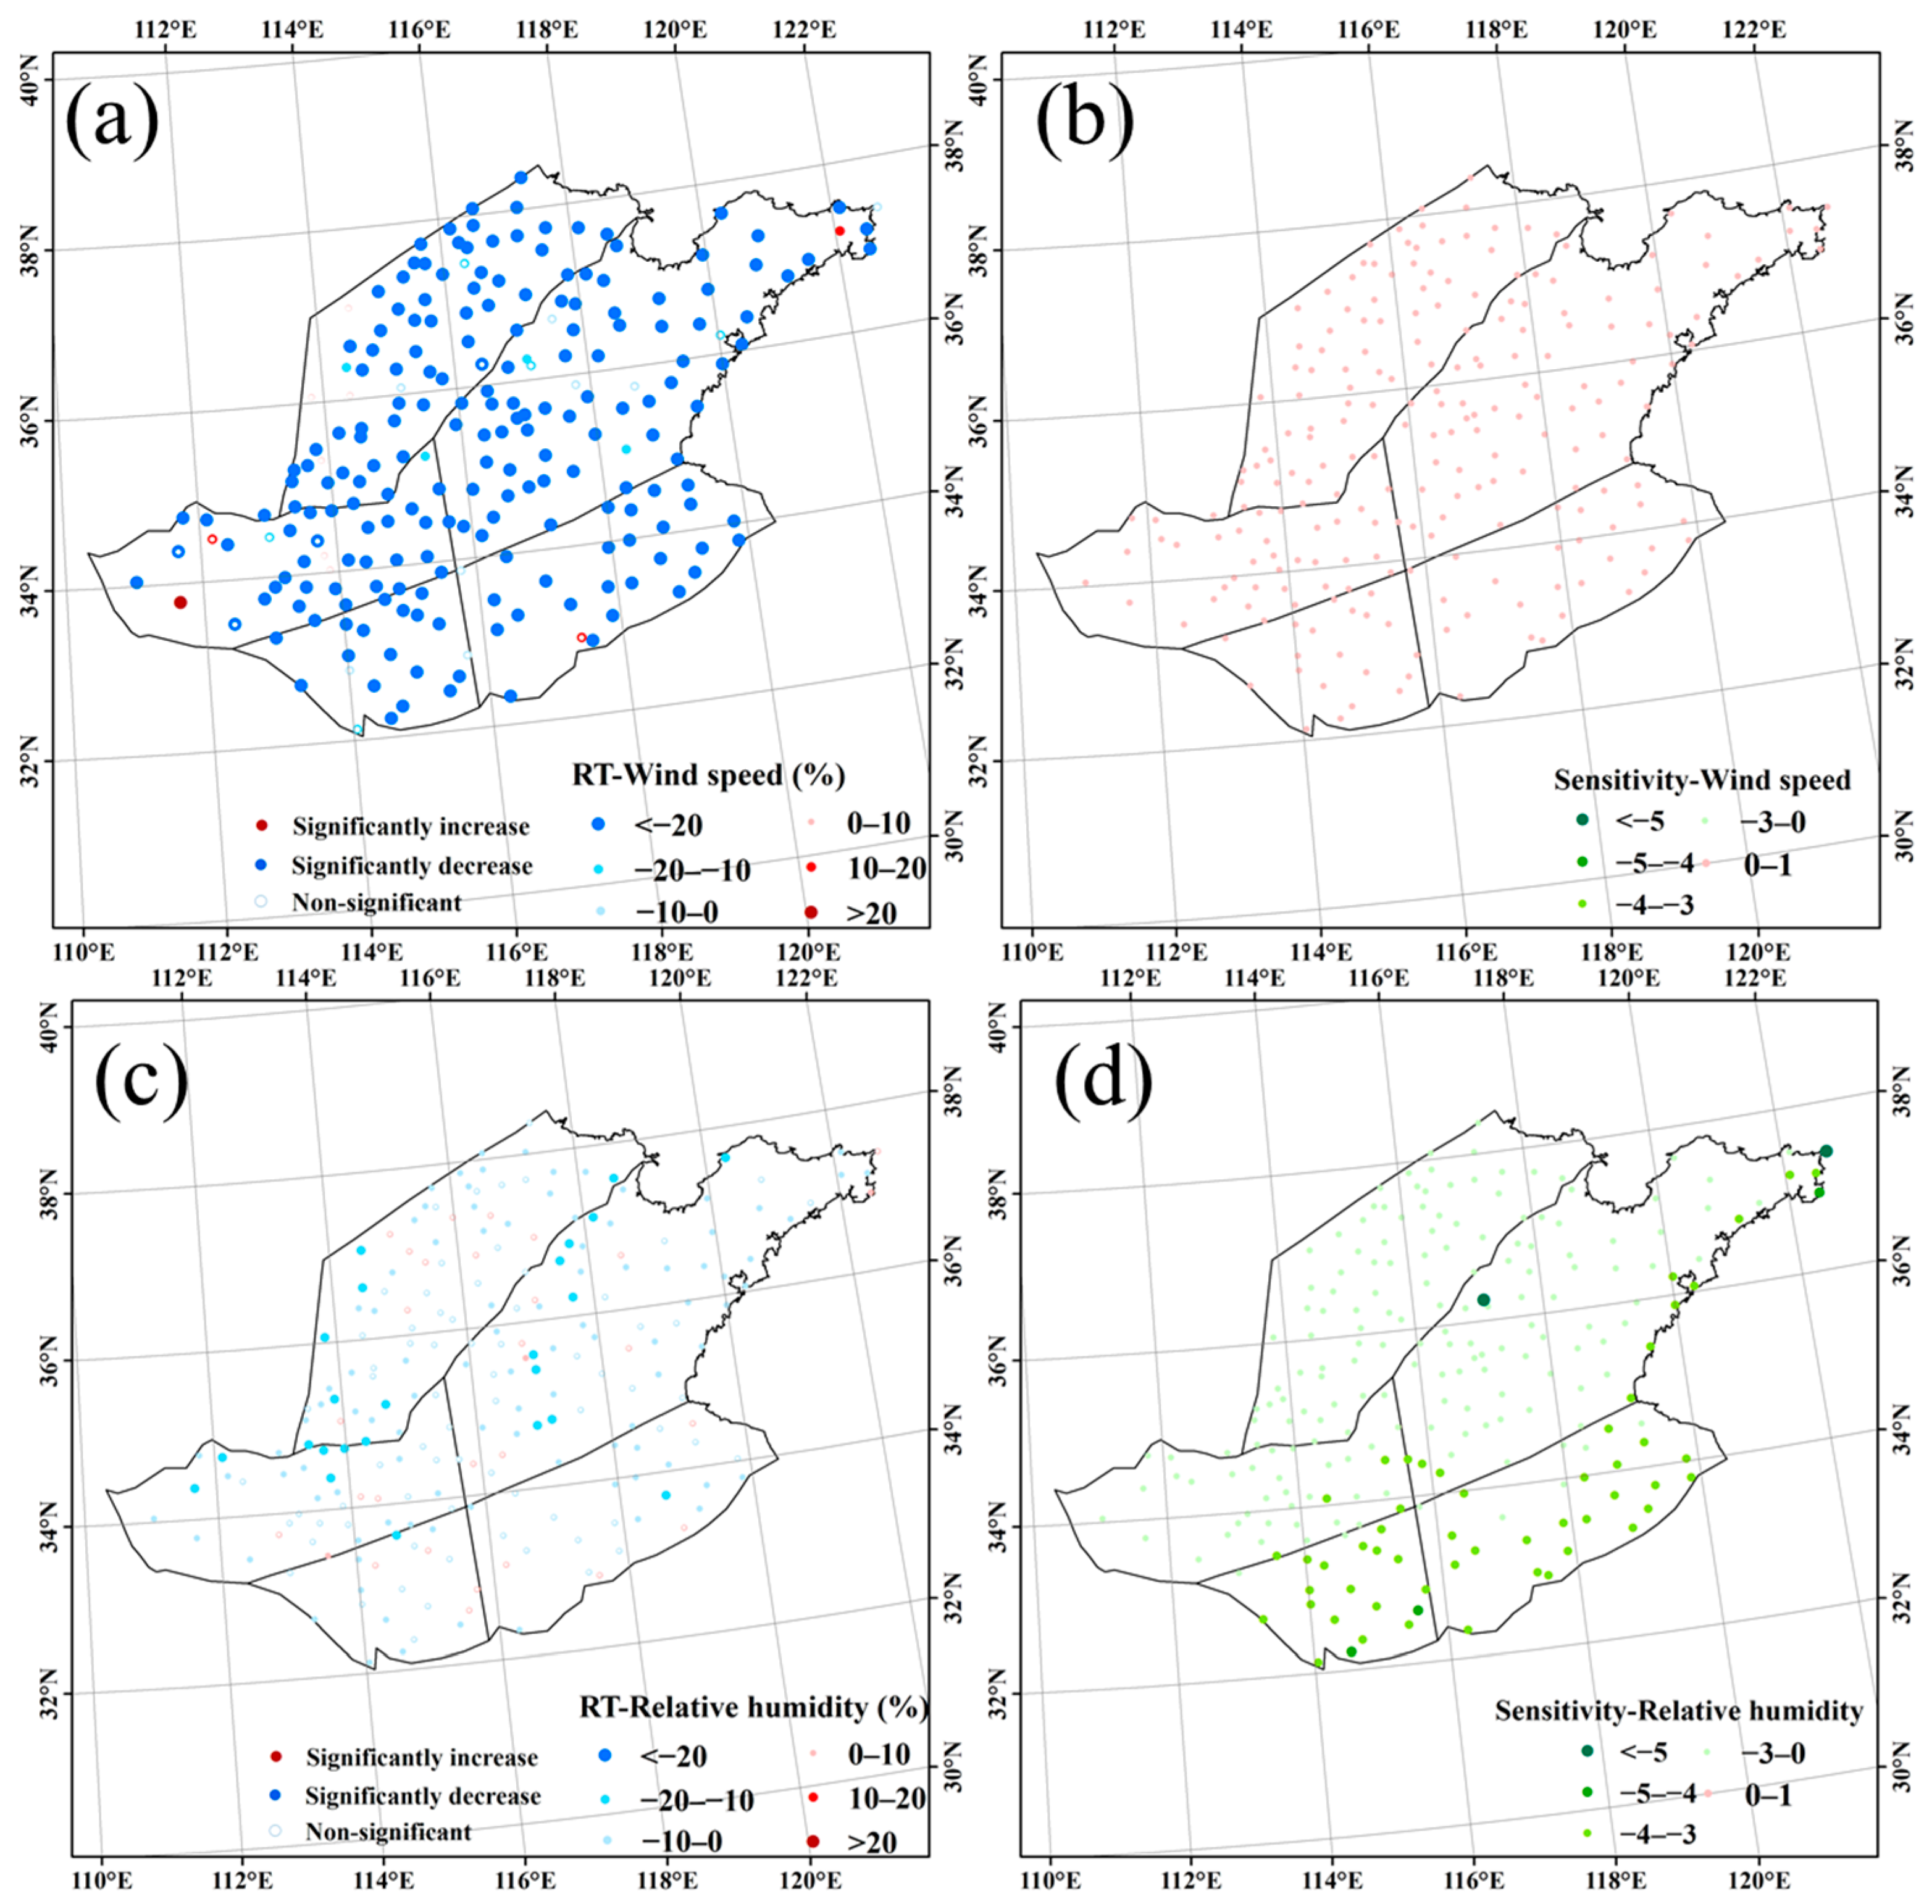
3.2.1. The Sensitivity Coefficients of Four Climate Variables

The distribution of sensitivity coefficients of ET0 to four climate variables, relative humidity, wind speed, air temperature, and sunshine duration, from 1680 stations across China is presented in Figure 4. It can be observed that except for the sensitivity coefficients of relative humidity, which are negative, the sensitivity coefficients of the other three climate variables are mostly positive. This indicated that changes in ET0 in China will increase as the wind speed, air temperature, and sunshine duration increase and decrease as the relative humidity decreases.
According to the magnitude of sensitivity coefficients, it can be inferred that ET0 of China was most sensitive to changes in relative humidity, which ranged from −32.9 to −0.4. By comparing the absolute values of the sensitivity coefficients, the order of sensitivity coefficients was: relative humidity (−2.7) > wind speed (0.4) > sunshine duration (0.15) > air temperature (0.1) (Figure 4).
These findings are consistent with previous studies conducted in regions within China. Gao et al. [43] reported that ET0 in the West Liao River Basin of China is negatively correlated with relative humidity and positively correlated with other climate factors (p < 0.05), and Ning et al. [23] reported that ET0 in the northern Loess Plateau of China is most sensitive to actual vapor pressure.

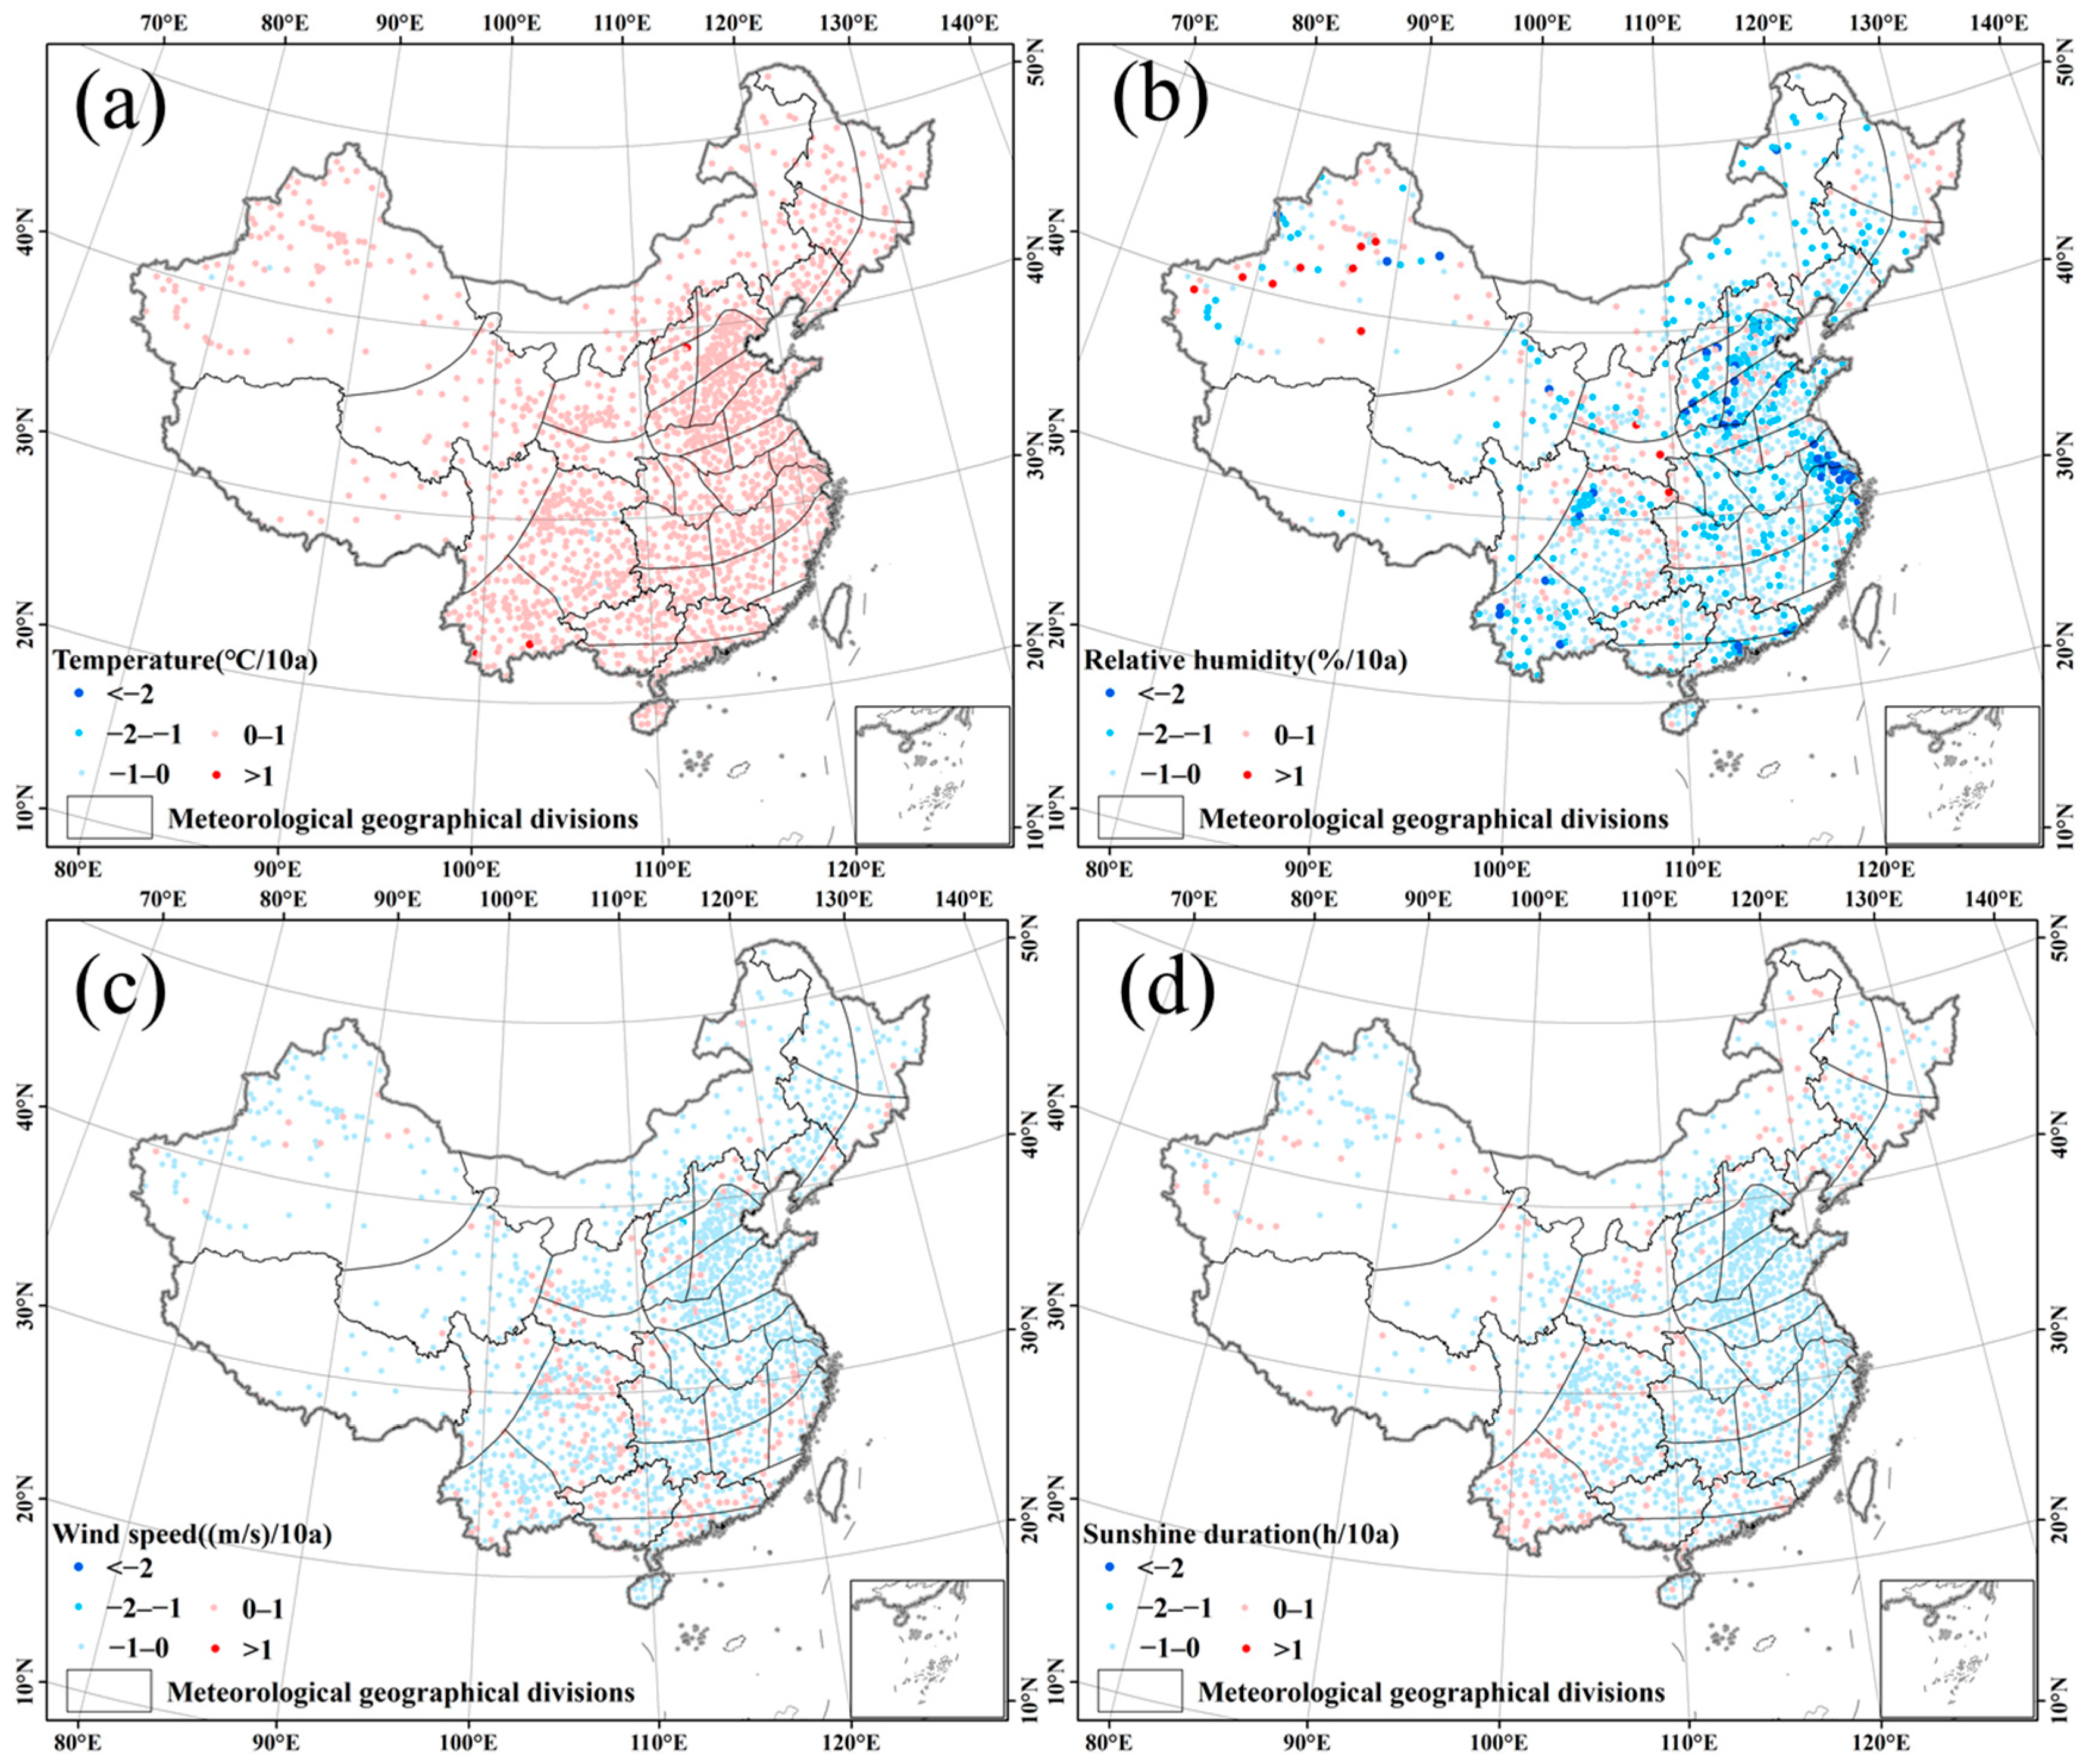
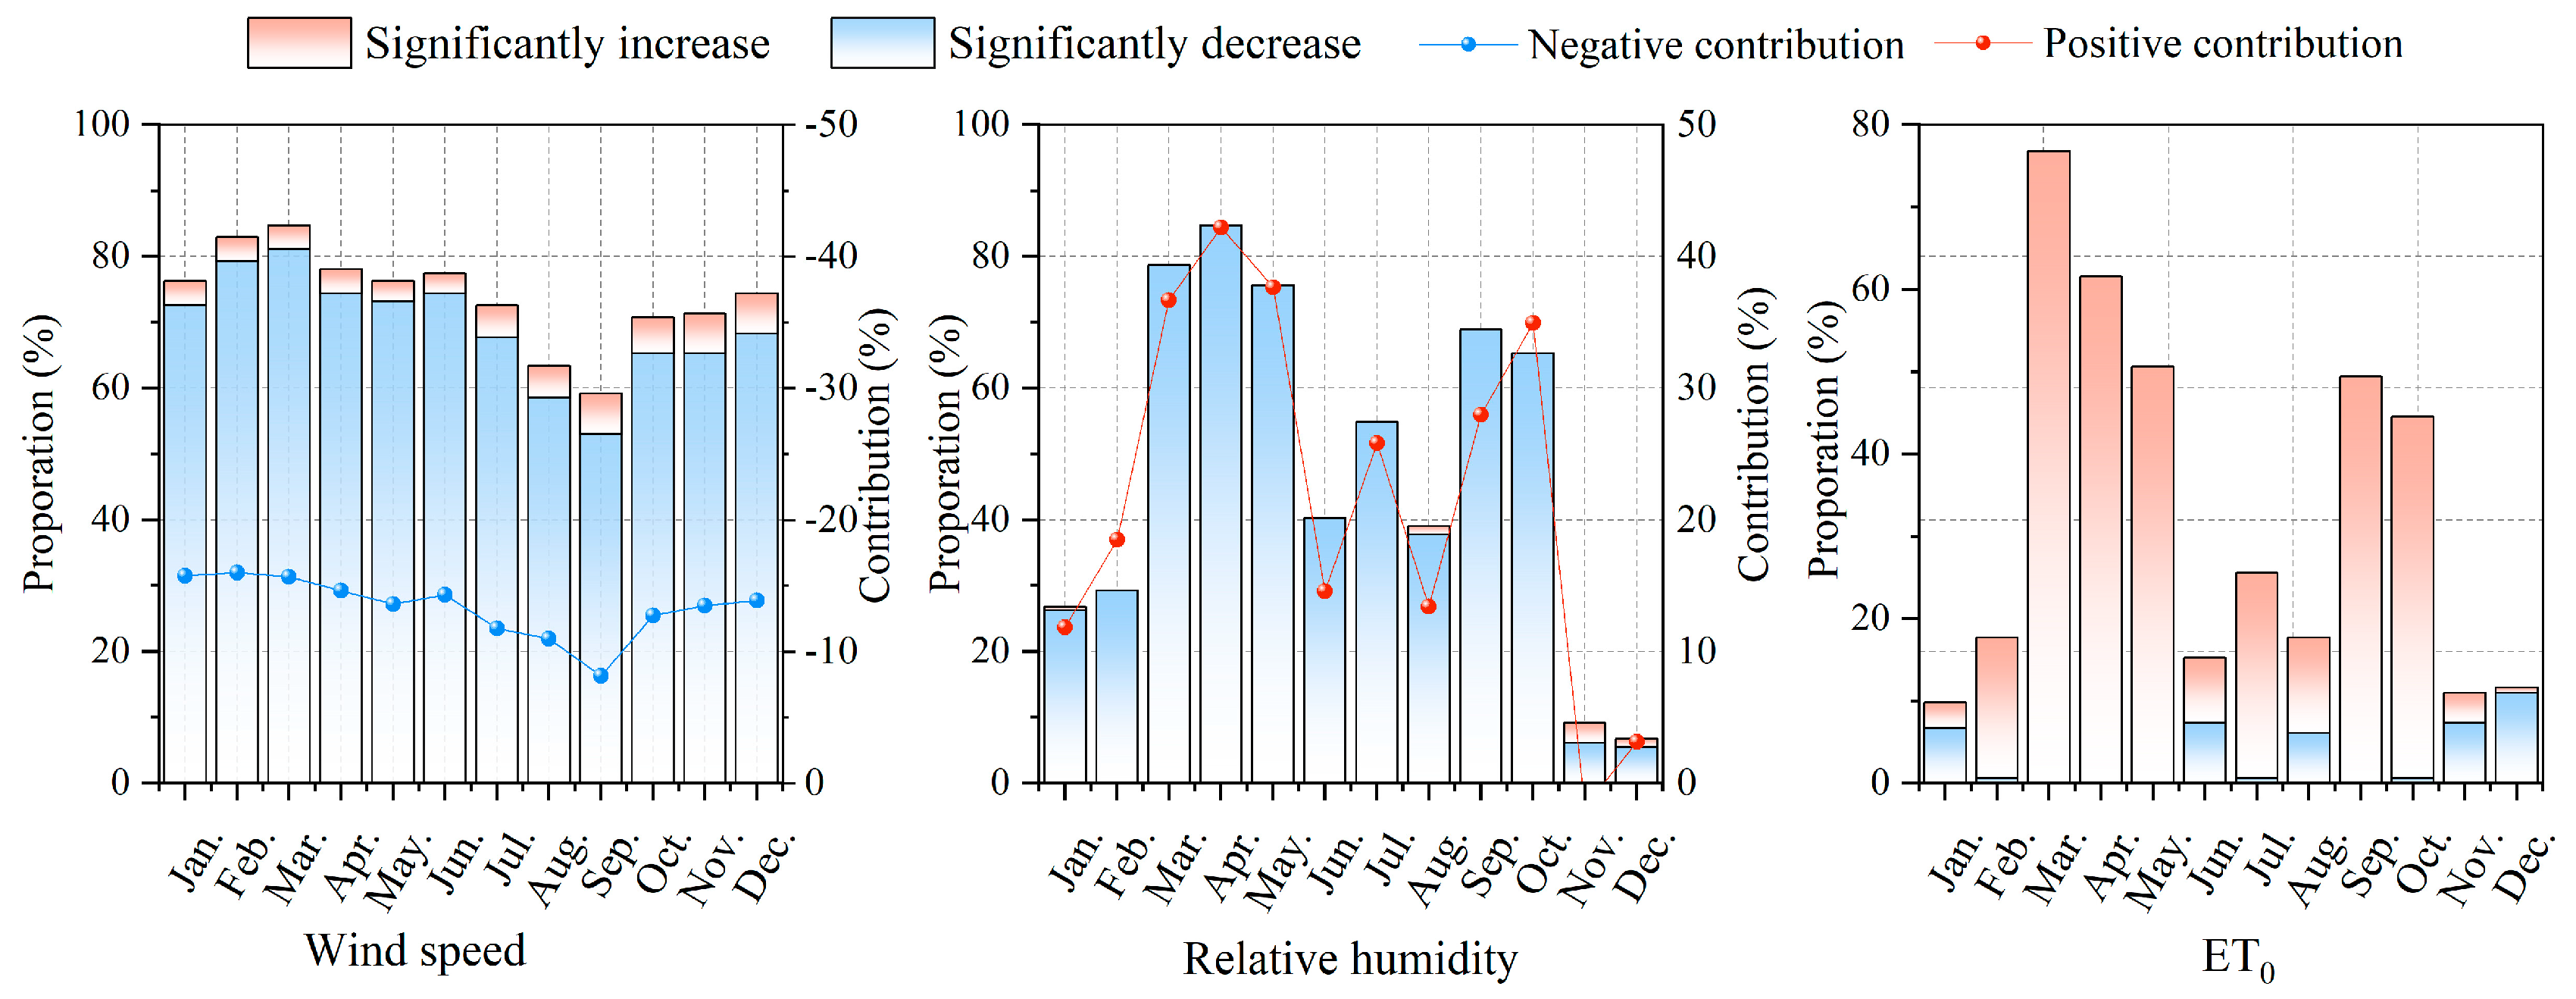
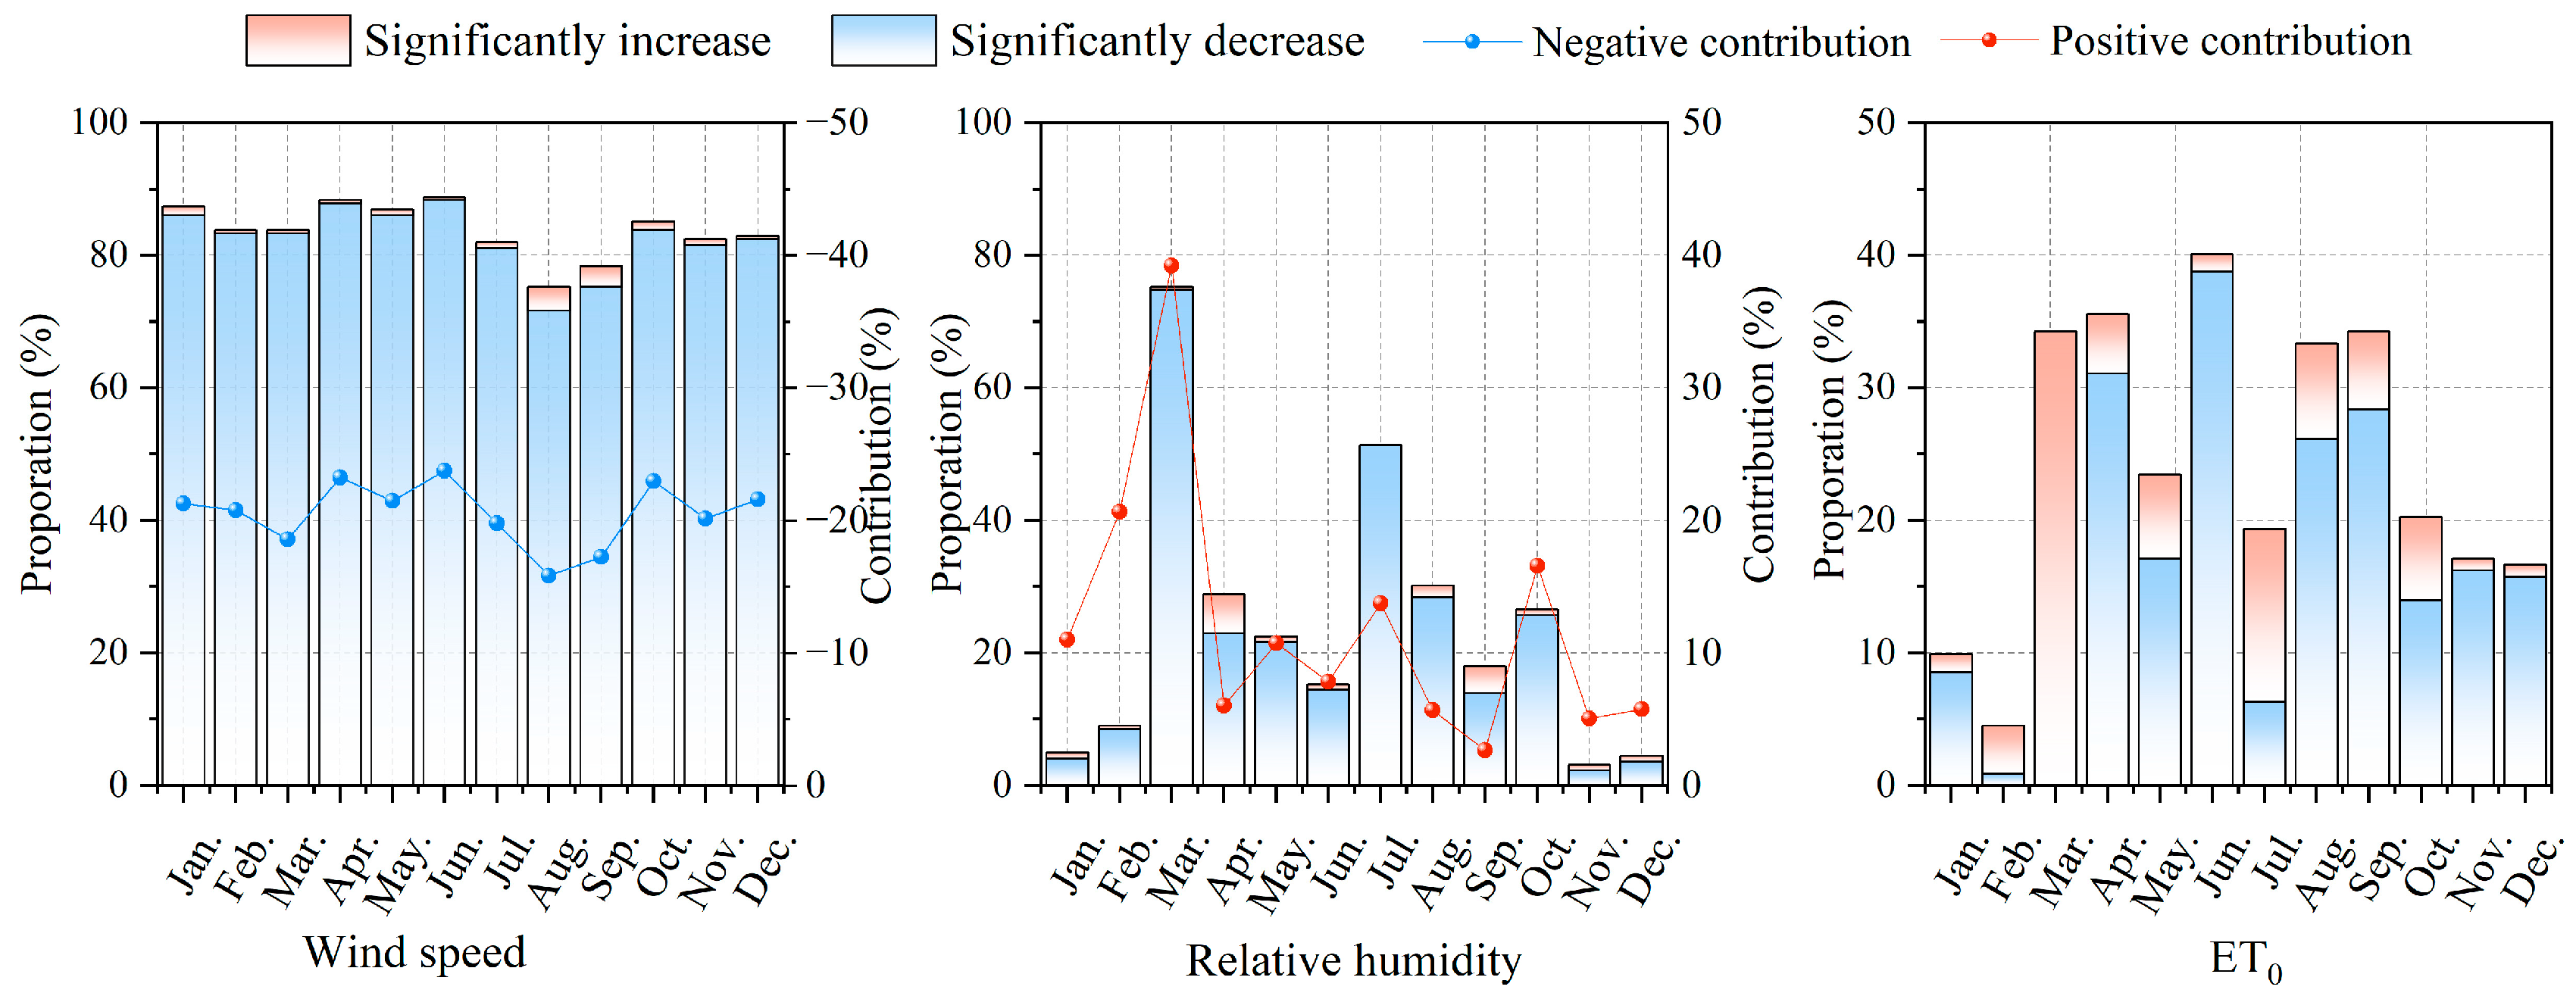
3.2.2. The Long-Term Changes in Four Climate Variables

Over the past 49 years, all of these four factors that may influence the changes in ET0 have undergone significant changes (Figure 5). The temperature increased significantly across mainland China, with an average increasing rate of 0.3 °C/10a and a range of −0.2 to 2.2 °C/10a. Significantly increasing trends can be detected in more than 90% of stations. In regions of Huang-Huai, Jiang-Huai, Jiangnan, and the Tibet Plateau, the ratio of stations showing significant increasing trends was up to 100% (as indicated in Table 3).
Contrary to the trends found in temperature, the other three variables, including relative humidity, wind speed, and sunshine duration, mainly showed decreasing trends during the past decades. Relative humidity has decreased significantly, with an average decreasing trend of −0.6%/10a and a range of −3.8 to 2.3%/10a. Most stations showed significant decreasing trends in relative humidity. The region with the least number of stations showing decreasing trends was the Tibet Plateau, which is 21.4%. Jiang-Huai has the highest proportion of stations with significant decreasing trends, which was as high as 77.4%. Wind speed decreased at an average rate of −0.6 (m/s)/10a, with a range of −1.3 to 0.9 (m/s)/10a. More than 50% of stations in all geographical divisions reported significant decreasing trends. Similarly, sunshine duration had decreased, with an average decrease of 0.12 h/10a and a range of −0.86 to 0.35 h/10a. Over 40% of the stations in all geographical divisions reported significant decreasing trends in sunshine duration.

3.2.3. Contributions of Climate Variables to Changes in ET0

The contribution ratio can effectively highlight the impact of climate variables on ET0 changes. A positive contribution ratio suggests that the climate variable is augmenting ET0, whereas a negative contribution ratio implies that it is reducing ET0 [26,44]. The spatial distribution of the contribution ratios of temperature, relative humidity, wind speed, and sunshine duration to the variation in ET0 from 1971 to 2019 is depicted in Figure 6. The findings indicated a varying impact of temperature on ET0 across different meteorological regions. In areas such as Northwest China, Tibet, Inner Mongolia, and Northeast China, temperature exhibited a negative correlation with the variation in ET0, with average contribution ratios of −0.76%, −1.89%, −4.39%, and −2.0%, respectively. Conversely, in other regions, temperature displayed a positive correlation with ET0, with an average contribution ratio of 0.98%.
Relative humidity had a positive impact on the changing trends in ET0 at most stations. The average contribution ratio across all stations is 11.0%. In contrast, wind speed and sunshine duration had mostly negative impacts, with average contribution ratios of −12.6% and −1.6%, respectively. The contribution ratios of these four climate variables, in decreasing order of magnitude, were wind speed, relative humidity, temperature, and sunshine duration. Wind speed and relative humidity were the dominant factors driving the changes in ET0. ET0 tended to decrease significantly when both wind speed and relative humidity had negative contribution ratios and increase significantly when both were positive. If the contribution ratios of wind speed and relative humidity were opposite, the trend of ET0 was dominated by the climate variable with the higher absolute contribution ratio. When their contribution ratios were close, the variation trend of ET0 was not significant (Figure 6).

4. Discussion

The trend and magnitude of ET0 variation varied greatly across different meteorological regions, which can be attributed to the contributions of wind speed and relative humidity to ET0 changes. The contribution of climate variables to ET0 is a product of their sensitivity coefficients and the relative rate of change over time, reflecting the joint impact of sensitivity coefficients and ET0’s variation [41,42].
For the subregions JHU1, JHU2, JN2, and JN3 of the meteorological geographical division, ET0 increased significantly during the 1971–2019 period, with an increased rate ranging from −41.1 to 82.5 mm/10a and an average increase of 17.4 mm/10a. Among the 163 stations in the region, 47.7% showed a significant upward trend in ET0, while only 0.9% showed a significant downward trend. As depicted in Figure 7, ET0 was positively influenced by wind speed, with an average sensitivity coefficient of 0.40, and negatively impacted by relative humidity, with an average sensitivity coefficient of −4.09. The magnitude of the sensitivity coefficient for relative humidity was much larger than that for wind speed. In the region, wind speed decreased significantly, with 80.5% of stations showing a significant decreasing trend while only 2.2% showed a significant increase. The relative change rate of wind speed was −35.4%/10a, and its sensitivity coefficient was 0.4 thus, the contribution ratio of wind speed to the change in ET0 was negative, with an average contribution ratio of −14.2%. Similarly, relative humidity decreased significantly, with 74.9% of stations showing a significant decreasing trend while only 0.5% showed a significant increase. The relative change rate of relative humidity was −9.7%, and its sensitivity coefficient was −3.3. The contribution ratio of relative humidity to the changes in ET0 was positive, with an average contribution ratio of 32.0%, which was 1.6 times greater than that of wind speed. Thus, relative humidity dominated the significant increase in ET0 in this region. Zhang et al. [39] analyzed the change in ET0 in China during the periods 1960–1992 and 1993–2011 using 653 stations and found that ET0 was most sensitive to changes in vapor pressure.
Vapor pressure influenced the relative humidity and was related to the change in ET0. For the subregions, the significant upward trend of ET0, saturation vapor pressure (es) showed a significant increasing trend at all stations, with an average increase of 2.2 kPa/10a and a range of 1.2 to 3.8 kPa/10a. 53.7% of stations showed a significant upward trend in actual vapor pressure (ea), while only 1.0% showed a significant downward trend, with an average increase of 2.6 kPa/10a. The difference value between es and ea ranged from −0.3 to 17.0 kPa/10a, with an average of 7.2 kPa/10a (Figure 8), and its significant increase trend increased the relative humidity in these subregions.
The fluctuation of ET0 varied among months, with a higher number of stations showing a significant downward trend in January, November, and December compared to the number of stations exhibiting a significant upward trend. On the other hand, in other months, the number of stations displaying a significant upward trend was significantly higher than those with a downward trend (Figure 9). The variation in relative humidity in different months best explained the fluctuation of ET0. From November to January, relative humidity was stable with minimal variation, and stations with significant variation in relative humidity accounted for less than 25% of the change in ET0 with a contribution rate of less than 15%. Conversely, in other months, the stations with significant relative humidity variations accounted for more than 30%. Wind speed showed a significant decrease every month, with over 60% of the stations exhibiting a significant variation trend. Hence, the decrease in wind speed from November to January was the main factor behind the higher number of stations with significant downward ET0 trends compared to those with an upward trend. However, from February to October, the number of stations with significant upward ET0 trends was higher due to the increase in relative humidity.
In the meteorological geographic subregions of NC6, HH1, HH2, HH3, and HH4, ET0 experienced a significant decrease over the last 50 years, with the rate of increase ranging from −69.0 to 61.3 mm/10a and an average value of −11.6 mm/10a (Figure 10). Among the 223 stations in the region, only 11.9% showed a significant upward trend in ET0, while 42.3% had a significant downward trend. ET0 was positively sensitive to wind speed, with an average sensitivity coefficient of 0.44, and negatively sensitive to relative humidity, with an average sensitivity coefficient of −2.73. The sensitivity coefficient of relative humidity was significantly higher in magnitude compared to that of wind speed. Wind speed showed a significant decrease in the region, with 87.2% of the stations exhibiting a significant decreasing trend and only 0.8% showing a significant increase. The relative change rate of wind over 49 years was −47.3%, and its average contribution ratio to the change in ET0 was −20.8%. Relative humidity also showed a significant decrease, with 51.7% of the stations exhibiting a decreasing trend and only 1.1% showing an increase. The relative change rate of relative humidity was −4.9%. The average contribution ratio of relative humidity to the change in ET0 was 32.0%, which was 58.5% of the contribution ratio of wind speed. Thus, wind speed was the dominant factor contributing to the significant decrease in ET0 in the region. Previous studies, such as Zheng et al. [44] in the Haihe River Basin and Liuzzo et al. [45] in southern Italy, have also found that wind speed is a major factor affecting pan-evaporation and reference evapotranspiration trends.
Stations that experienced significant variations in wind speed represented more than 70% each month, and their influence on ET0 changes ranged from −15% to −25%. The stations with significant relative humidity variations accounted for between 5% and 75%, with over 45% of them experiencing a significant decrease in March and July. Wind speed was the dominant factor affecting ET0, causing more stations to have a significant downward trend in most months, although the relative humidity had a higher impact on ET0 in February, March, and July, leading to a significant increase in ET0 for the majority of stations (as seen in Figure 11).

5. Conclusions

Dry and wet conditions are crucial indicators of regional climate, reflecting the complex interplay between hydrological cycles and land evapotranspiration in the context of a changing global climate. This study aimed to comprehensively examine the temporal and spatial variations in the aridity index (AI), precipitation (P), and reference evapotranspiration (ET0) across the mainland China. Long-term daily meteorological data from 1680 stations spanning mainland China were analyzed, covering the period from 1971 to 2019. The key findings can be summarized as follows:
(1) The Northwest, Northeast, and Huang-Huai regions of China exhibited a discernible wetting tendency, with significant increasing trends observed in their respective AI values. Conversely, the Southwest and Southeast regions experienced a drying trend, as evidenced by significant decreases in their AI values.
(2) The changes in AI at the regional level were primarily influenced by variations in ET0. While no significant trends in P were detected across most regions of China during the past few decades, substantial changes were observed in ET0. Overall, mainland China experienced a general increasing trend in ET0, with an average rate of 3.76 mm/10a. However, certain stations located in the Tibet Plateau, Huang-Huai, and northern Northeast China displayed decreasing trends.
(3) The analysis of four climate variables impacting ET0 revealed that relative humidity had the greatest sensitivity, and variations in relative humidity and wind speed accounted for the majority of changes in ET0. Specifically, regions such as Huang-Huai and northern Northeast China demonstrated a significant downward trend in ET0 primarily driven by wind speed, while relative humidity played a dominant role in the significant upward trends observed across other regions in China.

Author Contributions

Conceptualization, Y.X. (Yun Xie) and W.W.; methodology, J.T., Y.X. (Yun Xie) and W.W.; software, J.T. and W.W.; validation, J.T., Y.X. (Yan Xin) and Y.X. (Yun Xie); resources, Y.X. (Yun Xie) and W.W.; data curation, W.W.; writing—original draft preparation, J.T.; writing—review and editing, J.T., Y.X. (Yun Xie), Y.X. (Yan Xin) and W.W.; visualization, J.T.; supervision, Y.X. (Yun Xie); funding acquisition, Y.X. (Yun Xie) and W.W. All authors have read and agreed to the published version of the manuscript.

Funding

This research was funded by [Guangdong Major Project of Basic and Applied Basic Research] grant number [2021B0301030007] and [Project for Recruited post-doctoral to Start Up Their Work and Research in Beijing Normal University at Zhuhai] grant number [110321001].

Data Availability Statement

Data used in this study are confidential data.

Acknowledgments

This work was supported by the Guangdong Major Project of Basic and Applied Basic Research (No. 2021B0301030007) and the Project for Recruited Post-Doctoral Fellows to start up their work and research at the Beijing Normal University at Zhuhai (110321001).

Conflicts of Interest

The authors declare that they have no conflict of interest.

References

  1. IPCC. Climate Change 2021: The Physical Science Basis; Cambridge University Press: Cambridge, UK, 2021. [Google Scholar]
  2. Shen, S.H.; Zhang, F.M.; Sheng, Q. Spatio-temporal changes of wetness index in China from 1975 to 2004. Trans. CSAE 2009, 25, 11–15, (In Chinese with English Abstract). [Google Scholar] [CrossRef]
  3. Hernandez, E.A.; Uddameri, V. Standardized precipitation evaporation index (SPEI)-based drought assessment in semi-arid south Texas. Environ. Earth Sci. 2013, 71, 2491–2501. [Google Scholar] [CrossRef]
  4. Rayne, S.; Forest, K. Evidence for increasingly variable Palmer Drought Severity Index in the United States since 1895. Sci. Total. Environ. 2016, 544, 792–796. [Google Scholar] [CrossRef] [PubMed]
  5. Yuan, Q.; Wu, S.; Dai, E.; Zhao, N.; Zhang, X.; Ren, P. Spatio-temporal variation of the wet-dry conditions from 1961 to 2015 in China. Sci. China Earth Sci. 2017, 60, 2041–2050. [Google Scholar] [CrossRef]
  6. Hossain, M.A.; Rahman, M.; Hasan, S.S. Application of combined drought index to assess meteorological drought in the south western region of Bangladesh. Phys. Chem. Earth, Parts A/B/C 2020, 120, 102946. [Google Scholar] [CrossRef]
  7. Hulme, M. Recent Climatic Change in the World’s Drylands. Geophys. Res. Lett. 1996, 23, 61–64. [Google Scholar] [CrossRef]
  8. Penman, H.L. Natural evaporation from open water, bare soil and grass. Proc. R. Soc. Lond. Ser. A Math. Phys. Sci. 1948, 193, 120–145. [Google Scholar]
  9. Harbeck, G.E., Jr. A Practical Field Technique for Measuring Reservoir Evaporation Utilizing Mass-Transfer Theory; Paper 272-E; US Geological Survey: Reston, VA, USA, 1962; pp. 101–105. [CrossRef] [Green Version]
  10. Priestley, C.H.B.; Taylor, R.J. On the assessment of the surface heat flux and evaporation using large-scale parameters. Mon. Weather Rev. 1972, 100, 81–92. [Google Scholar] [CrossRef]
  11. Guitjens, J.C. Models of Alfalfa Yield and Evapotranspiration. J. Irrig. Drain. Div. 1982, 108, 212–222. [Google Scholar] [CrossRef]
  12. Gong, L.; Xu, C.-y.; Chen, D.; Halldin, S.; Chen, Y.D. Sensitivity of the Penman–Monteith reference evapotranspiration to key climatic variables in the Changjiang (Yangtze River) basin. J. Hydrol. 2006, 329, 620–629. [Google Scholar] [CrossRef]
  13. Alkaeed, O.; Flores, C.; Jinno, K.; Tsutsumi, A. Comparison of Several Reference Evapotranspiration Methods for Itoshima Peninsula Area, Fukuoka, Japan; Memoirs of the Faculty of Engineering, Kyushu University: Fukuoka, Japan, 2006; Volume 66, pp. 1–14. [Google Scholar]
  14. Pereira, L.S.; Perrier, A.; Allen, R.G.; Alves, I. Evapotranspiration: Concepts and future trends. J. Irrig. Drain. Eng. 1999, 125, 45–51. [Google Scholar] [CrossRef]
  15. Garcia, M.; Raes, D.; Allen, R.; Herbas, C. Dynamics of reference evapotranspiration in the Bolivian highlands (Altiplano). Agric. For. Meteorol. 2004, 125, 67–82. [Google Scholar] [CrossRef]
  16. Temesgen, B.; Eching, S.; Davidoff, B.; Frame, K. Comparison of Some Reference Evapotranspiration Equations for California. J. Irrig. Drain. Eng. 2005, 131, 73–84. [Google Scholar] [CrossRef]
  17. Zhao, C.; Nan, Z.; Cheng, G. Evaluating methods of estimation and modelling spatial distribution of evapotranspiration in the middle Heihe River Basin, China. Am. J. Environ. Sci. 2005, 1, 278–285. [Google Scholar] [CrossRef]
  18. Berghuijs, W.R.; Larsen, J.R.; Van Emmerik, T.H.M.; Woods, R.A. A global assessment of runoff sensitivity to changes in precipitation, potential evaporation, and other factors. Water Resour. Res. 2017, 53, 8475–8486. [Google Scholar] [CrossRef] [Green Version]
  19. Liu, J.; Fu, Z.; Liu, W. Impacts of precipitation variations on agricultural water scarcity under historical and future climate change. J. Hydrol. 2023, 617, 128999. [Google Scholar] [CrossRef]
  20. Wang, W.; Yin, S.; Gao, G.; Papalexiou, S.; Wang, Z. Increasing trends in rainfall erosivity in the Yellow River basin from 1971 to 2020. J. Hydrol. 2022, 610, 127851. [Google Scholar] [CrossRef]
  21. Droogers, P.; Allen, R.G. Estimating reference evapotranspiration under inaccurate data conditions. Irrig. Drain. Syst. 2002, 16, 33–45. [Google Scholar] [CrossRef]
  22. Zhang, Q.; Zhu, B.; Yang, J.; Ma, P.; Liu, X.; Lu, G.; Wang, Y.; Yu, H.; Liu, W.; Wang, D. New characteristics about the climate humidification trendin Northwest China. Chin. Sci. Bull. 2021, 66, 3757–3771. [Google Scholar] [CrossRef]
  23. Ning, T.; Li, Z.; Liu, W.; Han, X. Evolution of potential evapotranspiration in the northern Loess Plateau of China: Recent trends and climatic drivers. Int. J. Clim. 2016, 36, 4019–4028. [Google Scholar] [CrossRef]
  24. Dong, Q.; Wang, W.; Shao, Q.; Xing, W.; Ding, Y.; Fu, J. The response of reference evapotranspiration to climate change in Xinjiang, China: Historical changes, driving forces, and future projections. Int. J. Clim. 2019, 40, 235–254. [Google Scholar] [CrossRef]
  25. Lin, P.; He, Z.; Du, J.; Chen, L.; Zhu, X.; Li, J. Impacts of climate change on reference evapotranspiration in the Qilian Mountains of China: Historical trends and projected changes. Int. J. Clim. 2018, 38, 2980–2993. [Google Scholar] [CrossRef]
  26. Liu, X.; Zhang, D. Trend analysis of reference evapotranspiration in Northwest China: The roles of changing wind speed and surface air temperature. Hydrol. Process. 2013, 27, 3941–3948. [Google Scholar] [CrossRef]
  27. Gao, Q.; Liu, Z.; Xiang, J.; Tong, M.; Zhang, Y.; Wang, S.; Zhang, Y.; Lu, L.; Jiang, B.; Bi, P. Forecast and early warning of hand, foot, and mouth disease based on meteorological factors: Evidence from a multicity study of 11 meteorological geographical divisions in mainland China. Environ. Res. 2021, 192, 110301. [Google Scholar] [CrossRef]
  28. China Meteorological Administration. Guideline of China Meteorological and Geographic Division; China Meteorological Press: Beijing, China, 2006. (In Chinese) [Google Scholar]
  29. Li, J.; Yu, R.; Yuan, W.; Chen, H. Changes in duration-related characteristics of late-summer precipitation over eastern China in the past 40 Years. J. Clim. 2011, 24, 5683–5690. [Google Scholar] [CrossRef]
  30. China Meteorological Administration (CMA). Specifications for Surface Meteorological Observation; Meteorology Publishing House: Beijing, China, 2003. [Google Scholar]
  31. United Nations Environment Programme (UNEP). World Atlas of Desertification; Edward Arnold: Sevenoaks, UK, 1992; 69p. [Google Scholar]
  32. Allen, R.G.; Pereira, L.S.; Raes, D.; Smith, M. Crop Evapotranspiration—Guidelines for Computing Crop Water Require-Ments—FAO Irrigation and Drainage Paper 56; FAO: Rome, Italy, 1998. [Google Scholar]
  33. Mann, H.B. Nonparametric tests against trend. Econometrica 1945, 13, 245–259. [Google Scholar] [CrossRef]
  34. Kendall, M.G. Rank correlation methods. J. Inst. Actuar. 1949, 75, 140–141. [Google Scholar] [CrossRef]
  35. Sen, P.K. Estimates of the regression coefficient based on Kendall’s tau. J. Am. Stat. Assoc. 1968, 63, 1379–1389. [Google Scholar] [CrossRef]
  36. Theil, H. A rank-invariant method of linear and polynomial regression analysis. In Henri Theil’s Contributions to Economics and Econometrics; Raj, B., Koerts, J., Eds.; Springer: Dordrecht, The Netherlands, 1992; Volume 23, pp. 345–381. [Google Scholar] [CrossRef]
  37. Renard, B.; Lang, M.; Bois, P.; Dupeyrat, A.; Mestre, O.; Niel, H.; Sauquet, E.; Prudhomme, C.; Parey, S.; Paquet, E.; et al. Regional methods for trend detection: Assessing field significance and regional consistency. Water Resour. Res. 2008, 44. [Google Scholar] [CrossRef] [Green Version]
  38. Douglas, E.M.; Vogel, R.M.; Kroll, C.N. Trends in floods and low flows in the United States: Impact of spatial correlation. J. Hydrol. 2000, 240, 90–105. [Google Scholar] [CrossRef]
  39. Zhang, D.; Liu, X.; Hong, H. Assessing the effect of climate change on reference evapotranspiration in China. Stoch. Environ. Res. Risk Assess. 2013, 27, 1871–1881. [Google Scholar] [CrossRef]
  40. McCuen, R.H. A sensitivity and error analysis of procedures used for estimating evaporation. Water Resour. Bull. 1974, 10, 486–498. [Google Scholar] [CrossRef]
  41. Roderick, M.L.; Rotstayn, L.D.; Farquhar, G.D.; Hobbins, M.T. On the attribution of changing pan evaporation. Geophys. Res. Lett. 2007, 34, L17403. [Google Scholar] [CrossRef] [Green Version]
  42. Li, B.; Chen, F.; Guo, H. Regional complexity in trends of potential evapotranspiration and its driving factors in the Upper Mekong River Basin. Quat. Int. 2015, 380–381, 83–94. [Google Scholar] [CrossRef]
  43. Gao, Z.; He, J.; Dong, K.; Li, X. Trends in reference evapotranspiration and their causative factors in the West Liao River basin, China. Agric. For. Meteorol. 2017, 232, 106–117. [Google Scholar] [CrossRef]
  44. Zheng, H.; Liu, X.; Liu, C.; Dai, X.; Zhu, R. Assessing contributions to panevaporation trends in Haihe River Basin, China. J. Geophys. Res. Atmos. 2009, 114, D24105. [Google Scholar] [CrossRef] [Green Version]
  45. Liuzzo, L.; Viola, F.; Noto, L.V. Wind speed and temperature trends impacts on reference evapotranspiration in Southern Italy. Theor. Appl. Climatol. 2016, 123, 43–62. [Google Scholar] [CrossRef]
Figure 1. Meteorological geographic divisions in the study area (a), and the spatial distribution of annual precipitation (b) and reference evapotranspiration (ET0) (c). The regions highlighted in blue in (a) are the example meteorological geographic subregions used to explain the significant variation in ET0.
Water 15 02737 g001
Figure 2. Dry and wet climate regions of China (a) and the relative change rate of AI over many years (b).
Water 15 02737 g002
Figure 3. The 10-year changing rates (a) and relative rates (b) in precipitation; the 10-year changing rates (c) and relative rates (d) in ET0 in China. Significant changes are indicated with solid circles.
Water 15 02737 g003
Figure 4. The distribution of sensitivity coefficients (a) and contributions (b) for four climate variables.
Water 15 02737 g004
Figure 5. Trends in temperature (a), relative humidity (b), wind speed (c), and sunshine duration (d).
Water 15 02737 g005
Figure 6. The spatial distribution of contribution ratios of temperature (a), relative humidity (b), wind speed (c), and sunshine duration (d) for the change in ET0.
Water 15 02737 g006
Figure 7. The distribution of relative change rate and sensitivity coefficient of relative humidity (c,d) and wind speed (a,b) in the region with the significant upward trend of ET0.
Water 15 02737 g007
Figure 8. The distribution of saturation vapor pressure (es) (a), actual vapor pressure (ea) (b), and their difference value (c) in the region with the significant upward trend of ET0.
Water 15 02737 g008
Figure 9. The trend of wind speed, relative humidity, and ET0 and the contribution of wind speed and relative humidity to the change of ET0 in different months for the region with the significant upward trend of ET0.
Water 15 02737 g009
Figure 10. The distribution of relative change rate and sensitivity coefficient of relative humidity (c,d) and wind speed (a,b) in the region with the significant downward trend of ET0.
Water 15 02737 g010
Figure 11. The trend of wind speed, relative humidity, and ET0 and the contribution of wind speed and relative humidity to the change of ET0 in different months for the region with the significant downward trend of ET0.
Water 15 02737 g011
Table 1. Meteorological station numbers and area of each meteorological geographic region.
CodeRegion/Season NameStation NumbersArea
(103 km2)
NECNortheast China130785
NCNorth China232432
HHHuang-Huai156291
JHAJianghan45130
JHUJiang-Huai62138
JNJiangnan260655
SCSouth China170525
IMInner Mongolia751129
NWCNorthwest China2172920
TPTibet Plateau141169
SWCSouthwest China3191112
Table 2. Ratio of stations showing upward or downward trends and the relative changing trends (%) in aridity index (AI), precipitation, and ET0 in different meteorological geographical divisions over China (p = 0.05).
Meteorological Geographical DivisionsMeteorological Geographic Division SubregionsAIPrecipitation (mm)ET0 (mm)
Up (%)Down (%)RT+ (%)Up (%)Down (%)RT+ (%)Up (%)Down (%)RT+ (%)
Northeast ChinaNEC123.8 *0.04.169.50.02.759.533.3 *−1.72
NEC250.0 *0.05.2130.0 *0.02.855.045.0 *−2.46
NEC30.00.0−0.550.00.00.9122.2 *14.80.30
NEC40.06.7−1.300.00.00.6126.7 *0.01.62
NEC50.06.5−1.910.00.0−1.749.73.20.31
NEC60.00.0−0.790.00.0−0.3212.512.50.53
North ChinaNC16.70.00.736.70.02.036.720.0 *0.58
NC24.321.7 *−2.360.08.7−1.6139.1 *13.02.27
NC30.07.4−2.523.70.00.4340.7 *0.01.91
NC40.02.7−0.861.40.0−0.9018.9 *9.50.67
NC53.87.7−3.450.03.8−2.1426.9 *11.51.01
NC61.54.50.660.03.0−0.9210.444.8 *−1.41
Huang-Huai HH116.25.41.530.00.0−1.1513.551.4 *−2.01
HH28.32.8−0.030.00.0−0.3519.4 *31.9 *−0.45
HH30.05.02.510.00.0−0.385.050.0 *−2.61
HH418.5 *3.72.480.03.70.8911.133.3 *−1.18
Jianghan JHA10.07.7−1.980.00.00.1230.8 *0.01.80
JHA20.06.3−1.040.00.00.3737.5 *3.11.35
Jiang-Huai JHU10.00.0−2.140.00.0−0.8529.4 *0.01.68
JHU20.00.0−1.3714.30.02.5967.9 *0.04.03
JiangnanJN12.16.4−0.020.02.11.3223.4 *6.41.39
JN20.06.5−0.840.00.00.8428.3 *0.01.49
JN31.89.1−1.0734.5 *0.02.6065.5 *3.64.10
JN42.92.90.172.90.01.1820.0 *14.31.03
JN52.85.6−0.482.80.01.1827.8 *11.11.50
JN62.417.1−1.119.80.02.3658.5 *7.33.28
Southern ChinaSC16.36.3−0.420.00.00.9537.5 *14.6 *1.13
SC20.09.5−2.610.00.0−0.2133.3 *9.51.71
SC30.035.9 *−2.730.00.00.4659.0 *2.63.73
SC43.720.4 *−1.803.70.0−0.1340.7 *5.62.18
SC50.025.0 *−1.870.00.01.4437.5 *0.02.39
Inner Mongolia IM5.35.3−0.092.70.00.0932.0 *16.0 *0.14
Northwest ChinaNWC142.1 *1.16.4250.5 *1.16.0514.7 *37.9 *−1.09
NWC220.4 *6.11.0030.6 *0.02.6836.7 *10.20.97
NWC33.711.10.663.70.00.9525.9 *9.31.06
NWC410.510.50.430.00.00.5836.8 *10.50.79
Tibet PlateauTR14.3 *0.02.7114.30.01.940.021.4 *−0.94
Southwest ChinaSWC124.1 *10.31.5217.2 *0.01.3120.7 *37.9 *−0.67
SWC25.923.1 *−1.610.02.7−0.1130.6 *14.5 *1.10
SWC31.029.8 *−3.500.05.8−1.9334.6 *12.5 *0.86
Notes: * represents the variation trend that is significant over the region.
Table 3. Ratio of stations showing upward or downward trends during 1971–2019 for four climate variables affecting variation of ET0 in Meteorological geographical divisions across China (p = 0.05).
Meteorological Geographical DivisionsTemperatureRelative HumidityWind SpeedSunshine Duration
Up
(%)
Down (%)Up (%)Down (%)Up (%)Down (%)Up (%)Down (%)
Northeast China98.5 *0.03.138.5 *2.381.5 *6.956.2 *
North China97.8 *0.00.956.0 *1.378.0 *0.487.1 *
Huang-Huai 100.0 *0.01.953.8 *1.387.2 *0.091.0 *
Jianghan 97.8 *0.02.273.3 *4.471.1 *0.066.7 *
Jiang-Huai 100.0 *0.00.077.4 *1.687.1 *0.083.9 *
Jiangnan 100.0 *0.01.263.1 *6.271.2 *0.462.3 *
Southern China97.1 *0.01.252.4 *14.1 *52.4 *3.548.2 *
Inner Mongolia area100.0 *0.00.070.7 *0.089.3 *10.750.7 *
Northwest China96.8 *0.011.1 *39.2 *6.067.7 *9.242.9 *
Tibet Plateau100.0 *0.00.021.4 *0.064.3 *0.042.9 *
Southwest China91.5 *0.64.750.5 *12.9 *58.9 *6.643.6 *
Notes: * represents the variation trend that is significant over the region.
Disclaimer/Publisher’s Note: The statements, opinions and data contained in all publications are solely those of the individual author(s) and contributor(s) and not of MDPI and/or the editor(s). MDPI and/or the editor(s) disclaim responsibility for any injury to people or property resulting from any ideas, methods, instructions or products referred to in the content.

