Copula-Based Severity–Duration–Frequency (SDF) Analysis of Streamflow Drought in the Source Area of the Yellow River, China
Abstract
1. Introduction
2. Materials and Methods
2.1. Study Area and Data
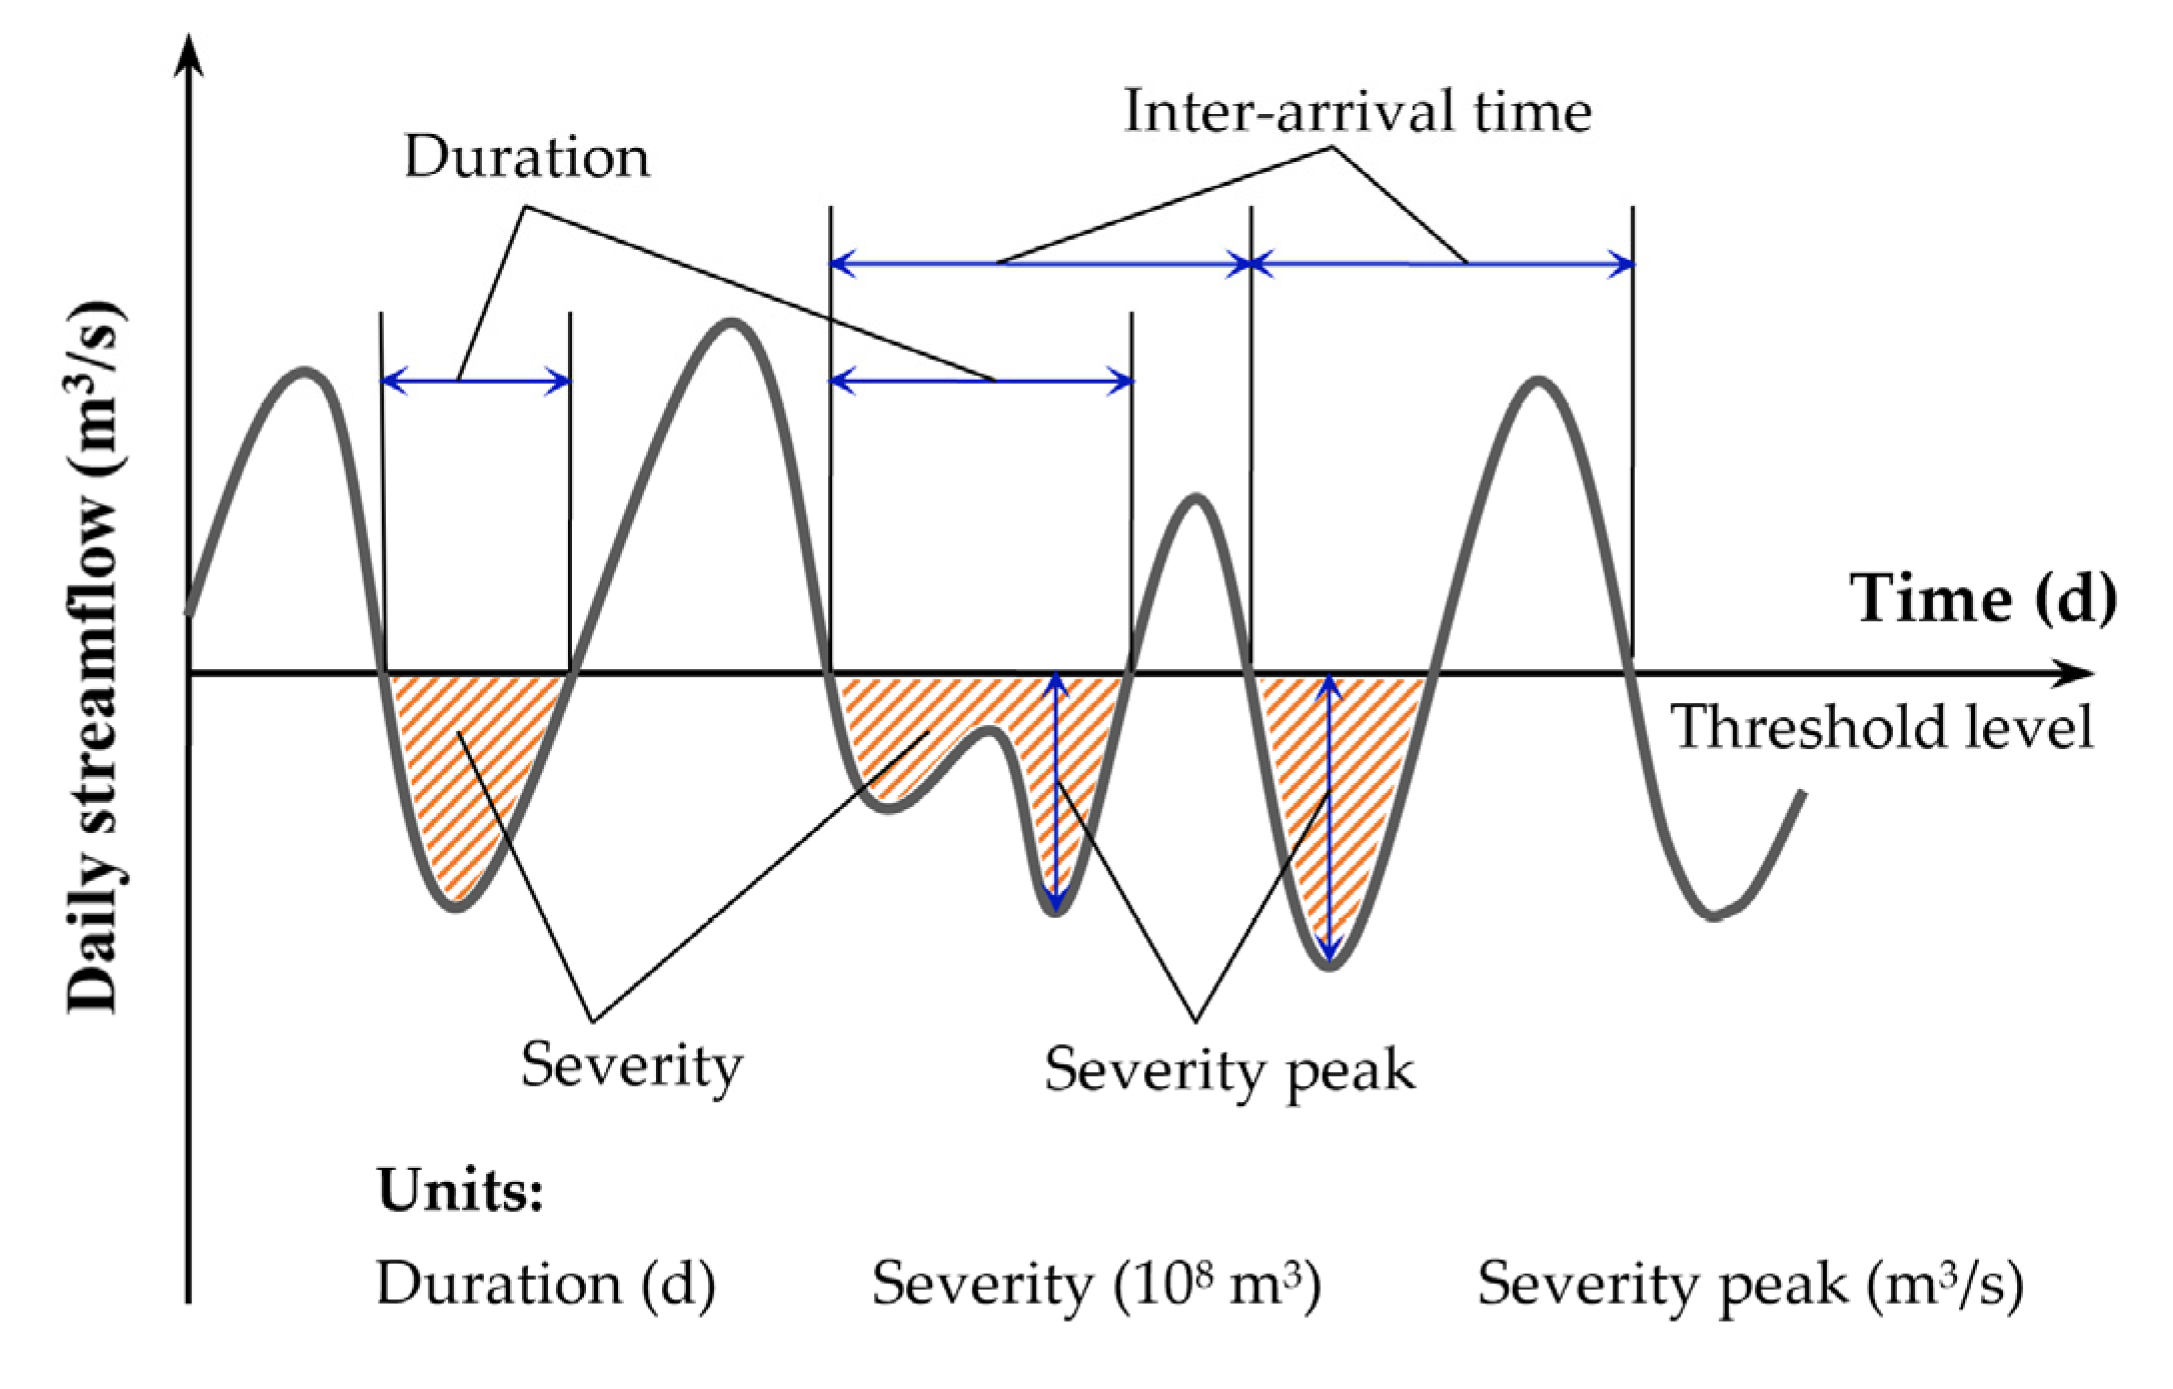
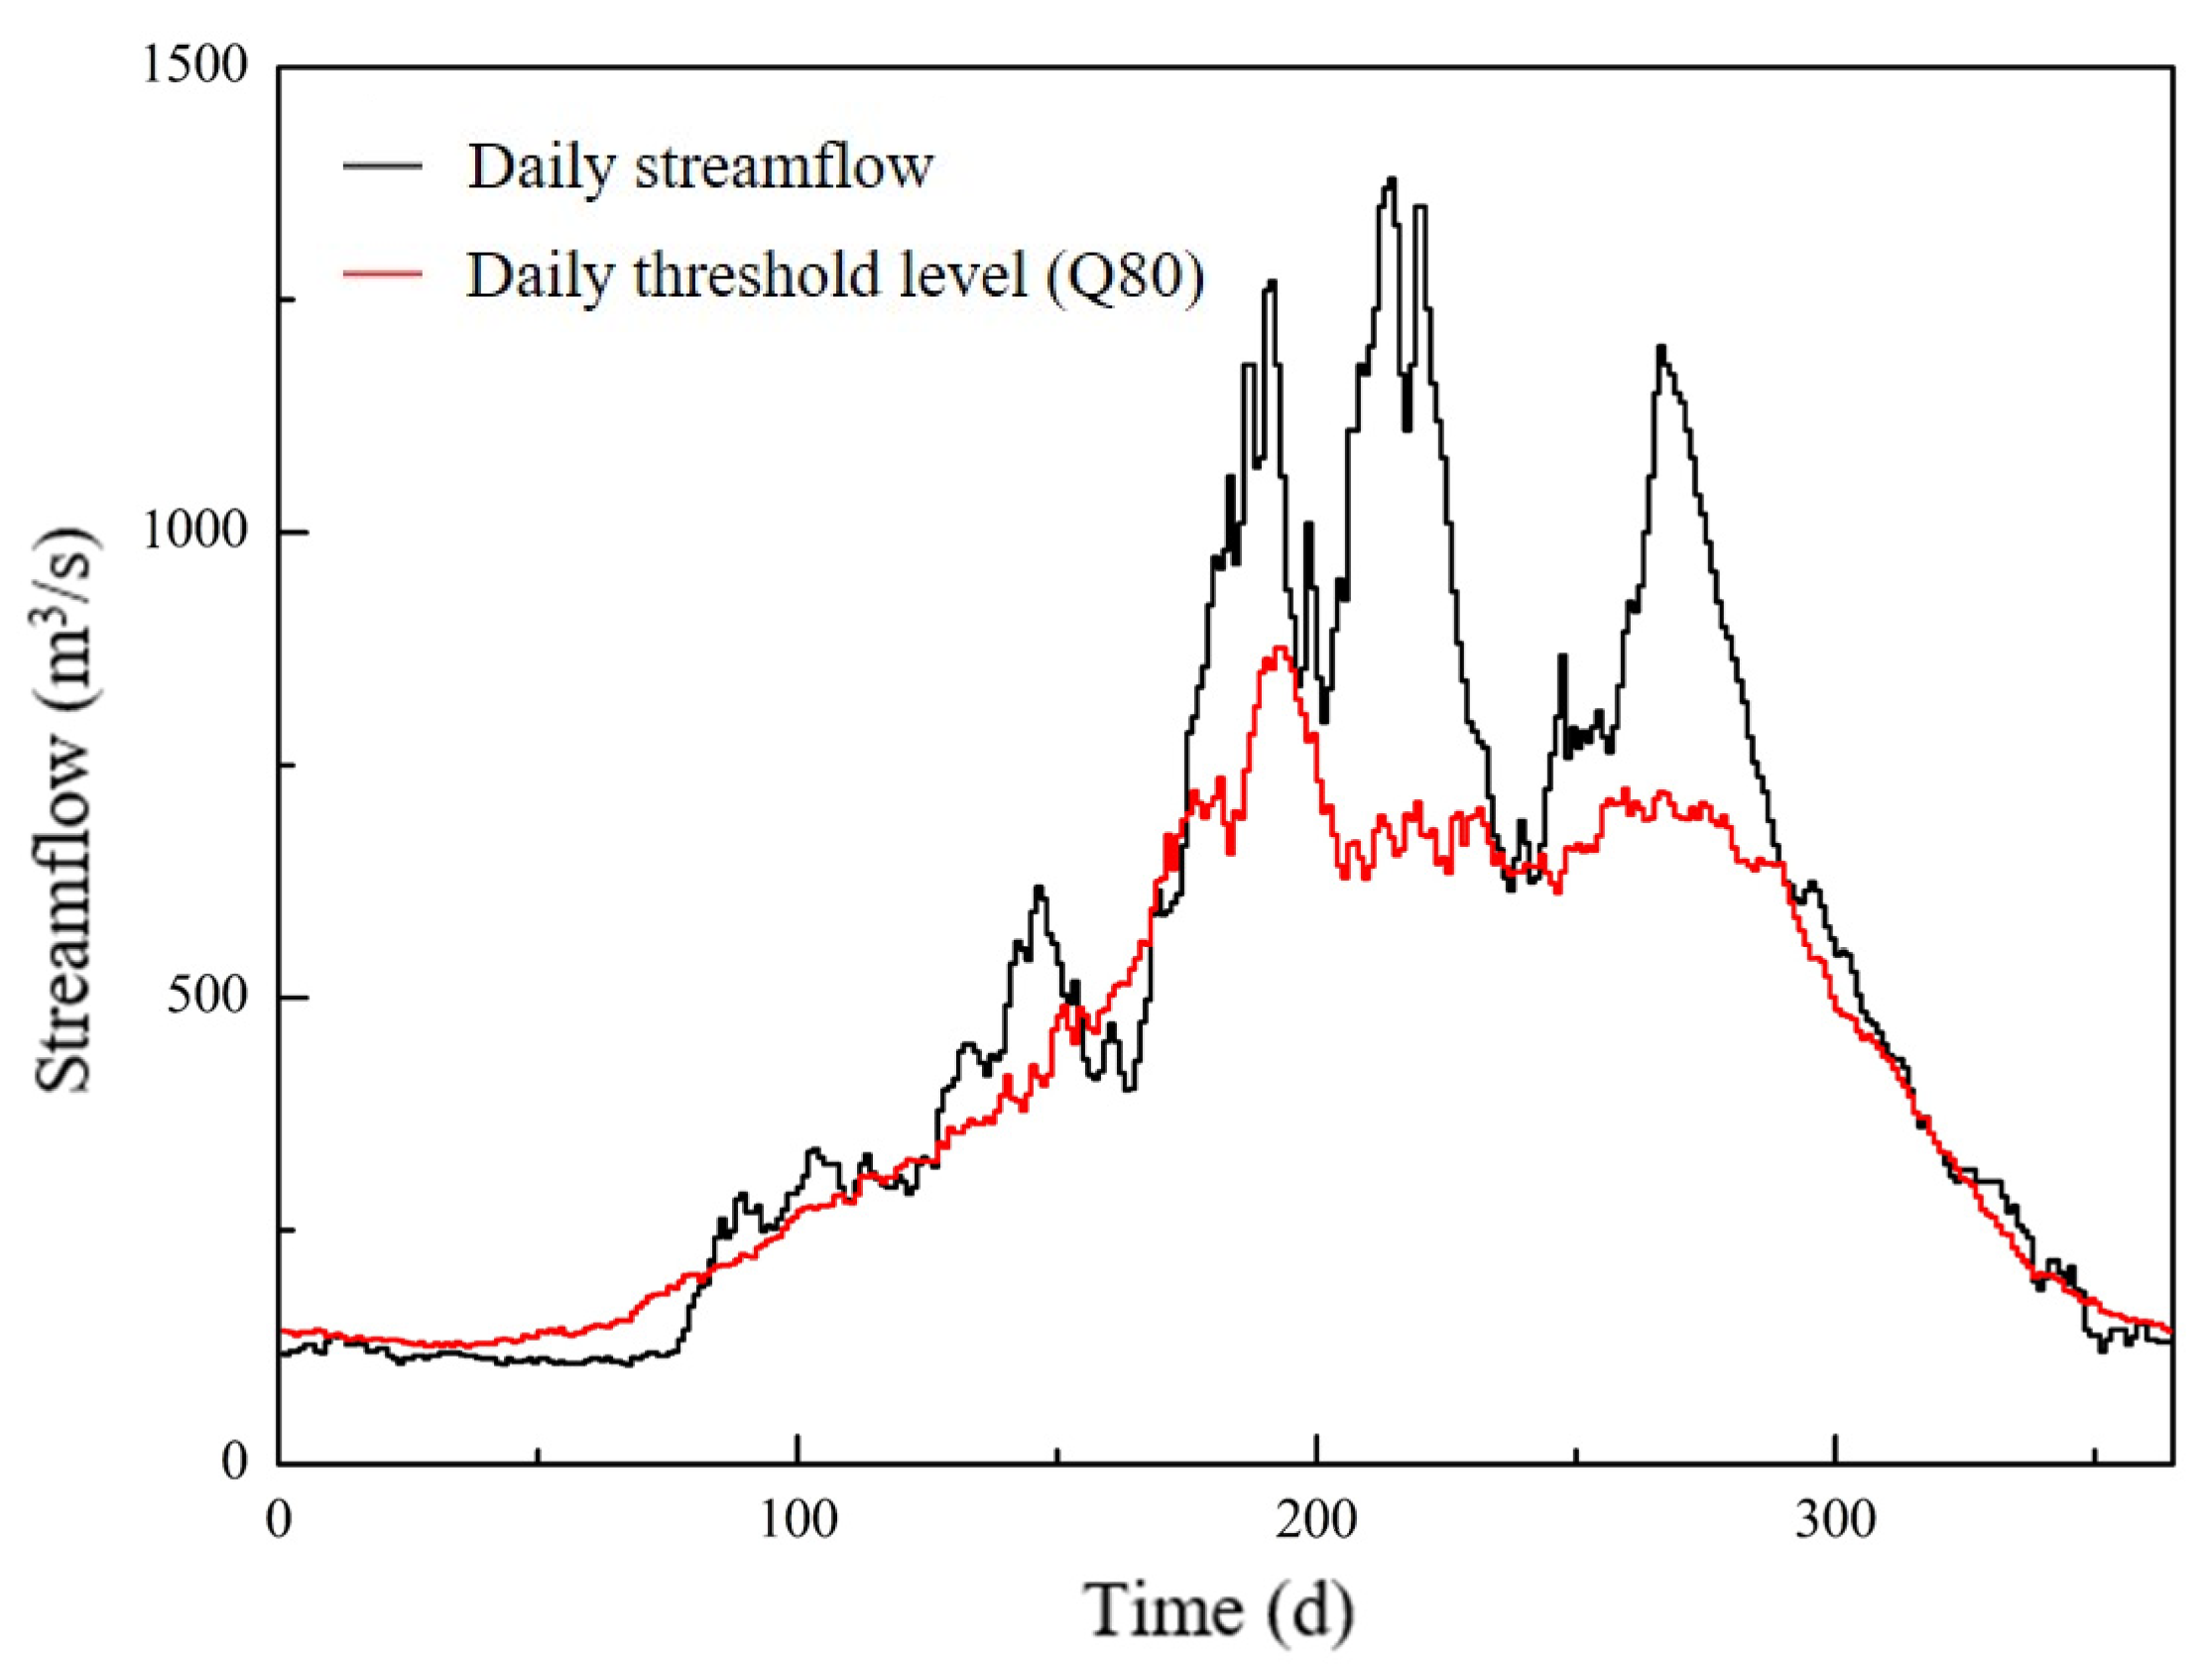
2.2. Streamflow Drought Identification
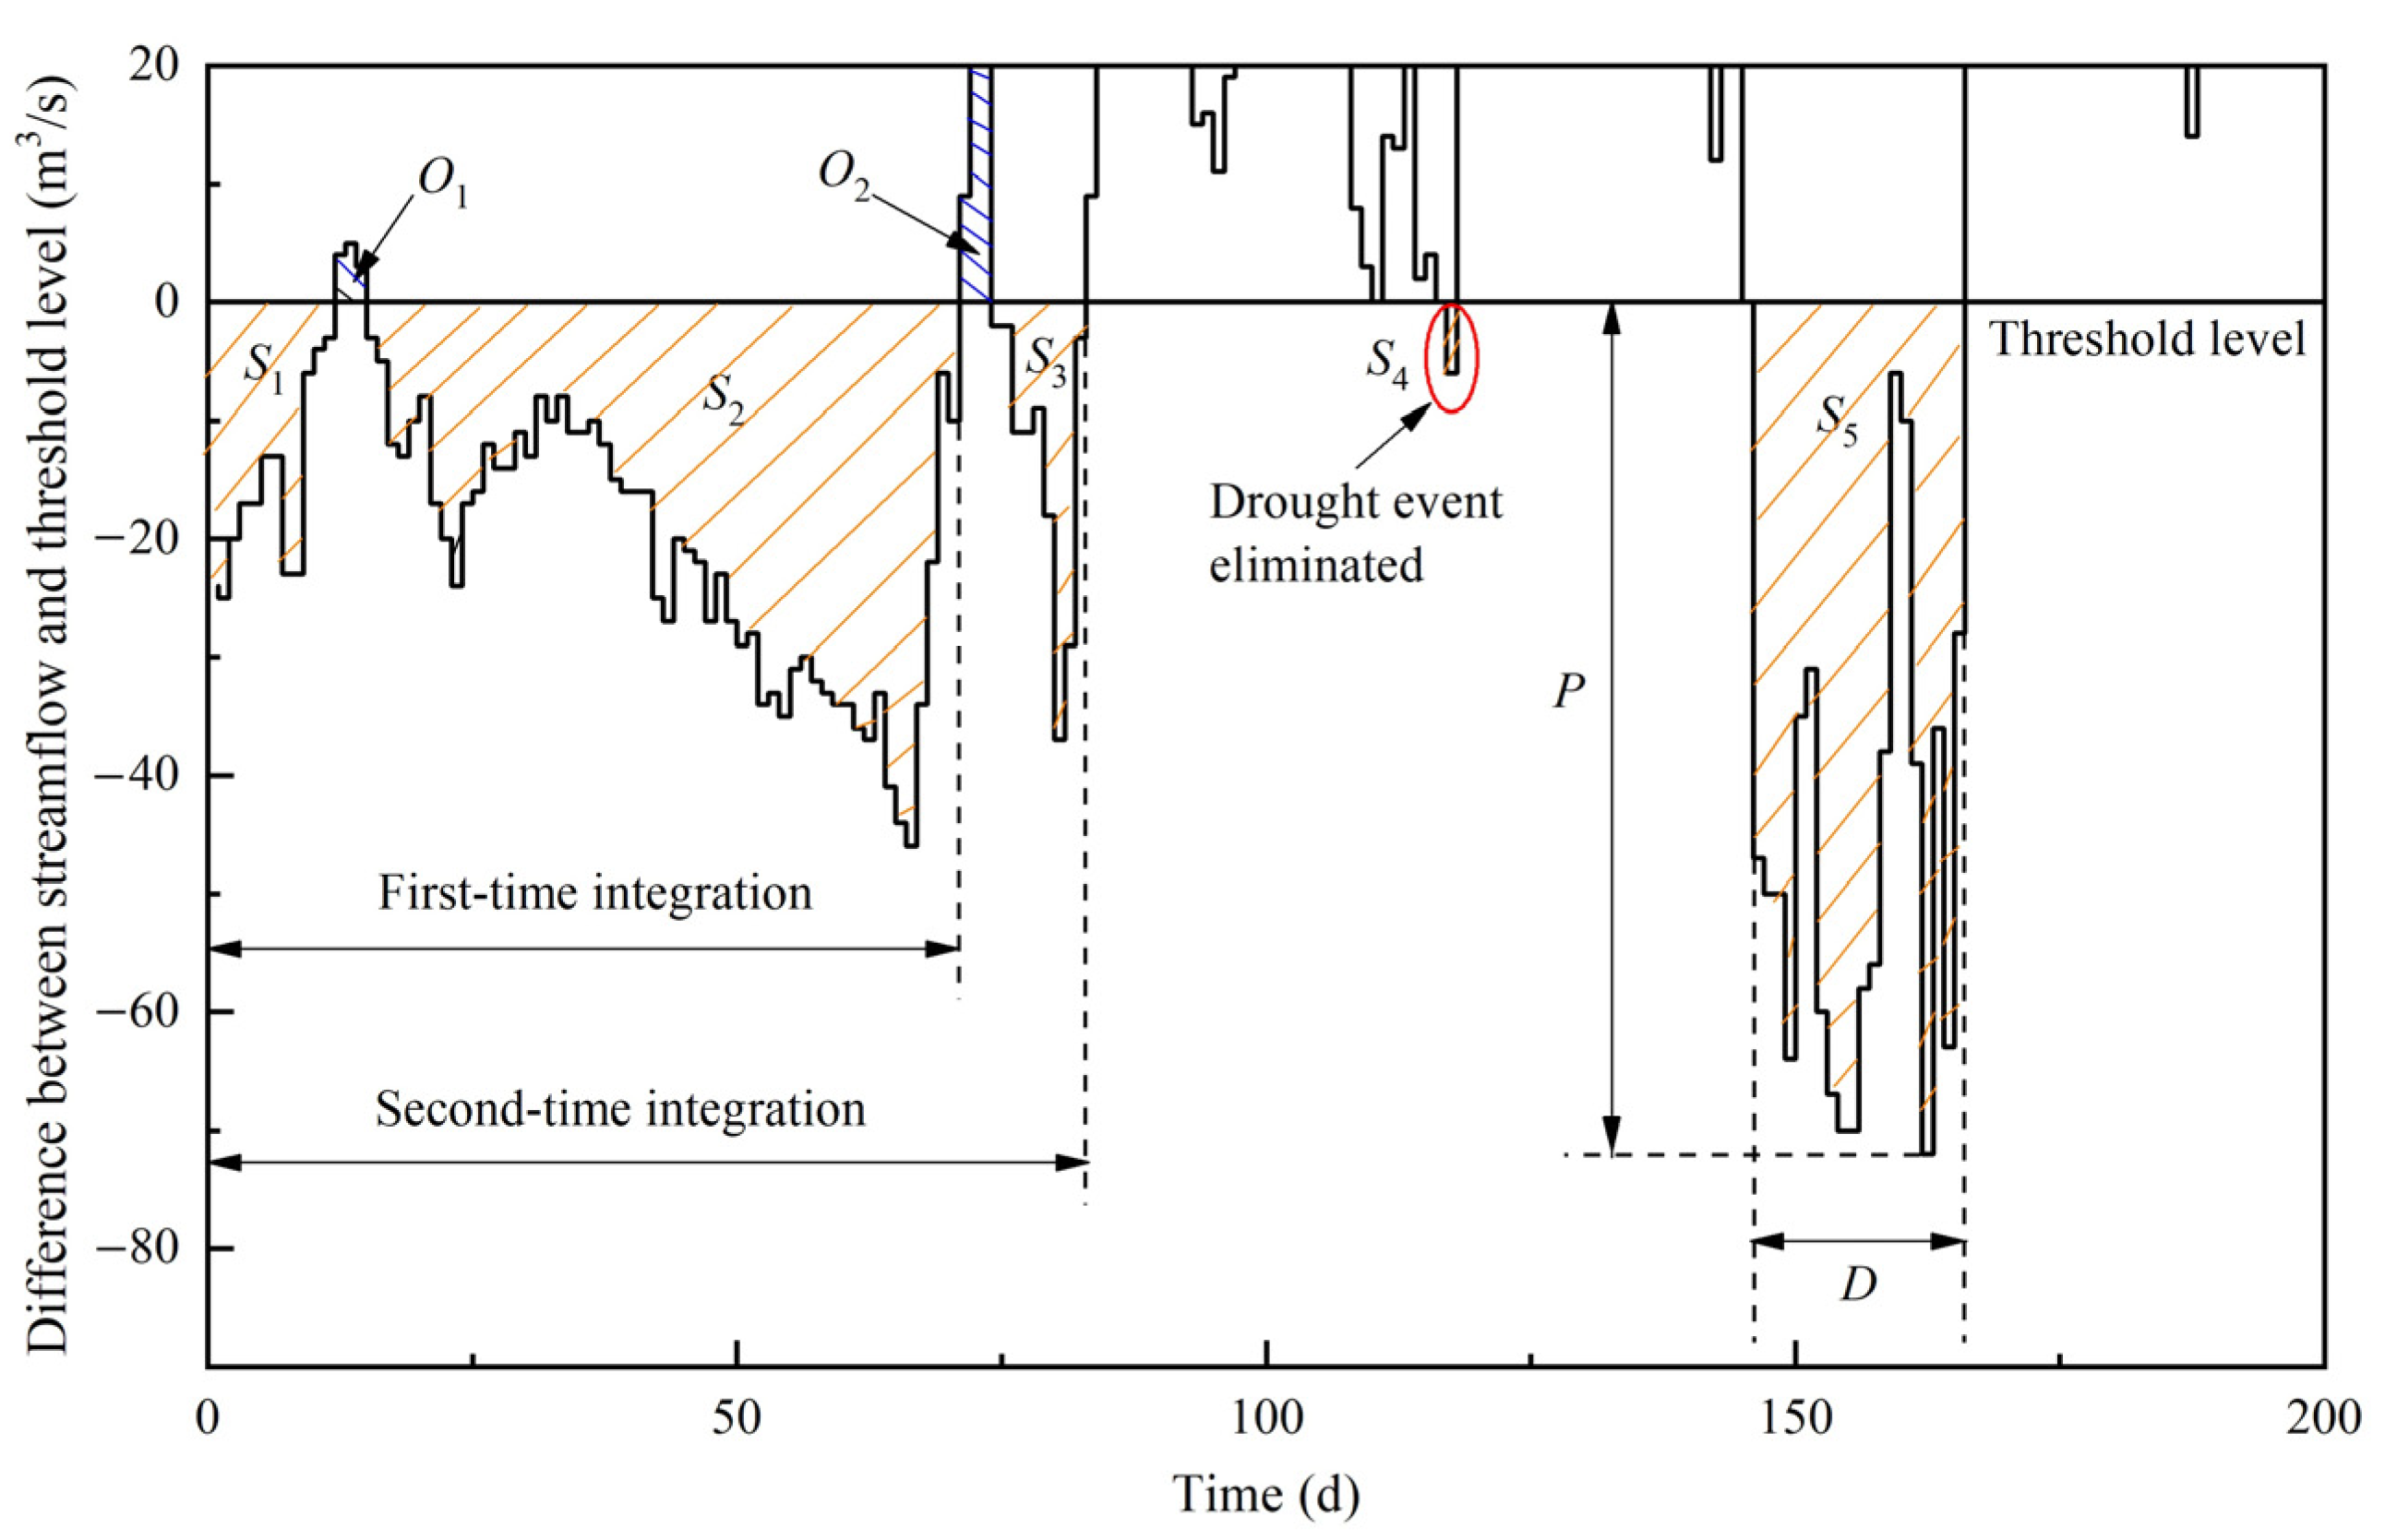
2.3. Integration and Elimination of Drought Events
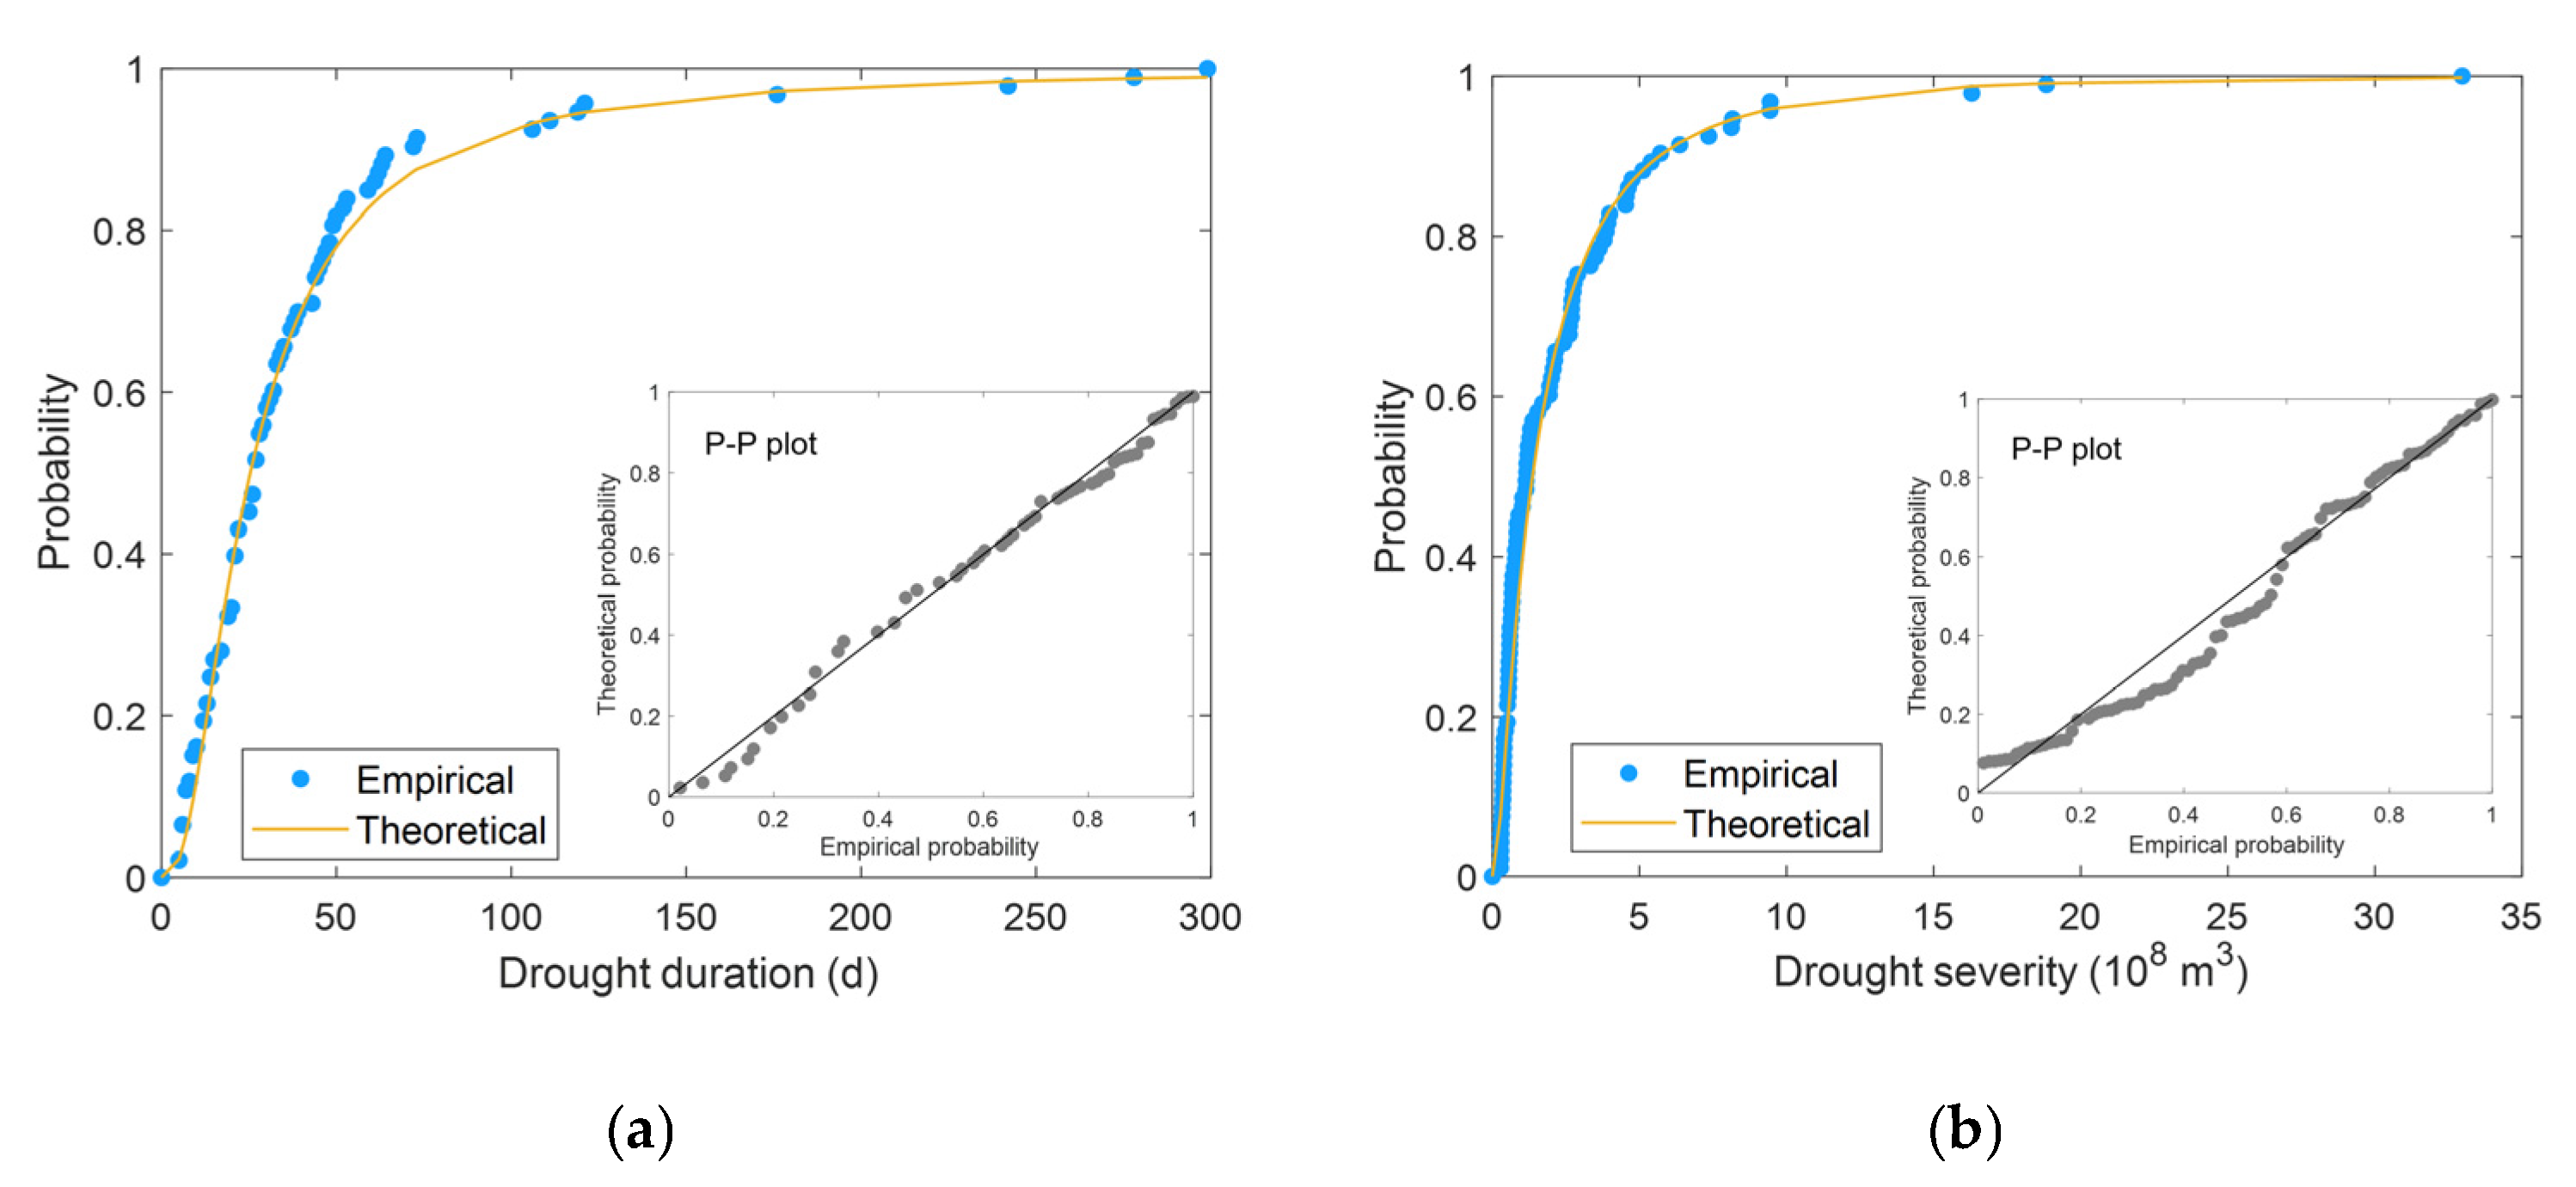
2.4. Marginal Probability Distribution
- (1)
- The generalized extreme value (GEV) distribution with a probability density function:
- (2)
- The log-normal distribution with a probability density function:
- (3)
- The generalized Pareto distribution with a probability density function:
2.5. Joint Probability Distribution
2.6. Copula-Based Joint and Conditional Probabilities
3. Results
3.1. Drought Identification
3.2. Selection of Marginal Probability Distributions
3.3. Construction of Bivariate Joint Probability Distribution
3.4. Gaussian Copula-Based SDF Relationships of Streamflow Drought
4. Discussion and Conclusions
- (1)
- The proportion of short-duration droughts generally increases as the threshold decreases, which suggests avoiding too-small thresholds, and the time-varying daily threshold level of Q80 is recommended for streamflow drought identification in the SAYR. After integration and elimination, the streamflow drought events are more consistent with the drought occurrence and persistence feature, highlighting the necessity to carry out integration and elimination processing on preliminarily identified streamflow droughts through run analysis;
- (2)
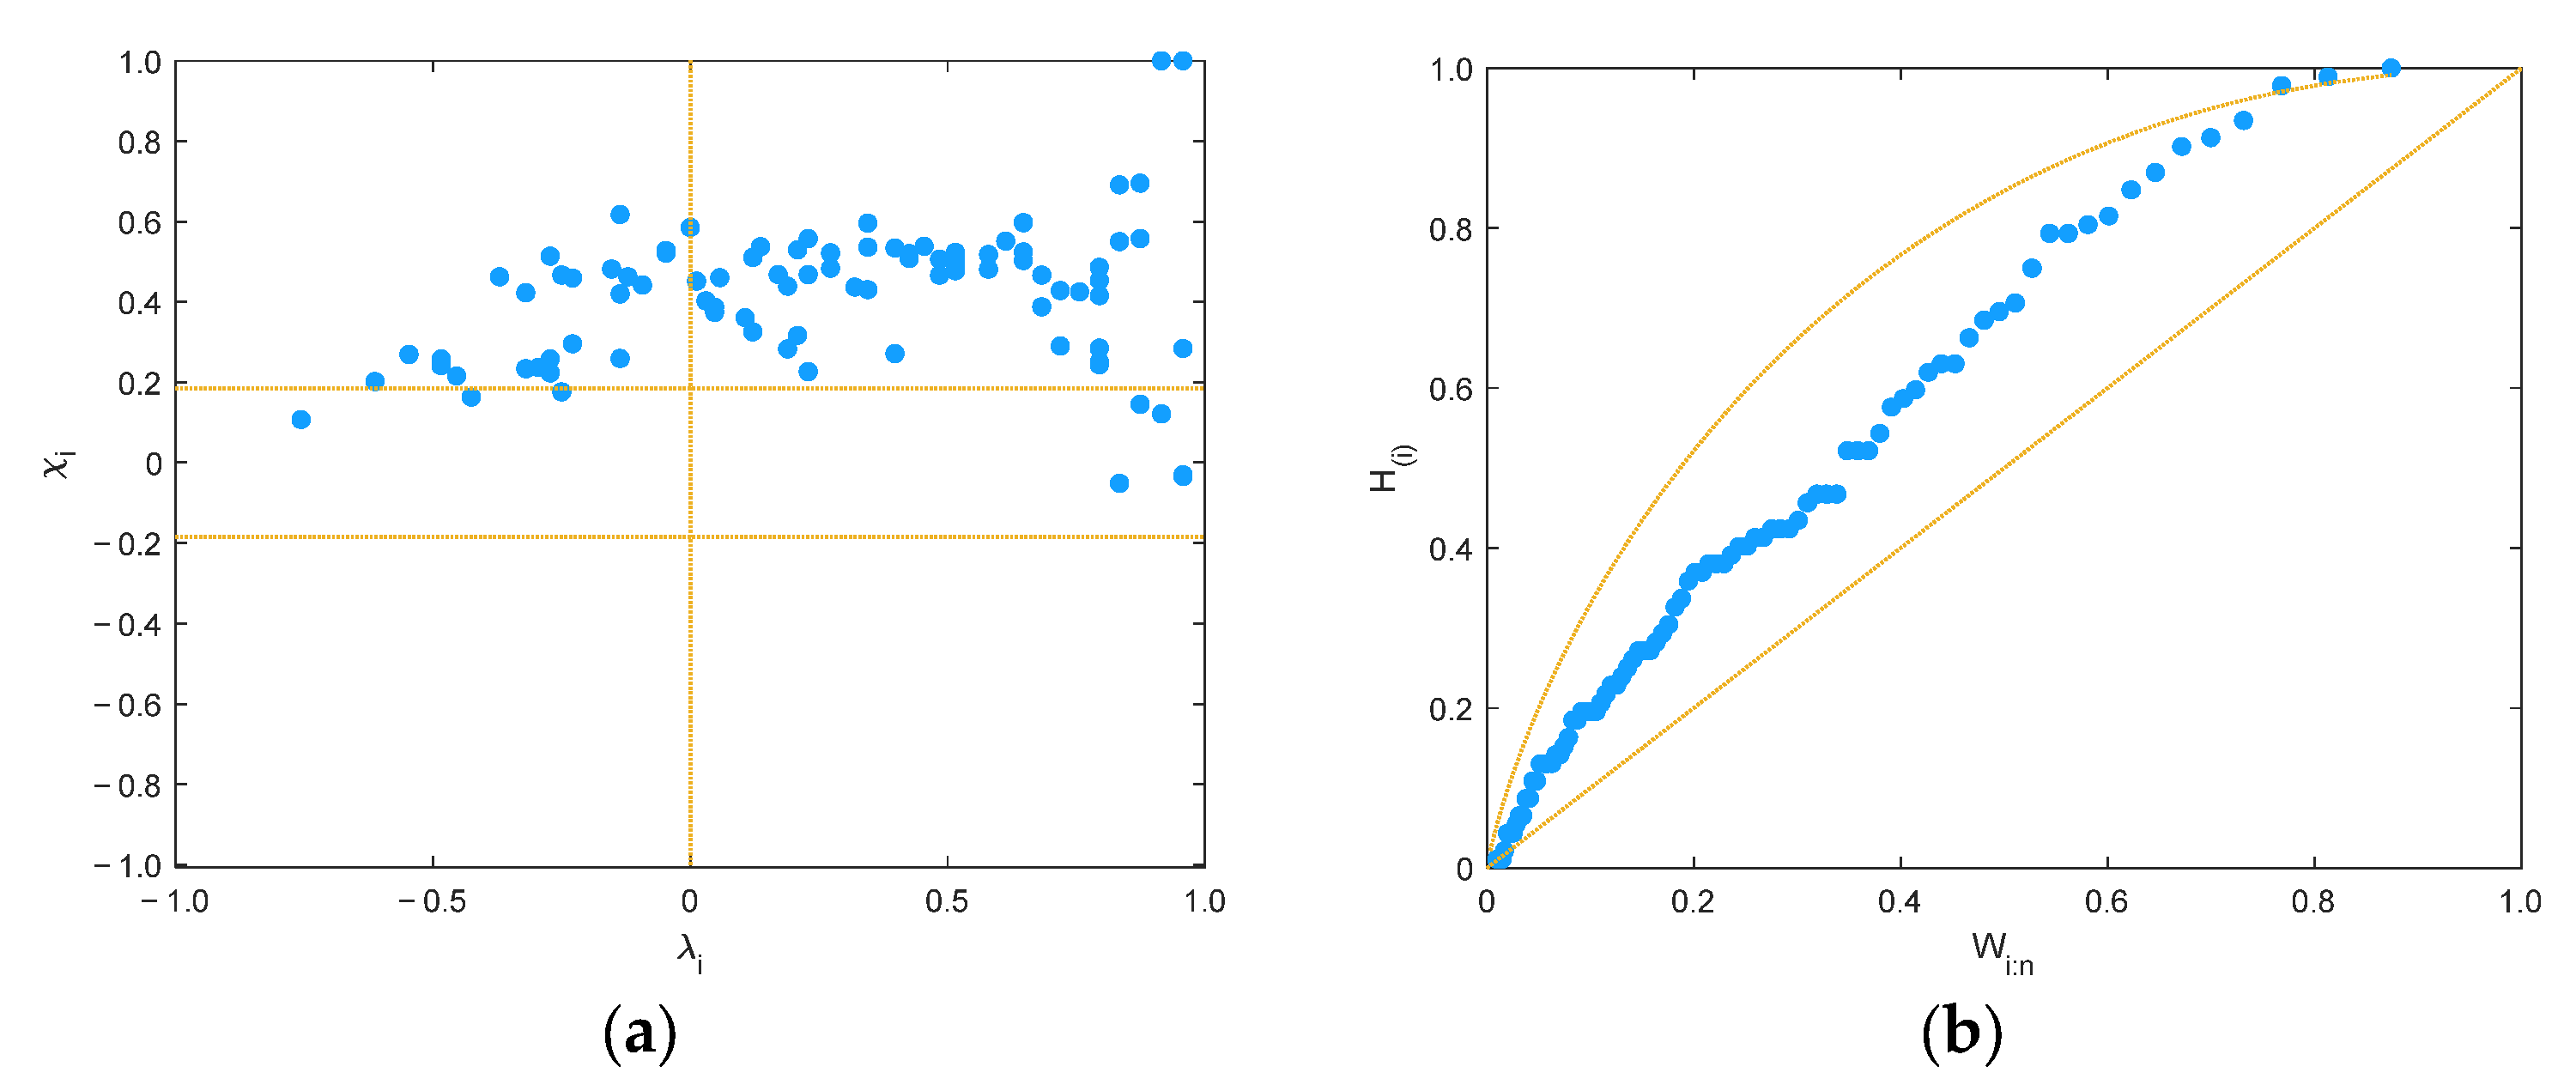
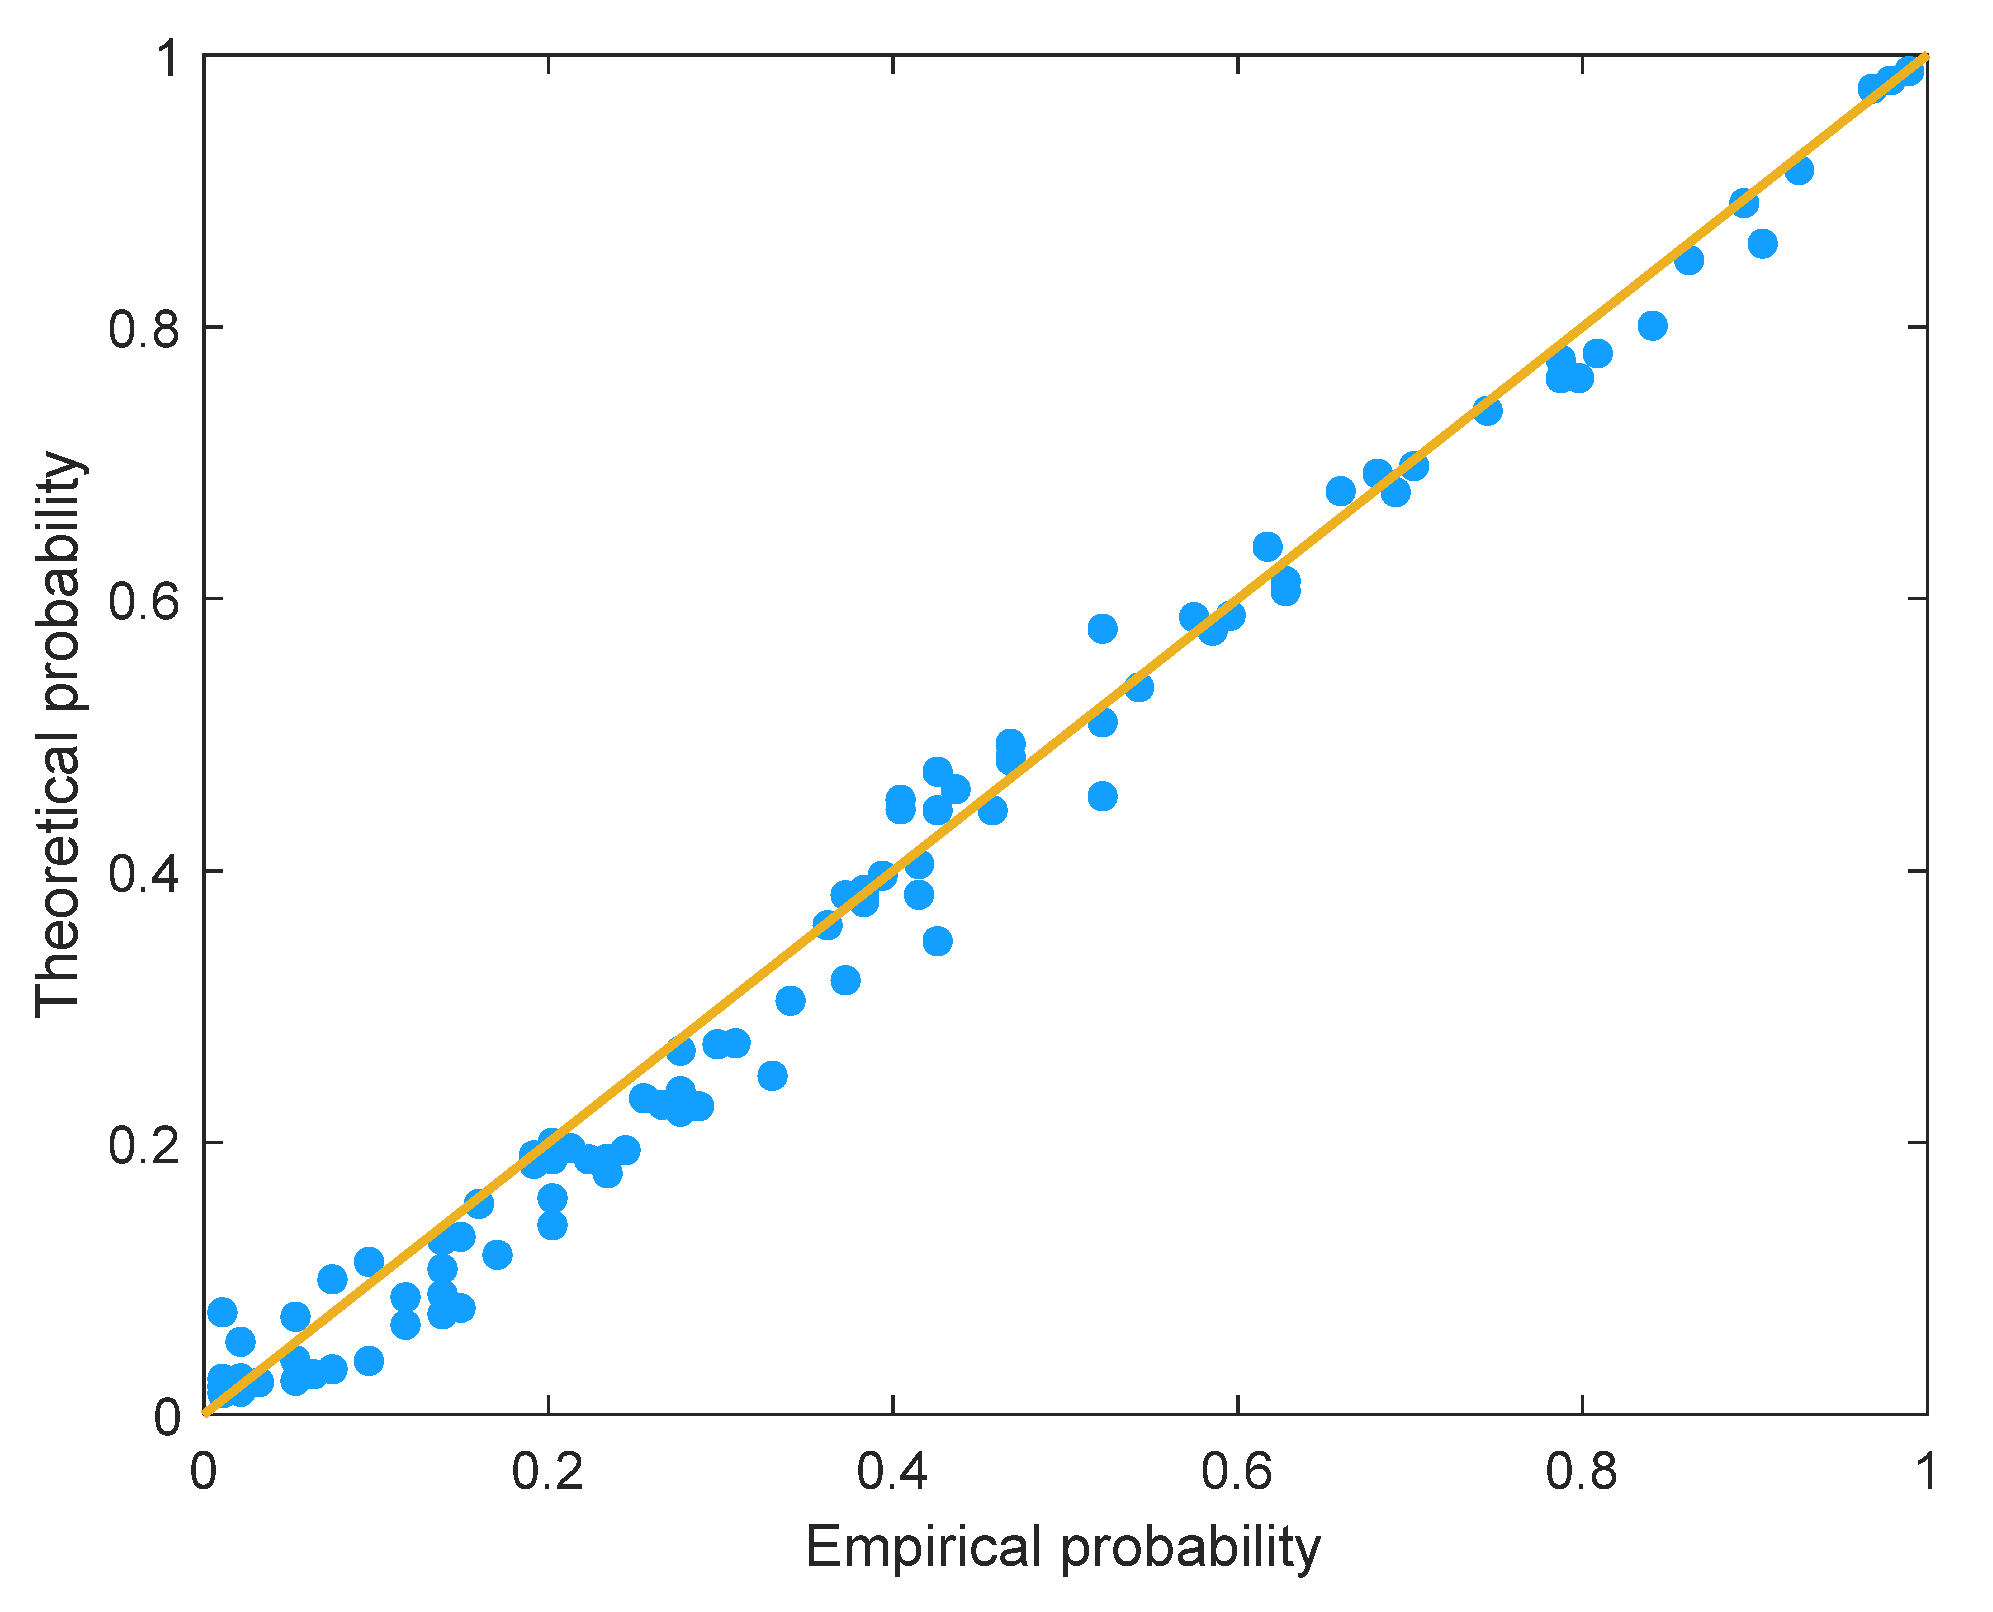
- According to the L-moment ratio diagram, P-P plot, and RMSE, the generalized extreme value, log-normal, and generalized Pareto are, respectively, suitable as marginal probability distributions of streamflow drought duration, severity, and severity peak at the Tangnaihai gauge. The correlation coefficient and rank-based correlation diagram suggested a significant asymmetric, positive correlation between drought duration and severity. Then, supported by the RMSE, AIC, and BIC, the Gaussian copula was selected as the optimal model for constructing bivariate joint probability distribution of streamflow drought duration and severity. In addition, the marginal and joint probability distributions of drought characteristics passed the K-S goodness-of-fit tests at the significant level of 0.05;
- (3)
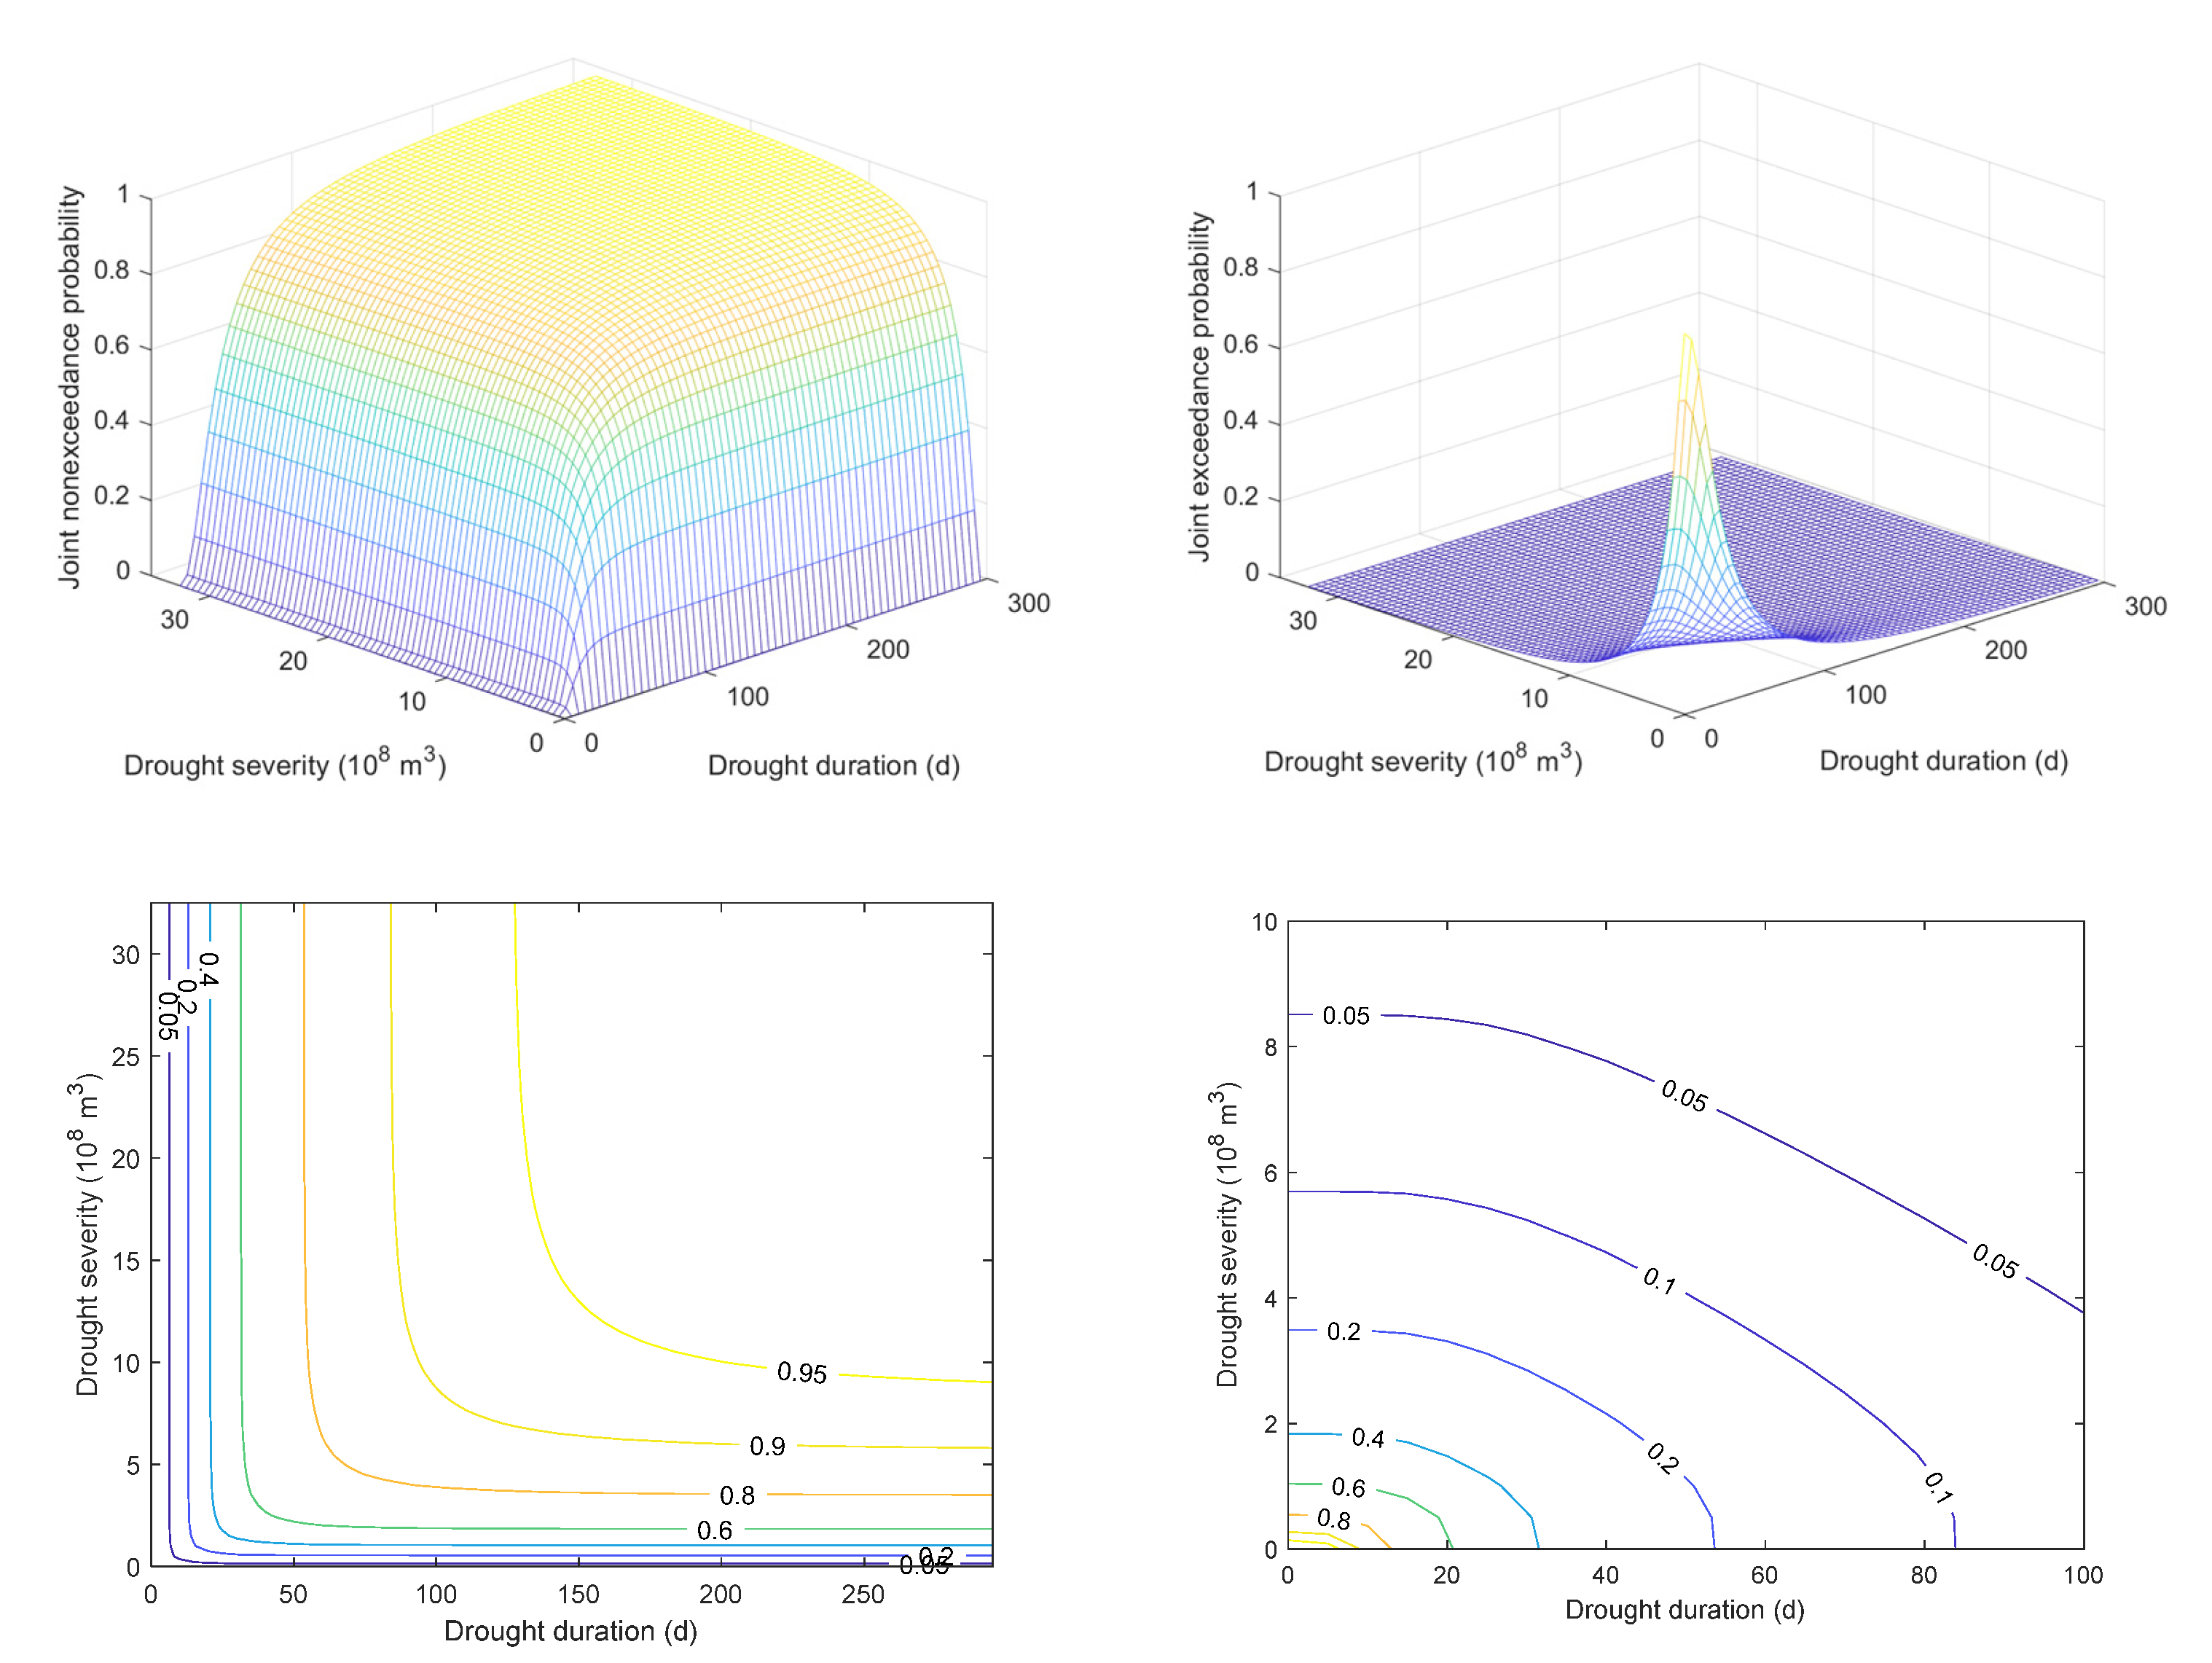
- Compared to traditional SDF analysis, the proposed copula-based SDF relationships of streamflow drought events can provide more critical information. Specifically, with given non-exceedance/exceedance probabilities, it can consider the different combinations of multiple drought characteristics, making up for the defect of ignoring their connection and interaction in univariate frequency analysis. Thus, the corresponding multivariate probabilistic analyses are more comprehensive and more consistent with the essential attributes of drought events. Moreover, the conditional probability distribution effectively reflects the trend of gradually decreasing non-exceedance probabilities of drought duration (severity) with increasing severity (duration), which has practical significance for analyzing the probabilistic impact of one drought characteristic on another. From a multivariate perspective, the probability of one or two drought characteristics exceeding specific values would increase with decreasing non-exceedance but increasing exceedance probabilities. That is, the expected inter-arrival time of the designed drought event would be shorter as well. The results also indicate that the overall risk of streamflow drought with short duration and low severity is relatively high in the SAYR, and more attention is needed regarding effective drought-mitigation strategies and measures.
Author Contributions
Funding
Data Availability Statement
Acknowledgments
Conflicts of Interest
References
- American Meteorological Society. Meteorological drought-Policy statement. B. Am. Meteorol. Soc. 1997, 78, 847–849. [Google Scholar] [CrossRef]
- Heim, R.R. A review of twentieth-century drought indices used in the United States. B. Am. Meteorol. Soc. 2002, 83, 1149–1165. [Google Scholar] [CrossRef]
- Ma, M.W.; Ren, L.L.; Singh, V.P.; Tu, X.J.; Jiang, S.H.; Liu, Y. Evaluation and application of the SPDI-JDI for droughts in Texas, USA. J. Hydrol. 2015, 521, 34–45. [Google Scholar] [CrossRef]
- Mishra, A.K.; Singh, V.P. A review of drought concepts. J. Hydrol. 2010, 391, 202–216. [Google Scholar] [CrossRef]
- Sung, J.H.; Chung, E.-S. Development of streamflow drought severity-duration-frequency curves using the threshold level method. Hydrol. Earth Syst. Sci. 2014, 18, 3341–3351. [Google Scholar] [CrossRef]
- Tu, X.J.; Du, Y.L.; Singh, V.P.; Chen, X.H.; Zhao, Y.; Ma, M.W.; Li, K.; Wu, H.O. Bivariate design of hydrological droughts and their alterations under a changing environment. J. Hydrol. Eng. 2019, 24, 04019015. [Google Scholar] [CrossRef]
- Razmkhah, H. Comparing threshold level methods in development of stream flow drought severity-duration-frequency curves. Water Resour. Manag. 2017, 31, 4045–4061. [Google Scholar] [CrossRef]
- Halwatura, D.; Lechner, A.M.; Arnold, S. Drought severity-duration-frequency curves: A foundation for risk assessment and planning tool for ecosystem establishment in post-mining landscapes. Hydrol. Earth Syst. Sci. 2015, 19, 1069–1091. [Google Scholar] [CrossRef]
- Todisco, F.; Mannocchi, F.; Vergni, L. Severity-duration-frequency curves in the mitigation of drought impact: An agricultural case study. Nat. Hazards 2013, 65, 1863–1881. [Google Scholar] [CrossRef]
- Rojas, L.P.T.; Diaz-Granados, M. The construction and comparison of regional drought severity-duration-frequency curves in two Colombian river basins-study of the Sumapaz and Lebrija basins. Water 2018, 10, 1453. [Google Scholar] [CrossRef]
- Sarailidis, G.; Vasiliades, L.; Loukas, A. Analysis of streamflow droughts using fixed and variable thresholds. Hydrol. Process. 2019, 33, 414–431. [Google Scholar] [CrossRef]
- Pandya, P.; Gontia, N.K. Development of drought severity-duration-frequency curves for identifying drought proneness in semi-arid regions. J. Water Clim. Chang. 2023, 14, 824–842. [Google Scholar] [CrossRef]
- Jafari, S.M.; Nikoo, M.R.; Sadegh, M.; Chen, M.J.; Gandomi, A.H. Non-parametric severity-duration-frequency analysis of drought based on satellite-based product and model fusion techniques. Environ. Sci. Pollut. Res. 2023, 30, 42087–42107. [Google Scholar] [CrossRef] [PubMed]
- Chung, C.H.; Salas, J.D. Drought occurrences probabilities and risks of dependent hydrologic processes. J. Hydrol. Eng. 2000, 5, 259–268. [Google Scholar] [CrossRef]
- Cancelliere, A.; Salas, J.D. Drought length properties for periodic-stochastic hydrologic data. Water Resour. Res. 2004, 40, W02503. [Google Scholar] [CrossRef]
- Mohan, S.; Sahoo, P.K. Stochastic simulation of droughts: Part-I: Point droughts. Hydrol. Process. 2008, 22, 854–862. [Google Scholar] [CrossRef]
- Hao, Z.; Singh, V.P. Drought characterization from a multivariate perspective: A review. J. Hydrol. 2015, 527, 668–678. [Google Scholar] [CrossRef]
- Shiau, J.T.; Shen, H.W. Recurrence analysis of hydrologic droughts of differing severity. J. Water Resour. Plan. Manag. 2001, 127, 30–40. [Google Scholar] [CrossRef]
- Mishra, A.K.; Singh, V.P.; Desai, V.R. Drought characterization: A probabilistic approach. Stoch. Environ. Res. Risk Assess. 2009, 23, 41–55. [Google Scholar] [CrossRef]
- Shiau, J.T.; Modarres, R. Copula-based drought severity-duration-frequency analysis in Iran. Meteo. Appl. 2009, 16, 481–489. [Google Scholar] [CrossRef]
- Mishra, A.K.; Singh, V.P. Drought modeling—A review. J. Hydrol. 2011, 403, 157–175. [Google Scholar] [CrossRef]
- González, J.; Valdés, J.B. Bivariate drought recurrence analysis using tree ring reconstructions. J. Hydrol. Eng. 2003, 8, 247–258. [Google Scholar] [CrossRef]
- Shiau, J.T. Fitting drought duration and severity with two-dimensional copulas. Water Resour. Manag. 2006, 20, 795–815. [Google Scholar] [CrossRef]
- Shiau, J.T.; Feng, S.; Nadarjah, S. Assessment of hydrological droughts for the Yellow River, China, using copulas. Hydrol. Process. 2007, 21, 2157–2163. [Google Scholar] [CrossRef]
- Nadarajah, S. A bivariate pareto model for drought. Stoch. Environ. Res. Risk Assess. 2009, 23, 811–822. [Google Scholar] [CrossRef]
- Song, S.B.; Singh, V.P. Meta-elliptical copulas for drought frequency analysis of periodic hydraulic data. Stoch. Environ. Res. Risk Assess. 2010, 24, 425–444. [Google Scholar] [CrossRef]
- Song, S.B.; Singh, V.P. Frequency analysis of droughts using the Plackett copula and parameter estimation by genetic algorithm. Stoch. Environ. Res. Risk Assess. 2010, 24, 783–805. [Google Scholar] [CrossRef]
- Ma, M.W.; Song, S.B.; Ren, L.L.; Jiang, S.H.; Song, J.L. Multivariate drought characteristics using trivariate Gaussian and Student t copulas. Hydrol. Process. 2013, 27, 1175–1190. [Google Scholar] [CrossRef]
- Reddy, M.J.; Ganguli, P. Application of copulas for derivation of drought severity-duration-frequency curves. Hydrol. Process. 2012, 26, 1672–1685. [Google Scholar] [CrossRef]
- Samantaray, A.K.; Singh, G.; Ramadas, M.; Panda, R.K. Drought hotspot analysis and risk assessment using probabilistic drought monitoring and severity-duration-frequency analysis. Hydrol. Process. 2019, 33, 432–449. [Google Scholar] [CrossRef]
- Sahana, V.; Sreekumar, P.; Mondal, A.; Rajsekhar, D. On the rarity of the 2015 drought in India: A country-wide drought atlas using the multivariate standardized drought index and copula-based severity-duration-frequency curves. J. Hydrol. Reg. Stud. 2020, 31, 100727. [Google Scholar] [CrossRef]
- Ma, M.W.; Ren, M.M.; Zang, H.F.; Cui, H.J.; Jiang, S.H.; Sun, Y.W. Nonstationary quantity-duration-frequency (QDF) relationships of lowflow in the source area of the Yellow River basin, China. J. Hydrol. Reg. Stud. 2023, 48, 101450. [Google Scholar] [CrossRef]
- Tallaksen, L.M.; Massen, H.; Clausen, B. On the definition and modelling of streamflow drought duration and deficit volume. Hydrol. Sci. J. 1997, 42, 15–33. [Google Scholar] [CrossRef]
- Hosking, J.R.M. L-moments: Analysis and estimation of distributions using linear combinations of order statistics. J. R. Stat. Soc. Ser. B-Stat. Methodol. 1990, 52, 105–124. [Google Scholar] [CrossRef]
- Vogel, R.M.; Fennessey, N.M. L moment diagrams should replace product moment diagrams. Water Resour. Res. 1993, 29, 1745–1752. [Google Scholar] [CrossRef]
- Fisher, N.I.; Switzer, P. Chi-plots for assessing dependence. Biometrika 1985, 72, 253–265. [Google Scholar] [CrossRef]
- Fisher, N.I.; Switzer, P. Graphical assessment of dependence: Is a picture worth 100 tests? Am. Stat. 2001, 55, 233–239. [Google Scholar] [CrossRef]
- Nelson, R.B. An Introduction to Copulas; Springer: New York, NY, USA, 1999. [Google Scholar]
- Genest, C.; Favre, A.C. Everything you always wanted to know about copula modeling but were afraid to ask. J. Hydrol. Eng. 2007, 12, 347–368. [Google Scholar] [CrossRef]




| Daily Threshold Levels | Drought Events (No.) | Short-Duration Drought Events * (No.) | Percentages of Short-Duration Drought Events (%) | Averages of Drought Duration (d) | Averages of Drought Severity (108 m3) |
|---|---|---|---|---|---|
| Q70 | 569 | 359 | 63.1 | 11.6 | 0.88 |
| Q75 | 527 | 342 | 64.9 | 10.5 | 0.71 |
| Q80 | 429 | 267 | 62.2 | 10.3 | 0.61 |
| Q85 | 370 | 239 | 64.6 | 8.9 | 0.43 |
| Q90 | 303 | 211 | 69.6 | 7.3 | 0.29 |
| Q95 | 208 | 149 | 71.6 | 8.3 | 0.55 |
| Different Treatments | Drought Events (No.) | Averages of Drought Duration (d) | Averages of Drought Severity (108 m3) |
|---|---|---|---|
| Untreated | 429 | 10.3 | 0.61 |
| Only integration | 290 | 16.0 | 0.90 |
| Integration and elimination | 93 | 41.2 | 2.72 |
| Drought Characteristics | Probability Distributions | Distribution Parameters | RMSE | Kolmogorov–Smirnov (K-S) Test | |||
|---|---|---|---|---|---|---|---|
| Location | Scale | Shape | |||||
| Duration (D) | Generalized extreme value | 19.3352 | 14.9743 | 0.5256 | 0.0258 | 0.0800 | 0.1378 |
| Severity (S) | Log-normal | 0.3125 | 1.1120 | 0.0494 | 0.1058 | 0.1392 | |
| Severity peak (P) | Generalized Pareto | 226.2524 | −0.4392 | 0.0519 | 0.1166 | 0.1376 | |
| Correlation Coefficients | Duration and Severity | Duration and Peak | Severity and Peak |
|---|---|---|---|
| Pearson () | 0.8451 | 0.2834 | 0.6234 |
| Spearman () | 0.6259 | 0.1487 | 0.8064 |
| Kendall () | 0.4819 | 0.1078 | 0.6036 |
| Copulas | Parameters | Parameter Estimates | Goodness-of-Fit | ||
|---|---|---|---|---|---|
| AIC | BIC | RMSE | |||
| Gaussian | 0.6868 | −626.0448 | −620.9796 | 0.0338 | |
| Student’s t * | 0.6868 | −622.4832 | −614.8854 | 0.0341 | |
| Frank | 4.7964 | −611.7692 | −609.2366 | 0.0369 | |
| Gumbel | 1.8102 | −603.9915 | −601.4589 | 0.0385 | |
| Clayton | 1.2453 | −602.5924 | −600.0598 | 0.0388 | |
Disclaimer/Publisher’s Note: The statements, opinions and data contained in all publications are solely those of the individual author(s) and contributor(s) and not of MDPI and/or the editor(s). MDPI and/or the editor(s) disclaim responsibility for any injury to people or property resulting from any ideas, methods, instructions or products referred to in the content. |
© 2023 by the authors. Licensee MDPI, Basel, Switzerland. This article is an open access article distributed under the terms and conditions of the Creative Commons Attribution (CC BY) license (https://creativecommons.org/licenses/by/4.0/).
Share and Cite
Ma, M.; Zang, H.; Wang, W.; Cui, H.; Sun, Y.; Cheng, Y. Copula-Based Severity–Duration–Frequency (SDF) Analysis of Streamflow Drought in the Source Area of the Yellow River, China. Water 2023, 15, 2741. https://doi.org/10.3390/w15152741
Ma M, Zang H, Wang W, Cui H, Sun Y, Cheng Y. Copula-Based Severity–Duration–Frequency (SDF) Analysis of Streamflow Drought in the Source Area of the Yellow River, China. Water. 2023; 15(15):2741. https://doi.org/10.3390/w15152741
Chicago/Turabian StyleMa, Mingwei, Hongfei Zang, Wenchuan Wang, Huijuan Cui, Yanwei Sun, and Yujia Cheng. 2023. "Copula-Based Severity–Duration–Frequency (SDF) Analysis of Streamflow Drought in the Source Area of the Yellow River, China" Water 15, no. 15: 2741. https://doi.org/10.3390/w15152741
APA StyleMa, M., Zang, H., Wang, W., Cui, H., Sun, Y., & Cheng, Y. (2023). Copula-Based Severity–Duration–Frequency (SDF) Analysis of Streamflow Drought in the Source Area of the Yellow River, China. Water, 15(15), 2741. https://doi.org/10.3390/w15152741


