Analysis of the Energy Loss Mechanism of Pump-Turbines with Splitter Blades under Different Characteristic Heads
Abstract
:1. Introduction
2. Theory of the Simulation
2.1. Turbulence Model and Entropy Production Theory
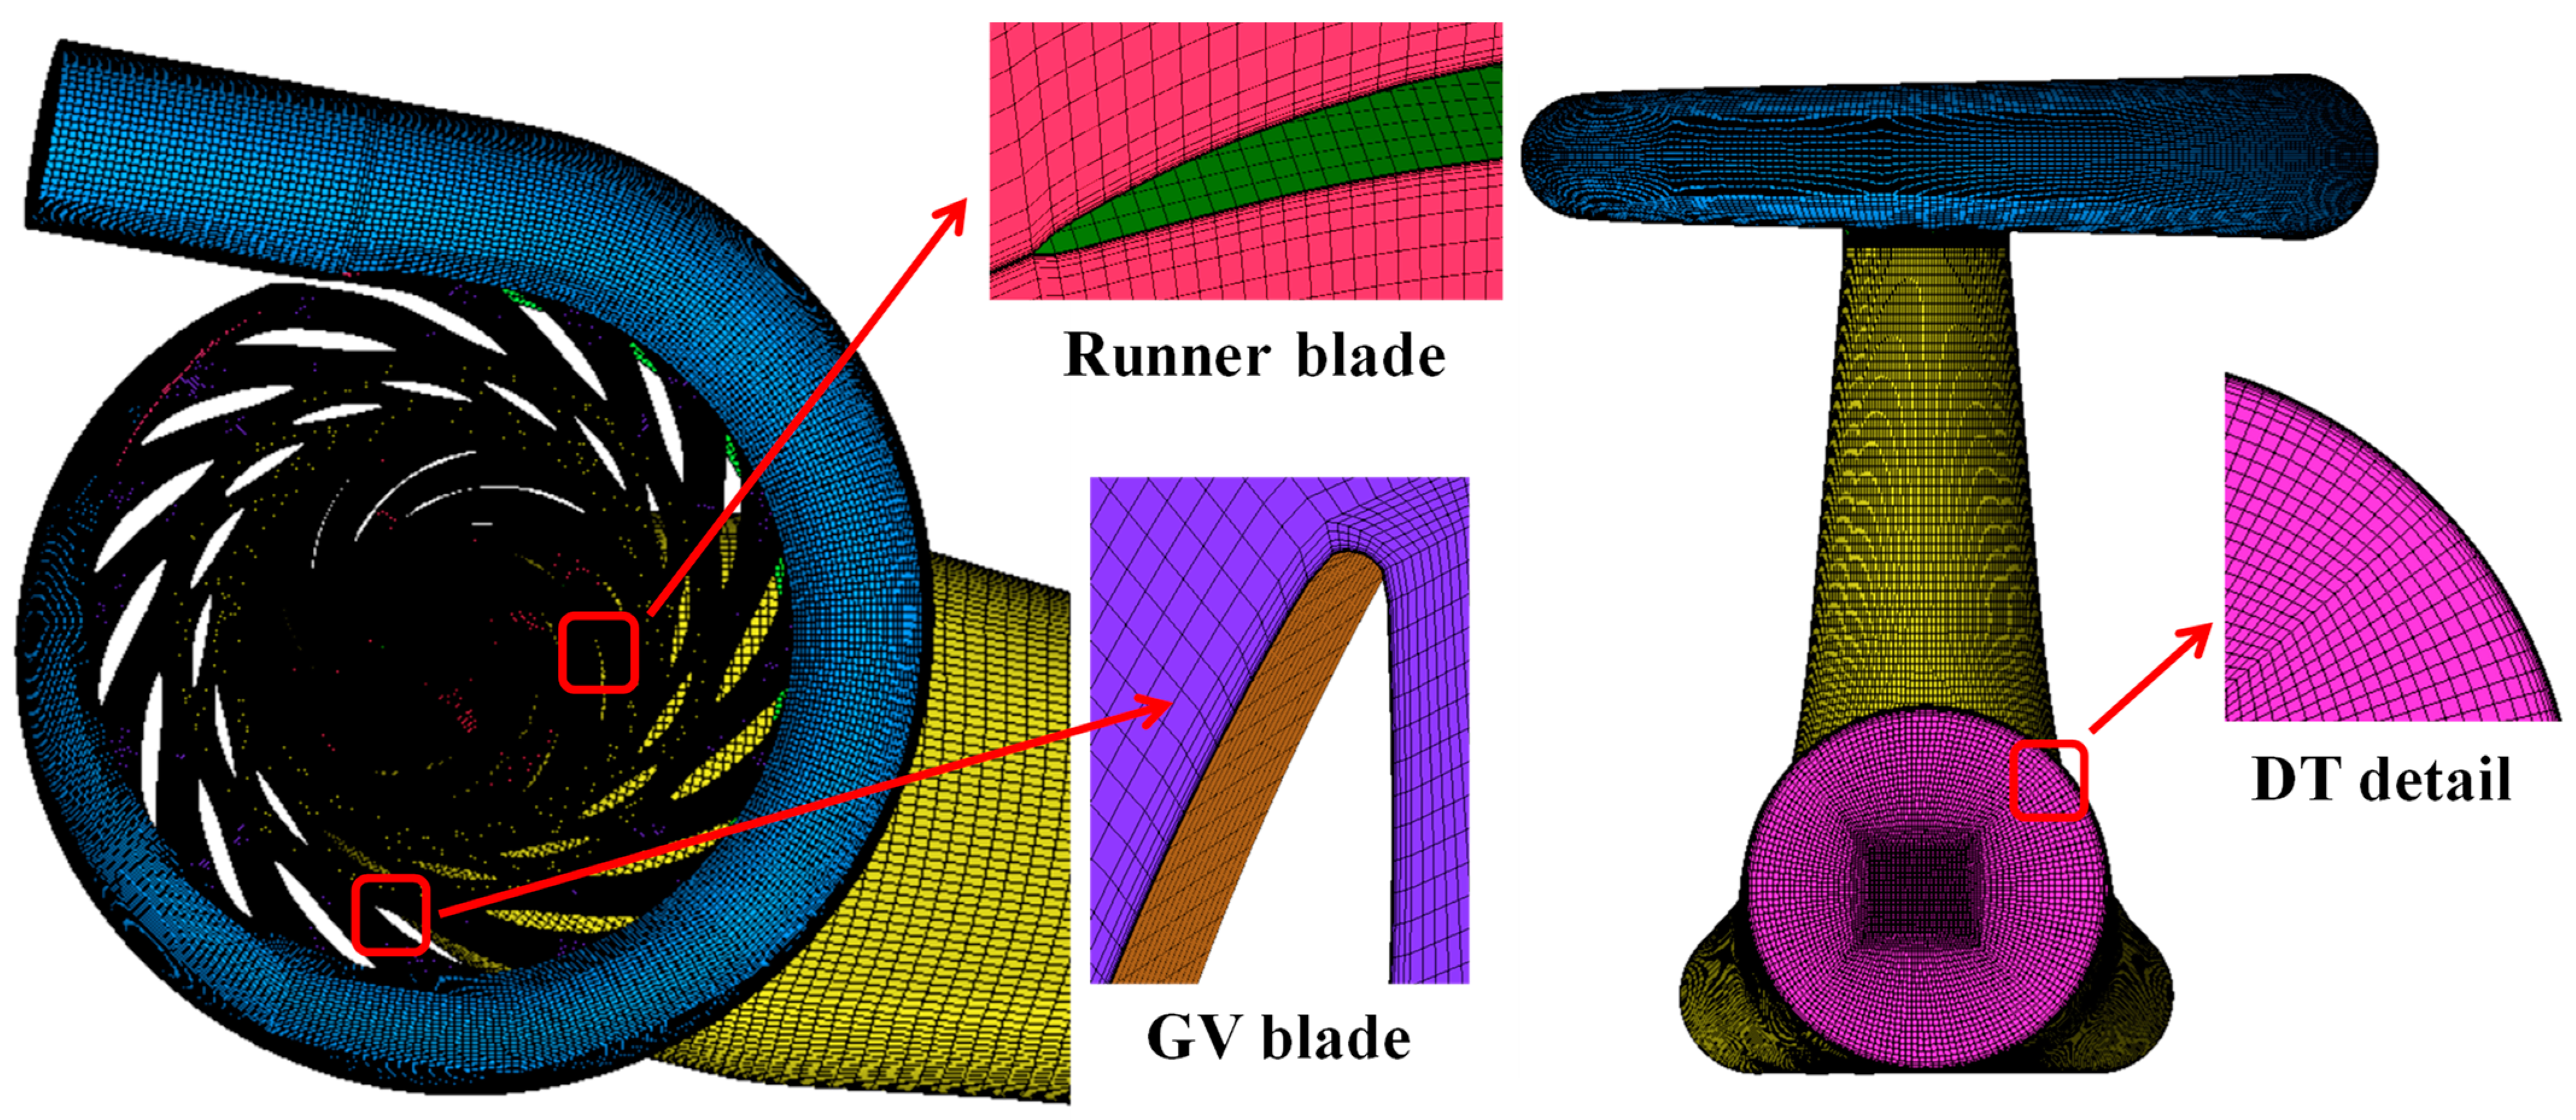
2.2. Calculation Domain and Mesh Generation
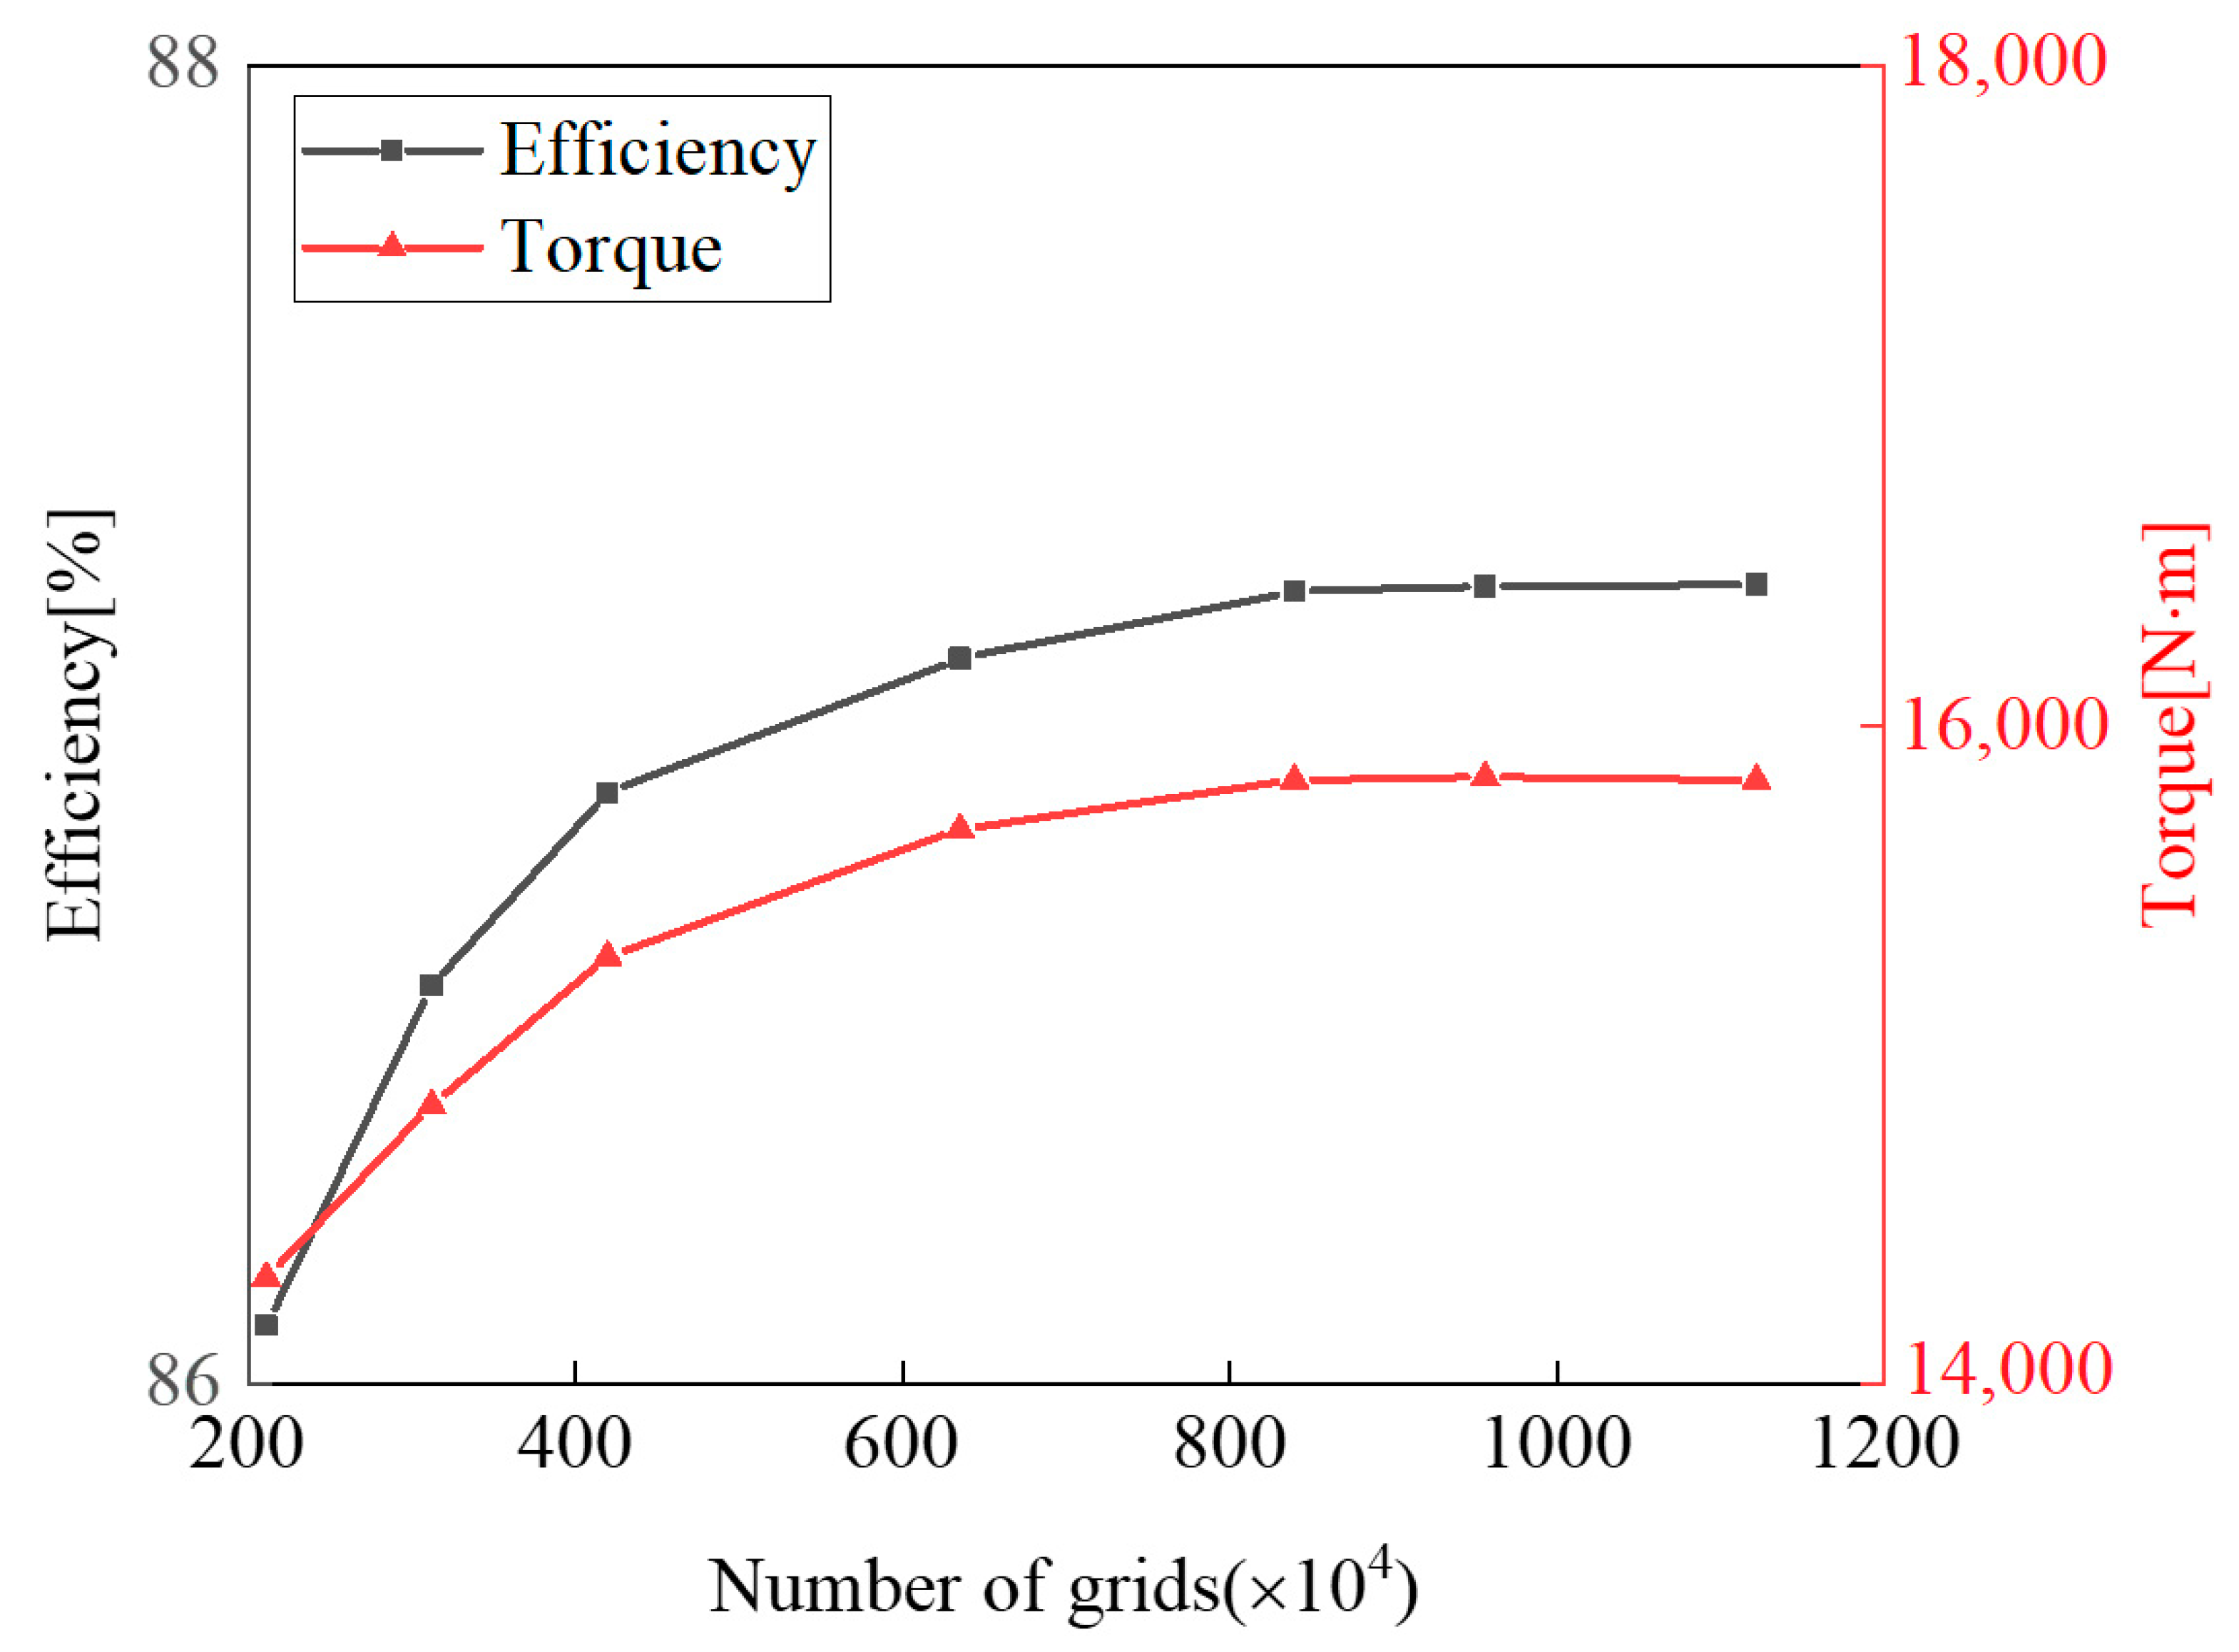
2.3. Grid Independence Verification
2.4. Boundary Conditions and Case Information
3. Experimental Test and Validation
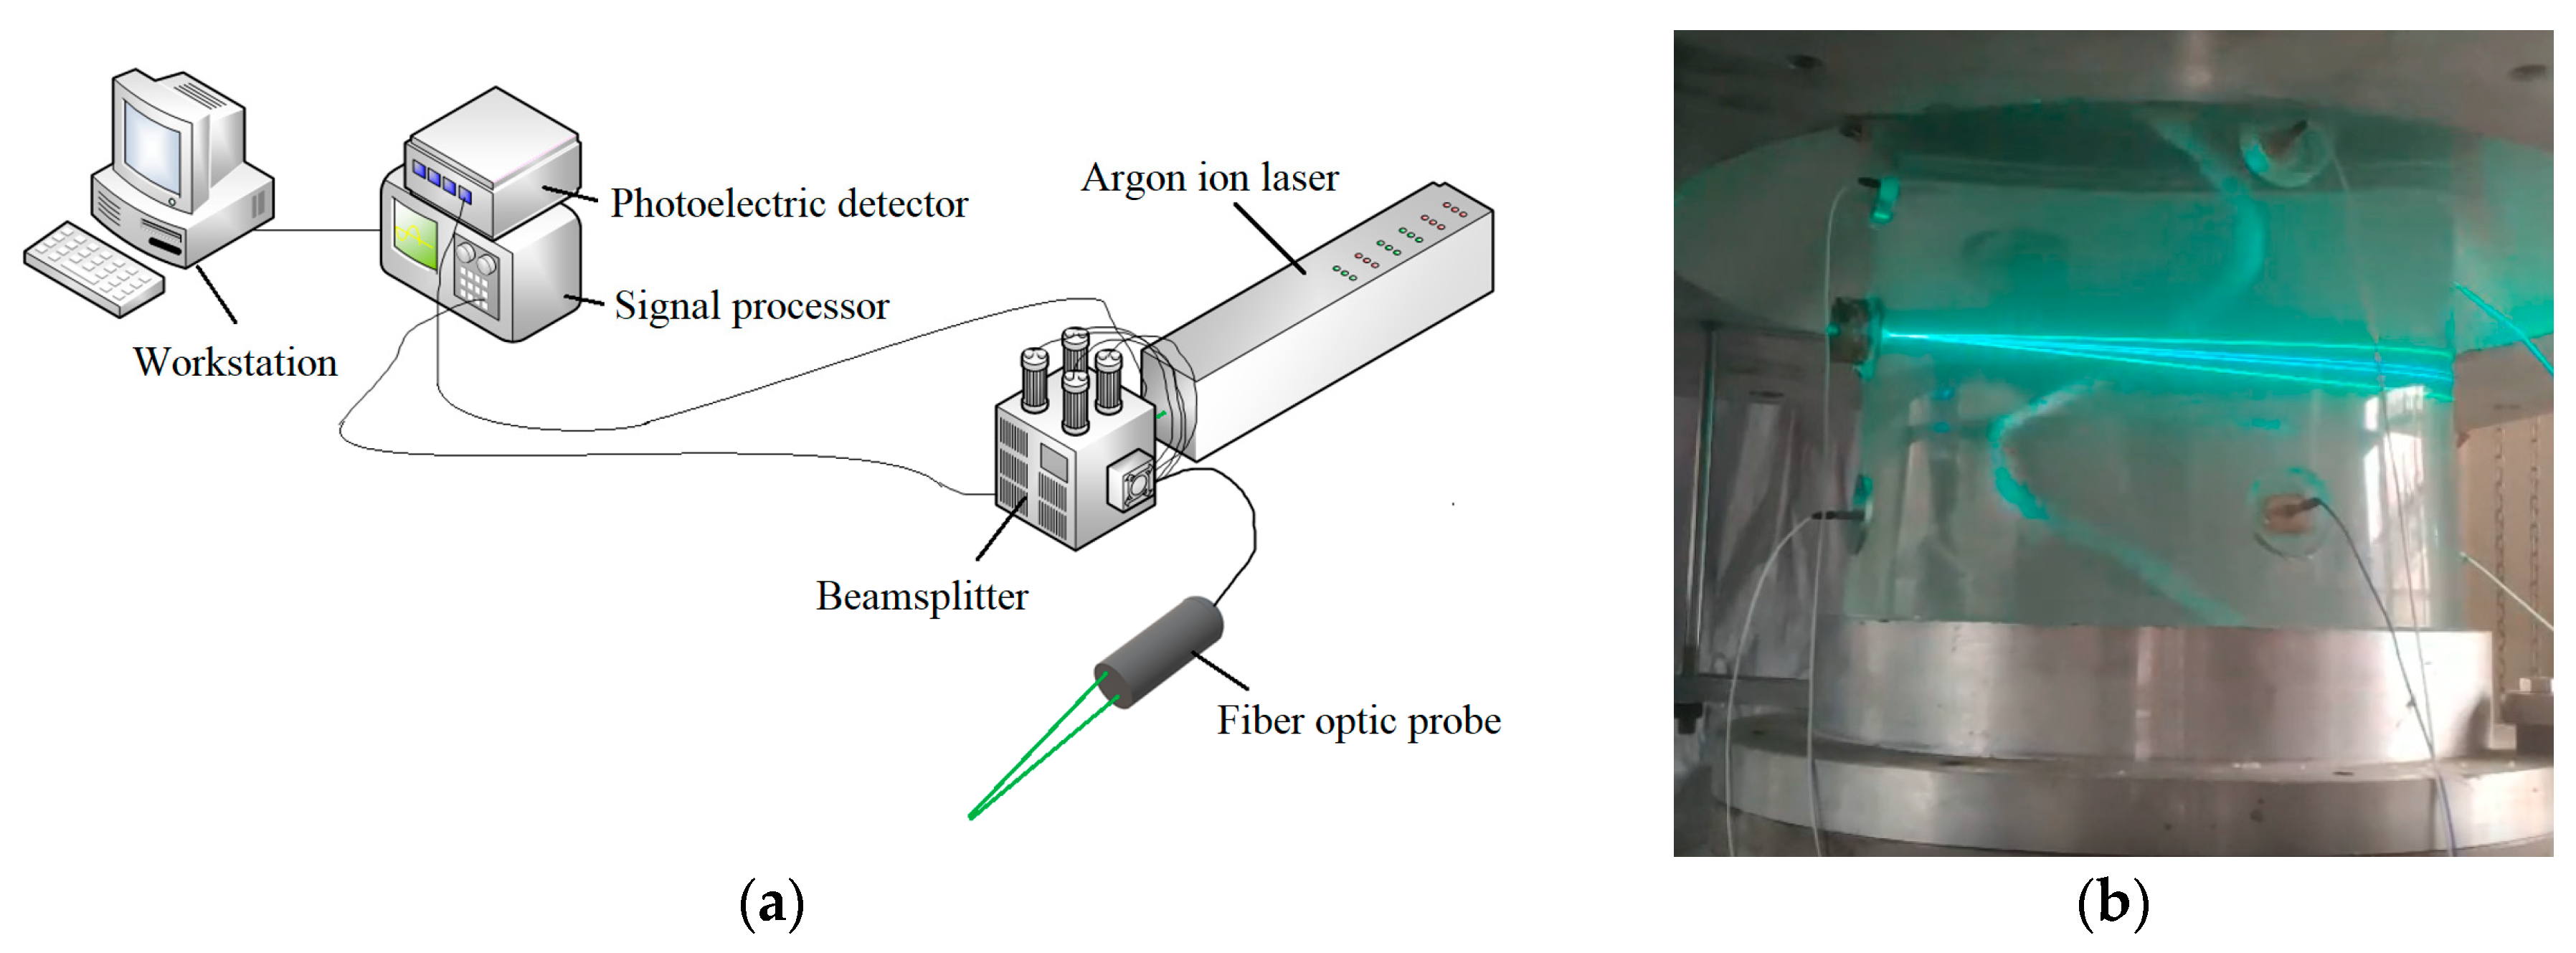
3.1. Test Rig
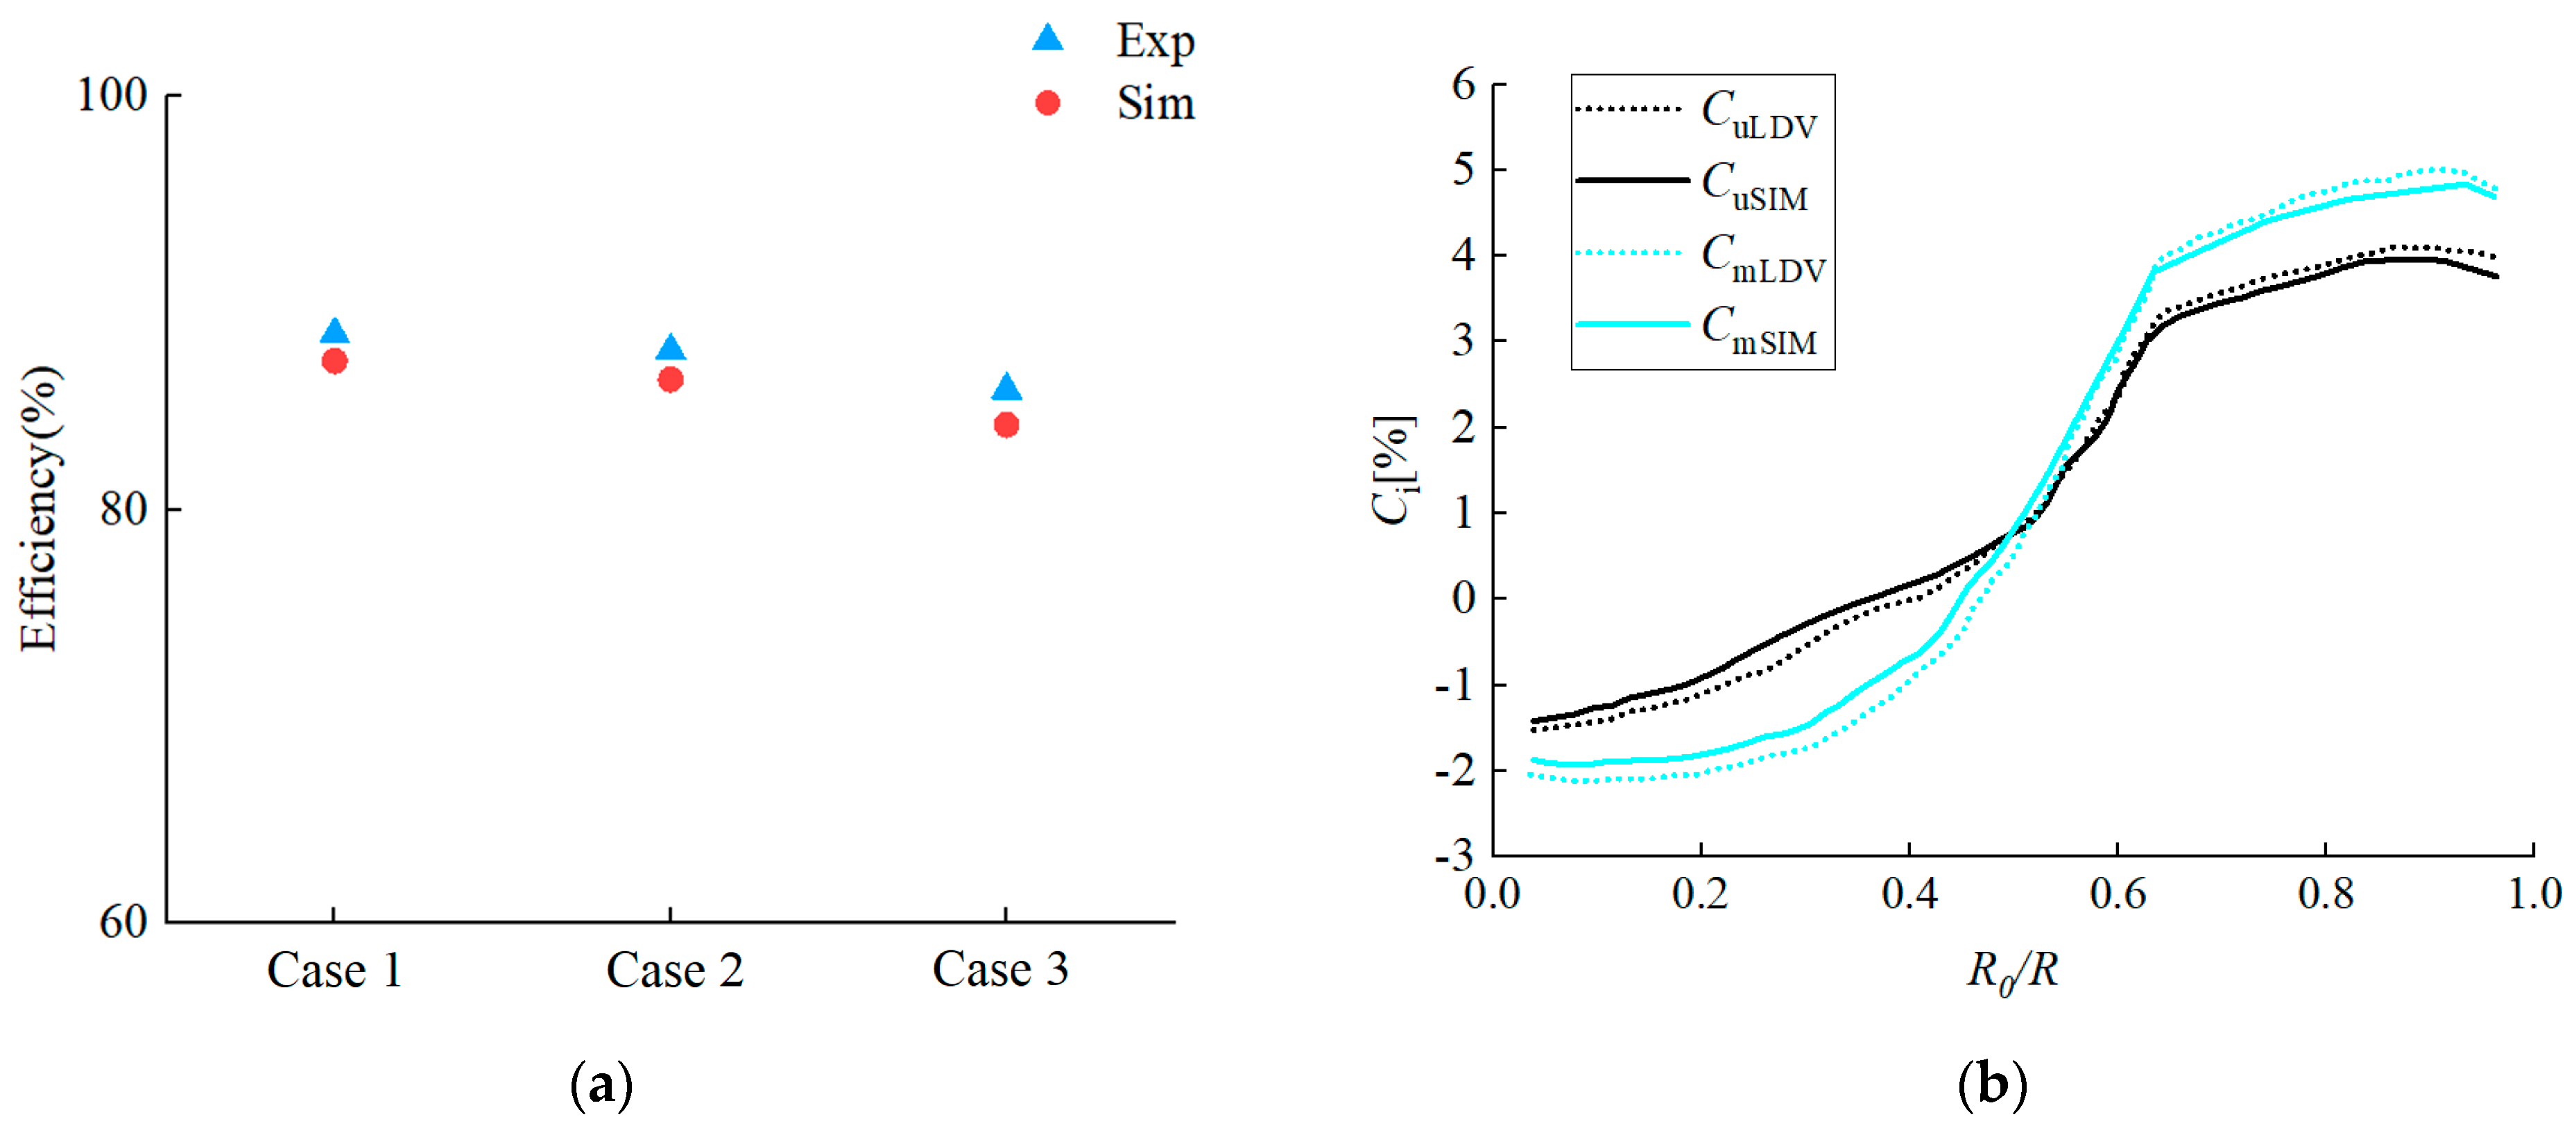
3.2. Computational Validation
4. Results and Analysis
4.1. Total Energy Loss
4.2. Analysis of Flow Characteristics in Inlet Components
4.3. Analysis of the Flow Characteristics in RN
4.4. Analysis of the Flow Characteristics in DT
5. Conclusions
- (1)
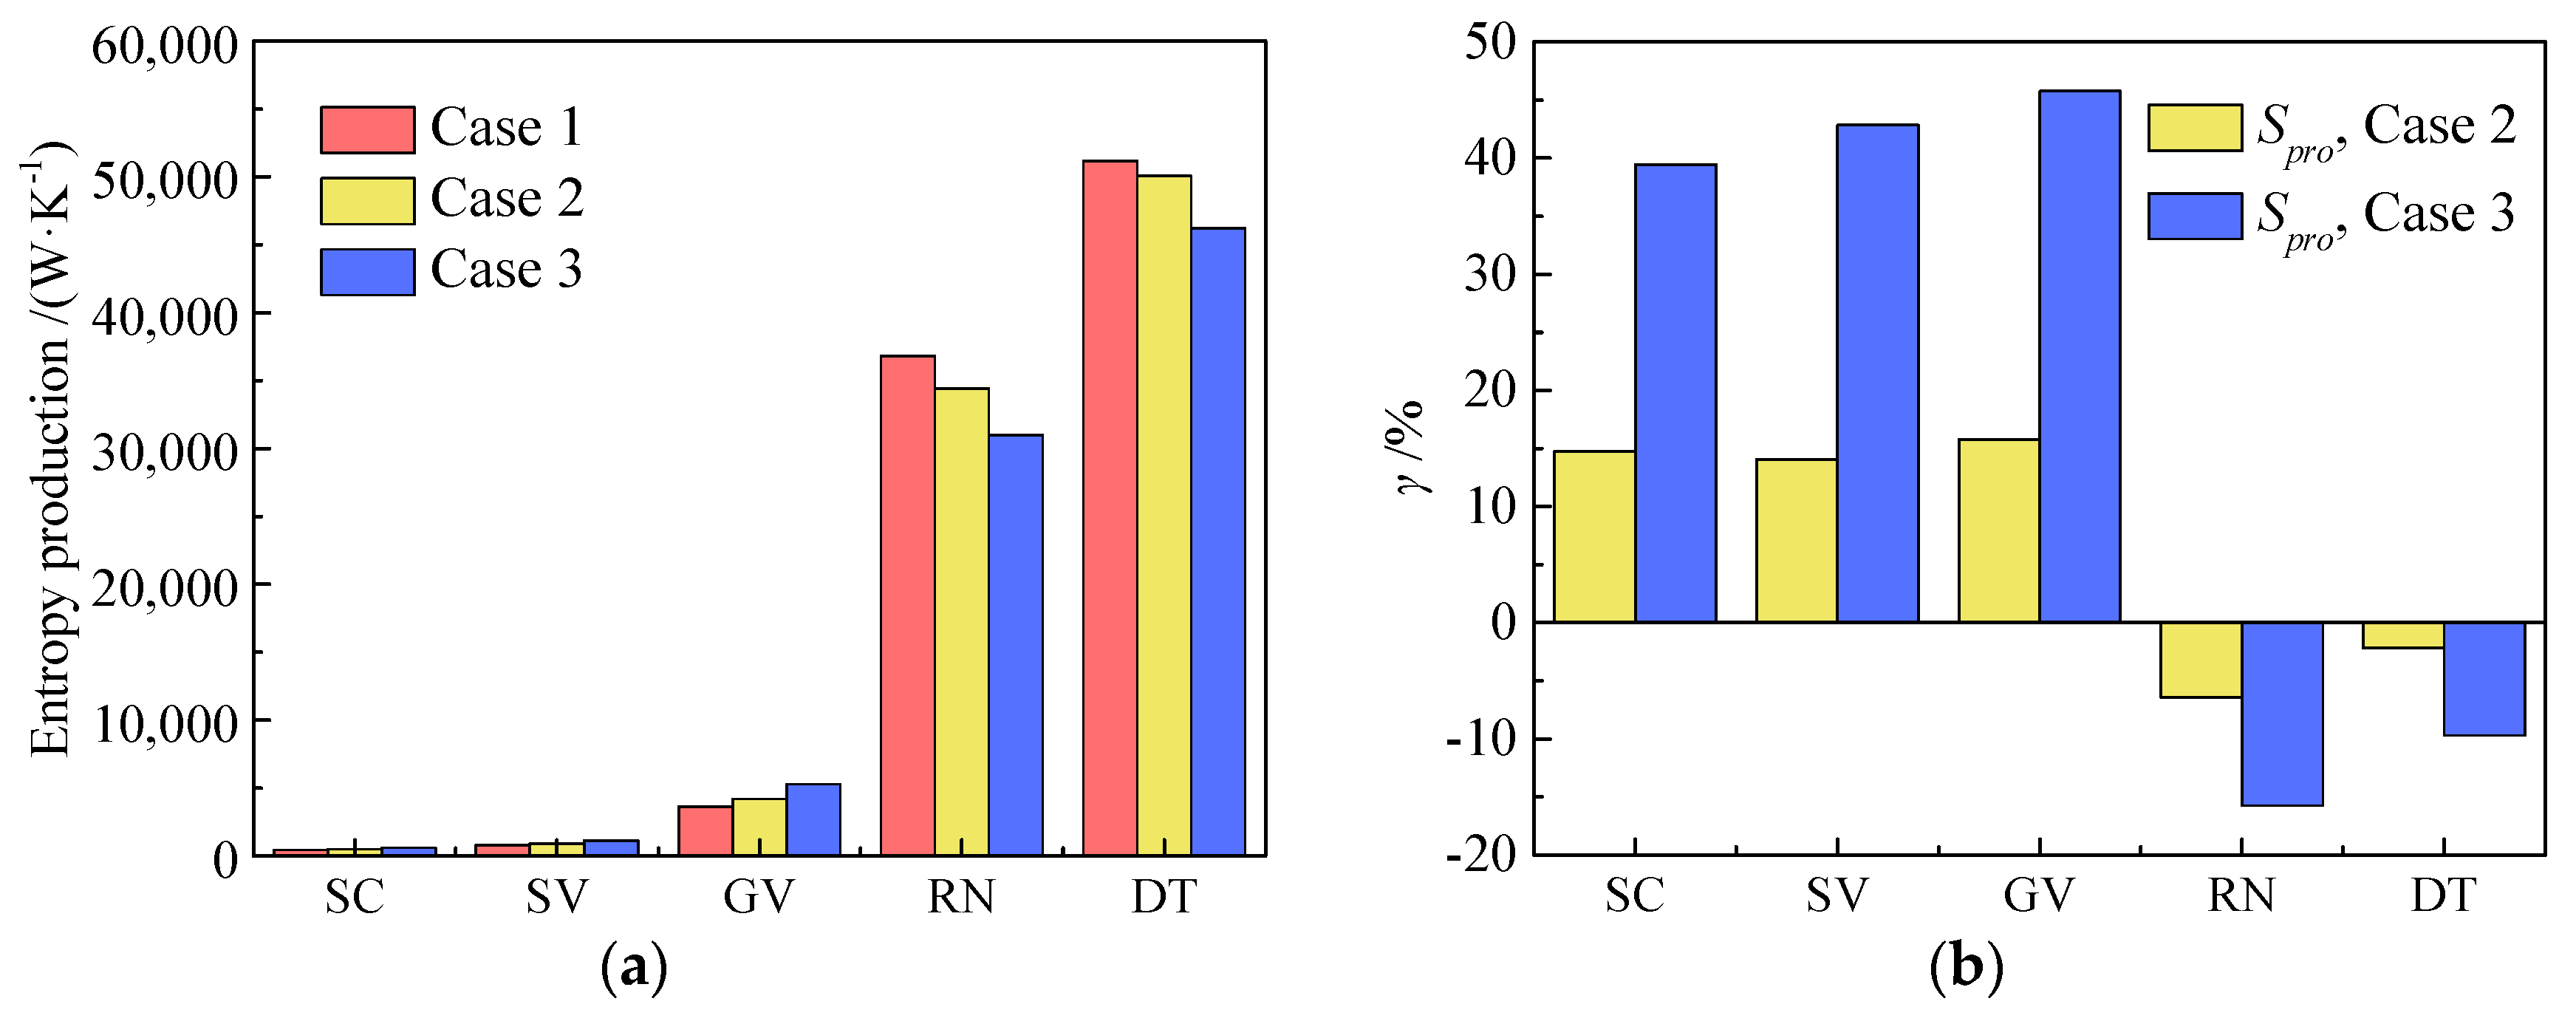
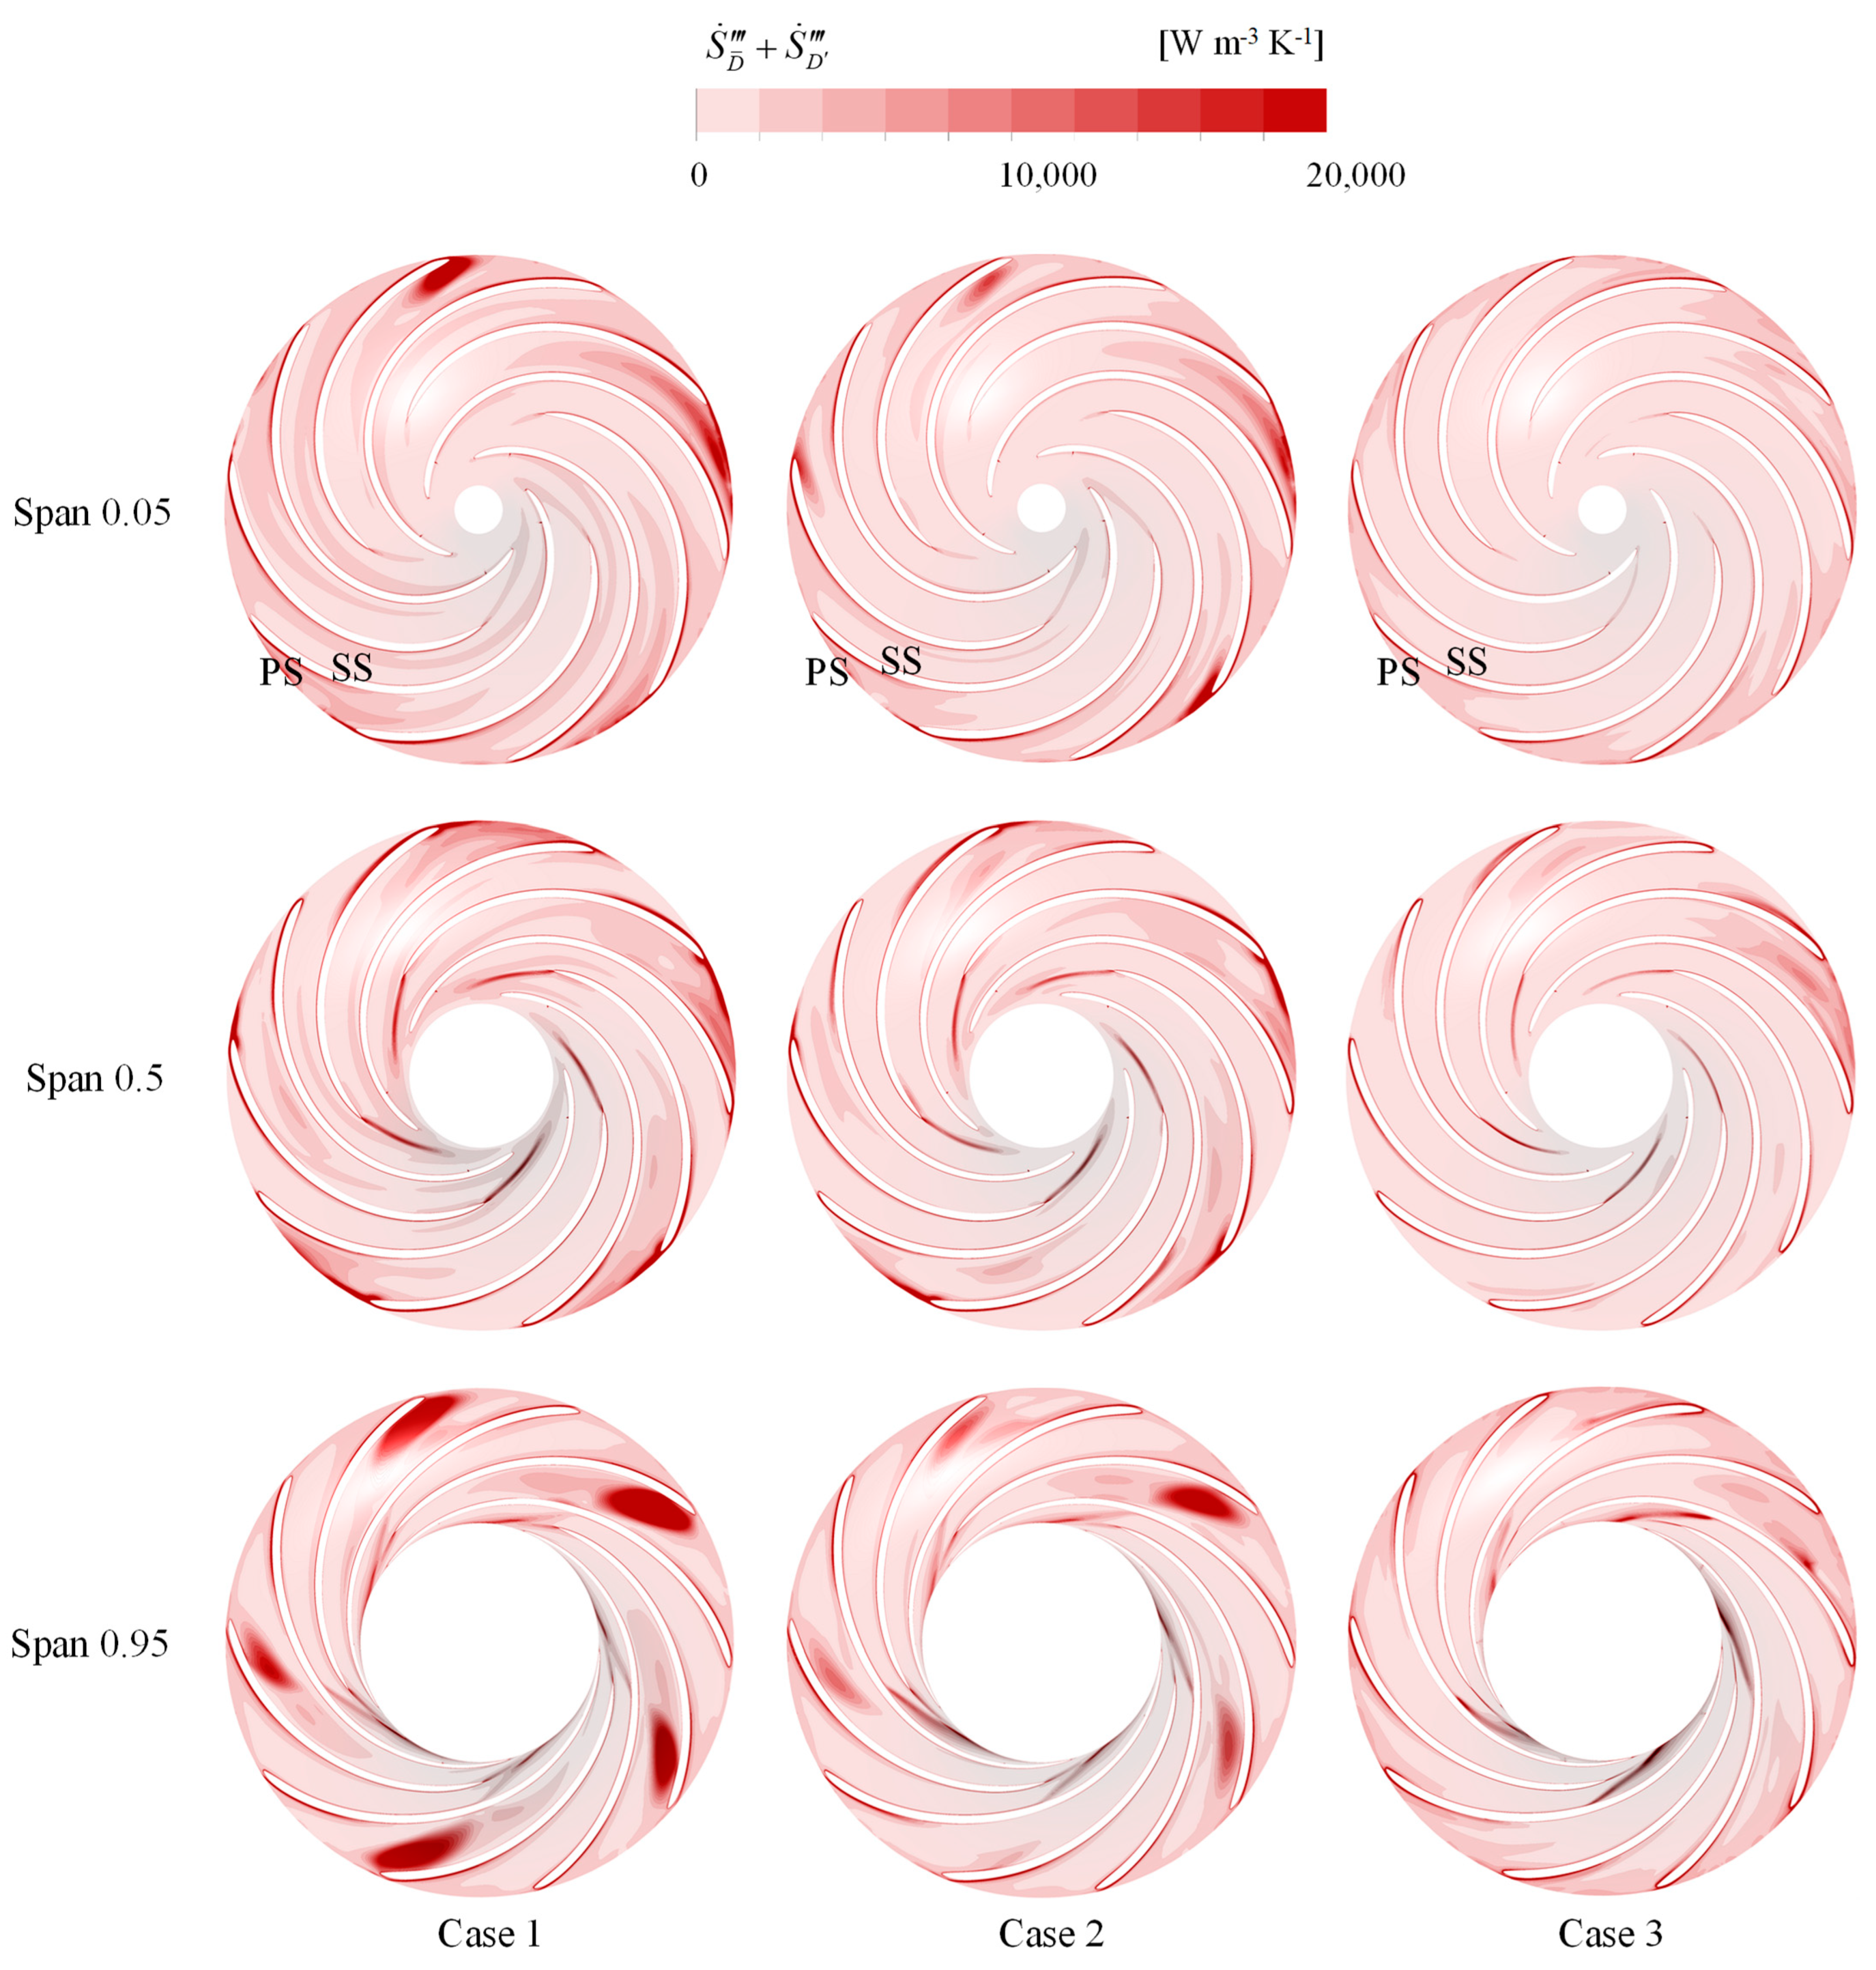
- Among the three terms of entropy production, EPTD dominates, accounting for over 98% of the TEP. Within the five flow components, RN and DT play a dominant role, and TEP increases significantly along the flow direction. In all three cases, the growth rate of TEP decreases with increasing head, suggesting that the high-efficiency region of the turbine is at high-head operating conditions.
- (2)
- In the inlet components, the presence of a large velocity gradient at the trailing edge of the GV leads to a significant EPR. Furthermore, under high head conditions, the higher flow rate increases the velocity in the GV area, increasing the velocity gradient at the trailing edge and causing more energy loss. The average energy loss growth rate of inlet components in case 2 and case 3 are 14.87% and 42.69%, respectively.
- (3)
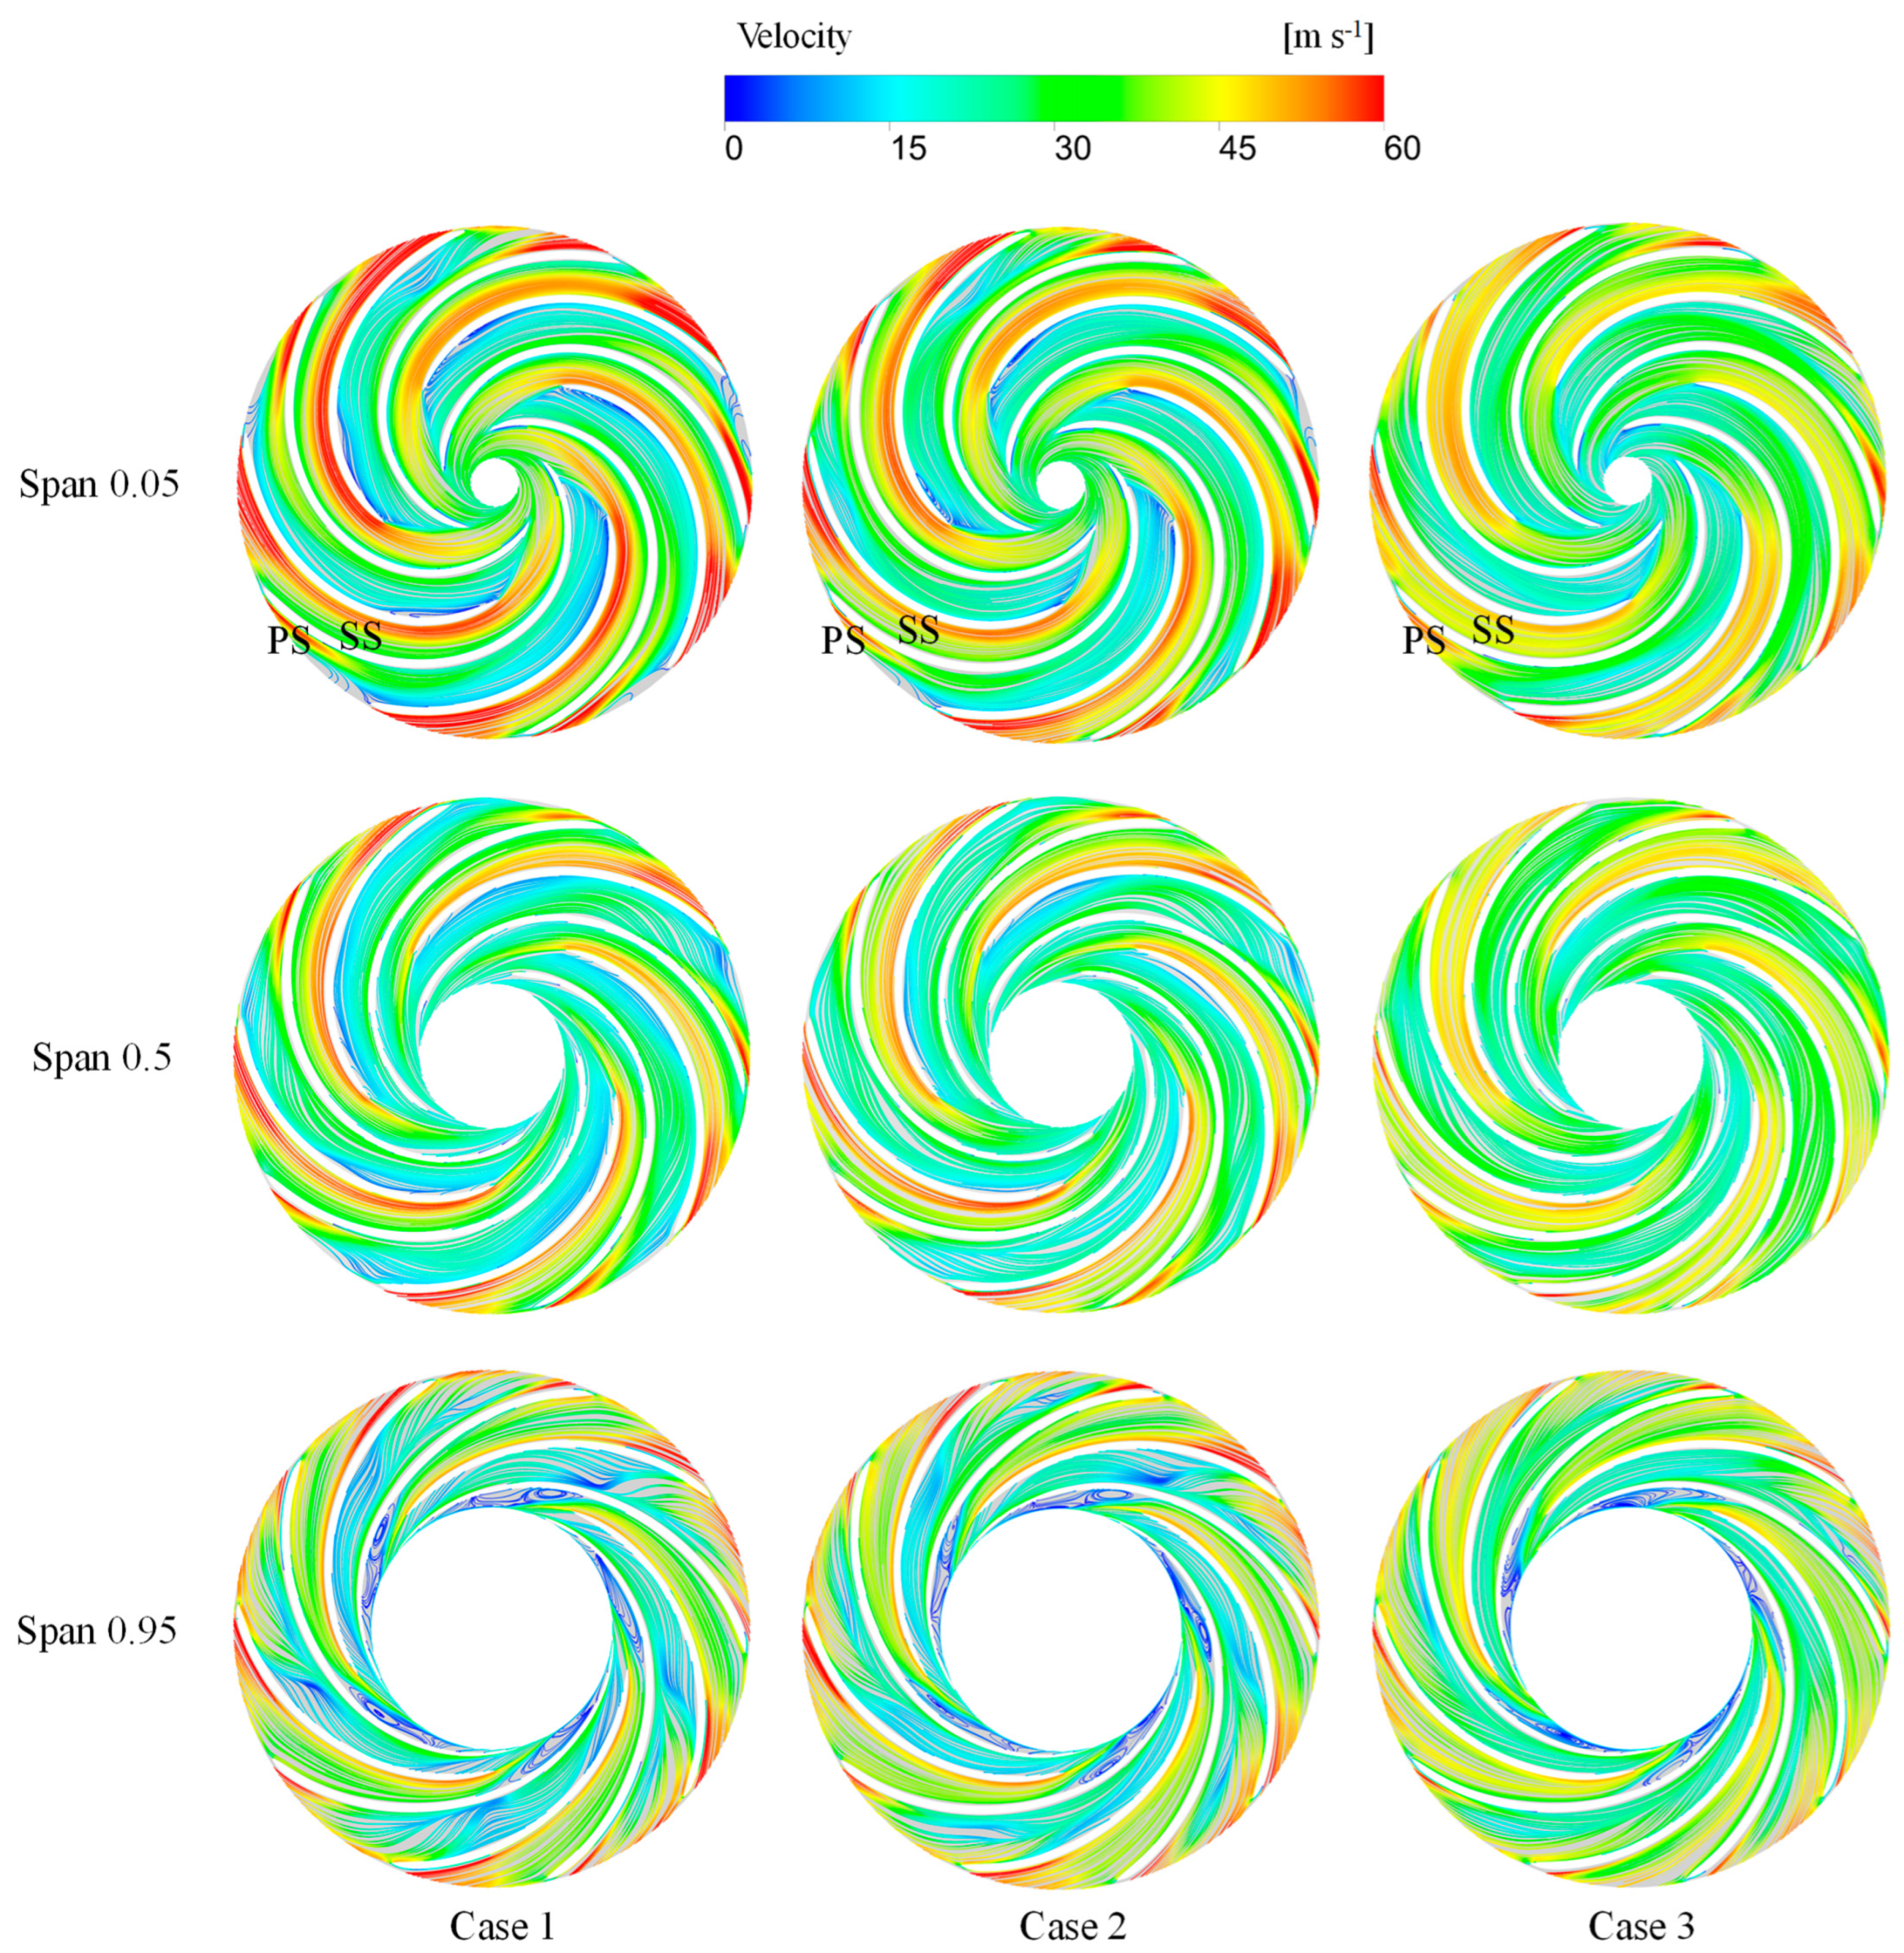
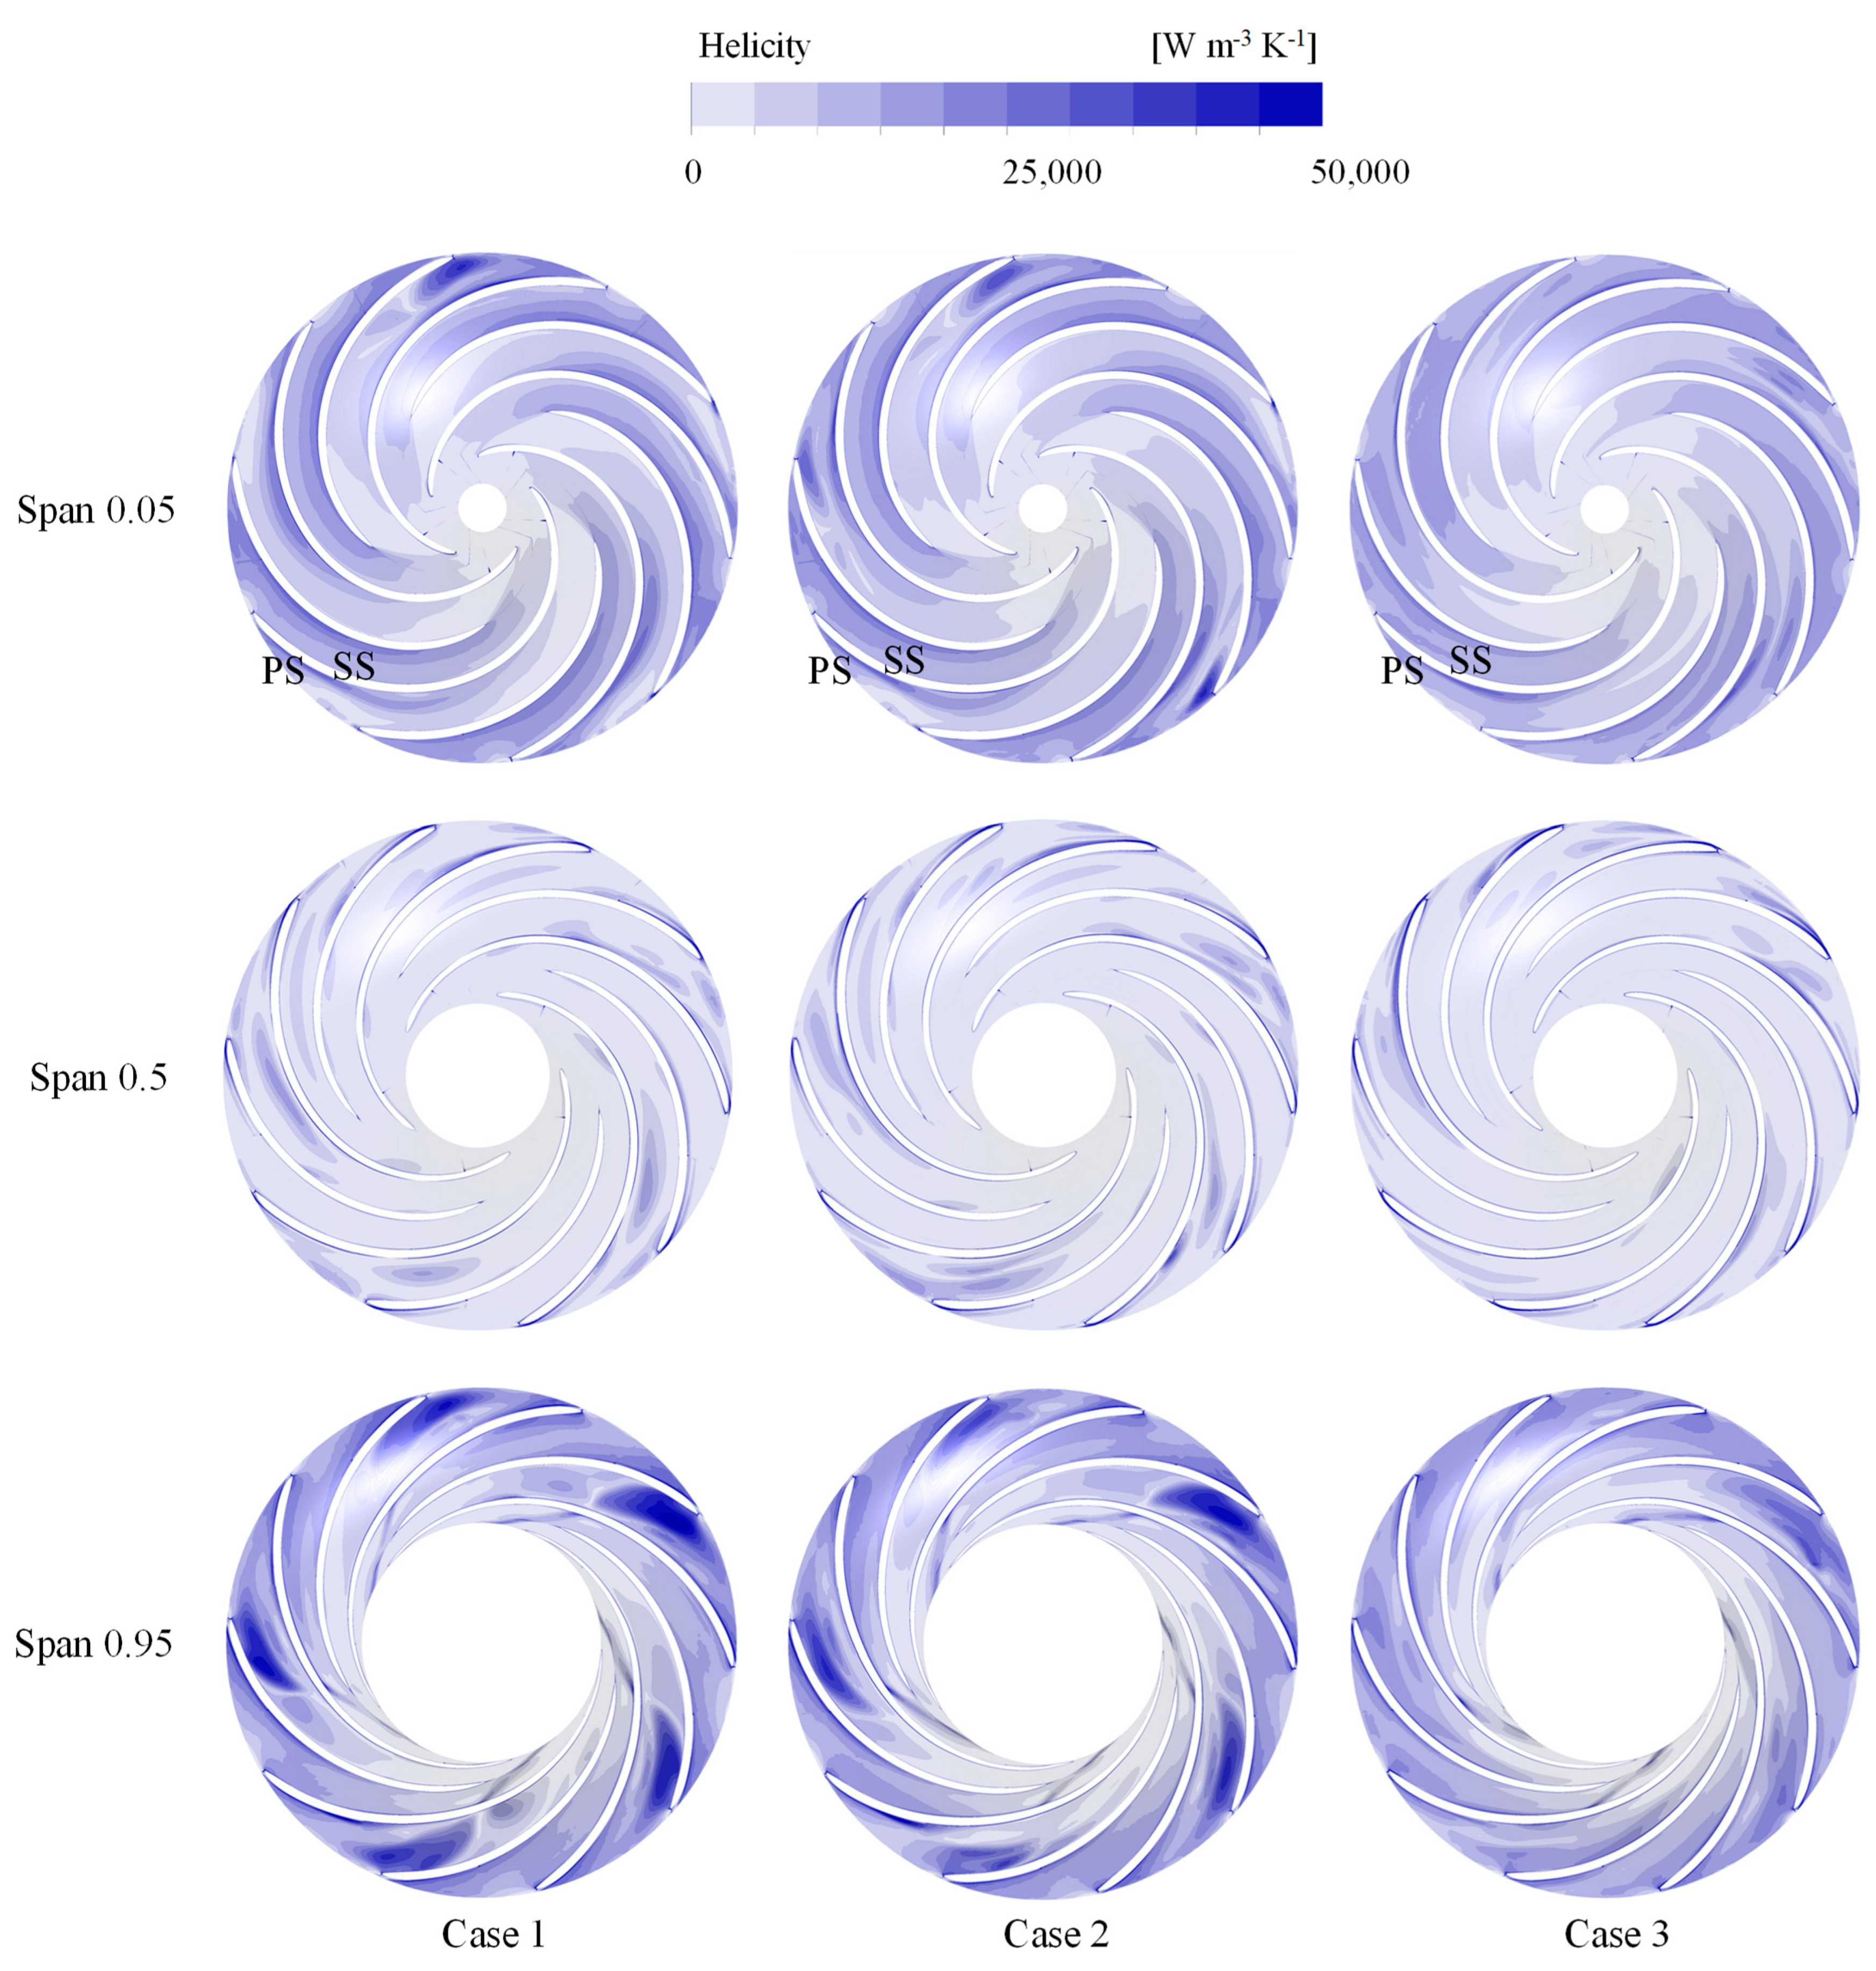
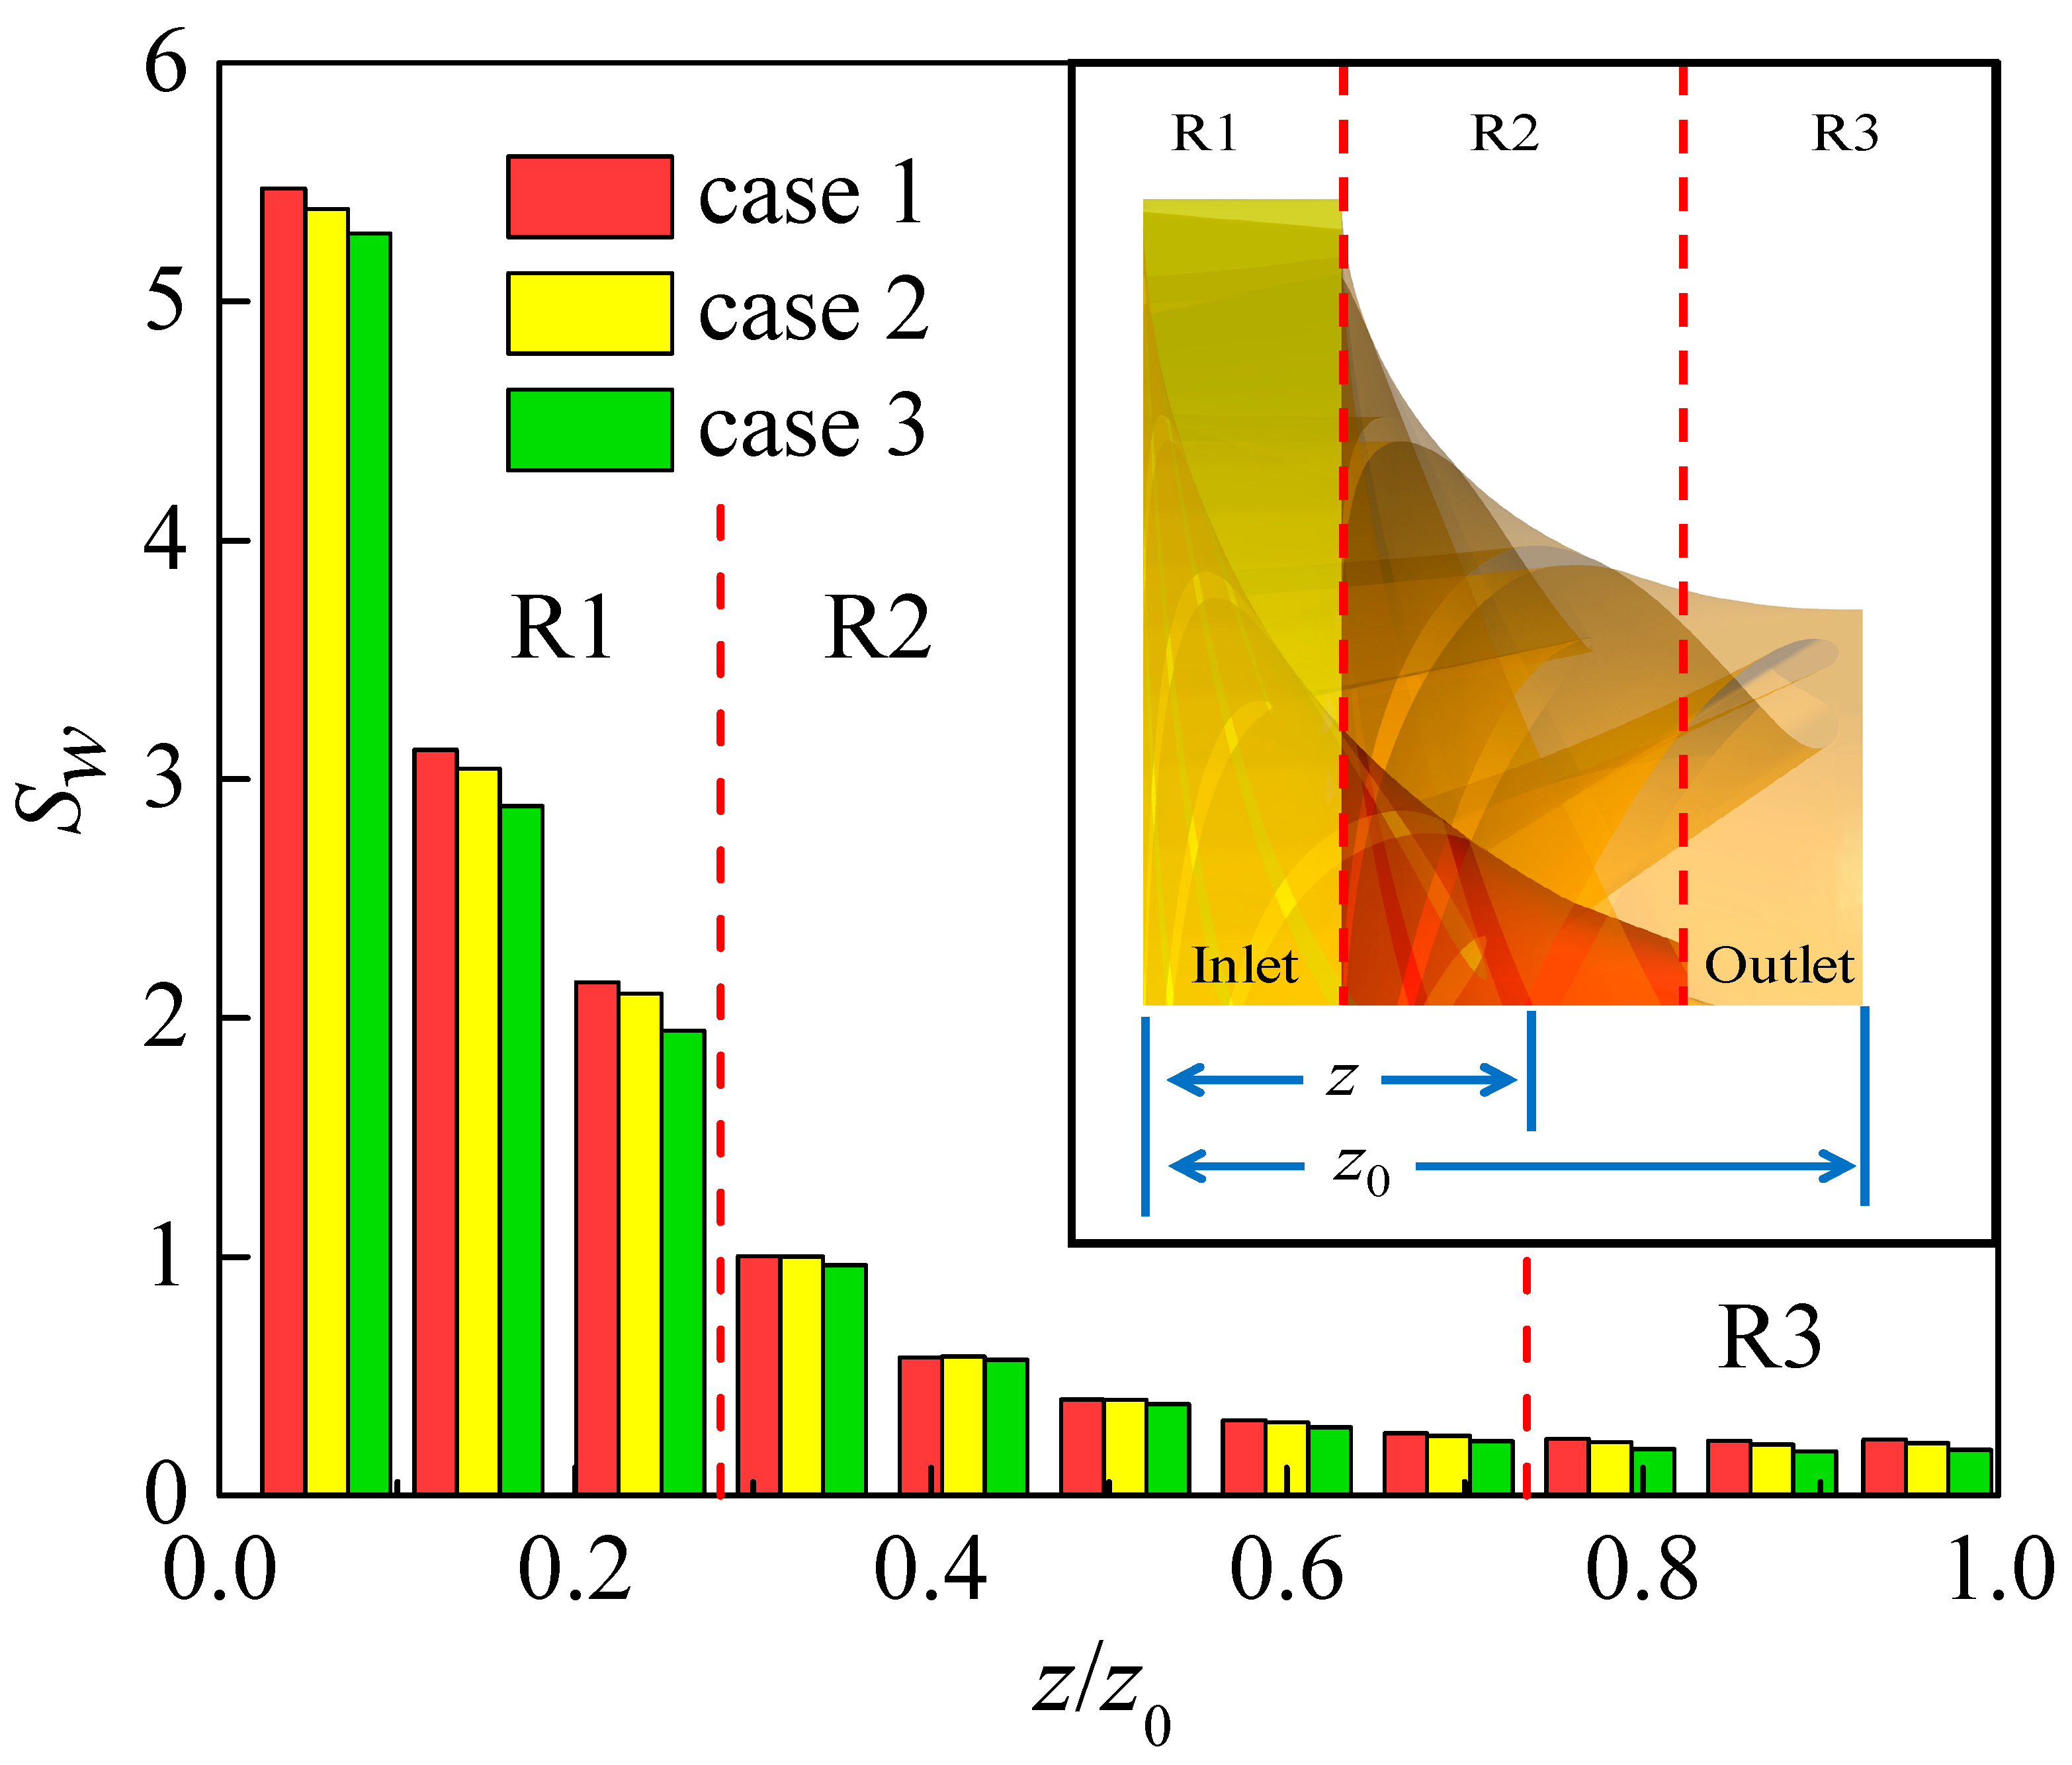
- In the RN domain, at spans of 0.05 and 0.95, the high spiralization and high EPR are observed at the leading edge of the splitter on SS where the flow direction deviates from the center line of the blade profile. This deviation, together with the high flow velocity, leads to significant spiraling and significant energy losses. At span = 0.5, the high EPR and high flow velocity are observed at the trailing edge of the splitter, with no appreciable spiralization occurring. This indicates that the energy loss in this region is mainly due to the large velocity gradient and not to the presence of vortices. In the RN domain, the Sw value continues to decrease along the axial direction, indicating that the water kinetic energy is continuously converted into the rotational mechanical energy of the RN. Especially in the R3 domain, the average Sw values of the three cases are 0.23, 0.22, and 0.19, respectively.
- (4)
- In Case 1, the region close to the wall in the inflow section of the DT exhibits a high tangential velocity, which leads to significant spiralization. Additionally, the central region of the inflow section with large velocity gradients generates higher TKE and EPR. Case 3 shows significantly lower TKE and EPR values compared to Case 1, indicating that the improved flow properties in the RN domain reduce turbulence and energy losses in the DT.
Author Contributions
Funding
Data Availability Statement
Acknowledgments
Conflicts of Interest
References
- Kan, K.; Binama, M.; Chen, H.; Zheng, Y.; Zhou, D.; Su, W.; Muhirwa, A. Pump as turbine cavitation performance for both conventional and reverse operating modes: A review. Renew. Sustain. Energy Rev. 2022, 168, 112786. [Google Scholar] [CrossRef]
- Mahfoud, R.J.; Alkayem, N.F.; Zhang, Y.; Zheng, Y.; Sun, Y.; Alhelou, H.H. Optimal Operation of Pumped Hydro Storage-Based Energy Systems: A Compendium of Current Challenges and Future Perspectives. Renew. Sustain. Energy Rev. 2023, 178, 113267. [Google Scholar] [CrossRef]
- Xu, L.; Liu, D.; Li, Z.; Zhao, X.; Liu, X. Experimental and Numerical Simulation Research on Flow Characteristics of Model Pump-Turbine in Four-Quadrant Operating Quadrants. J. Energy Storage 2022, 54, 105083. [Google Scholar] [CrossRef]
- Li, W.; Li, Z.; Han, W.; Li, Y.; Yan, S.; Zhao, Q.; Gu, Z. Pumping-Velocity Variation Mechanisms of a Ferrofluid Micropump and Structural Optimization for Reflow Inhibition. Phys. Fluids 2023, 35, 052005. [Google Scholar] [CrossRef]
- Kan, K.; Chen, H.; Zheng, Y.; Zhou, D.; Binama, M.; Dai, J. Transient Characteristics during Power-off Process in a Shaft Extension Tubular Pump by Using a Suitable Numerical Model. Renew. Energy 2021, 164, 109–121. [Google Scholar] [CrossRef]
- Li, W.; Li, Z.; Han, W.; Li, Y.; Yan, S.; Zhao, Q.; Chen, F. Measured Viscosity Characteristics of Fe3O4 Ferrofluid in Magnetic and Thermal Fields. Phys. Fluids 2023, 35, 012002. [Google Scholar] [CrossRef]
- Kan, K.; Zhang, Q.; Xu, Z.; Zheng, Y.; Gao, Q.; Shen, L. Energy Loss Mechanism Due to Tip Leakage Flow of Axial Flow Pump as Turbine under Various Operating Conditions. Energy 2022, 255, 124532. [Google Scholar] [CrossRef]
- Jia, X.; Lv, H.; Zhu, Z. Research on The Influence of Impeller Tip Clearance on The Internal Flow Loss of Axial Circulating Pump under Unpowered Driven Condition. ASME J. Fluids Eng. 2022, 145, 021202. [Google Scholar] [CrossRef]
- Xu, Z.; Liu, X.; Xu, X.; Li, Y.; Zheng, Y.; Zhong, Z.; Wan, J.; Dai, Q. Similarity of pressure pulsation between prototype and model pumps. J. Drain. Irrig. Mach. Eng. 2023, 41, 224–230. (In Chinese) [Google Scholar]
- Li, W.; Li, Z.; Qin, Z.; Yan, S.; Wang, Z.; Peng, S. Influence of the Solution PH on the Design of a Hydro-Mechanical Magneto-Hydraulic Sealing Device. Eng. Fail. Anal. 2022, 135, 106091. [Google Scholar] [CrossRef]
- Jia, X.; Lv, H.; Zhu, Z. Unsteady Flow Characteristics of an Axial Flow Pump Based on Energy Loss and Vortex Identification under Rotating Stall Condition. J. Process Mech. Eng. 2022. [Google Scholar] [CrossRef]
- Li, D.; Qin, Y.; Wang, J.; Zhu, Y.; Wang, H.; Wei, X. Optimization of blade high-pressure edge to reduce pressure fluctuations in pump-turbine hump region. Renew. Energy 2022, 181, 24–38. [Google Scholar] [CrossRef]
- Deng, W.; Xu, L.; Li, Z.; Tang, W.; Wang, X.; Shang, L.; Liu, D.; Liu, X. Stability Analysis of Vaneless Space in High-Head Pump-Turbine under Turbine Mode: Computational Fluid Dynamics Simulation and Particle Imaging Velocimetry Measurement. Machines 2022, 10, 143. [Google Scholar] [CrossRef]
- Lai, X.-D.; Liang, Q.-W.; Ye, D.-X.; Chen, X.-M.; Xia, M.-M. Experimental Investigation of Flows inside Draft Tube of a High-Head Pump-Turbine. Renew. Energy 2019, 133, 731–742. [Google Scholar] [CrossRef]
- Lai, X.; Chen, X.; Liang, Q.; Ye, D.; Gou, Q.; Wang, R.; Yan, Y. Experimental and Numerical Investigation of Vortex Flows and Pressure Fluctuations in a High-Head Pump-Turbine. Renew. Energy 2023, 211, 236–247. [Google Scholar] [CrossRef]
- Zhou, L.; Hang, J.; Bai, L.; Krzemianowski, Z.; El-Emam, M.A.; Yasser, E.; Agarwal, R. Application of Entropy Production Theory for Energy Losses and Other Investigation in Pumps and Turbines: A Review. Appl. Energy 2022, 318, 119211. [Google Scholar] [CrossRef]
- Qin, Y.; Li, D.; Wang, H.; Liu, Z.; Wei, X.; Wang, X. Investigation on Hydraulic Loss Component and Distribution in Hydraulic Machinery: A Case Study of Pump-Turbine in Pump Mode. J. Energy Storage 2022, 52, 104932. [Google Scholar] [CrossRef]
- Yan, X.; Kan, K.; Zheng, Y.; Chen, H.; Binama, M. Entropy Production Evaluation within a Prototype Pump-Turbine Operated in Pump Mode for a Wide Range of Flow Conditions. Processes 2022, 10, 2058. [Google Scholar] [CrossRef]
- Li, D.; Gong, R.; Wang, H.; Xiang, G.; Wei, X.; Qin, D. Entropy Production Analysis for Hump Characteristics of a Pump Turbine Model. Chin. J. Mech. Eng. 2016, 29, 803–812. [Google Scholar] [CrossRef]
- Liu, D.; Xu, W.; Zhao, Y. Experimental Study of the Flow Field of a High Head Model Pump Turbine Based on PIV Technique. J. Hydrodyn. 2021, 33, 1045–1055. [Google Scholar] [CrossRef]
- Xu, L.; Jin, X.; Li, Z.; Deng, W.; Liu, D.; Liu, X. Particle Image Velocimetry Test for the Inter-Blade Vortex in a Francis Turbine. Processes 2021, 9, 1968. [Google Scholar] [CrossRef]
- Deng, W.; Li, Z.; Ji, L.; Shang, L.; Liu, D.; Liu, X. Laser Doppler Velocimetry Test of Flow Characteristics in Draft Tube of Model Pump Turbine. Processes 2022, 10, 1323. [Google Scholar] [CrossRef]
- Ji, L.; Xu, L.; Peng, Y.; Zhao, X.; Li, Z.; Tang, W.; Liu, D.; Liu, X. Experimental and Numerical Simulation Study on the Flow Characteristics of the Draft Tube in Francis Turbine. Machines 2022, 10, 230. [Google Scholar] [CrossRef]
- Han, Y.; Tan, L. Experimental investigation on spatial-temporal evolution of tip leakage cavitation in a mixed flow pump with tip clearance. Int. J. Multiph. Flow 2023, 164, 104445. [Google Scholar] [CrossRef]
- Kan, K.; Xu, Z.; Chen, H.; Xu, H.; Zheng, Y.; Zhou, D.; Muhirwa, A.; Maxime, B. Energy Loss Mechanisms of Transition from Pump Mode to Turbine Mode of an Axial-Flow Pump under Bidirectional Conditions. Energy 2022, 257, 124630. [Google Scholar] [CrossRef]
- Menter, F.R. Two-Equation Eddy-Viscosity Transport Turbulence Model for Engineering Applications. AIAA J. 1994, 32, 1598–1605. [Google Scholar] [CrossRef]
- Chen, G.; Gu, C.; Hajaiej, H.; Morris, P.J.; Paterson, E.G.; Sergeev, A. OpenFOAM computation of interacting wind turbine flows and control (I): Free rotating case. Int. J. Hydromechatron. 2021, 4, 1–26. [Google Scholar] [CrossRef]
- Ciappi, L.; Stebel, M.; Smolka, J.; Cappietti, L.; Manfrida, G. Analytical and Computational Fluid Dynamics Models of Wells Turbines for Oscillating Water Column Systems. J. Energy Resour. Technol. 2021, 144, 050903. [Google Scholar] [CrossRef]
- Xu, Z.; Zheng, Y.; Kan, K.; Chen, H. Flow Instability and Energy Performance of a Coastal Axial-Flow Pump as Turbine under the Influence of Upstream Waves. Energy 2023, 272, 127121. [Google Scholar] [CrossRef]
- Ji, L.; Li, W.; Shi, W.; Tian, F.; Agarwal, R. Effect of blade thickness on rotating stall of mixed-flow pump using entropy generation analysis. Energy 2021, 236, 121381. [Google Scholar] [CrossRef]
- Kan, K.; Yang, Z.; Lyu, P.; Zheng, Y.; Shen, L. Numerical Study of Turbulent Flow Past a Rotating Axial-Flow Pump Based on a Level-Set Immersed Boundary Method. Renew. Energy 2021, 168, 960–971. [Google Scholar] [CrossRef]
- Li, J.; Sui, T.; Dong, X.; Gu, F.; Su, N.; Liu, J.; Xu, C. Large eddy simulation studies of two-phase flow characteristics in the abrasive flow machining of complex flow ways with a cross-section of cycloidal lobes. Int. J. Hydromechatron. 2022, 5, 136–166. [Google Scholar] [CrossRef]
- Morris, C.E.; O’Doherty, D.M.; Mason-Jones, A.; O’Doherty, T. Evaluation of the swirl characteristics of a tidal stream turbine wake. Int. J. Mar. Energy 2016, 14, 198–214. [Google Scholar] [CrossRef]







| Domain | Parameter | Variable/Unit | Value |
|---|---|---|---|
| RN | Blades | Zb | 5 |
| Splitters | Zs | 5 | |
| GV | Guide vanes | ZG | 16 |
| Spiral casing (SC) | Wrap angle | Φ/(°) | 360 |
| Stay Vane (SV) | Stay vanes | ZS | 16 |
| Domain | Grid Type | Number of Grid Cells | y+ |
|---|---|---|---|
| RN | Hexahedral | 3,011,474 | <15 |
| GV | Tetrahedral | 2,988,878 | <20 |
| SV | Hexahedral | 1,699,875 | <30 |
| DT | Hexahedral | 1,665,874 | <30 |
| SC | Hexahedral | 1,856,253 | <50 |
| Total | / | 11,222,354 | / |
| Parameters | φ1 | φ2 | φ3 | FS | GCI | |
|---|---|---|---|---|---|---|
| Q | 381.75 | 381.25 | 378.35 | 1.2 | 10.78 | 1.55% |
| Efficiency | 87.3 | 87.2 | 86.9 | 1.2 | 3.89 | 1.35% |
| Case | H (m) | GVO (°) | n (rev/min) | Q (m3/s) | N (MW) | η (%) | Δh (m) |
|---|---|---|---|---|---|---|---|
| Case 1 | 580 | 10 | 500 | 36.6 | 180.2 | 86.69 | 77.20 |
| Case 2 | 600 | 10 | 500 | 38.4 | 198.9 | 88.10 | 71.40 |
| Case 3 | 640 | 10 | 500 | 41.3 | 233.9 | 90.30 | 62.08 |
| Parameters | Value |
|---|---|
| Maximum test flow rate (m³/s) | 1.5 |
| Maximum test head (m) | 150 |
| Maximum test speed (r/min) | 2500 |
| Model RN diameter (mm) | 250–500 |
| Dynamometer maximum power (kW) | 500 |
| Rated power of pump motor (kW) | 2 × 850 |
| DT pressure (kPa) | –85 to +250 |
| Uncertainty of efficiency measurements | ≤±0.25% |
| Model type | Reaction turbine |
| Parameters | Value |
|---|---|
| Speed range | –150–1000 m/s |
| Measurement error | 0.1% |
| Sample frequency | 400–800 MHZ |
| Maximum processing frequency | 175 MHz |
| Minimum processing frequency | 300 Hz |
| Bits | 8 |
Disclaimer/Publisher’s Note: The statements, opinions and data contained in all publications are solely those of the individual author(s) and contributor(s) and not of MDPI and/or the editor(s). MDPI and/or the editor(s) disclaim responsibility for any injury to people or property resulting from any ideas, methods, instructions or products referred to in the content. |
© 2023 by the authors. Licensee MDPI, Basel, Switzerland. This article is an open access article distributed under the terms and conditions of the Creative Commons Attribution (CC BY) license (https://creativecommons.org/licenses/by/4.0/).
Share and Cite
Gui, Z.; Xu, Z.; Li, D.; Zhang, F.; Zhao, Y.; Xu, L.; Zheng, Y.; Kan, K. Analysis of the Energy Loss Mechanism of Pump-Turbines with Splitter Blades under Different Characteristic Heads. Water 2023, 15, 2776. https://doi.org/10.3390/w15152776
Gui Z, Xu Z, Li D, Zhang F, Zhao Y, Xu L, Zheng Y, Kan K. Analysis of the Energy Loss Mechanism of Pump-Turbines with Splitter Blades under Different Characteristic Heads. Water. 2023; 15(15):2776. https://doi.org/10.3390/w15152776
Chicago/Turabian StyleGui, Zhonghua, Zhe Xu, Dongkuo Li, Fei Zhang, Yifeng Zhao, Lianchen Xu, Yuan Zheng, and Kan Kan. 2023. "Analysis of the Energy Loss Mechanism of Pump-Turbines with Splitter Blades under Different Characteristic Heads" Water 15, no. 15: 2776. https://doi.org/10.3390/w15152776
APA StyleGui, Z., Xu, Z., Li, D., Zhang, F., Zhao, Y., Xu, L., Zheng, Y., & Kan, K. (2023). Analysis of the Energy Loss Mechanism of Pump-Turbines with Splitter Blades under Different Characteristic Heads. Water, 15(15), 2776. https://doi.org/10.3390/w15152776


