Article

HYPER: Computer-Assisted Optimal Pump-as-Turbine (PAT) Selection for Microhydropower Generation and Pressure Regulation in a Water Distribution Network (WDN)

Department of Engineering, University of Sannio, 82100 Benevento, Italy
*
Author to whom correspondence should be addressed.
Water 2023, 15(15), 2807; https://doi.org/10.3390/w15152807
Submission received: 15 June 2023 / Revised: 27 July 2023 / Accepted: 1 August 2023 / Published: 3 August 2023
(This article belongs to the Special Issue Integrated Management of Water Distribution Systems)

Abstract

:
Although pressure reducing valves (PRVs) have traditionally been employed to regulate pressure and reducer water leakage, researchers have been increasingly investigating the strategy of micro-hydropower generation using pumps as turbines (PATs) to enable both pressure reduction and energy production as an alternative strategy in water distribution networks (WDNs). However, due to the continuous variability of flow discharge during the day, selecting the optimal PAT remains a challenging issue. To address this, the authors have developed HYPER, a freely available software app that implements an innovative approach for selecting the most suitable PAT in systems that involve both hydraulic and/or electrical regulation. In enabling the identification of the PAT parameters that maximize energy production, HYPER thus provides a fast and effective PAT selection tool. The effectiveness of the proposed approach was further demonstrated with application to a real WDN. Four operational patterns varying in terms of available flow and head drop were considered, showing that the most efficient pumps consistently tended to be located in close proximity to the maximum produced energy. Furthermore, the results confirmed that hydraulic regulation and coupled hydraulic/electric regulation-based installation layouts represent the best solutions in terms of energy produced. The solely electrical regulation option, given its poor flexibility, returns in all cases lower energy production with the lower adaptability of commercial pumps.

1. Introduction

In recent years, a goal for many researchers has been to seek solutions for increasing electricity production from renewable sources. To this end, coupling leakage reduction with hydropower generation in WDNs [1,2] by replacing pressure reducing valves (PRV’s) with turbines or centrifugal pumps operating in reverse mode (i.e., pumps as turbines, PATs), thus enables the recovery of energy that would otherwise dissipate [3,4]. Using PATs, which are mass-produced and easily available for a wide range of heads and flows in a large number of standard sizes, offers many advantages over conventional turbines, including short delivery times, ease of installation, and maintenance at lower costs [5]. Unlike water supply systems, however, where hydropower generation is a fairly common application, the variability in flow discharge and pressure makes the installation of PATs in WDNs fairly challenging. Moreover, deciding whether to select PATs or turbines is strongly influenced by the flow pattern and the available head [6]. In the case of PATs, since pump manufacturers usually do not provide the characteristic curve for the reverse mode operation, computational fluid dynamics (CFD) models [7] as well as experimental or theoretical models available in the literature [8,9,10] are used.
Among the different methods available in the literature to maximize energy recovery and ensure pressure regulation in WDNs based on optimal PAT selection, Caravetta et al. [11] proposed the variable speed operation of PATs in parallel with PRVs, while Fontana et al. [6] selected the best PAT according to the flow pattern and available head. Lima et al. [12] used a metaheuristic algorithm in which both the energy recovery and leakage reduction are maximized, obtaining the best efficient point (BEP) of the PAT. Mitrovic et al. [13] proposed the conventional hydraulic regulation scheme utilizing the Nedler–Mead simplex direct search algorithm to explore the optimal solution within the constrained space defined by the available PATs on the market. Other authors proposed the PAT selection using the average flow and head drop in the WDN [14,15].
Notwithstanding the numerous existing methods, PAT selection in a WDN remains an open challenge for researchers, in response to which the authors have created a new computer software for selecting the optimal PAT in a WDN, namely HYPER. The software, freely distributed on the Internet, is able to identify the best PAT characteristics which maximize energy production and ensure adequate pressure regulation in a WDN from the available pattern of flow discharge and available head drop. In order to help network designers identify the optimal PAT characteristics, the software returns the recoverable energy in a dimensionless domain, thereby enabling fast and effective selection for three installation layouts.
The following sections briefly review the methodology, algorithms, and procedures, along with the findings of other relevant studies. The use of HYPER is then illustrated through the comparative analysis of a case study involving the model of a real WDN [16], analyzed by Fontana et al. [6], which demonstrates its effectiveness in helping designers select the optimal PAT. The optimal commercial PAT was identified from a manufacturer’s product list through a preliminary cost–benefit analysis based on computing the net present value (NPV) for each configuration. Additionally, the outcomes obtained from HYPER were validated through an economical sensitivity analysis by varying the investment and maintenance cost.

2. Materials and Methods

2.1. PAT Layout

The method seeks to identify the optimal characteristics of a PAT (i.e., flow rate ( Q T b ) and head drop ( H T b ) at the BEP) for three different installation layouts in a WDN (Figure 1), namely LAY1, LAY2, and LAY3.
For each layout, different operating conditions have been identified. In LAY1, hydraulic regulation is performed using two lines, namely a generation line having a PAT and a PRV, and a bypass line having only a PRV. To ensure the desired pressure at the critical node, the residual available head that exceeds the head exploited by the PAT is dissipated by the downstream PRV in the generation line, as the PAT operates according to its characteristic curve. The bypass line is designed to open only when the available head drop is less than the required head drop of PAT. In such situations, the discharge through the generation line is adjusted to obtain the available head drop, with the residual discharge flowing through the bypass line. LAY2 performs electric regulation, thus requiring a generation line with a PAT and a PRV. The bypass line, normally closed during operation, is only activated for maintenance. In this case, flow and pressure regulation are performed by adjusting the rotational speed through a frequency converter, and no regulation devices are present in the bypass line. LAY 3 couples hydraulic and electrical regulation and may be considered to be a superimposition of LAY2 over LAY1. It has both a generator line and a bypass line, as described in LAY 1, which are equipped with a frequency converter as detailed in LAY 2. The required flow rates and head drop values may be obtained in every operation condition by regulating the rotational speed and PRV opening.

2.2. PAT Operating Model

The PAT model is represented by curves that relate head, power, and efficiency to discharge. The equations of Derakhshan and Nourbakhsh [9], as modified by Pugliese et al. [10], were used in this study, with the following equations applied:
H T H T b = 1.0283 · Q T Q T b 2 0.5468 · Q T Q T b + 0.5314
P T P T b = 0.004 · Q T Q T b 3 + 1.386 · Q T Q T b 2 0.39 · Q T Q T b
η T η T b = P T · Q T b · H T b P T b · Q T · H T
in which Q T is the flow rate, H T is the head, P T is the produced power, η T is the efficiency, and Q T b , H T b , P T b , and η T b are the characteristic values of the pump in reverse mode at BEP. These equations are valid for pumps with a specific speed N C (rpm) between 14 and 60, where N C was computed as:
N C = N P · Q P b 2 H P b     3 4
where N P is the pump’s rotating speed and Q P b and H P b are the flow and head of the pump at BEP. Due to the frequency converter operation, the produced power for LAY2 and LAY3 was multiplied by 0.98, which indicates the inverter efficiency according to ABB (Asea Brown Boveri) documentation [17]. The affinity law for turbomachinery was applied to these layouts to obtain the characteristic curves at different rotational speeds, as determined using the approach described by Chapallaz et al. [18], from N 1 to N 2 .
Q 1 Q 2 = N 1 N 2
H 1 H 2 = N 1 N 2 2
P 1 P 2 = N 1 N 2 3
in which subscripts 1 and 2 represent the flow rate, head drop, and produced power for rotational speeds N 1 and N 2 , respectively. The BEP in turbine mode can be related to the BEP in pump mode using the Sharma [8] approach. Among various literature methods, Sharma’s relation showed a higher correlation with the experimental results as demonstrated by Pugliese et al. [10], with maximum errors in the order of 5%. The PAT’s best efficiency point is obtained from the following Equations (8)–(10):
H T b H P b = 1 η P b 1.2
Q T b Q P b = 1 η P b 0.8
η T b = η P b

2.3. PAT Selection

The proposed approach is designed to determine the optimal PAT for all layouts using only two input parameters, namely the inflow discharge Q a and the corresponding available head-drop H a . Fontana et al. [19] demonstrated that, for any Q T b and H T b , the maximum producible power P T at each time step was obtained by varying the flow through the turbine Q T for LAY1; the rotational speed N for LAY2; and both Q T and N for LAY3. To ensure proper operation, specific constraints were imposed for each layout as follows: (i) turbine head drop H T must be less than or equal to the available head drop H a ; (ii) rotational speed N must be within the range of minimum and maximum speeds N m i n N N m a x ; (iii) the flow through the PAT Q T must be greater than Q T m i n (i.e., flow rate for which generated power P T equals zero), and less than or equal to the available flow Q a ; and (iv) the produced current must be lower than the nominal motor current. To ensure that the produced current remains below the nominal motor current, it is more convenient to express this constraint in terms of power. The power limitation can be defined as the maximum producible power, P T , m a x , calculated as the product of a coefficient, r C and the power at the best efficiency point ( P T b ). The coefficient r C in HYPER software is user-selectable and is set to a default value of 1. However, preliminary experimental tests showed values ranging from approximately 0.95 to 1.05 for r C . For the sake of brevity, the operations of the three layouts were omitted (see Fontana et al. [19] for greater details).
The method calculates the dimensionless produced energy ( e T ) at varying Q T b and H T b as follows:
e T = E T E a · η T b
in which E T is the daily produced energy, η T b is the PAT efficiency at the BEP, and E a is the daily available energy calculated as:
E a = ρ · g · Q a · H a   d t
where ρ is the density, g is the gravity, and the daily energy is integrated over a period of 24 h. Consequently, the calculation gives a domain showing the relationship between the dimensionless produced energy and the values of Q T b and H T b . For LAY1, a single point representing the maximum produced energy can be identified, whereas the inverter used in LAY2 and LAY3 results in multiple points with the same maximum energy. It also follows that the recoverable energy in LAY3 for any combination of Q T b , H T b , is greater than that in LAY1, due to the coupled hydraulic and electric regulation, which enhances the flexibility of the system.
Dimensionless domains were further used to determine the optimal PAT in terms of the produced energy and cost, as selected from a manufacturer’s list of commercially available pumps. As a general remark, the best cost solution is a pump with Q T b and H T b close to the maximum e T . Increasing the values of Q T b and H T b raises the total cost, thus making it preferable to select PATs with the lowest Q T b and H T b for similar e T values.

2.4. Cost Analysis

An economic analysis was developed for each configuration to determine the optimal PAT, according to the net present value (NPV), calculated as follows:
N P V = k = 1 n ( G C ) ( 1 + r ) n I 0
where n represents the estimated PAT operating term fixed to 10 years, G represents the yearly profit from the sale of produced energy, C denotes the annual cost which includes the major repair or maintenance of machinery, encompassing labor and salaries, r represents the discount rate, which is assumed to be 5%, and I 0 represents the investment cost. To calculate the yearly profit, the daily average produced energy is multiplied by 365, taking into account the actual efficiency of the machine. According to the Italian Energy Authority (GSE) [20], the selling price of energy was EUR 0.159/kWh. The total investment cost was derived by summing up the following costs:
  • The cost of PAT and generator ( C P A T + g e n ) was calculated as C P A T + g e n = 15797.72 · Q T b H T b + 1147.92 (EUR), as expressed by Novara et al. [21], where Q T b is in L/s and H T b in m;
  • The cost of civil works is assumed to be 30% of C P A T + g e n (EUR) [1];
  • The PRV cost calculated as C P R V = 6.7109   D 1.3107 (EUR) is derived by analyzing the costs associated with the valve nominal diameters from the manufacturer catalogue [22] with D expressed in mm. In the present paper, the nominal diameters of the valves were set equal to 200 mm;
  • Frequency converter: computed as C i n v e r t e r = 1239.9 + 165.72   P T b (EUR) in accordance with Saidur et al. [23], where P T b is in kW.
Both LAY1 and LAY3, given their hydraulic regulation characteristics, require two PRVs, one on each of their respective generation lines and by-pass lines. However, LAY2 requires only one PRV on the generation line. The inverter cost was not included in LAY1 since it does not have electrical regulation. The annual cost is primarily associated with maintenance and was assumed to be 15% of the investment cost, as recommended by De Marchis et al. [24] and Fontana et al. [1].

3. HYPER v1.0

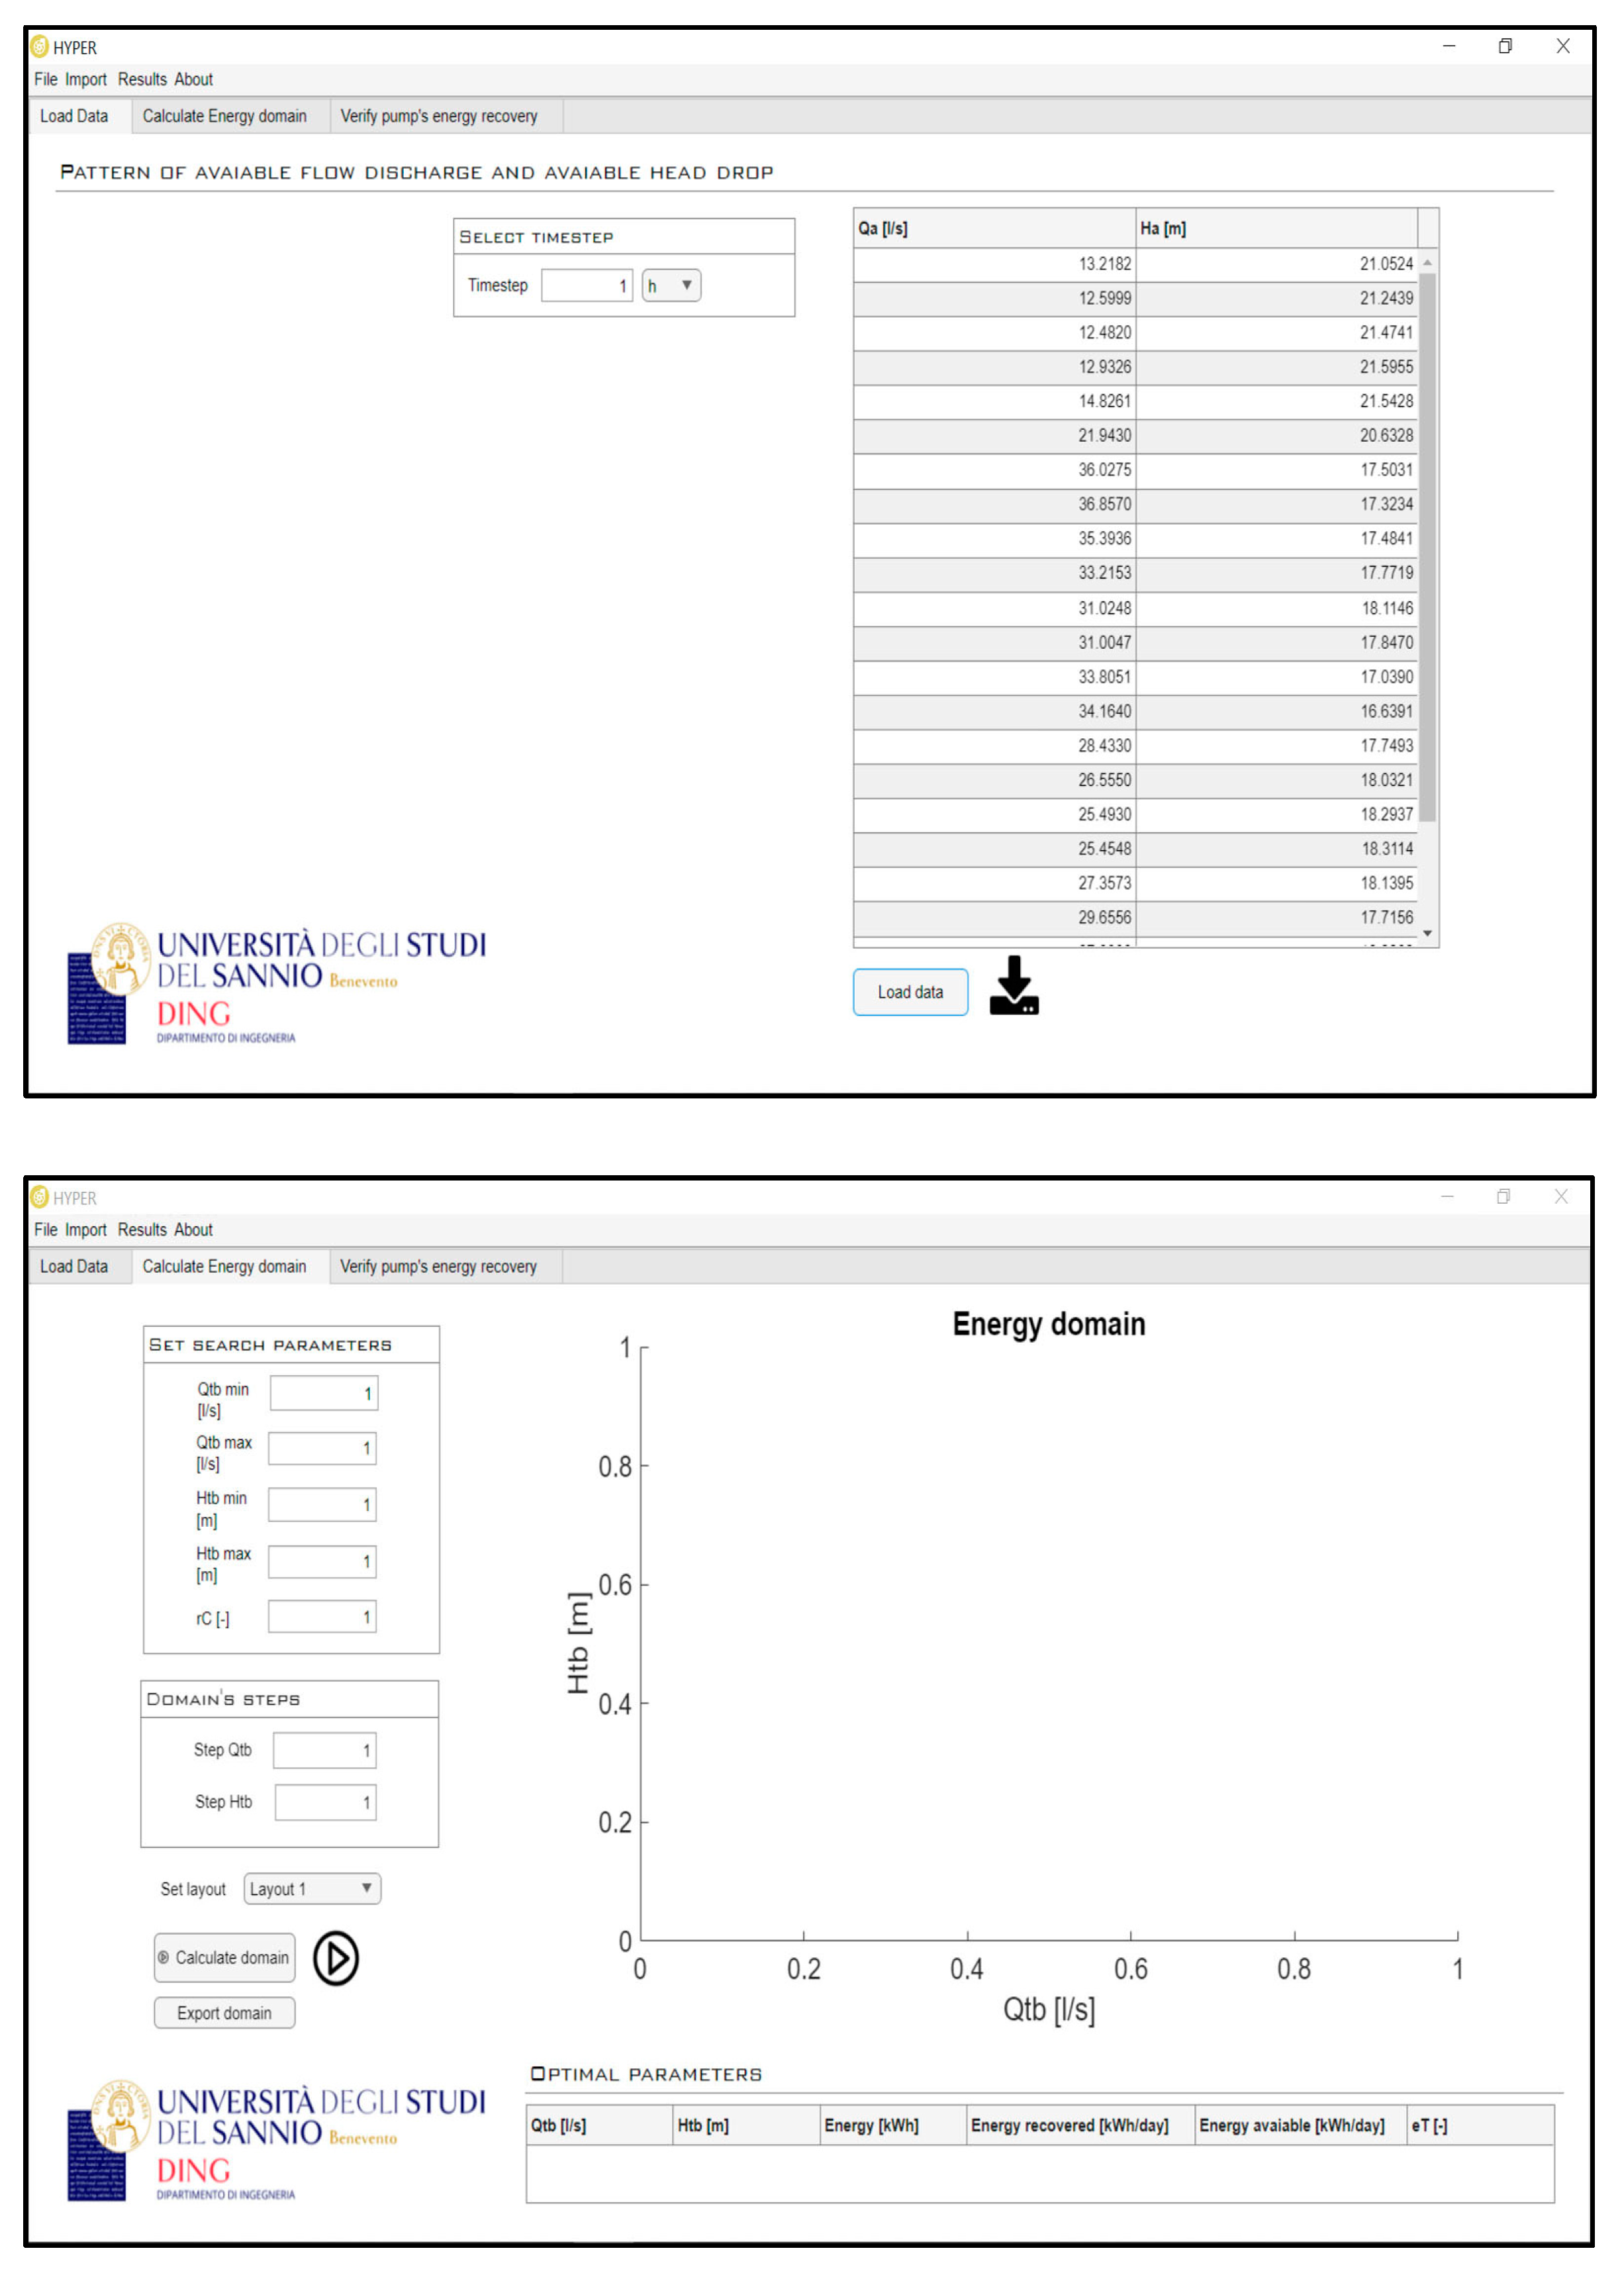
A software tool was created to determine the optimal PAT that maximizes the energy production for any installation layout. Called HYPER, the app has a Matlab GUI and a Fortran-based engine, based on the model proposed by Fontana et al. [19] and Marini et al. [25], and is designed to determine the optimal parameter values of Q T b and H T b using the approach discussed earlier. HYPER v1.0 is freely available on GitHub’s hosting website (https://github.com/gustavomarini/HYPER accessed on 2 August 2023). A visual representation of the tool’s interface can be seen in Figure 2.
The software comprises two main sections, with the first dedicated to loading and pre-processing the pattern of the available flow discharge and available head drop, and the second section being where the energy domain and optimal solution are calculated.
The required input data can be obtained from the user through the hydraulic simulation of the network, where the pump-as-turbine (PAT) system can be conveniently modeled as a valve inducing minor head loss. This minor loss will represent the available head drop that can be utilized by the PAT. Moreover, it is possible to model multiple valves in the network, thereby affecting the entire hydraulic system. The user is responsible for defining the scope of the hydraulic simulation, which may include ensuring minimum pressure at a control node or any other specific requirements. Upon conducting the hydraulic simulation, the resulting patterns of the available flow and available head drop at the location of the PAT are obtained, providing essential data for further analysis and evaluation.
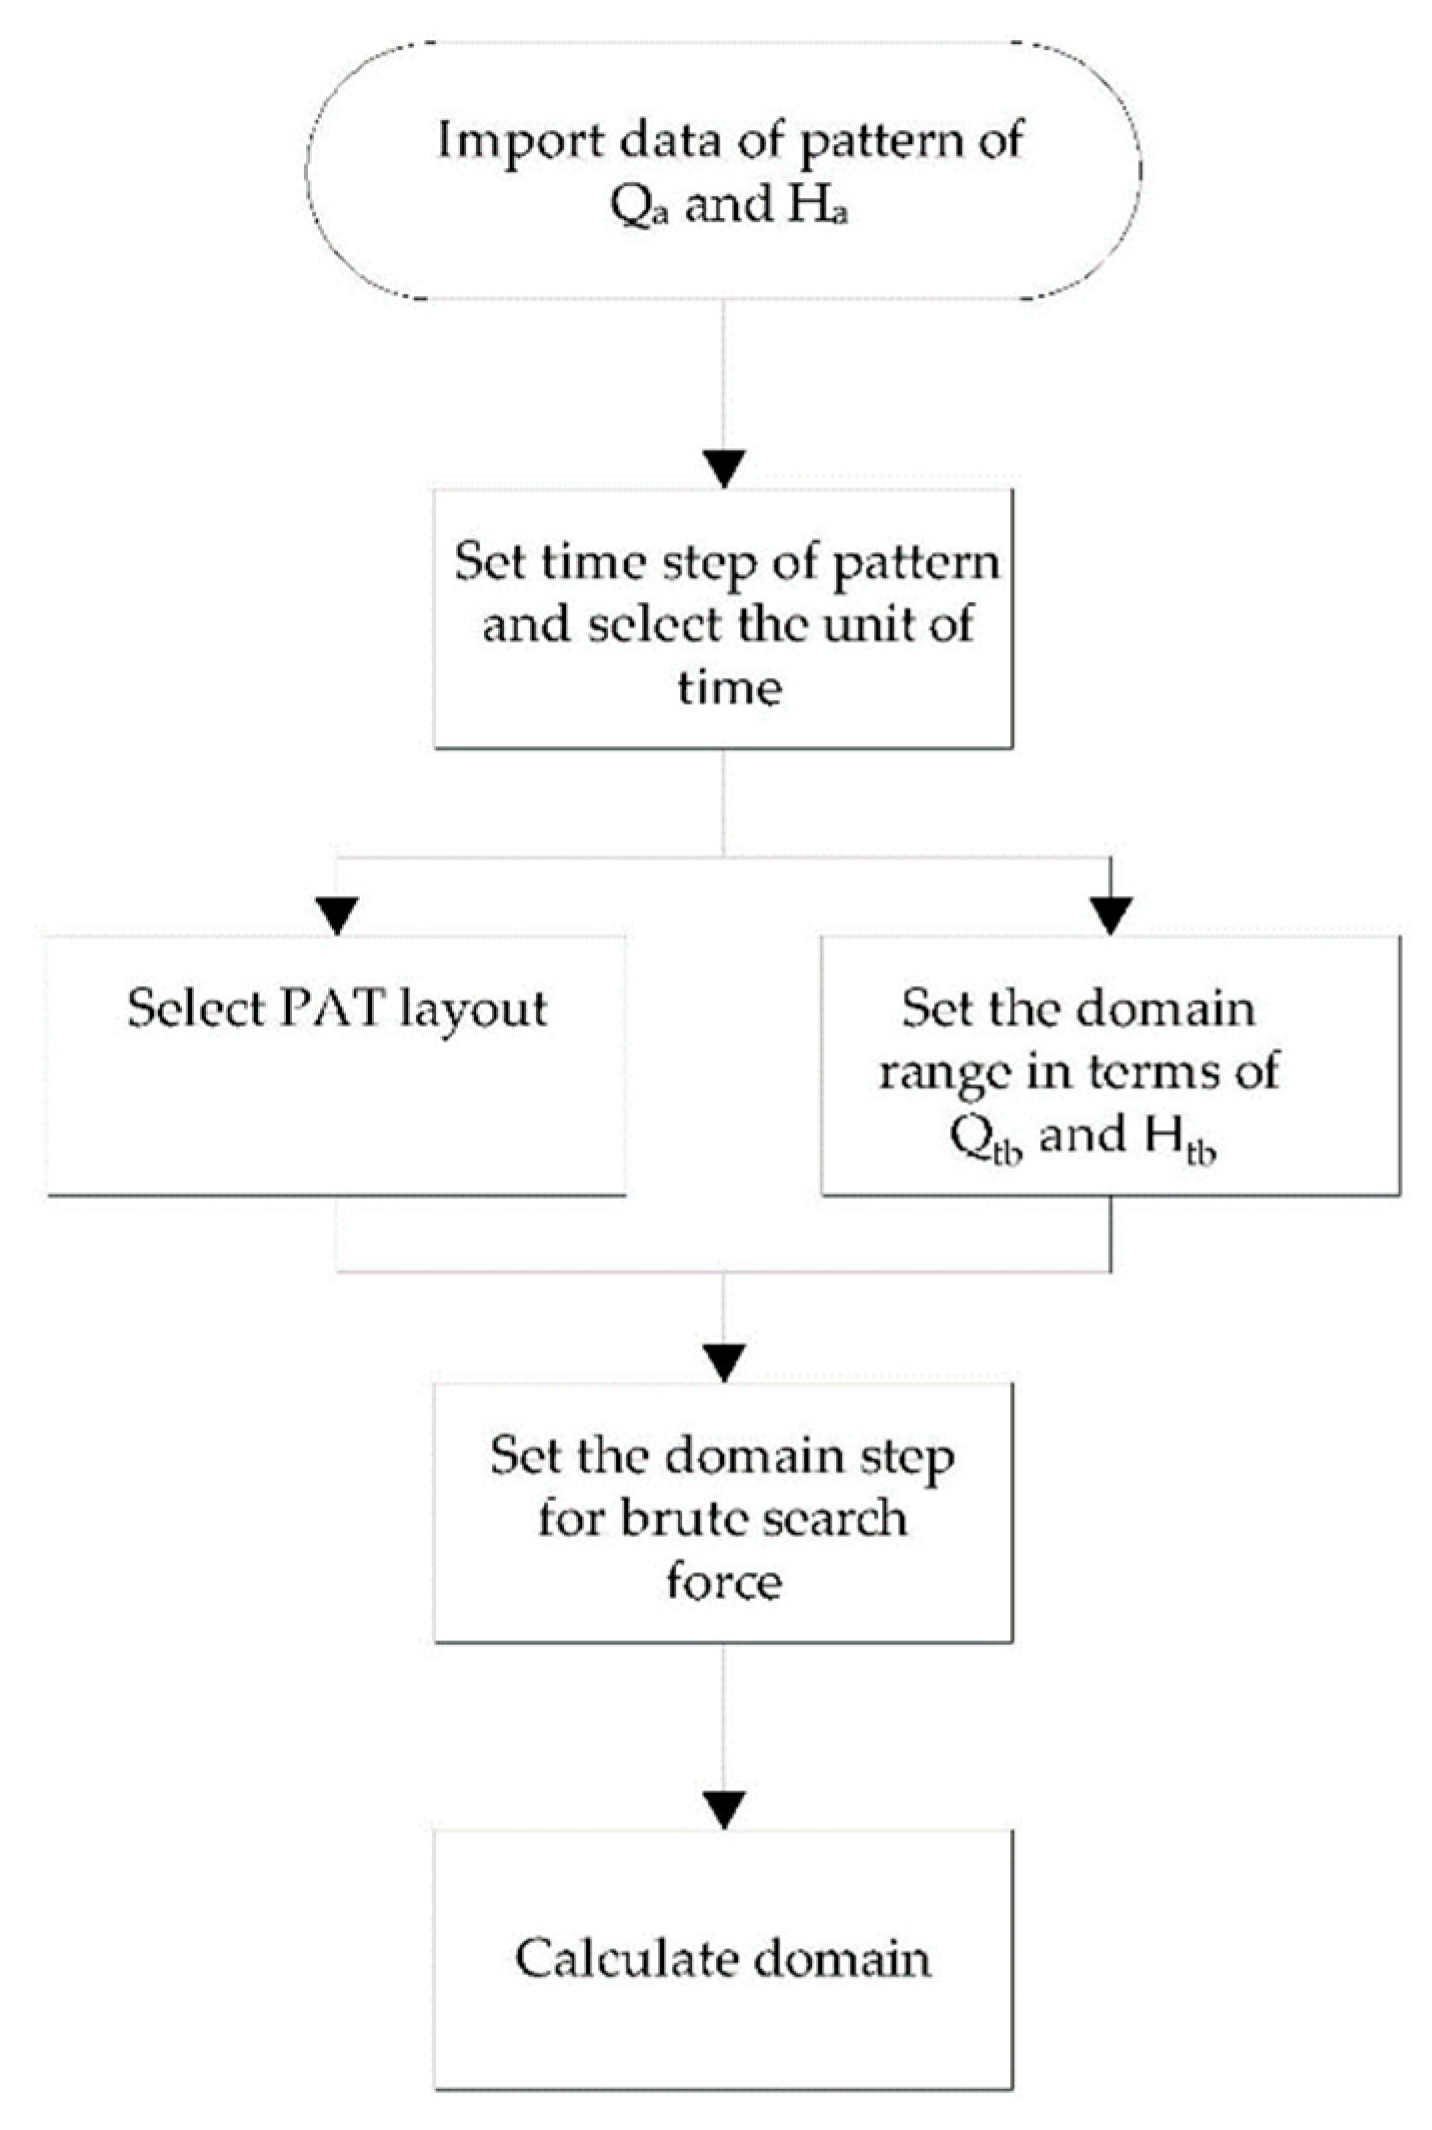
The procedure that the user has to follow for selecting the optimal PAT involves four basic steps (Figure 3):
1.
Importing data from a file with a .txt or .xlsx extension and defining the pattern of available flow discharge and available head drop. The user-selectable value for the time step unit should be entered in the appropriate field for correct computation.
2.
Selecting the PAT layout and setting the domain range in terms of Q T b and H T b to find the optimal solution and plot the graphic domain. If the user does not set the extremal values of the Q T b and H T b , the app sets default minimum and maximum values, which are, respectively, 20% of the average of Q a (or H a ) and 250% of the average of Q a (or H a ) for Q T b (or H T b ). These default values are set so as to find the solution in the zone with maximum energy production.
3.
Setting the domain step for brute-force search.
4.
Running the search and waiting for the result. The computational time depends on the machine, the domain range, and the domain step: the larger the domain range and the denser the domain steps, the greater the computational time.
A specific section in the app makes it possible to convert the optimal PAT characteristics into optimal pump characteristics, thereby making it possible to identify a commercial pump from a manufacturer’s catalogue. The user can also select a different model conversion [10]. Additionally, the program allows the visualization and export of results, such as the choice of colormap, text size, and image resolution in DPI. The application of a case study serves to better describe steps 1–4; however, the HYPER tutorial provides a more comprehensive user guide.

4. Application

The software operation was validated through the application to the case study analyzed by Fontana et al. [6]. The study compares the results of a skeletonized model of a real WDN (Figure 4) [16], which consists of 26 nodes with demand (nodes 1–26) at a ground elevation of 0 m above sea level connected by 34 pipes and supplied by a reservoir at constant head (i.e., node 27). The PAT, positioned on pipes 26–20 connecting the reservoir to the WDN, was set to maintain a pressure head of 25 m at the critical node which is identified through preliminary hydraulic analysis. This critical node, designated as “node 1,” is determined as the point in the system with the lowest service pressure under typical demand conditions.
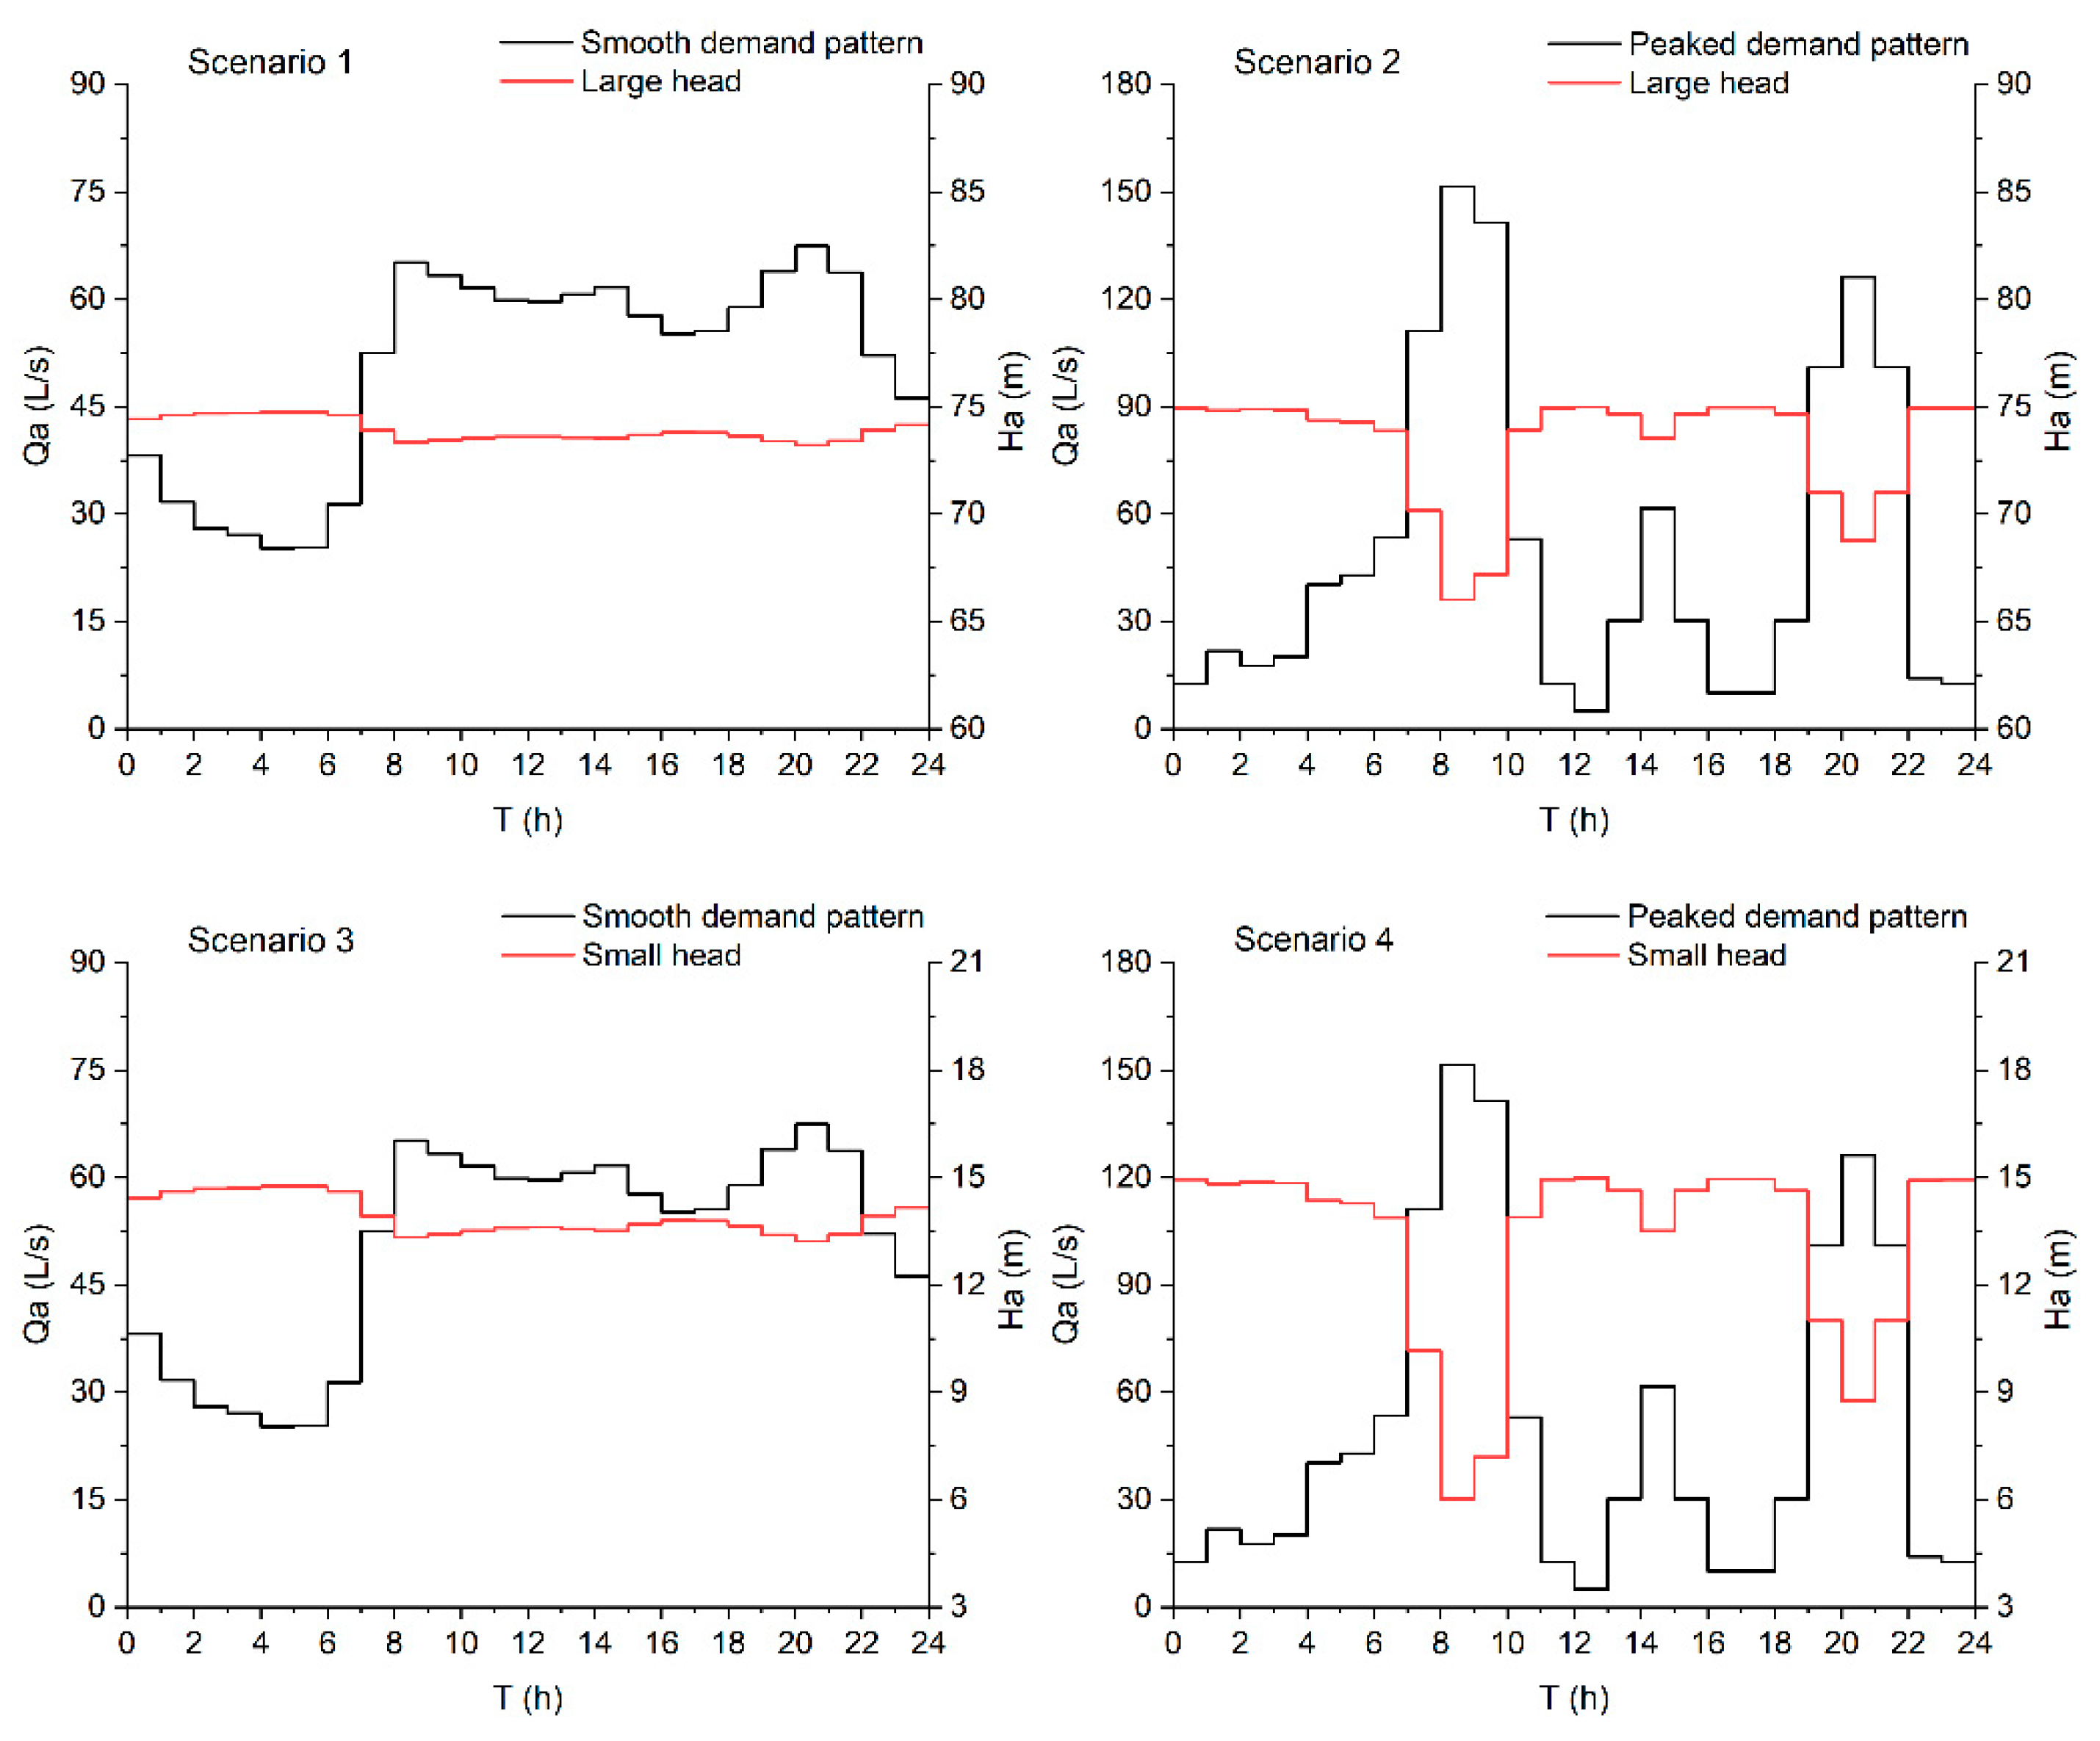
Fontana et al. [6] discussed four scenarios (Table 1) for the three installation layouts shown in Figure 1. The scenarios were identified based on two different source head values and two daily demand patterns. The two source head values are 40 m (considered as the small head) and 100 m (considered as the large head). These source head values result in the corresponding available head drops ranging from 6.0 to 15.0 m for the small head scenario and from 73.6 to 75.0 m for the large head scenario. The two demand patterns, namely the smooth demand pattern and the peaked demand pattern, are derived by multiplying the daily average water discharge of WDN by the demand multiplier factor of the 24 one-hour-long time slots.
The daily pattern has been divided into 1 h time intervals. Within each interval, a single constant value for both the flow rate and the head drop was assumed. The patterns of inflow discharge Q a and the available head drop H a for each scenario are plotted in Figure 5.
The four scenarios, providing input data to be imported into the ‘Load Data’ section, when combined with the three available layouts, produce a total of twelve configurations. All twelve configurations are analyzed using the ‘Calculate’ section of the software.

5. Results

The recoverable dimensionless energy was calculated for each configuration to determine the best pump to use. As discussed above, in the case of hydraulic regulation, the maximum dimensionless energy produced occurs for a single pair of Q T b and H T b values, with a fairly large area with medium/high produced energy being identified around this point. Instead, the LAY2 results showed two different zones: a large area with e T = 0 indicates unfeasible regulation, and a second zone with e T > 0. As expected, LAY2 returned the lowest produced energy and lowest flexibility, since the first zone represents Q T b and H T b values for which the machine head drop is incompatible with the available head drop at one or more time steps. LAY3 returned results similar to LAY1, albeit with a larger area than LAY1 in which energy production reaches high values. This larger area is attributable to the greater flexibility of the coupled hydraulic and electrical regulation, which also provides more pairs of Q T b and H T b values for which energy production is maximum.
Table 2 lists the characteristics at BEP of the best PATs, returned by domains, for each layout and each scenario with the relative maximum dimensionless energy and recoverable energy.
Figure 6 shows the domains obtained for all configurations. For LAY1, Scenario 1 (S1) (Figure 6a) and Scenario 3 (S3) (Figure 6c) show the same shape and similar maximum dimensionless produced energy. The maximum dimensionless produced energy, respectively, e T = 0.81 for S1 and e T = 0.79 for S3, was achieved for the same Q T b = 58.95 L/s, because of the same flow rate pattern. Similarly, Scenarios 2 (S2) and 4 (S4) (Figure 6b,d) show a similar shape, with maximum dimensionless produced energy e T of 0.54 for S2, and 0.41 for S4, respectively. Also in this case, the maximum was achieved for the same Q T b = 101 L/s.
As mentioned above, although the LAY3 results are similar to those of LAY 1, this returned a larger area in which energy production reaches high values (Figure 6i–l). As for LAY1, the shape of the flow rate pattern drives the domain shape. The maximum dimensionless energy was e T = 0.81, e T = 0.55, e T = 0.80, and e T = 0.45 for S1 to S4, respectively.
The domains inferred for LAY2 again show a similar shape according to the flow patterns; in this case, however, the maximum energy was achieved for different values of Q T b due to the presence of the inverter, with the highest produced energy occurring at the upper boundary of the zone with e T = 0. Unlike for a smooth flow pattern, the domains inferred for S2 and S4 (Figure 6f,h) also show a vertical boundary, arising to the constraint on the minimum rotational speed. The maximum dimensionless energy for S1 and S3 was e T = 0.79 and e T = 0.77, respectively, while for S2 and S4, it was e T = 0.48 and e T = 0.29, respectively.
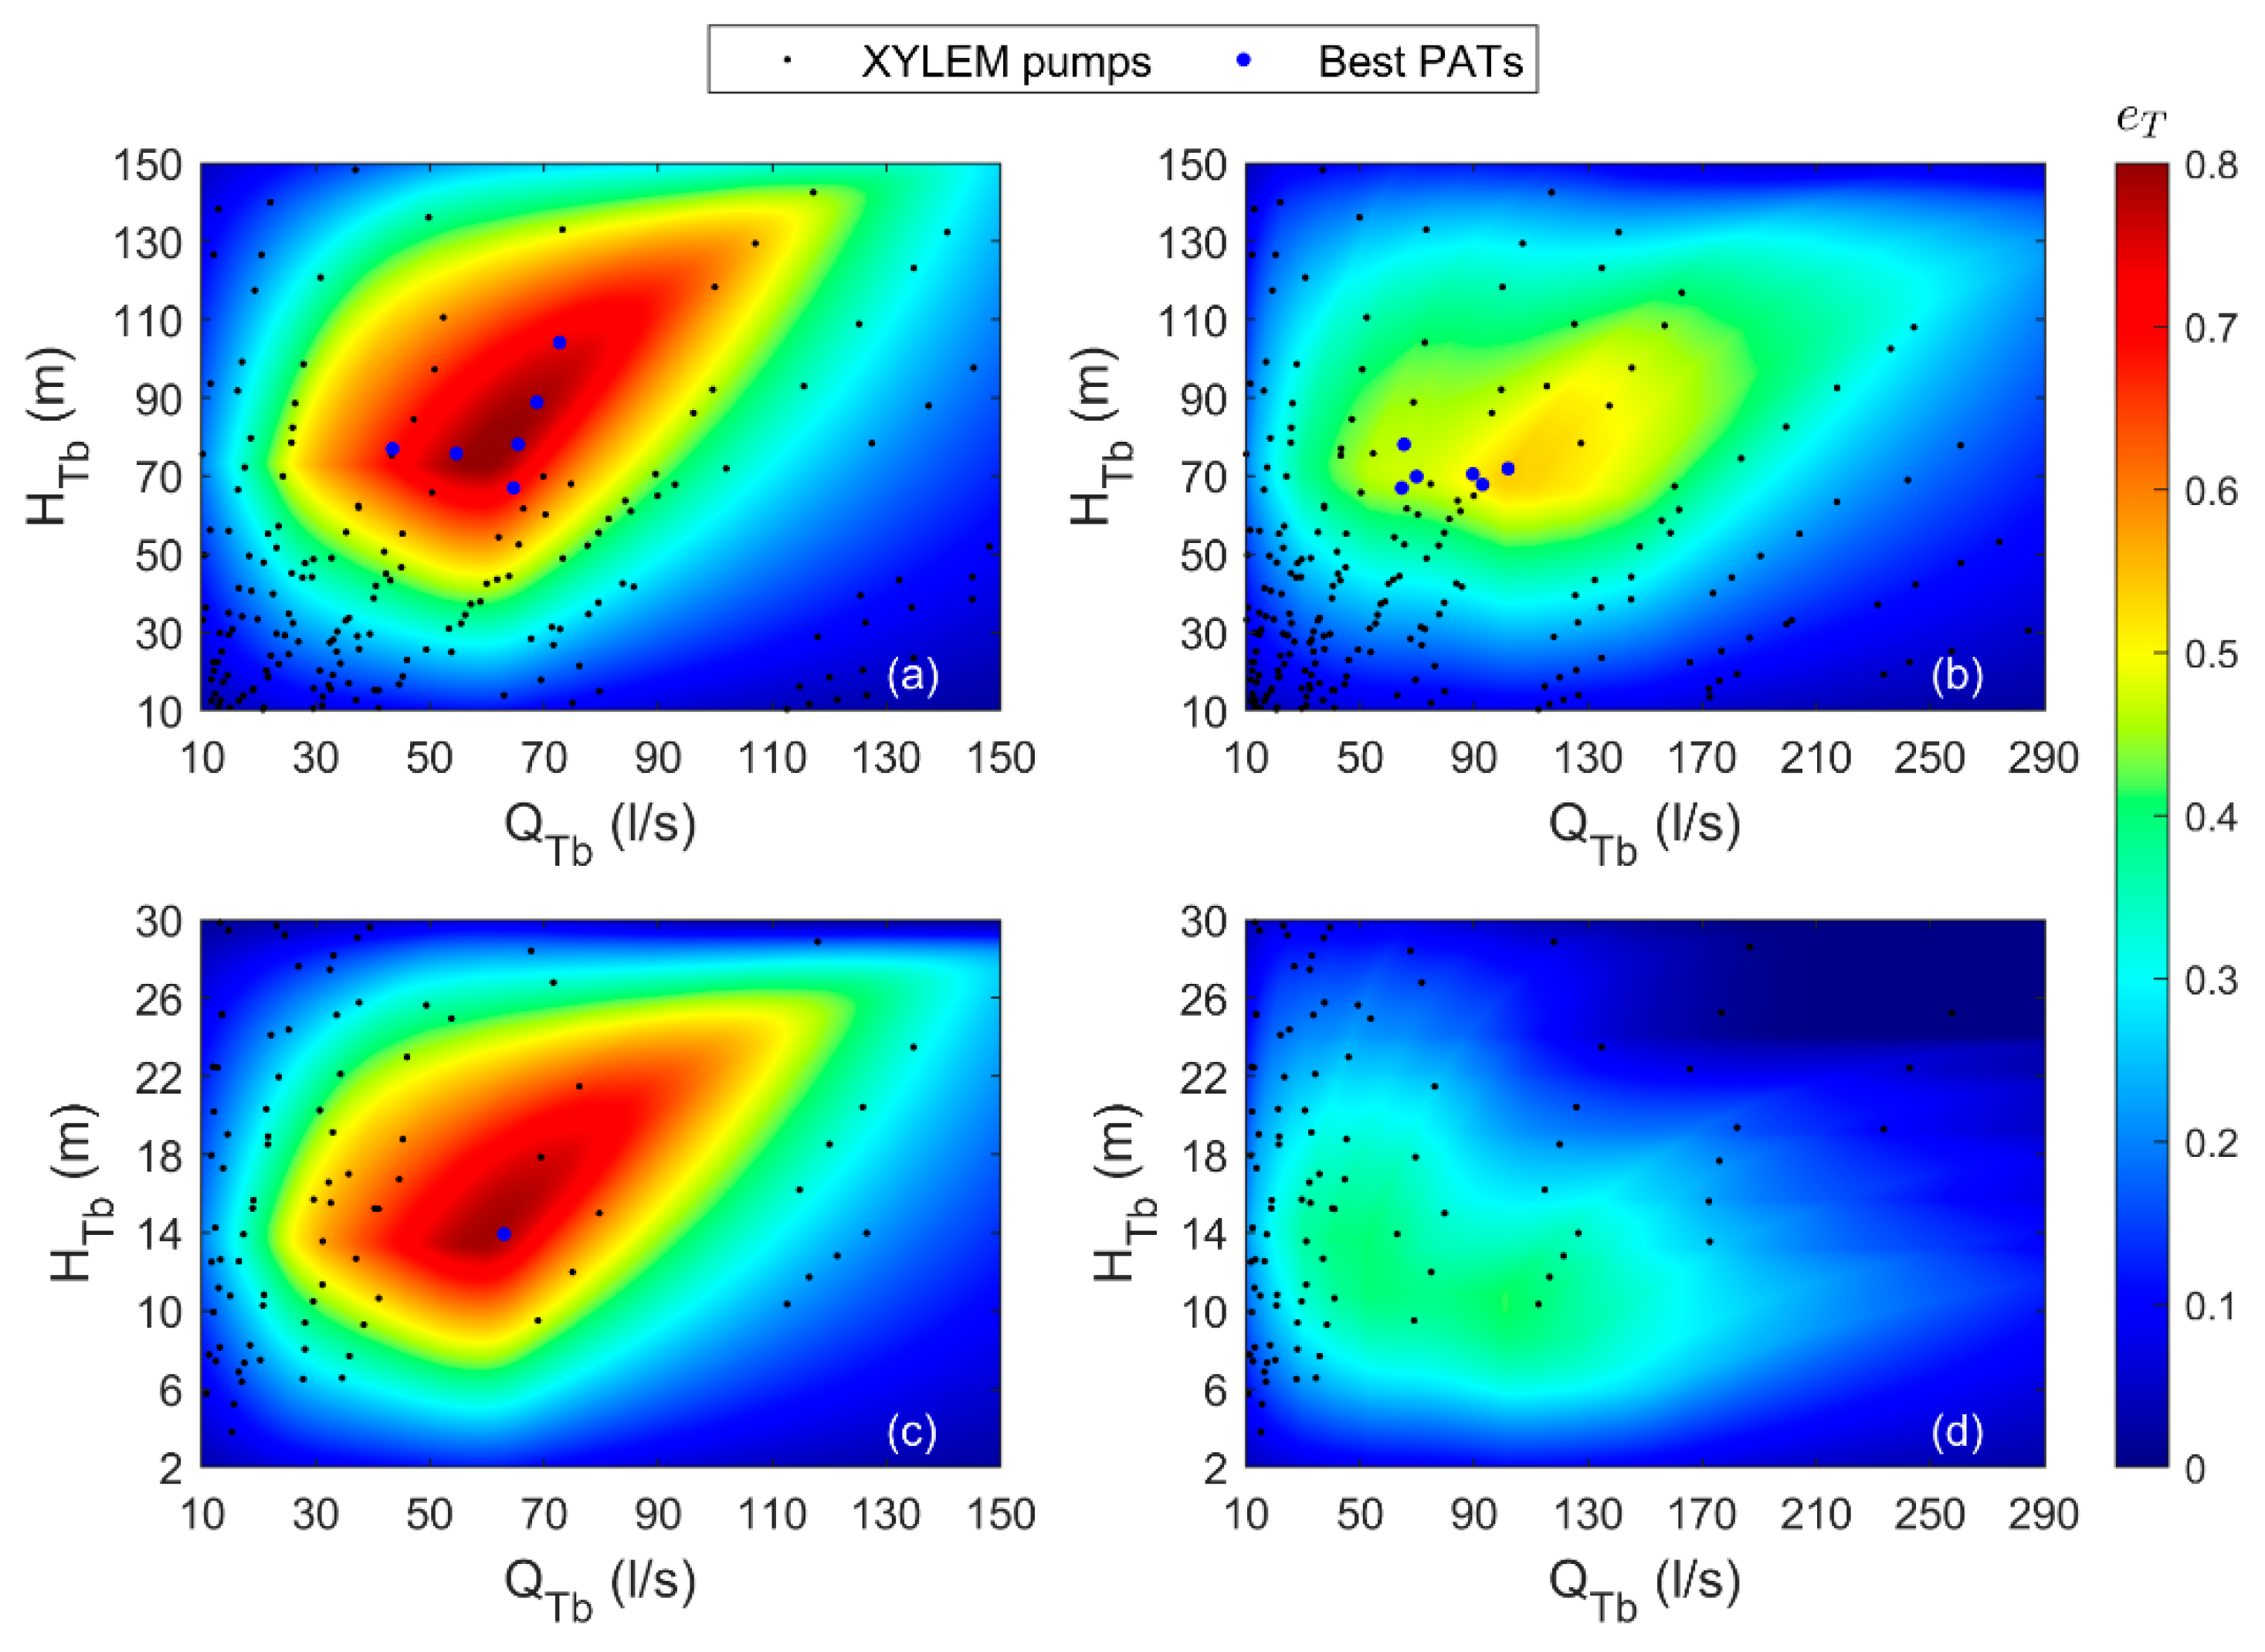
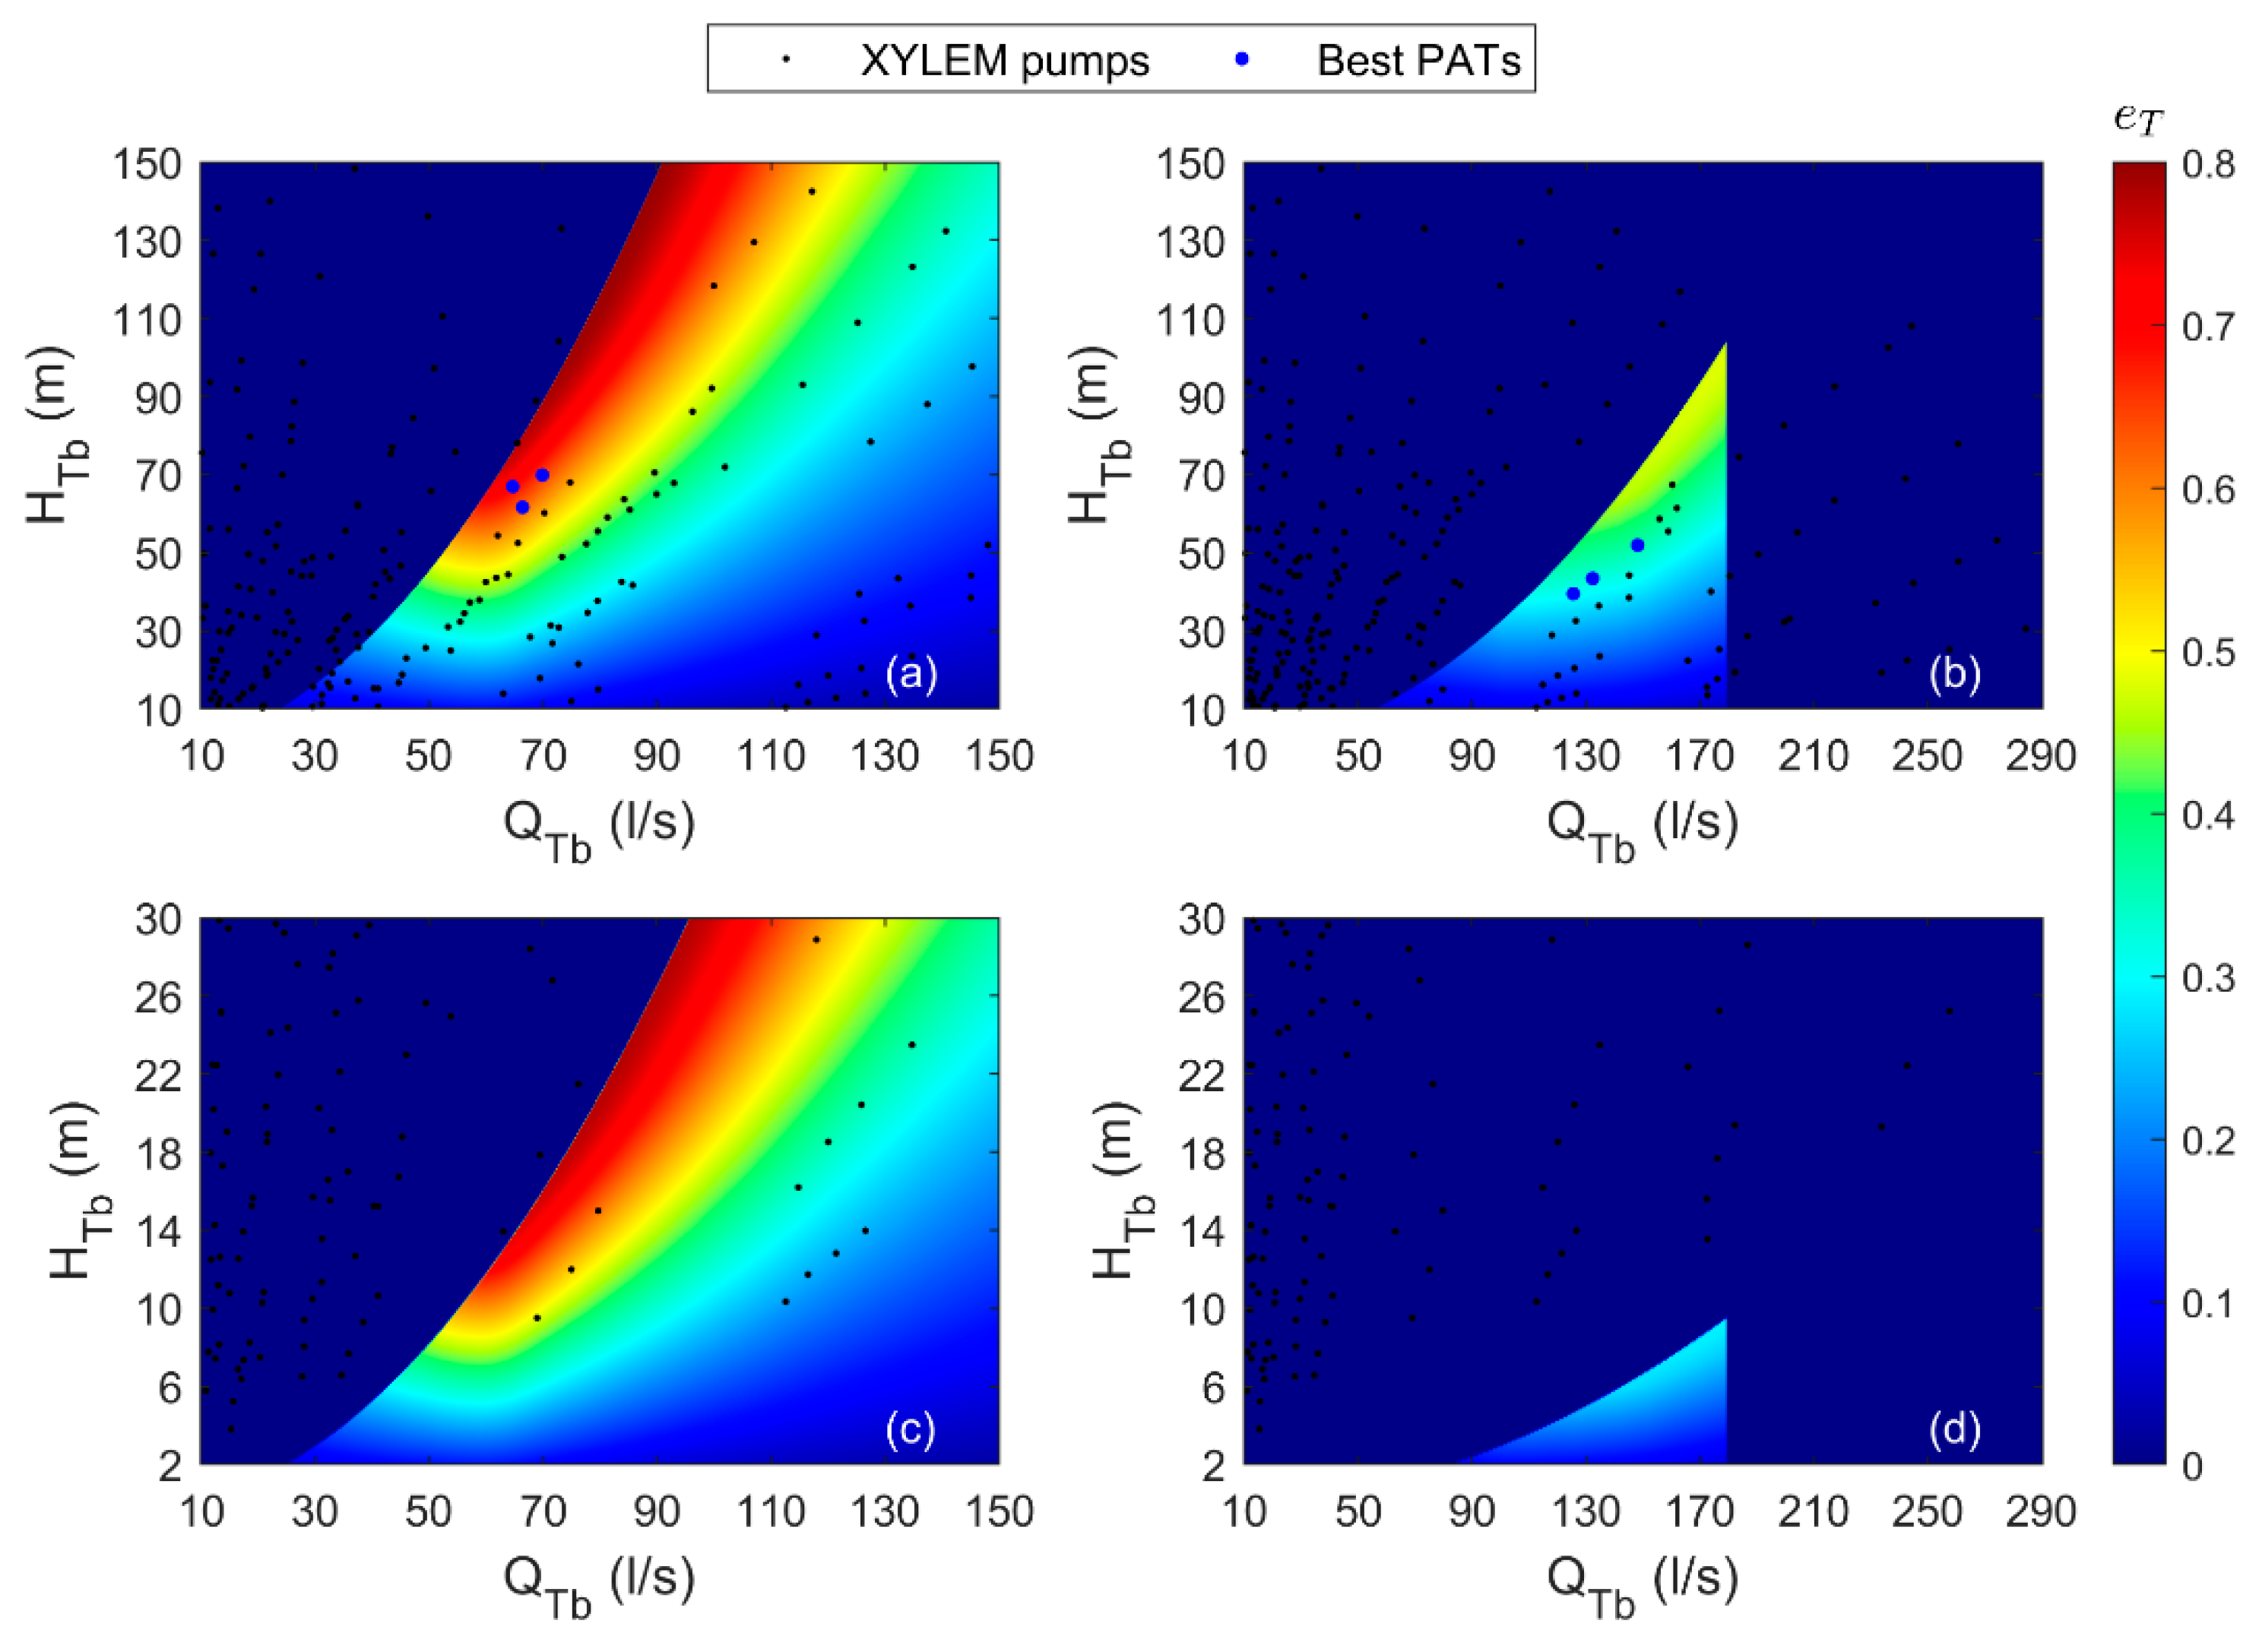
The optimal commercial pump can be chosen based on the values of Q T b and H T b that ensure the maximum produced energy. The operation of the tool was demonstrated by analyzing a database of 316 e-NSC series pumps from the Xylem products catalogue, with the NPV being computed for each with the maximum NPV ( N P V m a x ) individuated for each configuration. The BEP in turbine mode was calculated for all pumps using Equations (8)–(10), and the dimensionless energy domains for each configuration were plotted in Figure 7, Figure 8 and Figure 9. Black points represent all 316 PATs available in the database while blue points represent pumps that exhibit the best NPVs. To simplify the visualization, only pumps with an energy production greater than 85% of the N P V m a x were plotted for all configurations. The best pump was always found to be located close to the maximum dimensionless energy, showing that the energy domains can be effectively used for a quick evaluation of the optimal PAT, without the need for a cost analysis. Table 3 provides a comprehensive summary of the key characteristics of the best pumps identified for all layouts and scenarios.
For LAY1, S1 yields N P V m a x (EUR 186,429.11) for the pump e-NSC 80-250/450, with Q T b = 65.47 L/s and H T b = 78.10 m (Figure 7a). For S2, the N P V m a x was obtained with the pump e-NSC 100-200/550, with Q T b = 92.97 L/s and H T b = 67.80 m (Figure 7b), and was equal to EUR 92,633.90. The significant reduction in NPV is obviously due to the greater variability in the demand flow pattern for S2. In S3, a single pump was identified with other pumps that showed NPV lower than 85% of the N P V m a x (Figure 7c). For scenario 4, none of the 316 pumps in the catalogue returned a NPV > 0 (Figure 7d), indicating that the PAT installation in these cases offers no economic advantage. As expected, all pumps with NPVs greater than 85% of the N P V m a x were located around the maximum generated energy, except for S2, in which scenario the domain area surrounding the maximum value shows a very flat shape, thus reflecting more suitable solutions with reduced investment costs, and therefore with lower Q T b values.
For LAY2, the N P V m a x (EUR 155,113.54) was obtained for S1 with the commercial PAT e-NSC 80-250/370 ( Q T b = 65.47 L/s and H T b = 78.10 m) (Figure 8a). For LAY2, the NPV decreased from S1 to S2, with S3 and S4 resulting in negative NPV for all pumps (Figure 8c,d). For S2, the e-NSC 150–400/550 ( Q T b = 132.29 L/s and H T b = 43.40 m) was the best pump, differently from LAY1 where pumps with lower Q T b and H T b were the best due to their lower costs compared to the negligible increase in energy in the maximum production area (Figure 8b).
In the case of coupled hydraulic and electrical regulation, the e-NSC 80-250/550 pump was found to have the N P V m a x for S1 (Figure 9a), while the e-NSC 100-200/550 pump was the best for S2 (Figure 9b), and the e-NSC 125-250/75 pump was the best for S3 (Figure 9c). Similarly to the other two layouts, no pumps in S4 had a positive NPV (Figure 9d). Once again, the best pumps from the catalogue were located near the maximum of the dimensionless energy domain, and for S2, the best pumps were in the area near the maximum produced energy with the lowest Q T b and H T b values.

6. Sensitivity Analysis

This sensitivity analysis specifically focused on investigating how variations in unit costs impact the overall cost analysis. Because the cost analysis particularly depends on the investment cost, a coefficient d was applied to simulate a 20% variation of the investment cost, with I0 ranging between 80% and 120% of the values calculated in the first part of the paper. As a result, maintenance costs also underwent a proportional adjustment, as they are directly dependent on the investment costs.
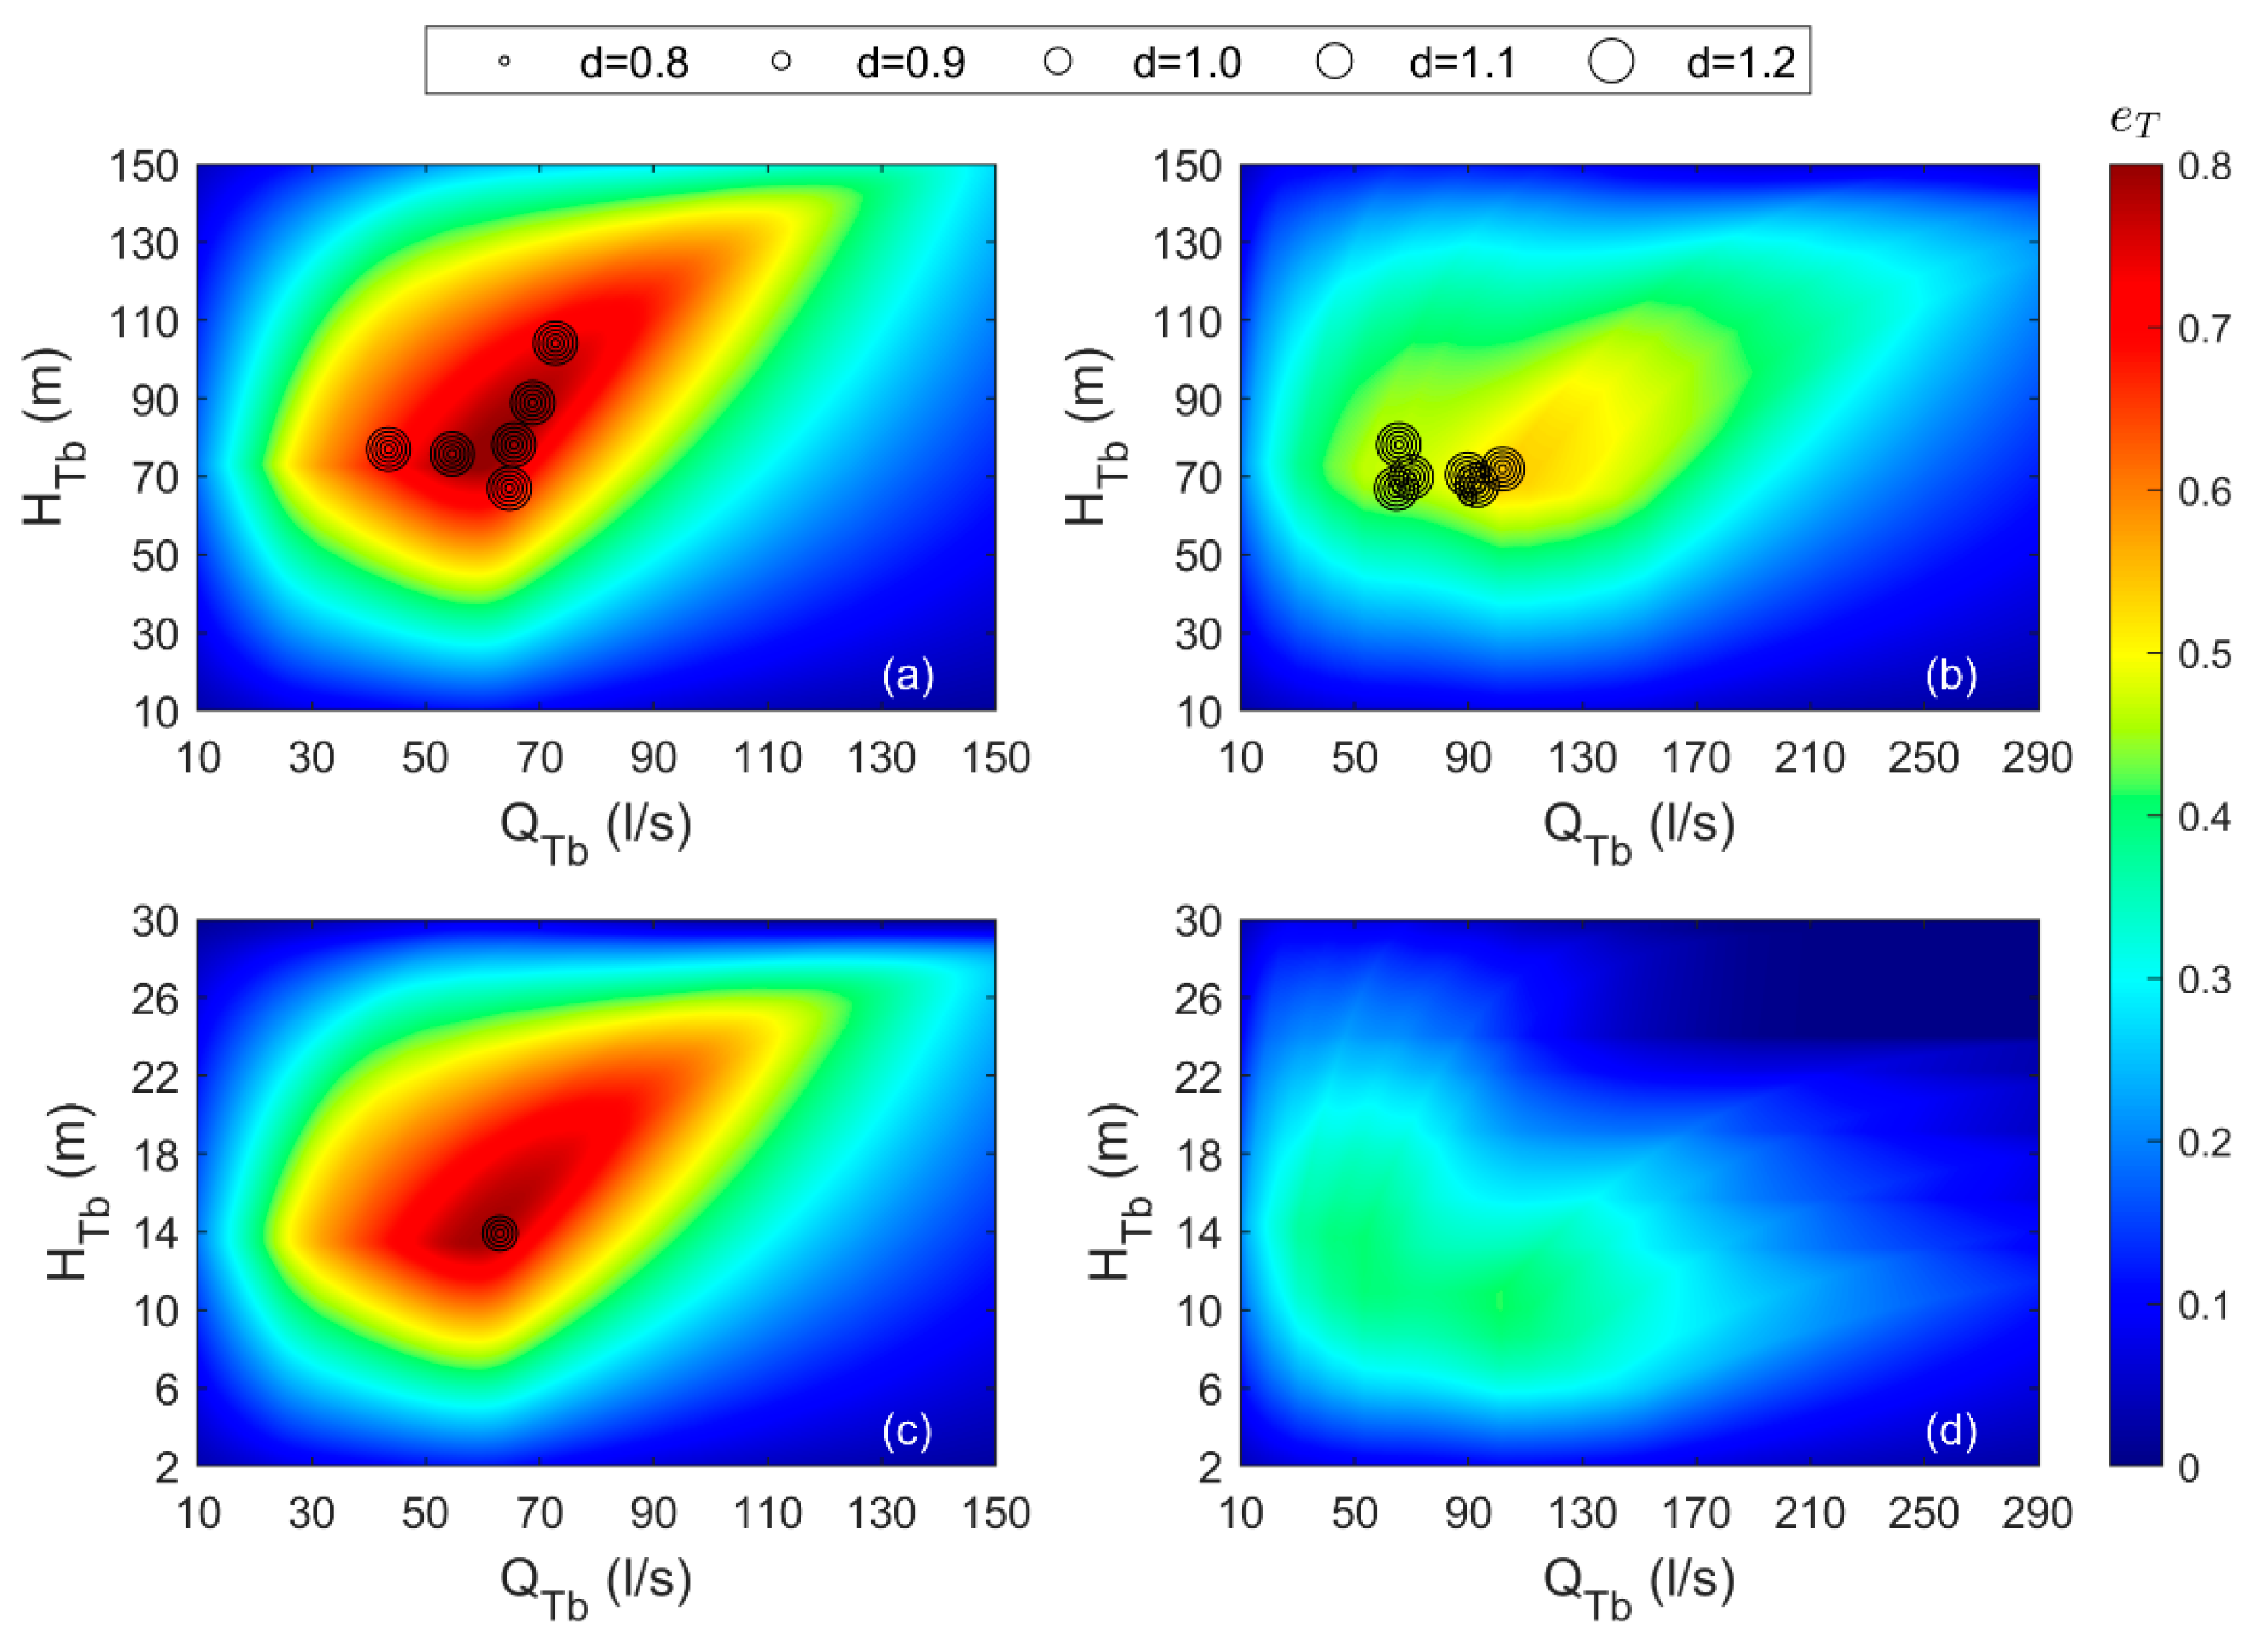
The results of this analysis are summarized in Figure 10, which shows, for the layout 1, the pumps with energy production exceeding 85% of the maximum N P V m a x for each d value. Each data point on the graph corresponds to different values of the coefficient d for the four scenarios. Remarkably, the data for the coefficient d equal to 1 align precisely with the findings previously reported in the results section (Figure 7, Figure 8 and Figure 9).
Even with the introduction of cost variations using the coefficient d, the optimal pumps consistently have the same characteristics of those exhibiting the maximum produced energy, confirming the results obtained in the initial analysis. Importantly, the investigation showed that, in the majority of cases, the pumps with the best net present values remained unchanged for every value of d. For the sake of brevity, only the figure for Layout 1 was reported, but the same results were obtained for Layout 2 and 3.

7. Conclusions

This paper proposed a software app that implements a new methodology to select the best PAT for regulating pressure while also recovering energy in a WDN. The proposed tool uses available flow and head drop data to calculate the domain of dimensionless produced energy, from which economic analysis can be performed to determine the optimal PAT. The methodology was tested on an existing case study of a WDN involving four different operational scenarios that include small and large values of available head drop, and smooth or peaked demand patterns in the typical day of WDN operation. The economic analysis showed the pumps with the best NPVs located close to the maximum produced energy, which can thus be used for a preliminary assessment of the optimal PAT.
The findings were consistent with those of similar studies, confirming that for all investigated patterns and layouts, the optimal commercial pumps lie in close proximity of the maximum energy points of the dimensionless domain. The foregoing thus demonstrates these values to be useful for the facilitating quick preliminary selection of the PAT. This study also confirmed the greater flexibility of hydraulic regulation compared to electric regulation, which always returns lower or even negative NPVs.
Additionally, a sensitivity analysis was performed to examine how changes in the unit cost impact the results. By varying the unit cost by ±20%, it was observed that the PAT with the best NPV exhibits similar characteristics to the PAT that generates the maximum energy.

Author Contributions

Conceptualization, G.M.; Data curation, M.M. and F.D.M.; Formal analysis, G.M. and M.M.; Funding acquisition, G.M. and N.F.; Methodology, G.M.; Project Administration, G.M. and N.F.; Resources, F.D.M. and M.M.; Software, G.M. and F.D.M.; Supervision, G.M.; Validation, N.F.; Visualization, F.D.M.; writing—original draft, G.M.; writing—review and editing, N.F., M.M., and F.D.M. All authors have read and agreed to the published version of the manuscript.

Funding

This research was funded by Project ARS01_01080 “WATERGY-L’efficientamento energetico del Servizio Idrico Integrato” Ministry of Education, Universities and Research: CUP B52F20001180005.

Data Availability Statement

Some or all data, models, or code that support the findings of this study are available from the corresponding author upon reasonable request.

Conflicts of Interest

The authors declare no conflict of interest.

References

  1. Fontana, N.; Giugni, M.; Portolano, D. Losses Reduction and Energy Production in Water-Distribution Networks. J. Water Resour. Plan. Manag. 2012, 138, 237–244. [Google Scholar] [CrossRef]
  2. Jafari, R.; Khanjani, M.J.; Esmaeilian, H.R. Pressure Management and Electric Power Production Using Pumps as Turbines. J. Am. Water Works Assoc. 2015, 107, E351–E363. [Google Scholar] [CrossRef]
  3. Giugni, M.; Fontana, N.; Ranucci, A. Optimal Location of PRVs and Turbines in Water Distribution Systems. J. Water Resour. Plan. Manag. 2014, 140, 06014004. [Google Scholar] [CrossRef]
  4. Fontana, N.; Giugni, M.; Glielmo, L.; Marini, G. Real Time Control of a Prototype for Pressure Regulation and Energy Production in Water Distribution Networks. J. Water Resour. Plan. Manag. 2016, 142, 04016015. [Google Scholar] [CrossRef]
  5. Williams, A. Pumps as Turbines: A User’s Guide; ITDG: London, UK, 1996. [Google Scholar]
  6. Fontana, N.; Marini, G.; Creaco, E. Comparison of PAT Installation Layouts for Energy Recovery from Water Distribution Networks. J. Water Resour. Plan. Manag. 2021, 147, 04021083. [Google Scholar] [CrossRef]
  7. Nautiyal, H.; Varun; Kumar, A. Reverse Running Pumps Analytical, Experimental and Computational Study: A Review. Renew. Sustain. Energy Rev. 2010, 14, 2059–2067. [Google Scholar] [CrossRef]
  8. Sharma, K.R. Small Hydroelectric Project-Use of Centrifugal Pumps as Turbines; Kirloskar Electric: New Delhi, India, 1985. [Google Scholar]
  9. Derakhshan, S.; Nourbakhsh, A. Experimental Study of Characteristic Curves of Centrifugal Pumps Working as Turbines in Different Specific Speeds. Exp. Therm. Fluid Sci. 2008, 32, 800–807. [Google Scholar] [CrossRef]
  10. Pugliese, F.; De Paola, F.; Fontana, N.; Giugni, M.; Marini, G. Experimental Characterization of Two Pumps As Turbines for Hydropower Generation. Renew. Energy 2016, 99, 180–187. [Google Scholar] [CrossRef]
  11. Carravetta, A.; del Giudice, G.; Fecarotta, O.; Ramos, H. PAT Design Strategy for Energy Recovery in Water Distribution Networks by Electrical Regulation. Energies 2013, 6, 411–424. [Google Scholar] [CrossRef] [Green Version]
  12. Lima, G.M.; Luvizotto, E.; Brentan, B.M. Selection and Location of Pumps as Turbines Substituting Pressure Reducing Valves. Renew. Energy 2017, 109, 392–405. [Google Scholar] [CrossRef]
  13. Mitrovic, D.; Morillo, J.G.; Rodríguez Díaz, J.A.; Mc Nabola, A. Optimization-Based Methodology for Selection of Pump-as-Turbine in Water Distribution Networks: Effects of Different Objectives and Machine Operation Limits on Best Efficiency Point. J. Water Resour. Plan. Manag. 2021, 147, 04021019. [Google Scholar] [CrossRef]
  14. Stefanizzi, M.; Capurso, T.; Balacco, G.; Binetti, M.; Torresi, M.; Camporeale, S.M. Pump as Turbine for Throttling Energy Recovery in Water Distribution Networks. AIP Conf. Proc. 2019, 2191, 020142. [Google Scholar]
  15. Alberizzi, J.C.; Renzi, M.; Nigro, A.; Rossi, M. Study of a Pump-as-Turbine (PaT) Speed Control for a Water Distribution Network (WDN) in South-Tyrol Subjected to High Variable Water Flow Rates. Energy Procedia 2018, 148, 226–233. [Google Scholar] [CrossRef]
  16. Creaco, E.; Walski, T. Economic Analysis of Pressure Control for Leakage and Pipe Burst Reduction. J. Water Resour. Plan. Manag. 2017, 143, 04017074. [Google Scholar] [CrossRef]
  17. ABB (Asea Brown Boveri). ABB Industrial Drives Technical Catalogue; ABB: Zurich, Switzerland, 2007. [Google Scholar]
  18. Chapallaz, J.-M.; Eichenberger, P.; Fischer, G. Manual on Pumps Used as Turbines; Deutsche Gesellschaft fuer Technische Zusammenarbeit GmbH (GTZ): Eschborn, Germany, 1992. [Google Scholar]
  19. Fontana, N.; Marini, G. A Methodology to Assess Optimal Operation of a Prototype for Pressure Regulation and Hydropower Generation. J. Water Resour. Plan. Manag. 2021, 147, 04021088. [Google Scholar] [CrossRef]
  20. D.M. 04.07.2019; Incentivazione Dell’energia Elettrica Prodotta Dagli Impianti Eolici on Shore, Solari Fotovoltaici, Idroelettrici e a Gas Residuati Dei Processi Di Depurazione. Available online: https://www.gazzettaufficiale.it/eli/id/2019/08/09/19A05099/sg (accessed on 2 August 2022).
  21. Novara, D.; Carravetta, A.; McNabola, A.; Ramos, H.M. Cost Model for Pumps as Turbines in Run-of-River and In-Pipe Microhydropower Applications. J. Water Resour. Plan. Manag. 2019, 145, 04019012. [Google Scholar] [CrossRef]
  22. Saint-Gobain PAM Italia S.p.A Soluzioni Complete in Ghisa Sferoidale per Il Ciclo Idrico Integrato Apparecchiature Idrauliche. September 2021. Available online: https://www.pamline.it/sites/pamline_it/files/apparecchiature_idrauliche.pdf (accessed on 2 August 2022).
  23. Saidur, R.; Mekhilef, S.; Ali, M.B.; Safari, A.; Mohammed, H.A. Applications of Variable Speed Drive (VSD) in Electrical Motors Energy Savings. Renew. Sustain. Energy Rev. 2012, 16, 543–550. [Google Scholar] [CrossRef]
  24. De Marchis, M.; Fontanazza, C.M.; Freni, G.; Messineo, A.; Milici, B.; Napoli, E.; Notaro, V.; Puleo, V.; Scopa, A. Energy Recovery in Water Distribution Networks. Implementation of Pumps as Turbine in a Dynamic Numerical Model. Procedia Eng. 2014, 70, 439–448. [Google Scholar] [CrossRef] [Green Version]
  25. Marini, G.; Maio, M.; Di Menna, F.; Pugliese, F.; De Paola, F.; Fontana, N. Innovative Approach for Selection of Pump as Turbine in Water Distribution Network. Environ. Sci. Proc. 2022, 21, 25. [Google Scholar] [CrossRef]
Figure 1. Installation layouts considered for this study. Adapted with permission from [6], ASCE, 2021.
Water 15 02807 g001
Figure 2. Graphic interface of software tool HYPER v1.0.
Water 15 02807 g002
Figure 3. Flowchart of the procedure for using the software.
Water 15 02807 g003
Figure 4. Layout of the WDN considered for the application. Adapted with permission from [6], ASCE, 2021.
Water 15 02807 g004
Figure 5. Hourly time interval pattern of inflow discharge and head drop for each scenario. Adapted with permission from [6], ASCE, 2021.
Water 15 02807 g005
Figure 6. Dimensionless energy domain for LAY 1 (scenario 1 (a), scenario 2 (b), scenario 3 (c), scenario 4 (d)); LAY 2 (scenario 1 (e), scenario 2 (f), scenario 3 (g), scenario 4 (h)); LAY 3 (scenario 1 (i), scenario 2 (j), scenario 3 (k), and scenario 4 (l)).
Water 15 02807 g006
Figure 7. Domain and best pumps obtained for LAY1 (scenario 1 (a), scenario 2 (b), scenario 3 (c), scenario 4 (d)).
Water 15 02807 g007
Figure 8. Domain and best pumps obtained for LAY2 (scenario 1 (a), scenario 2 (b), scenario 3 (c), scenario 4 (d)).
Water 15 02807 g008
Figure 9. Domain and best pumps obtained for LAY3 (scenario 1 (a), scenario 2 (b), scenario 3 (c), scenario 4 (d)).
Water 15 02807 g009
Figure 10. Domain and best pumps obtained for LAY1 for each value of d (scenario 1 (a), scenario 2 (b), scenario 3 (c), and scenario 4 (d)).
Water 15 02807 g010
Table 1. Characteristics of the analysis’s scenarios. Adapted with permission from [6], ASCE, 2021.
ScenarioDemand PatternSource Head
S1SmoothLarge
S2PeakedLarge
S3SmootSmall
S4PeakedSmall
Table 2. Characteristic of the best PATs returned by domains.
ScenarioLay 1Lay 2Lay 3
QtbHtb e T EQtbHtb e T EQtbHtb e T E
(L/s)(m)(-)(kWh/Day)(L/s)(m)(-)(kWh/Day)(L/s)(m)(-)(kWh/Day)
S158.9572.500.80706.1379.25112.450.79696.3273.25108.000.81711.27
S2101.0069.050.54453.94175.2596.350.48405.03125.1093.400.55465.01
S358.9513.400.79129.4881.2521.400.78127.0474.1020.500.80130.65
S4101.0010.000.4153.89176.509.000.2937.60104.2511.400.4558.23
Table 3. Characteristics in the direct and reverse mode of best pumps in economic terms for all configurations.
LayoutScenarioPump ID Q P b (L/s) H P b
(m)
η P b (-) Q T b (L/s) H T b
(m)
N P V
(EUR)
e T
(-)
E
(kWh/Day)
LAY1S1e-NSC 80-250/45055.7561.370.8265.4778.10186,429.110.65565.42
S2e-NSC 100-200/55081.3355.470.8592.9767.8092,633.900.43365.69
S3e-NSC 125-250/7555.0711.380.8563.0113.935893.600.66108.17
S4\\\\\\\ \
LAY2S1e-NSC 80-250/37054.4251.680.8164.6766.95155,113.540.56490.73
S2e-NSC 150-400/550115.5035.410.84132.2943.4024,758.570.28232.81
S3\\\\\\\ \
S4\\\\\\\ \
LAY3S1e-NSC 80-250/55058.8470.330.8268.7688.85167,927.100.66576.86
S2e-NSC 100-200/55081.3355.470.8592.9767.8071,636.760.43366.60
S3e-NSC 125-250/7555.0711.380.8563.0113.9343.220.65106.83
S4\\\\\\\ \
Disclaimer/Publisher’s Note: The statements, opinions and data contained in all publications are solely those of the individual author(s) and contributor(s) and not of MDPI and/or the editor(s). MDPI and/or the editor(s) disclaim responsibility for any injury to people or property resulting from any ideas, methods, instructions or products referred to in the content.