Article

Effects of Soil Particle Structure on the Distribution and Transport of Soil Water and Salt

1
Institute of Hydrogeology and Environmental Geology, Chinese Academy of Geological Sciences, Shijiazhuang 050061, China
2
Key Laboratory of Groundwater Sciences and Engineering, Ministry of Natural Resources, Shijiazhuang 050061, China
*
Author to whom correspondence should be addressed.
Water 2023, 15(15), 2842; https://doi.org/10.3390/w15152842
Submission received: 7 July 2023 / Revised: 1 August 2023 / Accepted: 3 August 2023 / Published: 6 August 2023

Abstract

:
Unsaturated zones are critical for water and material exchange between groundwater and surface ecosystems. Understanding the migration patterns of soil water and salts in these zones can offer theoretical support for maintaining the equilibrium between groundwater and surface ecosystems in Northwestern China’s salinized regions. This study explores the correlation between soil particle composition and soil water and salt distribution at a test site in the lower reaches of the Shiyang River basin. It analyzes the way in which water and salt patterns vary with different soil structures over various timescales. The results indicate that lithological profiles with similar structures but varying fine particle contents exhibit distinct water–salt variation patterns. Higher fine particle content leads to increased water and total dissolved solid content, but a decreased infiltration rate. When the middle layer has the highest fine content, soil evaporation is partially inhibited. The more complex the lithologic structure, the less effective irrigation is in leaching salt. However, when the lithologic structure remains constant, fine particle content has minimal impact on salt leaching.

1. Introduction

Ecosystems in the arid regions of Northwestern China heavily rely on groundwater due to limited water resources [1,2]. Nevertheless, unsustainable groundwater usage results in emerging ecological issues, including the salinization of shallow groundwater, soil salinization and desertification [3,4,5,6]. A key solution to these issues is balancing groundwater and ecosystems [7,8,9,10,11]. The unsaturated zone is an important zone for material and energy exchange between surface water, groundwater and ecological vegetation [12,13,14,15]. Surface water percolates into these zones to replenish groundwater, while groundwater enters unsaturated zones via evaporation and capillarity. Soil-stored water supports surface vegetation growth [16,17,18,19,20], making the distribution and migration of water and salt in the unsaturated zone an essential research topic. Multiple factors, including groundwater level, temperature, irrigation and vegetation, affect the water and salt distribution in unsaturated zones [21,22,23,24,25,26]. Additionally, soil structure is a crucial influencing factor. Previous research has explored the relationship between soil lithology and water and salt distribution in unsaturated zones. Soil layers significantly impact the vertical movement of water and salt in unsaturated zones [27,28,29,30], with lithological boundaries obstructing downward water movement, regardless of soil particle size [31]. As Zhao et al. [31] demonstrated, the clay layer in the layered structure acts as a semi-permeable barrier to salt movement, while water more easily passes through. Yu et al. [32] noted that unsaturated zones with homogeneous soil structures show higher cumulative rainfall infiltration than those with an upper-coarse and lower-fine layered structure, with lower infiltration rates corresponding to finer particles in the lower soil layer. Hu et al. [33] found that soil interlayer thickness and position significantly impact soil infiltration.
It can be concluded from the studies mentioned above that researchers usually classify unsaturated zone profiles based on soil lithological structures in research into soil water and salt. In most cases, this division method can provide a rational explanation for the variations in soil water and salt. However, in areas with shallow groundwater and single-lithology soils, such as the lower reaches of the Shiyang River basin, it has been found that adjacent unsaturated zone profiles exhibit similar lithological structures but different soil water and salt variation patterns. Since these profiles possess roughly identical external conditions due to close proximity, their different soil water and salt variation patterns definitely depend on the soils themselves. Furthermore, the soil particle composition serves as a basis for classifying soil lithology, given that the same lithology might exhibit different soil particle compositions [34]. Particle content variance in soils leads to significantly different soil properties [35,36], affecting water movement and solute migration [37,38]. Soils with smaller particles possess larger surface areas and, thus, have greater water-holding and adsorption capacity, albeit at a slower infiltration rate [39,40]. Moreover, the content of fine particles significantly influences soil infiltration [41,42].
Based on the previous studies, it is found that when the soil lithology structure is complex, the lithology division can accurately describe the structure of the vadose zone. However, the groundwater in the downstream part of the arid area is shallow, and the thickness of the vadose zone is small. The traditional lithology division scheme struggles to accurately describe the structure of the vadose zone and cannot explain the difference between water and salt migration in different zones, which is mainly related to the content of fine particles in different horizons. But, there is insufficient research into the influence of fine grain content and structure on water and salt changes. Therefore, relevant experiments are carried out in the test site of the lower reaches of Shiyang River, and the main research contents are the following aspects: (1) the unsaturated zone profiles with different fine grain contents and structures in the study area were selected for on-site monitoring of soil water and salt changes; (2) analyzing and comparing the soil water and salt variations between different profiles from various timescales; and (3) analyzing the relationships between soil water and salt variations and soil particle variation in different profiles.

2. Materials and Methods

2.1. Overview of the Study Area

The test site, which was positioned at the farmland–desert junction in the lower reaches of the Shiyang River basin (38°06′2.4″ N, 103°20′1.0″ E), experiences an arid climate. The annual average rainfall and evaporation are 123.60 mm and 2063.50 mm, respectively. The farmland mainly cultivates maize and helianthus annuus, while the desert vegetation primarily consists of Tamarix ramosissima, Kalidium foliatum and Phragmites australis [43]. Borehole data indicate clay dominance in soils at depths of 8–10 m below the surface. Consequently, the aquifer in the study area is divided into upper and lower layers. The phreatic water in the upper layer experiences salinization due to high evaporation, with total dissolved solid (TDS) content in the range of 6–9 g/L. In contrast, the lower layer, which is the primary freshwater exploitation layer, contains a TDS content of 0.5–2 g/L.

2.2. Test Design

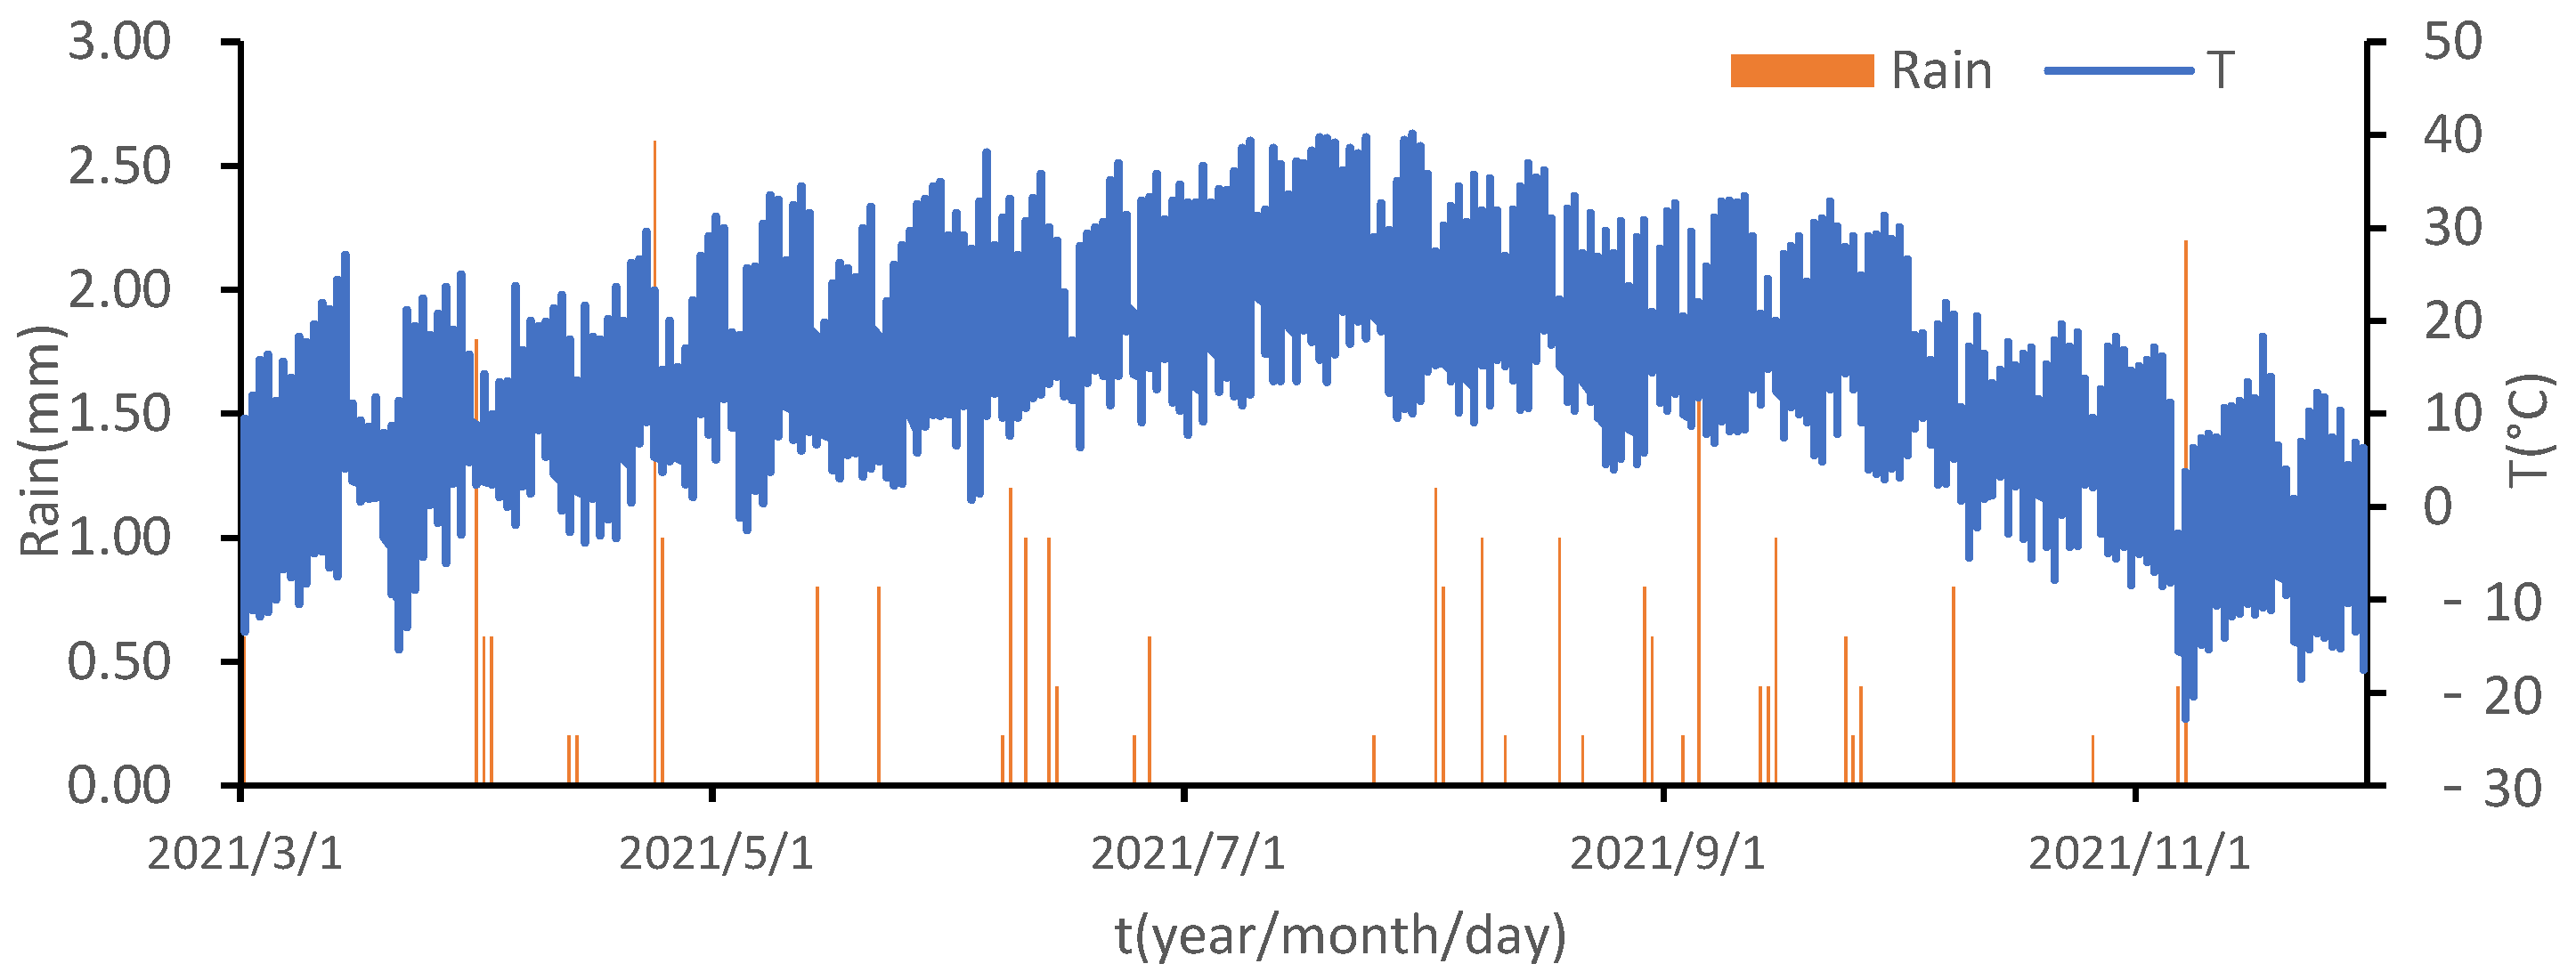
The test site generally features a gentle terrain, with the annual phreatic water level varying in the range of 1.5–2.3 m. Three unsaturated zone profiles (A, C and D) at a depth of 1.5 m were selected in the farmland for monitoring, with a distance of around 50 m between each site (Figure 1). A small-scale meteorological station was available at the test site, and the precipitation and temperature variations monitored are shown in Figure 2. Soil samples were collected from each profile at depths of 10 cm, 20 cm, 40 cm, 60 cm, 90 cm, 120 cm, and 150 cm for soil particle testing via the sieving method. Soil particle sizes sieved were divided into five intervals, with the smallest sieving particle size being 0.075 mm. Given the significant impact of fine soil particles on soil water content (SWC) and soil infiltration, this study focused on comparing the content of particles with sizes less than 0.075 mm (fine particle content). Table 1, Table 2 and Table 3 present the soil particle compositions of the three profiles, which were dominated by silty soils and sands. Corresponding to the sampling depths, soil monitoring devices were installed in each unsaturated zone profile to track the real-time variations in soil water and salt from March 2021 to November 2021 at a 30-min frequency. It is noteworthy that the inherent properties of soils also include their mineral composition and chemical properties. The mineral and organic components of soils, which are hydrophilic and hydrophobic in nature, play a role in the adsorption and exchange in soil salts. However, the soil water migration in unsaturated zones is primarily driven by water potential and temperature potential, which are significantly higher than the suction or repulsion of mineral or organic components for soil water. Furthermore, Wang [44] proposed that, although soil properties affect soil infiltration, the chemical properties of soils have a minor impact on SWC. In addition, this study focused on the TDS content rather than a specific salt. Despite adsorption and exchange, salts still remained in soils or soil pore water, imposing a minor impact on the TDS content. Therefore, the mineral composition and chemical components of soils were not considered in this study.

2.3. Data Acquisition

5TE soil sensors and CR1000 dataloggers (made in METER Company, Pullman City, WA, USA) were used for in situ real-time monitoring and logging of the SWC, temperature, and electrical conductivity (EC) of soils in the unsaturated zones. Horizontal insertion of the 5TE soil sensor into the soil profiles caused no harm to the surrounding soils, hence delivering more accurate measurement results. Using a 70-megahertz oscillator, the 5TE soil sensor yielded the soil’s dielectric constant, from which the volumetric water content (VWC) could be calculated using an empirical equation. The sensor offered high measurement precision in soils with VWC less than 50%, notably in light sandy soil and loam. However, it produced high measurement errors in soils with VWCs greater than 50%, necessitating correction of the VWC data.
The dielectric constant could be used to calculate VWC given the strong correlation between them [45]. The relationship between VWC and dielectric constant is expressed as a cubic equation in the common empirical formula, which is used as the working principle of relevant monitoring devices. Therefore, VWC was calculated by constructing regression curve equations using measured VWC values and dielectric constants. The test site soils consisted of silty soils, silty sands, and fine sands, as per soil testing results. These soil types were each sampled thrice using a cutting ring, with their average dry bulk densities being calculated. The dried, pulverized and sieved soil sample was compacted into a plastic bucket. A specific amount of water was then added and evenly mixed with the soil before another compaction. A 5TE sensor measured the dielectric constant, and VWC was obtained by drying the soil sample in the bucket. This process was repeated for the soil samples with three lithologies until the regression curve equations of the dielectric constant vs. VWC were constructed for the soils of three lithologies (Figure 3).
Traditionally, soil salinity is expressed using the EC of soil saturation extract. However, this method is not ideal for long-term observation due to its complex operation and the harm caused to the initial soil samples [46,47]. The 5TE sensor facilitates in situ soil salinity monitoring by characterizing it using the bulk EC of the surrounding soil measured via a dual-electrode array. The pore water salinity of soils, which mostly directly affects vegetation growth, is challenging to extract. Commonly, the Temionic ceramic cup sampler is used for extraction, which is time-consuming and requires high SWC. Based on the Hilhorst model [48], the pore water EC (pore EC) can be estimated using the dielectric constants, and bulk EC can be measured via the 5TE sensor.
σ p = ε p σ b ε b ε 0 ( θ > 0.1 % )
ε p = 80.3 0.37 × ( T soil 20 )
where σp is the pore EC (ms·cm−1), σb is the bulk EC (ms·cm−1), θ is the volumetric moisture content (%), εb is the volumetric dielectric constant and ε0 is the dielectric constant at σb = 0. The value of ε0 is 6, according to the dielectric constant value output using the 5TE sensor at σb = 0. Furthermore, εp is the dielectric constant of pore water, and Tsoil is the soil temperature (°C).
Overall, the general test process in this study was as follows: (1) three suitable profiles were selected at the test site; (2) for each profile, samples were collected, and monitoring devices were installed at the design depths; (3) the soil particle contents of the samples were determined, and the calibration tests of VWC and dielectric constant were conducted; (4) the VWC and soil EC of the soil samples were calculated using the calibration equations; (5) the variations in SWC and soil EC were analyzed using different timescales; and (6) the relationships between soil particle content and variations in soil water and salt were analyzed.

3. Results and Analysis

3.1. Distribution of VWC

(1) Distribution of annual average VWC (from March to November)
To understand the normal distribution of VWC across various soil profile horizons, we calculated the average VWC of each profile from March to November. Figure 4 illustrates that for profile A, the VWC increased with a depth up to 120 cm, whereas the VWC of profiles C and D fluctuated with a depth up to 120 cm. The VWC peaked at a depth of 120 cm for profiles A and C, displaying a notable difference from the VWC at 150 cm. For profile D, the VWC within a depth 60 cm significantly exceeded that at a depth below 90 cm, with the latter factor slowly increasing with depth.
(2) Distribution of monthly average VWC
Figure 5 depicts the fluctuations in VWC at different depths across the three profiles from March to November. Darker areas symbolize higher VWC, while denser contours that form more enclosed circles indicate more pronounced changes in VWC. The VWC of the three profiles displayed more substantial variations from May to September than during other months. Marked VWC changes transpired above depths of 120 cm, 90 cm and 70 cm in profiles A, C and D, respectively. These variations spanned three periods: the pre-irrigation period (March–April), the irrigation period (May–September), and the post-irrigation period (October–November). In the pre-irrigation period, the soils, being dry due to low water content, exhibited a gradual increase in VWC as the frozen soils thawed due to rising temperatures. During the irrigation period, the VWC surged after each irrigation treatment and then swiftly declined due to intense evaporation, showing a marked change. During the post-irrigation period, the relatively high VWC induced via irrigation rapidly decreased under intense evaporation and then significantly decelerated.
(3) Distribution of VWC during the irrigation period
The VWC of the each of the three profiles from May to September was evaluated due to its significant fluctuations during the irrigation period. The profiles underwent nine irrigations from May to September, with the irrigation time shown in Figure 6. They were simultaneously irrigated, with each irrigation lasting for one hour at a water flow of 60 m3. The VWC of the three profiles responded positively to irrigation at depths of less than 90 cm, displaying pronounced serrated fluctuations. Conversely, the VWC responded mildly to irrigation at depths greater than 120 cm due to the nearly saturated soil near the groundwater table. As shown by the VWC curves, the VWC rapidly increased and then swiftly decreased during the nine irrigations. This finding suggests that the irrigation water penetrated into the soil quickly, followed by evaporation until the next irrigation event.
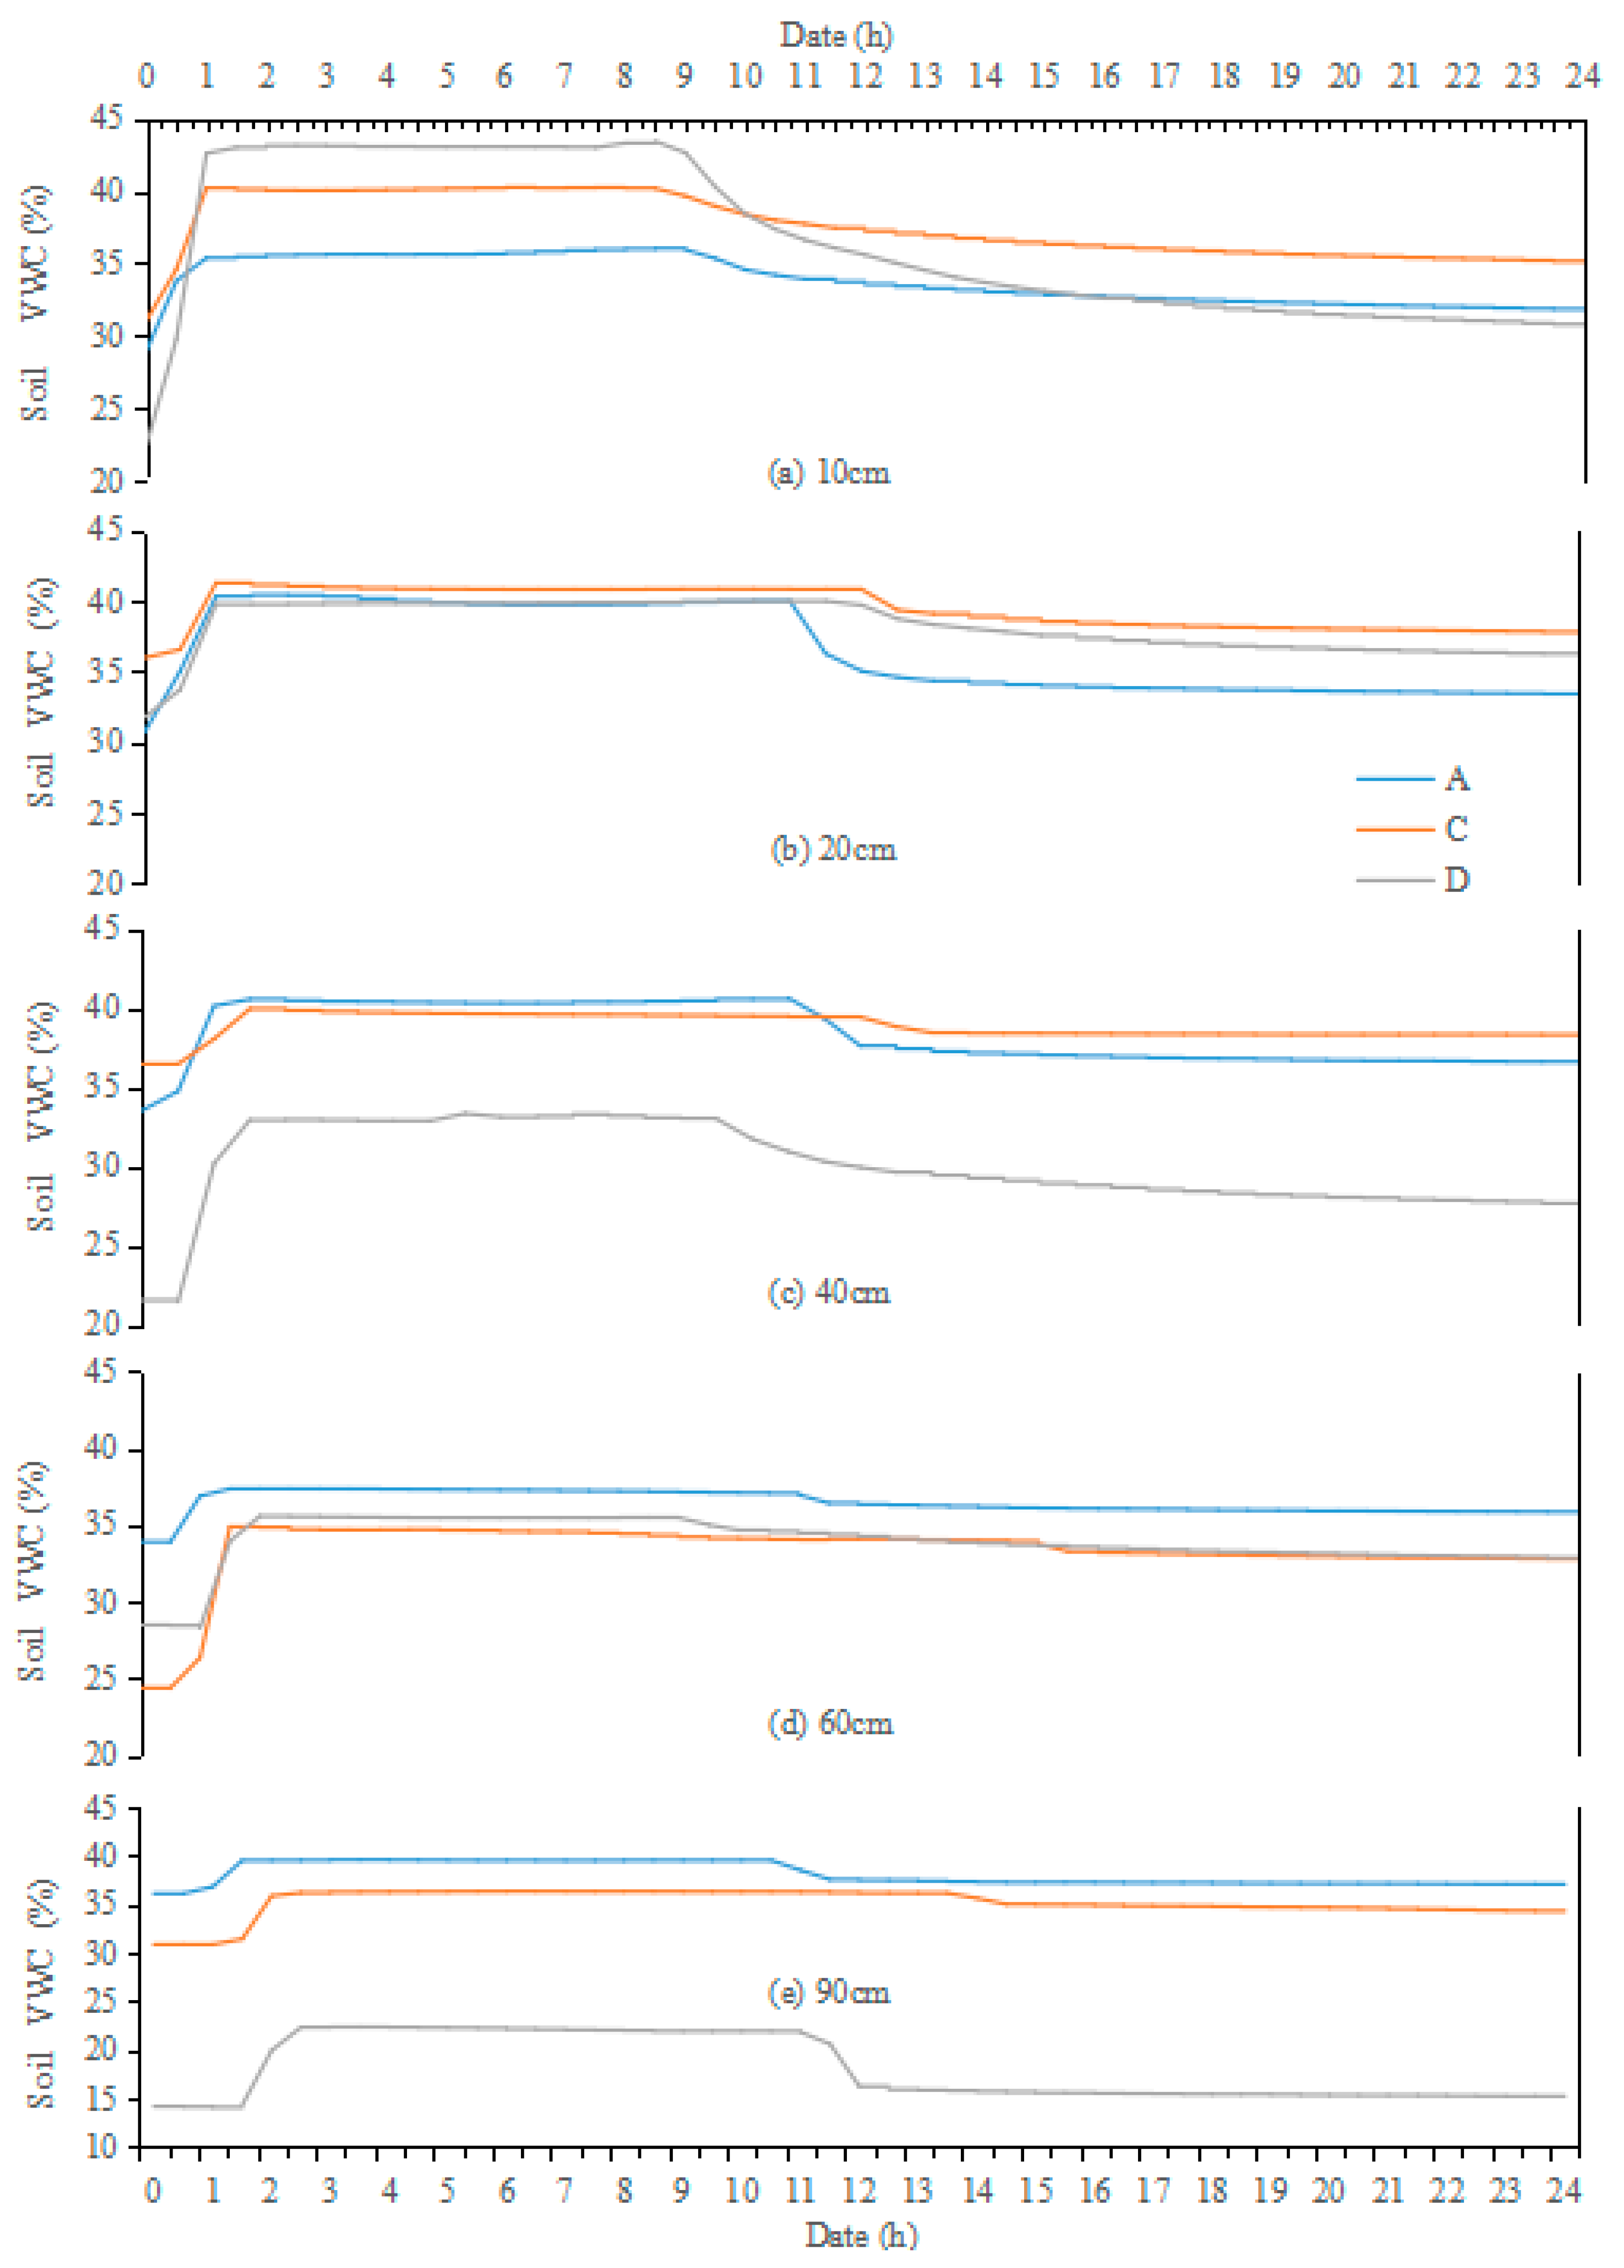
During the irrigation period, the VWC at depths of less than 90 cm showed significant fluctuations, and the irrigation water infiltrated the soil in a short time. Given this fact, statistics were made for the variations in VWC within 24 h after each irrigation at depths of less than 90 cm in the soil profiles. As per Figure 7, the VWC swiftly achieved saturation after irrigation, sustained it for several hours, and then rapidly decreased as water drained under gravity. As the VWC gradually fell, the gravitational water ceased to be a factor, and the VWC slowly decreased due to evaporation. Half an hour after irrigation, the VWC exhibited an upward trend at depths of less than 40 cm in profile A, whereas this trend occurred at depths of only less than 20 cm in profiles C and D. One hour after irrigation, VWC trended upward at depths of 90 cm and 60 cm in profiles A and C, respectively, and at a depths of less than 40 cm in profile D. One and a half hours after irrigation, the VWC showed an upward trend at depths of 90 cm and 60 cm in profiles C and D, respectively. Two hours after irrigation, VWC trended upward at a depth of 90 cm in profile D. The increasing VWC at a horizon denotes the irrigation water’s infiltration into this horizon. Therefore, profile A demonstrated the fastest infiltration rate in soils at depths of less than 90 cm, followed sequentially by profiles C and D.

3.2. Distribution of Soil EC

(1) Distribution of annual average soil EC (March–November)
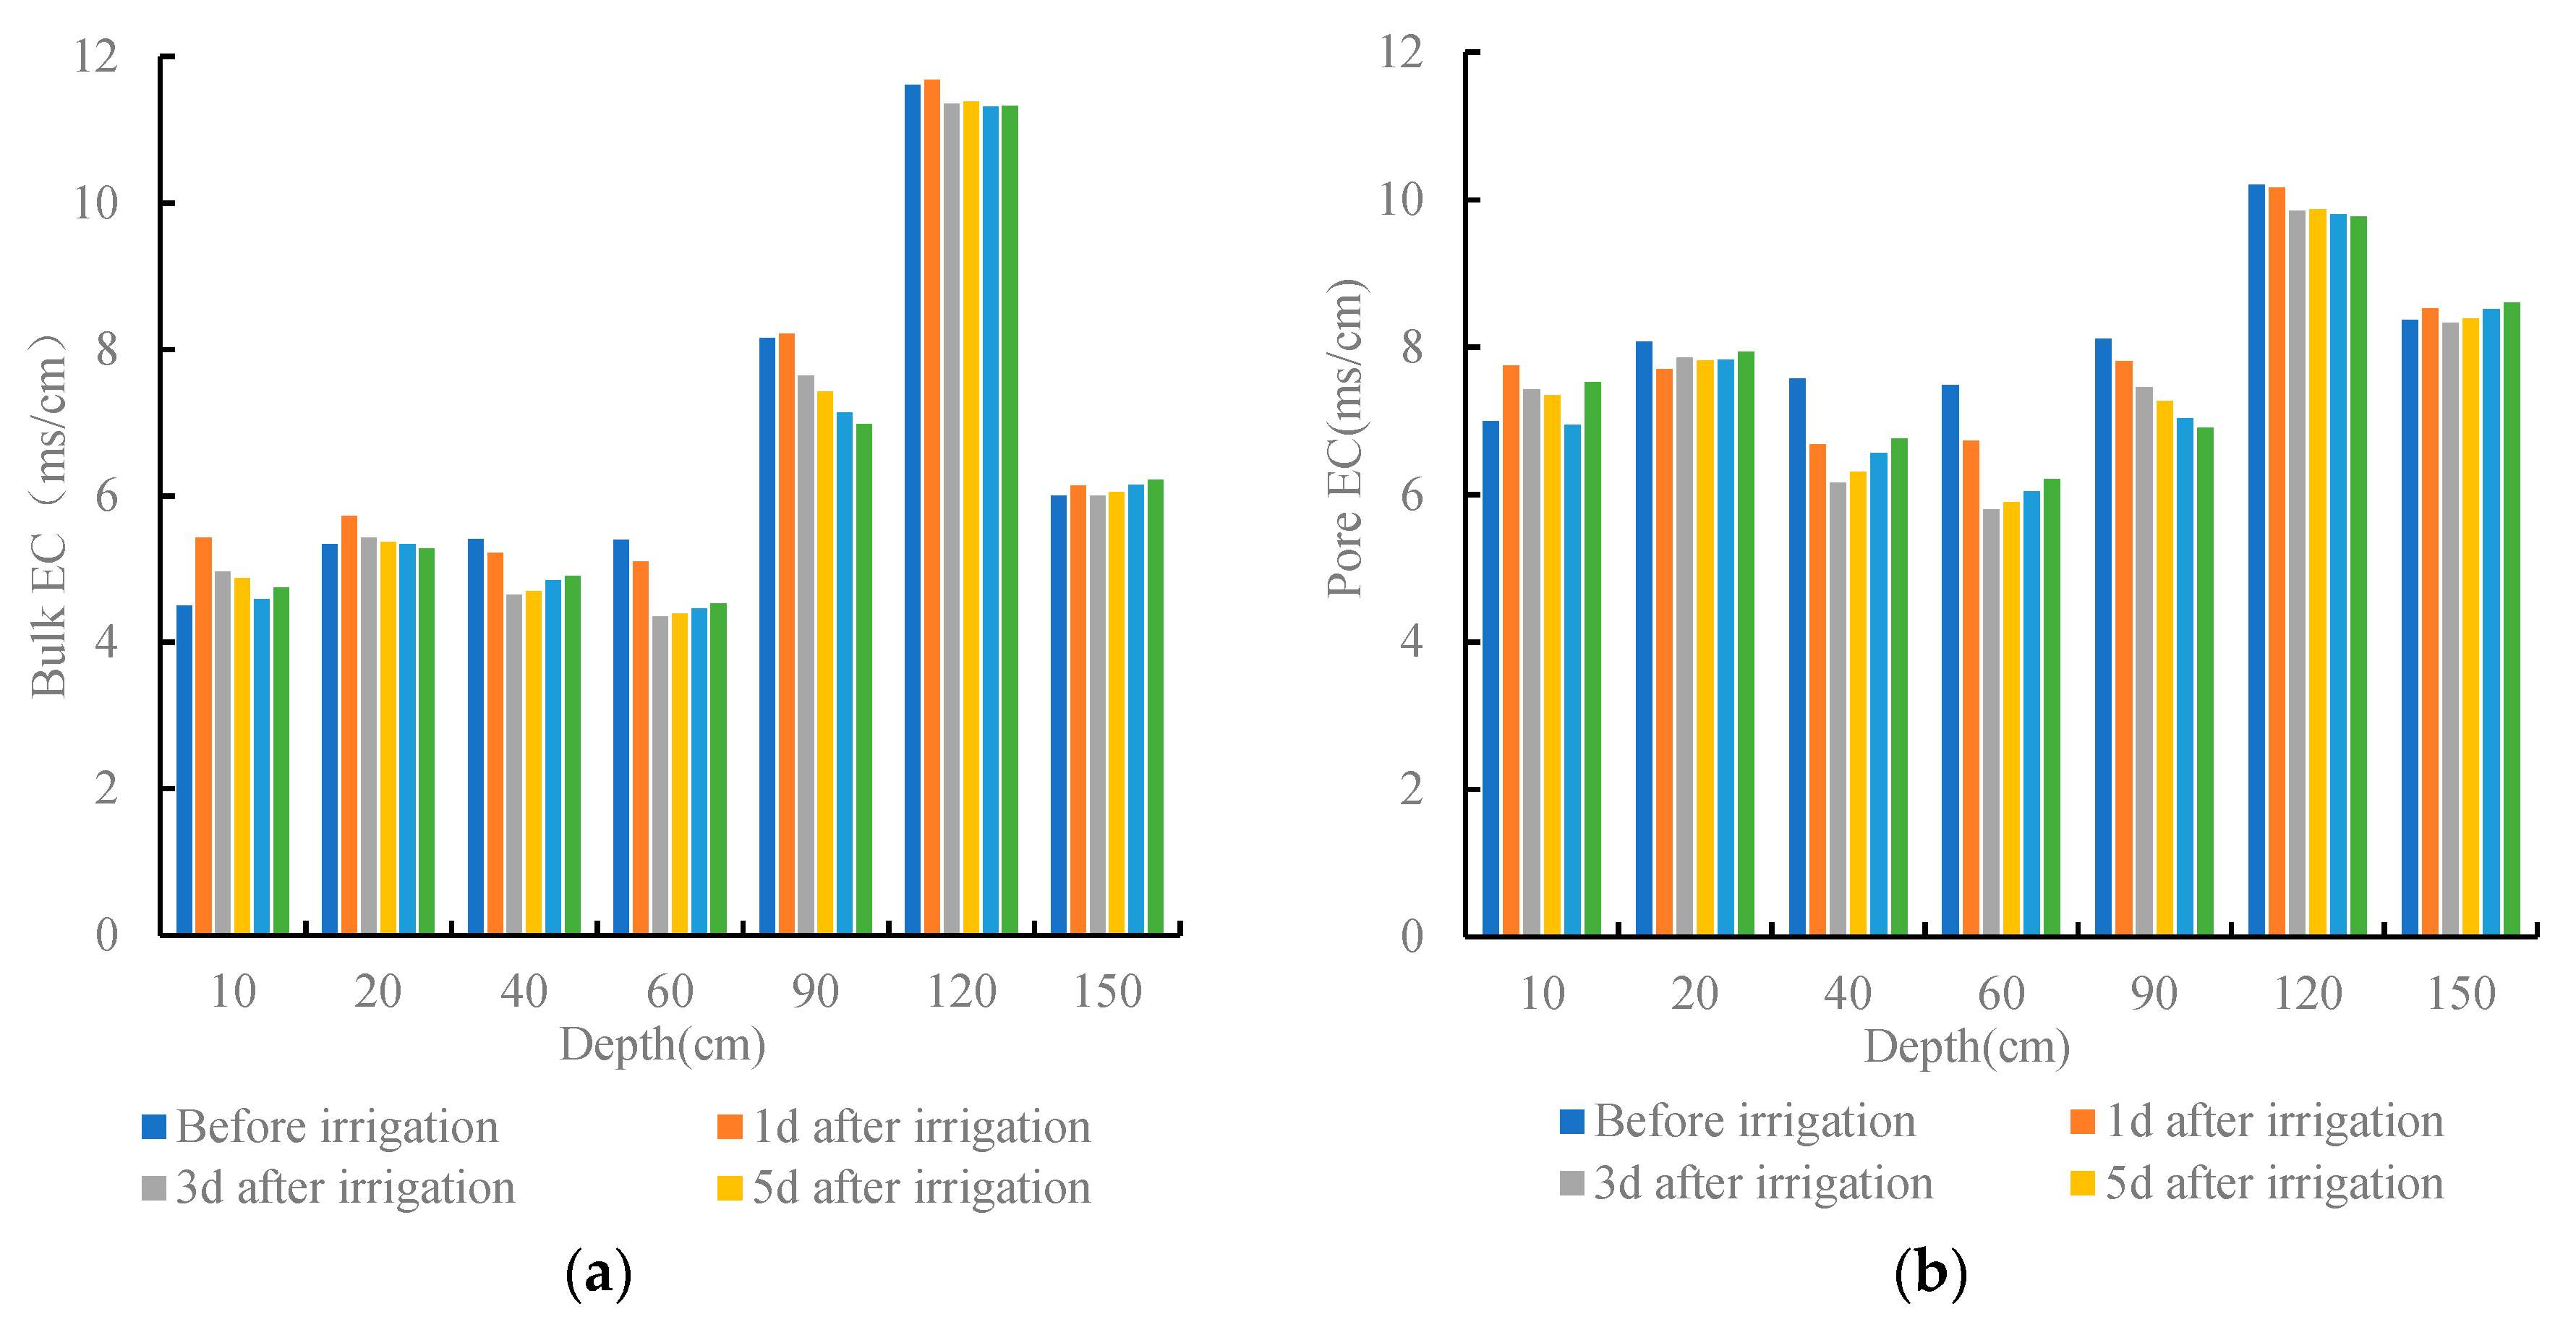
This study calculated the average bulk EC and pore EC of various soil profiles from March to November in Figure 8. The bulk EC was marginally different at depths of less than 60 cm in the three profiles. For profiles A and C, the bulk EC was higher at depths greater than 90 cm than at depths of less than 90 cm, reaching its maximum at 120 cm. However, more substantial differences were observed in bulk EC at depths greater than 90 cm in profile A than in profile C. For profile D, the bulk EC varied minimally at most depths, except at 120 cm, where the bulk EC was small. The pore EC curves of profiles A and D mirrored their bulk EC curves, while the pore EC curve of profile C contradicted its bulk EC curve at depths in the range of 40–90 cm. Soil Pore EC was related to both soil Bulk EC and VWC. Although profile C demonstrated low bulk EC at a depth of 60 cm, its VWC was also low, as shown in Figure 4, resulting in a high pore EC at this depth.
(2) Variations in soil EC during the irrigation period
Given that soil salts primarily move with water, this study compared the EC of the three profiles during the irrigation period. Figure 9 illustrates the bulk EC curves of this period. As per this figure, the variations in bulk EC mirrored those of VWC, showing an active response to irrigation. The bulk EC rose sharply after irrigation and then swiftly decreased, indicating significant serrated changes. For the three profiles, the bulk EC presented a mild downward trend at depths of less than 120 cm and increased slowly at a depth of 150 cm. Generally, soil salts underwent significant leaching, continuously moving downward with the irrigation water.
In cases of minor variations in VWC, both pore EC and bulk EC showed analogous changes. As depicted in Figure 6, the VWC varied significantly at depths of less than 90 cm. Consequently, the weighted averages of pore EC and bulk EC above this depth were calculated and utilized as indicators of salinity changes in shallow soils. As Figure 10 demonstrates, both pore EC and bulk EC exhibited an overall downward trend as irrigation began. After August, the bulk EC had slight variations, while soil pore EC showed an overall upward trend. Specifically, for profiles A and D, pore EC decreased rapidly after irrigation and then continuously increased until the next irrigation. This pattern resulted from the alternating effect of irrigation and evapotranspiration on shallow soils.
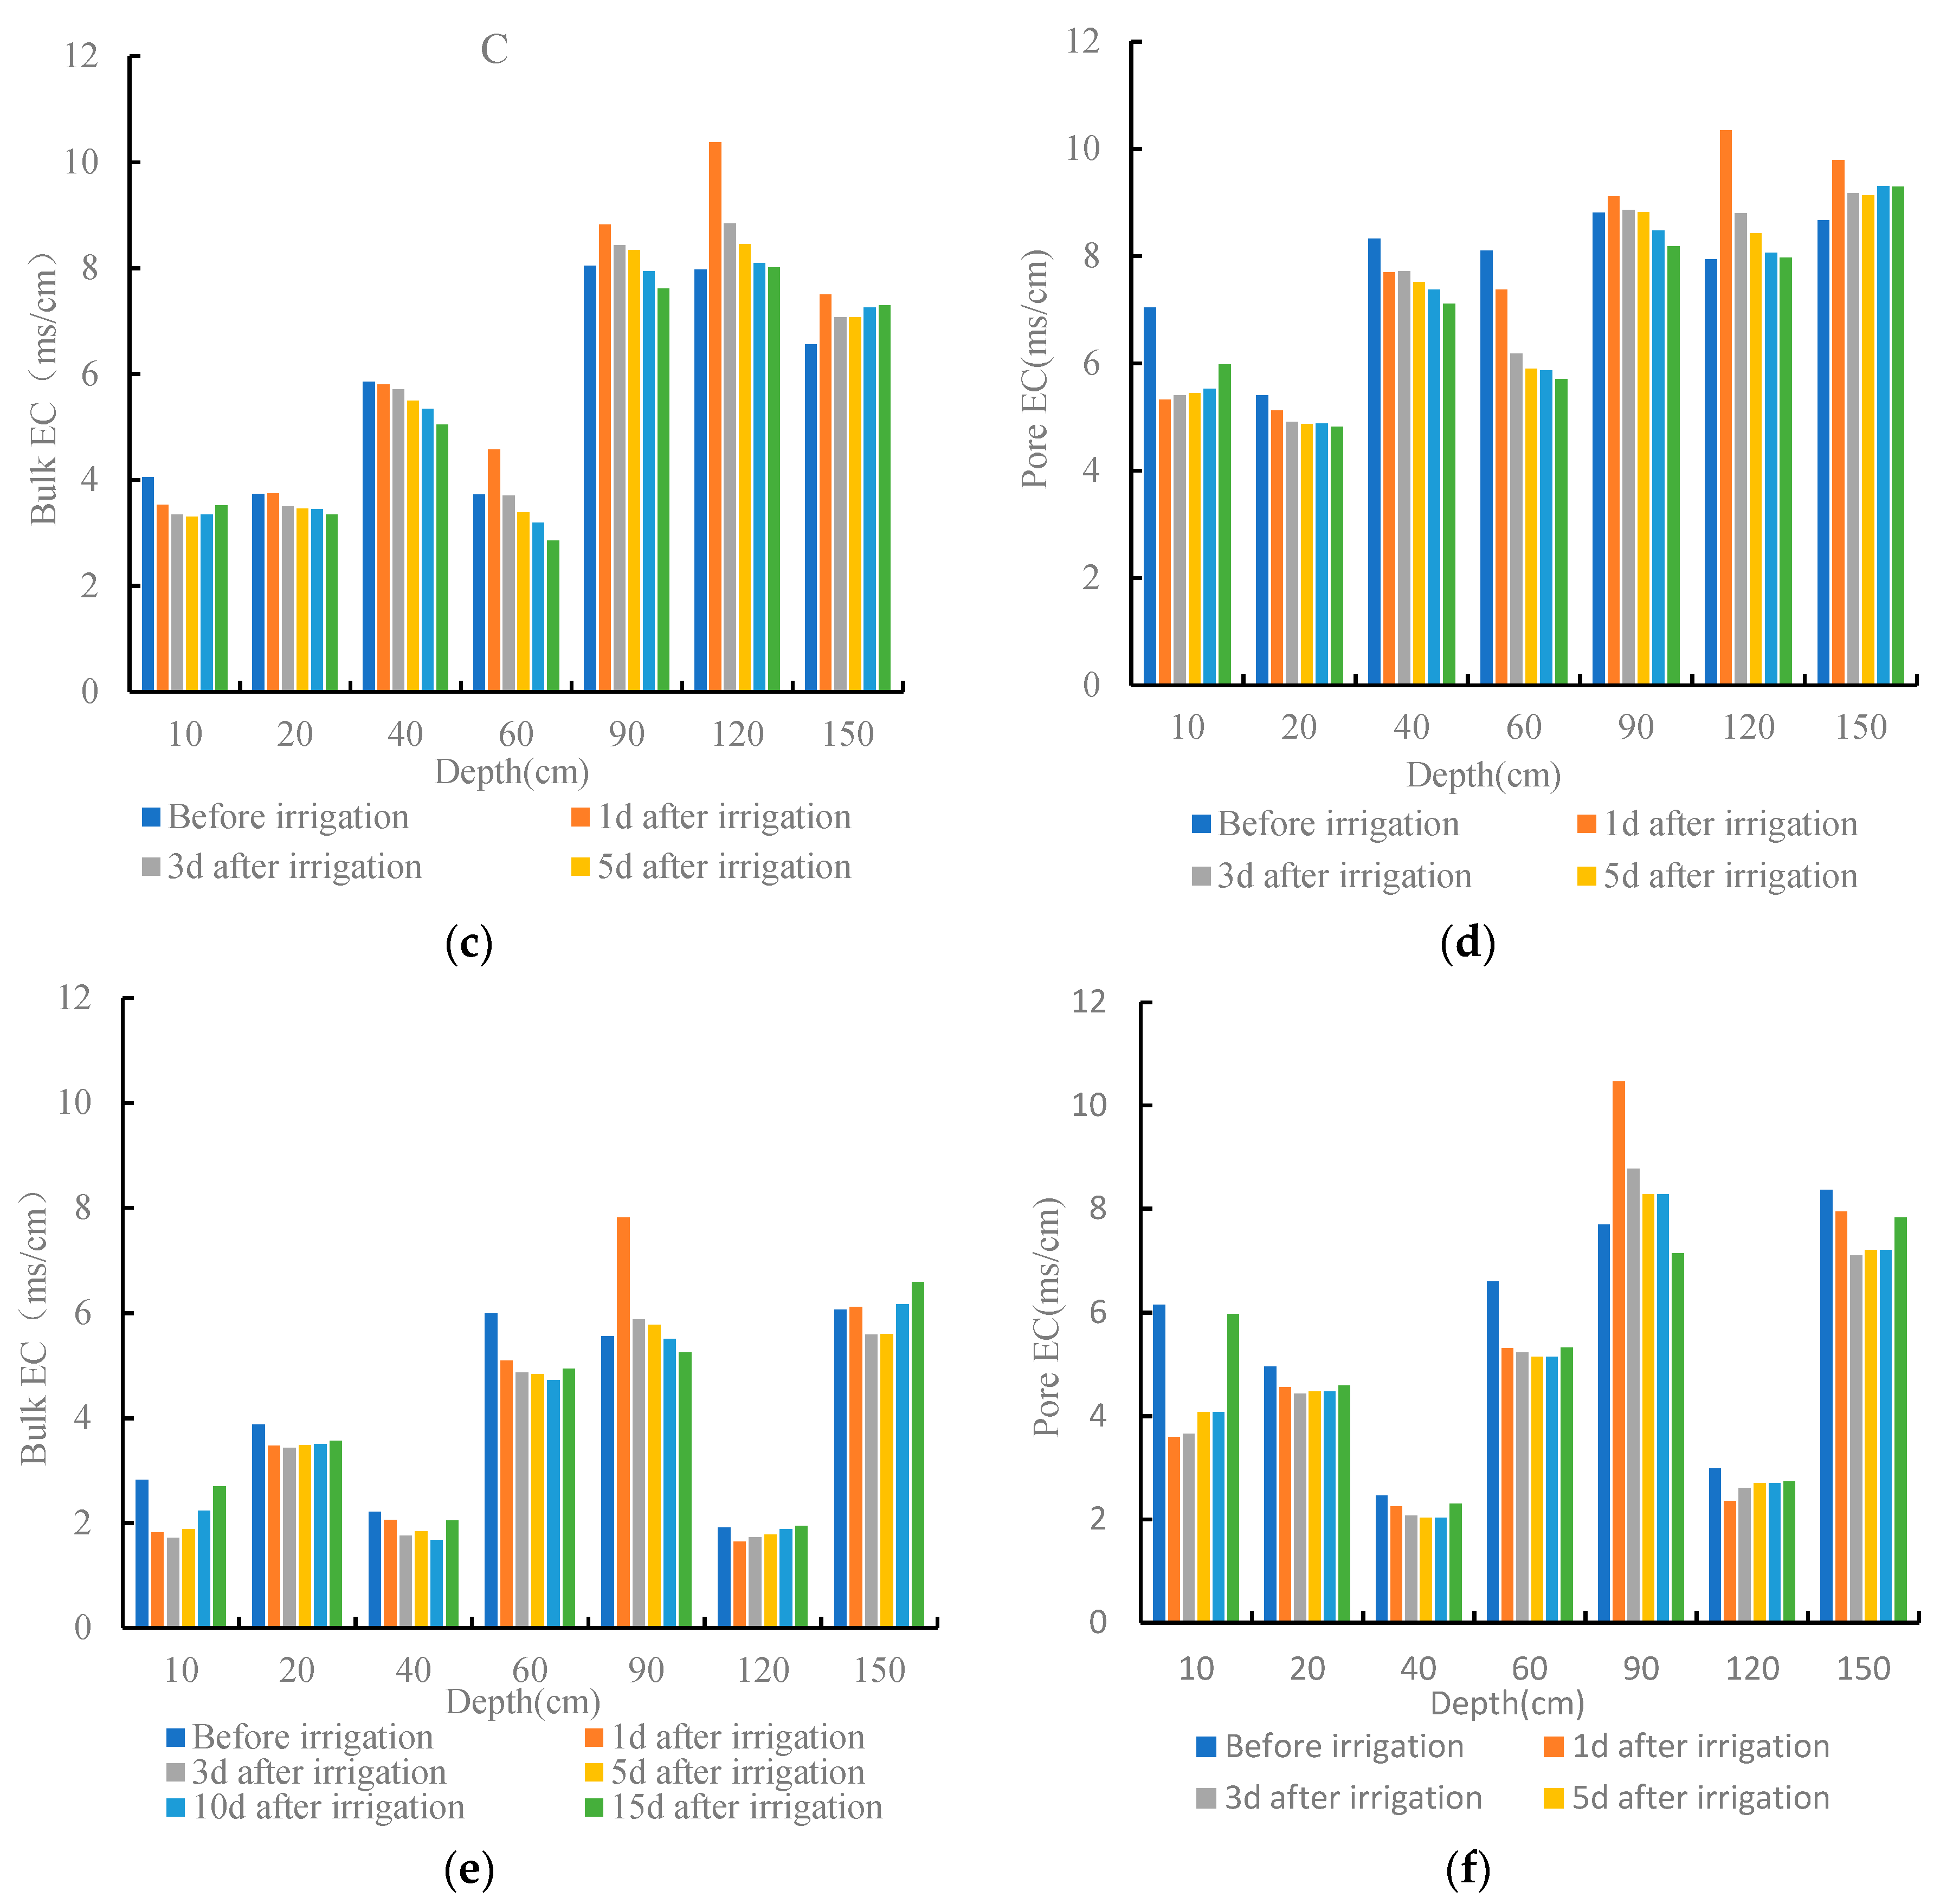
Regarding changes in soil salts, the soil in the study area primarily underwent salt leaching caused by irrigation and salt accumulation in surface soils under evaporation. This study performed a detailed analysis of soil EC variations at an irrigation interval (between two irrigation events). As shown in Figure 11, bulk EC and pore EC generally exhibited similar variations. One day after irrigation, salts migrated downwards with the irrigation water, decreasing the TDS content in shallow soils, and the bulk EC increased at a depth of 150 cm. Additionally, the bulk EC increased at depths of 10–20 cm in profile A, possibly due to the dissolution of surface soil salts via irrigation. The bulk EC also rose at depths of 60–120 cm in profile C and at a depth of 90 cm in profile D. This finding suggests that some salts accumulated in these horizons due to the infiltration of irrigation water. Some horizons saw an increase in bulk EC but a decrease in pore EC, such as at a depth of 20 cm in profile A and at a depth of 60 cm in profile C. Three-to-five days after irrigation, the bulk EC and pore EC of shallow soils slowly increased under strong evaporation.
Changes in pore EC induced via irrigation directly influence vegetation growth. Given that the vegetation’s taproot system is distributed at depths within 60 cm, and the three profiles share the same soil lithology of silty soils at these depths, this study calculated the weighted average of pore EC within a depth of 60 cm to determine variations in the pore EC of shallow soils. Figure 12 illustrates these variations (with pore EC before irrigation as the benchmark, and increases and decreases in pore EC expressed as positive and negative values, respectively). Less than one-to-two days after irrigation, the pore EC of shallow soils in the three profiles continuously decreased due to the infiltration of irrigation water. Three-to-four days post-irrigation, soil salinity was predominantly affected by evaporation. The pore EC of shallow soils in profiles A and D gradually increased due to evaporation, with the growth rate being higher in profile D than in profile A. This disparity is due to the low capillary water recharge and the continued concentration of shallow soil pore water under evaporation conditions in profile D. Despite the high capillary water recharge, profile A also demonstrated a continuous increase in the pore EC of shallow soils due to significant salt accumulation in surface soils. In contrast, profile C showed gently varying pore EC at the evaporation stage due to high capillary water recharge and insignificant salt accumulation in surface soils under evaporation.

3.3. Relationships between Soil Particle Structure and the Distribution of Soil Water and Salts

3.3.1. Relationship between Soil Particle Structure and the Annual Average Distribution of Soil Water and Salts

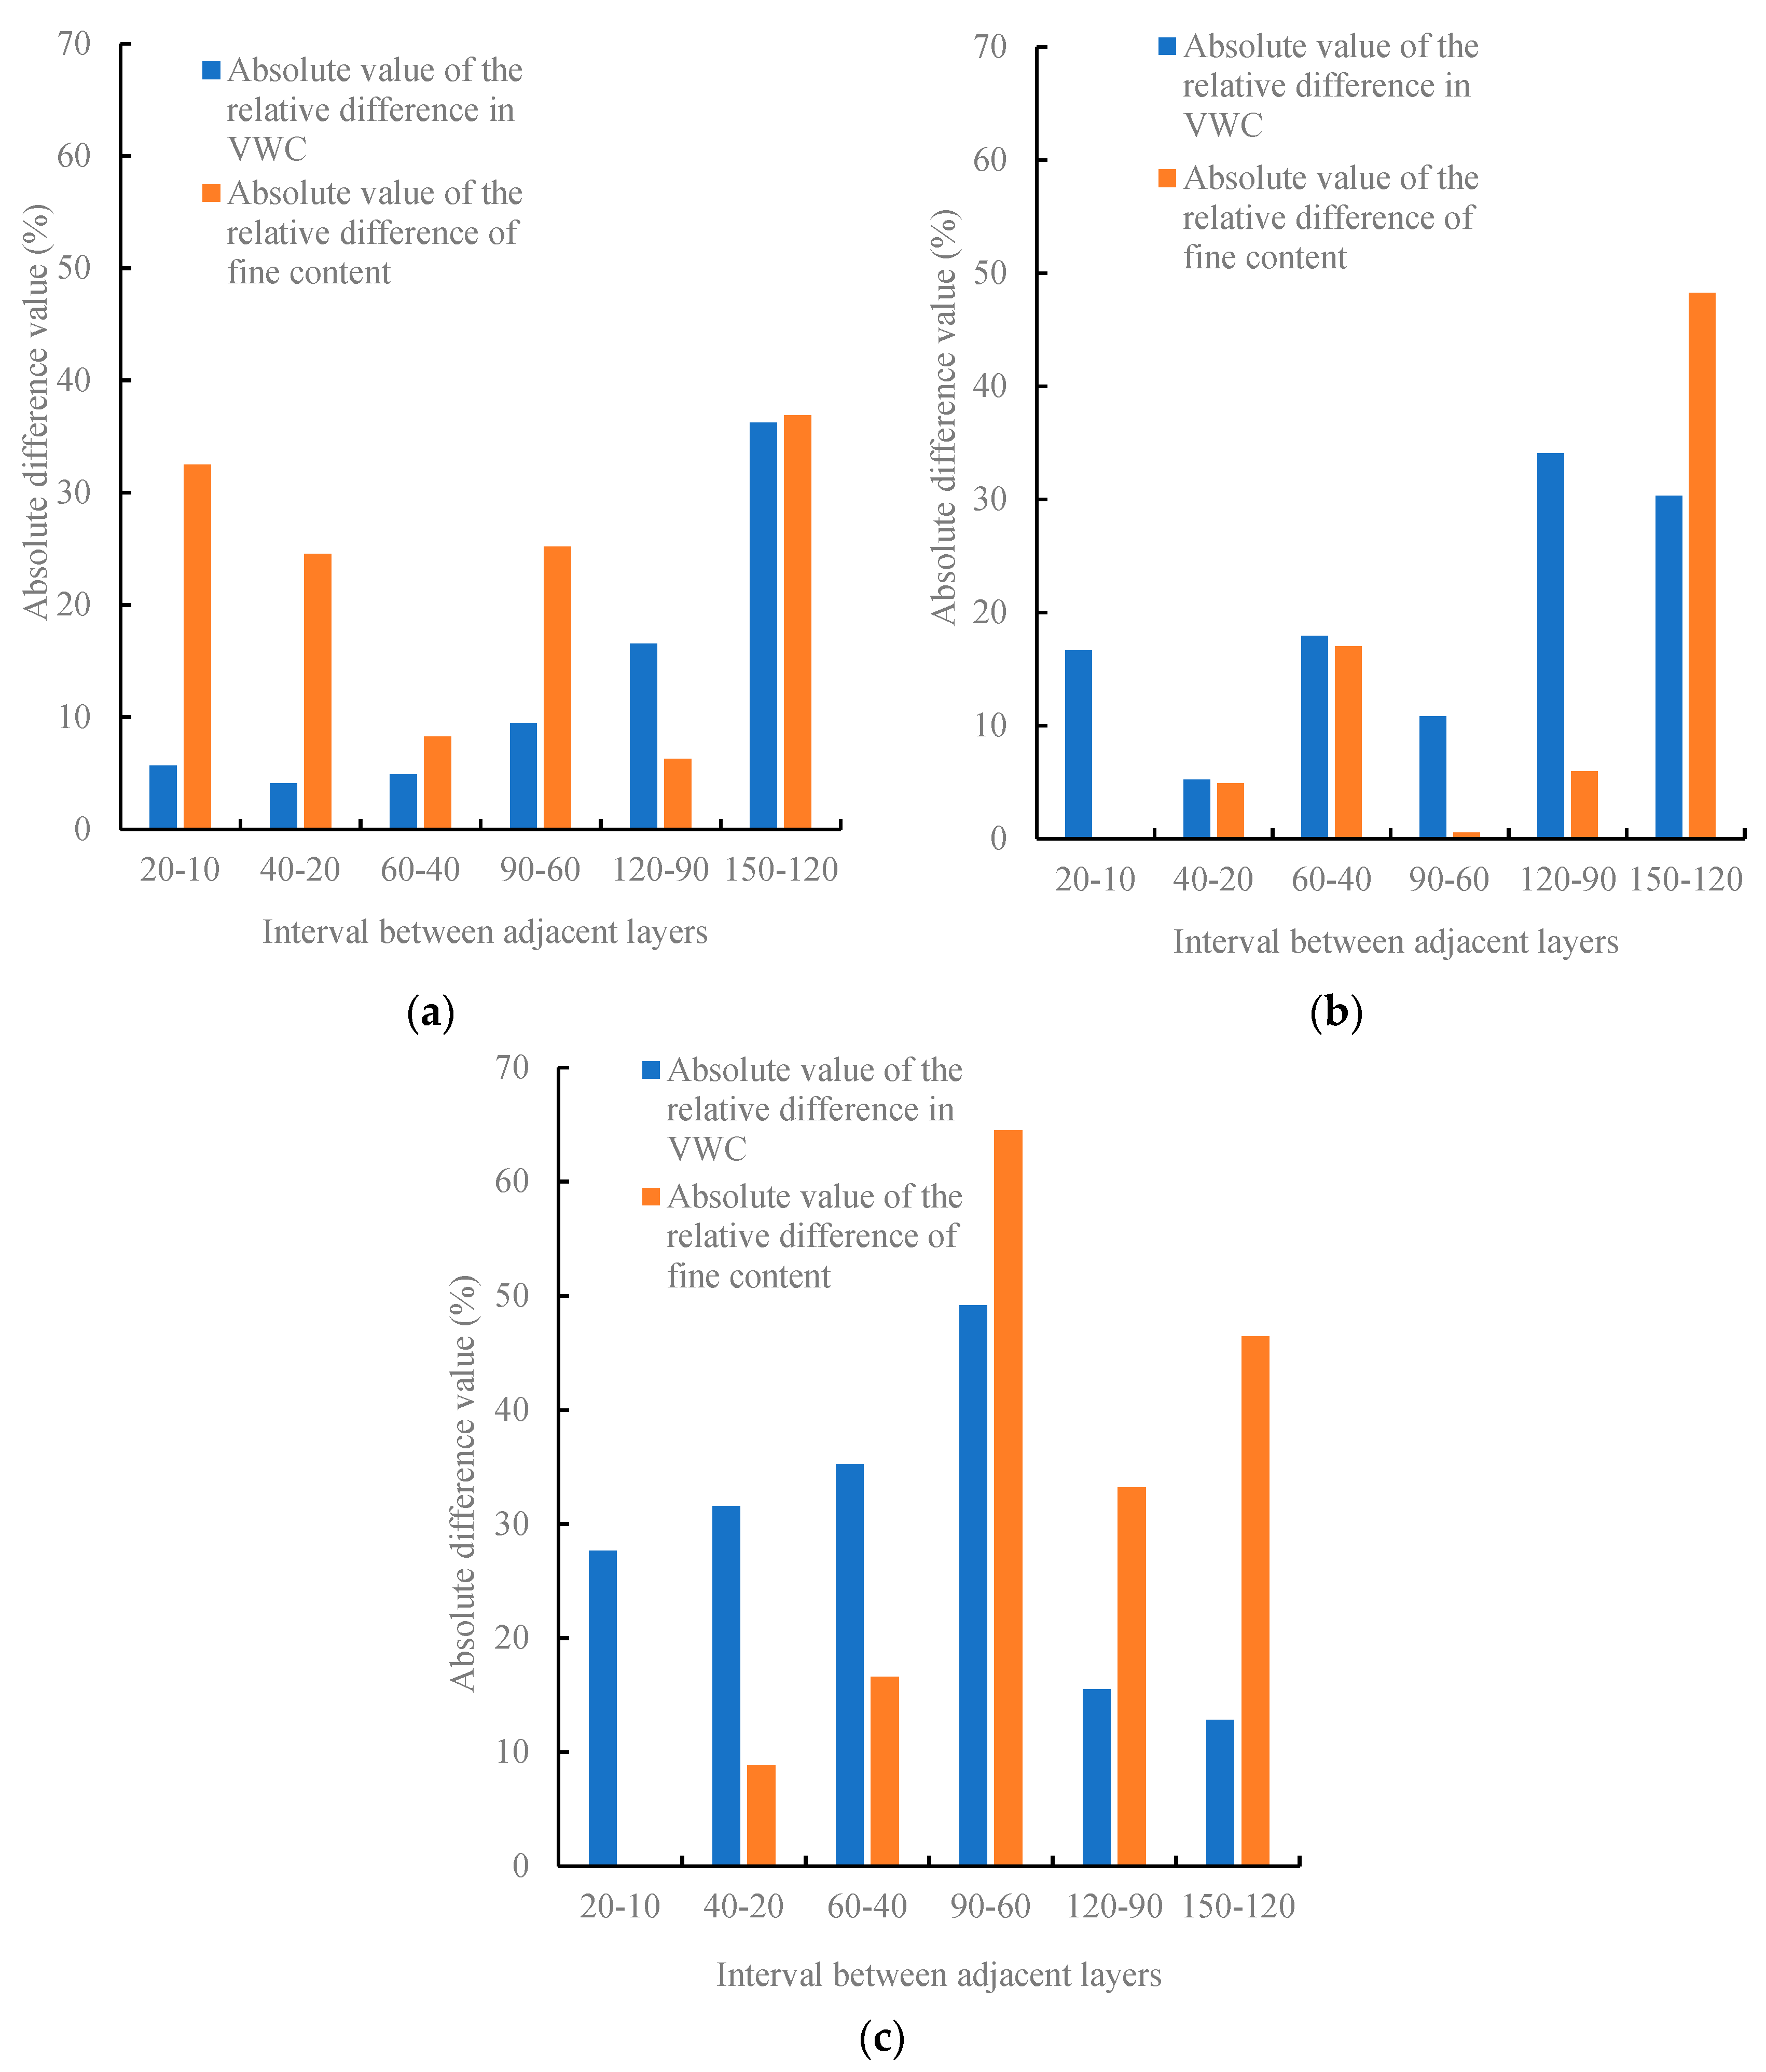
Figure 13 shows the absolute differences in VWC and fine particle contents between adjacent layers in the three profiles. The annual average VWC showed large relative differences at depths of 120–150 cm in profiles A and C and at depths of 60–90 cm in profile D. The layers at these depths correspond to the boundaries between silty soils and silty sands, as well as presenting great differences in fine particle content. Profile A consisted primarily of silty soils at depths of less than 120 cm, showing small differences in VWC at these depths, despite significant differences in fine particle content between adjacent layers. Profile D showed slightly different VWC at depths of 120–150 cm, that is, at the boundary between silty sands and fine sands. Therefore, sudden changes in VWC only occurred in the presence of lithological changes combined with significant differences in fine particle content.
Figure 14 compares the fine particle content, bulk EC and pore EC across the three profiles. Regarding fine particle content, profiles A and C ranged from 38–86%, while profile D exhibited a broader range of 8–86%. Profiles A and C displayed similar bulk EC curves. Additionally, peaks of fine particle content, bulk EC and pore EC occurred concurrently. The fine particle content of soil influenced pore EC via bulk EC and VWC. For profiles A and C, the bulk EC was higher in the deep layer than in the shallow layer, while the pore EC showed minimal differences. As shown by the comparison between layers with significantly different VWCs, the bulk EC varied markedly at depths of 120–150 cm in profile A but minimally at depths of 120–150 cm and 60–90 cm in profiles C and D, respectively. This finding indicates that fine particle content has a more pronounced impact on VWC than on bulk EC.

3.3.2. Relationship between Soil Particle Structure and the Migration of Soil Water and Salt during the Irrigation Period

As indicated by the comparison of soil lithology at depths within 90 cm, profiles A and C were dominated by silty soils, while silty soils mixed with silty sands dominated profiles D. According to the VWC variation time at different depths after irrigation (Table 4), the infiltration rates at depths of less than 90 cm in the three profiles were in the order of A > C > D. As profiles A and C shared the same lithology at depths of less than 90 cm, the differences in the infiltration rates must result from varying soil particle structures. This study compared the fine particle content at depths of less than 90 cm in profiles A and C. The comparison revealed that the fine particle content of profile A peaked at a depth of 40 cm, generally showing an arched structure, while profile C exhibited an upper-fine and lower-coarse structure, with a difference of about 15% at depths of 40–60 cm. Profiles A and C showed weighted averages of fine particle content at depths of less than 90 cm of 69.62% and 76.22%, respectively. This outcome suggests that fine particle content is a key factor influencing the infiltration rate when the soil lithology is the same, and lower fine particle content corresponds to a higher infiltration rate. Additionally, an arched fine-particle-content structure can yield a higher infiltration rate than an upper-fine and lower-coarse structure. Based on the comparison between the VWC variation times of profiles C and D, both profiles primarily showed different soil infiltration rates at depths of 60–90 cm. Furthermore, profiles C and D showed the same soil lithology and similar fine-particle-content structures (upper-fine and lower-coarse structure) at depths of less than 60 cm. However, the difference in fine grain content between 60 and 90 cm in profile D was significantly higher than that in profile C. This finding indicates that large differences in fine grain content would limit water transport.
Five days after irrigation, VWC was primarily influenced by evaporation and capillarity. A smaller VWC variation before the next irrigation indicates the higher water-holding capacity of the soil. As vegetation roots are mainly distributed at depths of less than 1 m from the surface, this study mainly focused on the VWC variations at depths of less than 90 cm in the profiles. According to Table 5, the VWC of profile A exhibited smaller variations with depth, whereas profiles C and D demonstrated larger variations. As shown by the calculated results of the weighted averages of the VWC at depths of less than 90 cm and their changing amplitudes, the water-holding capacities at depths of less than 90 cm of the profiles were in the order of A > C > D. Profiles A and C presented similar curves of fine particle content at depths greater than 90 cm. Compared to profile A, profile C exhibited higher fine particle content and higher capillary water recharge at depths of less than 90 cm. However, the VWC at depths of less than 90 cm in profile A showed a smaller decrease than that in profile C, indicating that evaporation at these depths was greater in profile C than that in profile A. Profile D, which was composed of silty soils, silty sands, and fine sands, had lower capillary water recharge to the upper soil than profiles A and C. In contrast, profiles C and D might have similar evaporation in the upper soil due to their slight difference in fine particle content at depths of less than 60 cm. Therefore, the VWC at depths of less than 90 cm in profile C showed a smaller drop than that of profile D.
Based on the above analysis, pore EC is mainly affected by VWC and bulk EC. Given that soil particle structure indirectly affects the variation in the pore EC, it is difficult to determine or characterize the relationship between them. Therefore, no further analysis was conducted on the relationship between soil particles and pore EC. Besides increasing SWC, irrigation is used to reduce soil salinity. Soil salts move downward into deep soils with irrigation water and then return to upper soil under evaporation and capillarity. Considering that the infiltration end time cannot be accurately determined, this study only compared soil salinity 15 days after irrigation with that before irrigation. According to Table 6, the bulk EC of profile A increased at a depth of 10 cm and decreased at depths of 20–120 cm, while that in profiles C and D somewhat decreased at depths of less than 90 cm and somewhat increased in deeper soil. These results reveal that irrigation had salt-leaching effects on all three profiles and profile A displayed deeper salt migration and more significant salt accumulation in surface soils. As shown by the calculated weighted averages of bulk EC at depths of less than 90 cm, profiles A and C exhibited similar decreases in the amplitudes of bulk EC, both of which were larger than the decrease seen in profile D. According to the conservation of salts, the soil salts in depths of less than 90 cm are primarily recharged by capillary water and discharged by moving downward with irrigation water. According to the soil particle structures at depths within 90 cm, the capillary water recharge of the profiles was in the order of C > A > D. Therefore, irrigation water exhibited the best salt-leaching effect on soils at depths of less than 90 cm in profile C, followed sequentially by profiles A and D.

4. Discussion

At the test site in the lower reaches of the Shiyang River basin, profiles with the same external conditions and similar lithological structures show different distributions and variations in soil water and salt. By comparing the annual mean values of volumetric water content (VWC) and electrical conductivity (EC) among the profiles, it was observed that higher soil fine grain content corresponded with elevated levels of water and salt content, which is consistent with previous findings [40]. Notably, abrupt changes in VWC only occurred when there were lithological variations combined with significant fluctuations in fine particle content; this phenomenon did not occur for soil salinity. When comparing the monthly mean curves of VWC and EC among the profiles, it was found that the variation characteristics of VWC and EC were essentially similar but differed in terms of magnitude. In Section 3.3.2, we contrasted the relationship between fine grain content and changes in water and salt across different profiles. Profiles A and C shared similar lithology but had different infiltration rates, possibly due to the lower average fine grain content of profile A compared to profile C. Previous studies have also indicated that higher soil fine grain content leads to a reduced infiltration rate [42,43]. The superior water retention observed in profile A during irrigation may be attributed to its peak fine grain content at a depth of 40 cm, which exerted a certain inhibitory effect on evaporation. Differences in infiltration became apparent between profiles C and D starting from a depth of 60 cm, likely due to a lithological change within section D spanning from 60 cm to 90 cm in depth range. Earlier research has suggested that downward movement of water is impeded when passing through lithological interfaces [30]. The leaching effect on salts exhibited similarities between profiles A and C while being superior to profile D, indicating that when lithology remains constant, differences in fine grain content have minimal impact on soil salinity variations.
The sieving method was employed for soil particle testing in the study area, using a minimum sieving particle size of 0.075 mm. This measure differs from the internationally used clay particle size of less than 0.002 mm [45]. The reason for this difference is that the soils used in this study are dominated by silty soils and sands, with clay particles featuring low content. Given that the fine soil particles all affect soil water and salt distribution, this study extended the range of minimum particle size used for comparison (less than 0.075 mm). This study, which confirms that the difference in the soil particle structure leads to different distribution and variation patterns of water and salt in soils, even in the case of the same lithology, does not yet determine the specific variation range of fine particle content that causes the differences.

5. Conclusions

This study conducted correlation tests in a test field to analyze the relationship between variations in water and salt characteristics and fine grain content within the vadose zone. Different soil particle structures result in varying irrigation requirements. Soil particle structures with low water retention may necessitate more frequent irrigation, while those with poor salt filtration may require greater quantities of water. The main research findings were the following aspects:
(1) The comparison between the VWC variations on different timescales shows that the three unsaturated zone profiles with similar soil lithological structures but different particle contents exhibit different VWC curves. These profiles also have different infiltration rates post-irrigation, with profile A showing the fastest infiltration rate, followed sequentially by profiles C and D. Furthermore, profile A has the best water-holding capacity under the same evaporation conditions.
(2) As indicated by the comparison between the variations in soil EC on different timescales, the three profiles exhibit different curves of bulk EC and pore EC. Irrigation has different salt-leaching effects on all three profiles. Specifically, profile C shows a slightly better salt-leaching effect than profile A, while profile D exhibits the poorest effect.
(3) By comparing the changes in soil water, salt and soil particle composition among the three profiles, it was observed that the distribution and migration of soil water and salt were closely associated with the structure of soil particles. In cases in which the lithology remains constant but there are variations in fine grain content, differences in soil water transport occur. Specifically, a higher proportion of fine grains leads to a lower infiltration rate. Moreover, when the middle section exhibits the highest fine grain content, evaporation is partially inhibited, and irrigation promotes deeper downward movement of soil salts. However, when the lithologic structure is similar, the change in fine grain content has the least effect on salt leaching.

Author Contributions

Methodology, S.C.; formal analysis, P.Z.; investigation, P.L., X.G., P.Z. and S.C.; Software, S.C. and P.L.; data curation, S.C.; writing—original draft preparation, S.C. and P.Z.; writing—review and editing, S.C.; supervision, P.L. and X.G.; project administration, P.Z. and P.L.; funding acquisition, P.Z. and P.L. All authors have read and agreed to the published version of the manuscript.

Funding

This research was funded by the Natural Science Foundation of Hebei Province (Grant No. D2021504040), the Geological Survey Project of the China Geological Survey (Grant No. DD20230432), and the Basic Scientific Research Expenses of China Geological Survey (Grant No. SK202201 and Grant No. SK202215).

Data Availability Statement

The data presented in this study are available on request from the corresponding author.

Conflicts of Interest

The authors declare no conflict of interest.

References

  1. Cui, H.; Zhang, G.; Wang, Q.; Wang, J.; Liu, M.; Yan, M. Study on Index of Groundwater Ecological Function Crisis Classification and Early Warning in Northwest China. Water 2022, 14, 1911. [Google Scholar] [CrossRef]
  2. Wang, J.; Zhang, G.; Wang, Q.; Cui, H.; Liu, P. Construction and application of evaluation index system of groundwater ecological function in northwest arid area. Acta Geol. Sin. 2021, 95, 1573–1581. [Google Scholar] [CrossRef]
  3. Yin, X.; Feng, Q.; Li, Y.; Deo, R.C.; Liu, W.; Zhu, M.; Zheng, X.; Liu, R. An interplay of soil salinization and groundwater degradation threatening coexistence of oasis-desert ecosystems. Sci. Total Environ. 2021, 806 Pt 2, 150599. [Google Scholar] [CrossRef]
  4. Yin, X.; Feng, Q.; Zheng, X.; Zhu, M.; Wu, X.; Guo, Y.; Wu, M.; Li, Y. Spatio-temporal dynamics and eco-hydrological controls of water and salt migration within and among different land uses in an oasis-desert system. Sci. Total Environ. 2021, 772, 145572. [Google Scholar] [CrossRef] [PubMed]
  5. Cui, S.; Liu, P.; Nie, Z.; Zhu, P. Law of Soil Water and Salt Transport in Vadose Zone of Transition Zone between Farmland and Desert. Sci. Technol. Eng. 2022, 22, 8640–8645. [Google Scholar] [CrossRef]
  6. Zeng, H.B.; Su, C.L.; Xie, X.J.; Pan, H.; Ji, Q.; Tao, Y. Mechanism of salinization of shallow groundwater in Western Hetao Irrigation Area. Earth Sci. 2021, 46, 2267–2277. [Google Scholar] [CrossRef]
  7. Huang, F.; Zhang, Y.; Zhang, D.; Chen, X. Environmental groundwater depth for groundwater-dependent terrestrial ecosystems in arid/semiarid regions: A review. Int. J. Environ. Res. Public Health 2019, 16, 763. [Google Scholar] [CrossRef] [PubMed] [Green Version]
  8. Huang, F.; Ochoa, C.G.; Chen, X. Assessing environmental water requirement for groundwater-dependent vegetation in arid inland basins by combining the copula joint distribution function and the dual objective optimization: An application to the Turpan Basin, China. Sci. Total Environ. 2021, 799, 149323. [Google Scholar] [CrossRef]
  9. Zhang, H. Study on Coupling Model of Groundwater Balance and Ecological Succession: A Case Study of Shule River Irrigation Area. Ph.D. Thesis, Huazhong University of Science and Technology, Wuhan, China, 2010. [Google Scholar] [CrossRef]
  10. Cui, H.; Zhang, G.; Liu, P.; Wang, J.; Tian, Y.; Wang, Q. Influences of lithology and structure of the vadose zone on groundwater ecological function. Hydrogeol. Eng. Geol. 2022, 49, 52–62. [Google Scholar] [CrossRef]
  11. Liu, M.; Nie, Z.; Cao, L.; Wang, L.; Lu, H.; Wang, Z.; Zhu, P. Comprehensive evaluation on the ecological function of groundwater in the Shiyang River watershed. J. Groundw. Sci. Eng. 2021, 9, 326–340. [Google Scholar] [CrossRef]
  12. Zhou, H. Review of studies on the relationship between soil water movement and energy and their driving forces in the vadose zone of arid regions. Acta Ecol. Sin. 2019, 39, 12. [Google Scholar] [CrossRef]
  13. Zhao, W.; Zhou, H.; Liu, H. Advances in moisture migration in vadose zone of dryland and recharge effects on groundwater dynamics. Adv. Earth Sci. 2017, 32, 908–918. [Google Scholar] [CrossRef]
  14. Zhao, M.; Wang, W.; Wang, Z.; Chen, L.; Ma, Z.; Song, H. Biomass of Artemisia ordosica in sand land and its root system distribution characteristics in the semiarid regions. Arid Land Geogr. 2018, 41, 786–792. [Google Scholar] [CrossRef]
  15. Lai, Z.; Zhang, Y.; Liu, J.; Wu, B.; Qin, S.; Fa, K. Fine-root distribution, production, decomposition, and effect on soil organic carbon of three revegetation shrub species in northwest China. For. Ecol. Manag. 2016, 359, 381–388. [Google Scholar] [CrossRef]
  16. Li, Y.; Fu, Y.; Zhang, X.; Wu, J.; Han, B. Effects of farmland plastic mulching on rainfall infiltration using Hydrus-2D model. Trans. Chin. Soc. Agric. Eng. 2022, 38, 134–143. [Google Scholar] [CrossRef]
  17. Zhang, W.; Shi, H.; Li, Z.; Wang, W.; Fu, X.; Li, Z. Redistribution Mechanism for Irrigation Water and Salinity in Typical Irrigation and Drainage Unit in the Hetao Irrigation District, China. J. Irrig. Drain. Eng. 2022, 148, 04022021. [Google Scholar] [CrossRef]
  18. Zhang, W.; Shi, H.; Li, X.; Li, Z.; Zhou, H.; Wang, W. Dynamic and Transformation Relationship between Soil Water and Groundwater in Typical Areas of Hetao Irrigation District. Trans. Chin. Soc. Agric. Mach. 2022, 53, 352–362. [Google Scholar] [CrossRef]
  19. Wang, Z.; Chai, J.; Zhang, H. Experimental Study on the Rise of Capillary Water in Layered Soil. J. Inn. Mong. Univ. (Acta Sci. Nat. Univ. NeiMongol) 2021, 52, 192–197. [Google Scholar] [CrossRef]
  20. Pei, Y.; Huang, L.; Li, R.; Shao, M.; Zhang, Y. Root Water Source of Pinus sylvestris L. var. Mongholica and Influencing Factors in the Southeastern Part of Mu Us Sandy Land, China. Acta Pedol. Sin. 2022, 59, 1336–1348. [Google Scholar] [CrossRef]
  21. Liu, P.; Zhang, G.; Cui, S.; Nie, Z.; Cui, H.; Wang, Q. Effects of Groundwater Level Control on Soil Salinity Change in Farmland around Wetlands in Arid Areas: A Case Study of the Lower Reaches of the Shiyang River Basin, China. Water 2023, 15, 1308. [Google Scholar] [CrossRef]
  22. Cui, S.; Liu, P.; Nie, Z.; Zhu, P.; Geng, X. Characteristics of Water and Salt Movement in Aeration Zone after Irrigation with Brackish Water under Water Level Regulation. Sci. Technol. Eng. 2022, 22, 967–973. [Google Scholar] [CrossRef]
  23. Kassaye, K.T.; Boulange, J.; Tu, L.H.; Saito, H.; Watanabe, H. Soil water content and soil temperature modeling in a vadose zone of Andosol under temperate monsoon climate. Geoderma 2021, 384, 114797. [Google Scholar] [CrossRef]
  24. Li, H.; Shao, J.; Cui, Y.; Ma, X. Effects of different crop covers on vertical groundwater recharge. Hydrogeol. Eng. Geol. 2019, 46, 57–65. [Google Scholar] [CrossRef]
  25. Aggarwal, P.; Bhattacharyya, R.; Mishra, A.K.; Das, T.K.; Šimůnek, J.; Pramanik, P.; Sudhishri, S.; Vashisth, A.; Krishnan, P.; Chakraborty, D.; et al. Modelling soil water balance and root water uptake in cotton grown under different soil conservation practices in the Indo-Gangetic Plain. Agric. Ecosyst. Environ. 2017, 240, 287–299. [Google Scholar] [CrossRef] [Green Version]
  26. Ma, Y. Study on Movement Mechanism of Water and Salt in Vadose Zone under Saline Water Irrigation. Master’s Thesis, North China University of Water Resources and Electric Power, Zhengzhou, China, 2020. [Google Scholar] [CrossRef]
  27. Batsilas, I.; Angelaki, A.; Chalkidis, I. Hydrodynamics of the Vadose Zone of a Layered Soil Column. Water 2023, 15, 221. [Google Scholar] [CrossRef]
  28. Tu, A. Advances in Water Infiltration and Solute Transport in Layered Soil. Acta Agric. Univ. Jiangxiensis 2017, 39, 818–825. [Google Scholar] [CrossRef]
  29. Zhong, X.; Zhu, C.; Liu, Z.; Wang, J.; Xie, X. A Study on the Influence of Different Salinity on the Infiltration Law of Layered Soil. Water Sav. Irrig. 2019, 5, 63–66. [Google Scholar] [CrossRef]
  30. Sun, C.; Zhao, W.; Liu, H.; Zhang, Y. Effects of textural layering on water regimes in sandy soils in a desert-oasis ecotone, Northwestern China. Front. Earth Sci. 2021, 9, 627500. [Google Scholar] [CrossRef]
  31. Zhao, Y.; Li, M.; Chen, S.; Gao, C.; Hao, Z. Retardation Effect of Layered Soil to Salt Transfer under Drip Irrigation. J. Irrig. Drain. 2015, 34, 29–34. [Google Scholar] [CrossRef]
  32. Yu, P.; Wang, W.; Wang, Z.; Gong, C.; Zhang, Z.; Ghen, L. Influence of lithologic structure of vadose zone on rainfall infiltration capacity. Water Resour. Hydropower Eng. 2019, 50, 25–33. [Google Scholar] [CrossRef]
  33. Hu, Z.; Wang, X.; Liang, Y.; Gao, Y. Numerically Simulated Water Movement in Reclaimed Multi-Layered Soil Backfilled with Yellow River Sediments. 2021; Preprint (Version 1). [Google Scholar] [CrossRef]
  34. Gerrard, J.; Gerrard, J. Fundamentals of Soils; Routledge: London, UK, 2000. [Google Scholar] [CrossRef]
  35. Wu, J. Progress of the Researches on Functions of Soil Particles. J. Jilin Agric. Univ. 2008, 529–537. [Google Scholar] [CrossRef]
  36. Sessitsch, A.; Weilharter, A.; Gerzabek, M.H.; Kirchmann, H.; Kandeler, E. Microbial population structures in soil particle size fractions of a long-term fertilizer field experiment. Appl. Environ. Microbiol. 2001, 67, 4215–4224. [Google Scholar] [CrossRef] [PubMed] [Green Version]
  37. Wang, A.; Liu, B.; Wang, Z.; Liu, G. Monitoring and predicting the soil water content in the deeper soil profile of Loess Plateau, China. Int. Soil Water Conserv. Res. 2016, 4, 6–11. [Google Scholar] [CrossRef] [Green Version]
  38. Hu, H.; Tian, F.; Hu, H. Soil particle size distribution and its relationship with soil water and salt under mulched drip irrigation in Xinjiang of China. Sci. China Technol. Sci. 2011, 54, 1568–1574. [Google Scholar] [CrossRef]
  39. Li, X.; Feng, G.; Zhao, C.; Shi, F. Characteristics of soil infiltration in the Tarim River floodplain. Environ. Earth Sci. 2016, 75, 782. [Google Scholar] [CrossRef]
  40. Orradóttir, B.; Archer, S.; Arnalds, O.; Wilding, L.; Thurow, T. Infiltration in Icelandic Andisols: The role of vegetation and soil frost. Arct. Antarct. Alp. Res. 2008, 40, 412–421. [Google Scholar] [CrossRef] [Green Version]
  41. Liang, C. Experimental Investigation of the Infiltration Features of Different Types of Soil in Hilly Area. Shanxi Hydrotech. 2016, 3, 84–86. [Google Scholar] [CrossRef]
  42. Li, Z.; Wu, P.; Feng, H.; Zhao, X.; Huang, J. Effects of soil clay particle content on soil infiltration capacity by simulated experiments. Agric. Res. Arid. Areas 2009, 27, 71–77. [Google Scholar]
  43. Liu, P.; Zhang, G.; Cui, S.; Liu, S.; Nie, Z. Threshold value of ecological water table and dual control technology of the water table and its quantity in the salinized farmland around wetland in arid areas. Hydrogeol. Eng. Geol. 2022, 49, 42–51. [Google Scholar] [CrossRef]
  44. Fan, X.R. Preliminary Analysis of Soil Water Content Change in Typical Karst Rocky Desertification Area—A Case Study of Chenjiazhai Rocky Desertification Base in Puting County. Master’s Thesis, Guizhou University, Guiyang, China, 2009. [Google Scholar] [CrossRef]
  45. Jia, Z. Research on Soil Moisture Monitoring Technology and Movement Law. Ph.D. Thesis, Chang’an University, Xi’an, China, 2014. [Google Scholar] [CrossRef]
  46. Xi, L.; Yu, J.; Zhang, L. Calibration on Measurement of Soil Salinity and Water Using Time Domain Reflectrometry (TDR). J. Tarim Univ. 2007, 19, 6–10. [Google Scholar] [CrossRef]
  47. Guan, X.; Wang, S.; Gao, Z.; Lv, H.; Fu, X. Spatio-temporal variability of soil salinity and its relationship with the depth to groundwater in salinization irrigation district. Acta Ecol. Sin. 2012, 32, 1202–1210. [Google Scholar] [CrossRef] [Green Version]
  48. Hilhorst, M.A. A Pore Water Conductivity Sensor. Soil Sci. Soc. Am. J. 2000, 64, 1922–1925. [Google Scholar] [CrossRef] [Green Version]
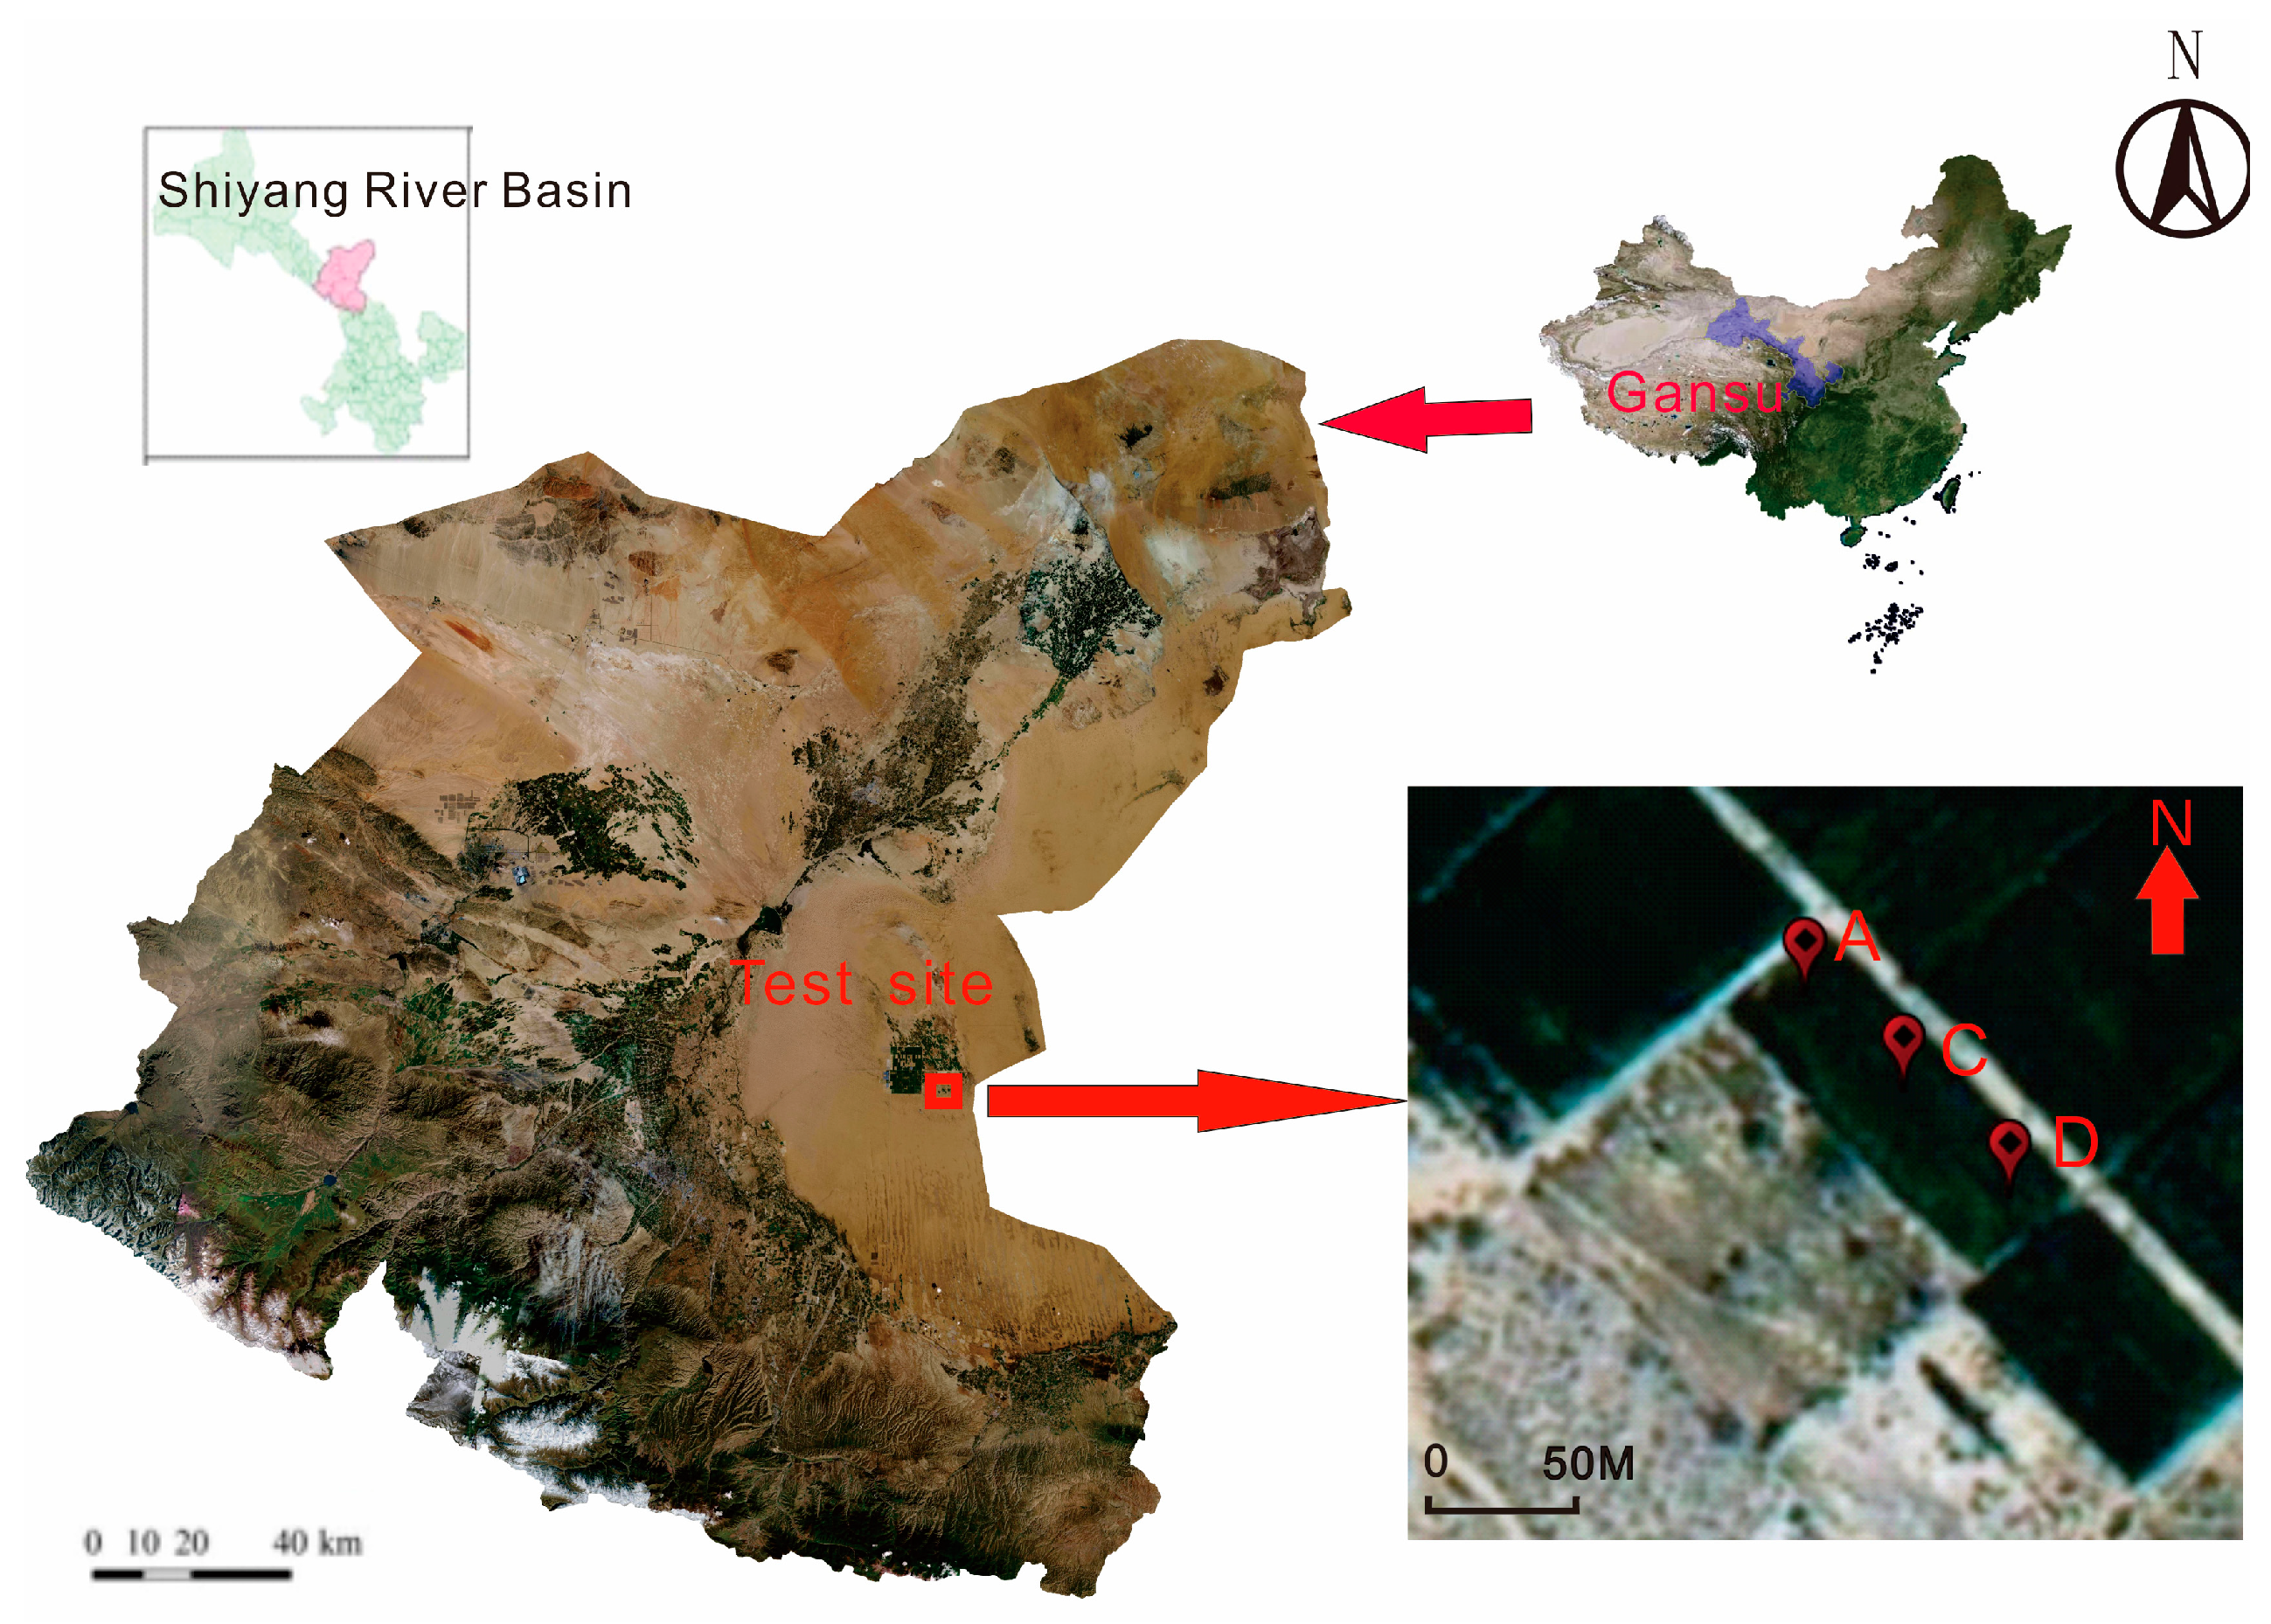
Figure 1. Location of the test site.
Water 15 02842 g001
Figure 2. Variations in precipitation and temperature at the test site.
Water 15 02842 g002
Figure 3. Calibration curves of volumetric water contents for soils with different lithologies. (a) Fine sand; (b) silty soil; (c) silty sand.
Water 15 02842 g003
Figure 4. Curves of average VWC from March to November.
Water 15 02842 g004
Figure 5. Contours showing the spatio-temporal VWC variations. (a) Profile A; (b) profile C; (c) profile D.
Water 15 02842 g005
Figure 6. Curves showing the VWC variations during the irrigation period. (a) Profile A; (b) profile C; (c) profile D.
Water 15 02842 g006
Figure 7. VWC variations at different depths less than 24 h after irrigation.
Water 15 02842 g007
Figure 8. Curves of annual average soil EC.
Water 15 02842 g008
Figure 9. Curves showing the variations in bulk EC during the irrigation period. (a) Curves of bulk EC for profile A; (b) curves of bulk EC for profile C; (c) curves of bulk EC for profile D.
Water 15 02842 g009aWater 15 02842 g009b
Figure 10. Curves showing the average soil EC above a depth of 90 cm during the irrigation period.
Water 15 02842 g010
Figure 11. Variations in soil EC at an irrigation interval. (a) Bulk EC of profile A; (b) Pore EC of profile A; (c) Bulk EC of profile C; (d) Pore EC of profile C; (e) Bulk EC of profile D; (f) Pore EC of profile D.
Water 15 02842 g011aWater 15 02842 g011b
Figure 12. Variations in pore EC at an irrigation interval.
Water 15 02842 g012
Figure 13. Differences in VWC and fine particle content between adjacent horizons. (a) Profile A; (b) profile C; (c) profile D.
Water 15 02842 g013
Figure 14. Curves of soil EC and fine particle content.
Water 15 02842 g014
Table 1. Soil particle composition of profile A.
Depth (cm)Particle Composition (%)d: mmLithology
60–22–0.50.5–0.250.25–0.075≤0.075
10/1.11.345.652.0Silty soil
20/0.550.729.8568.9Silty soil
40//0.114.185.8Silty soil
60/0.10.121.178.7Silty soil
900.23.71.735.558.9Silty soil
1200.22.41.233.662.6Silty soil
150/1.60.958.039.5Silty sand
Table 2. Soil particle composition of profile C.
Depth (cm)Particle Composition (%)d: mmLithology
60–22–0.50.5–0.250.25–0.075≤0.075
10//0.118.681.3Silty soil
20//0.118.681.3Silty soil
40///14.785.3Silty soil
60/0.10.129.070.8Silty soil
90/0.70.128.870.4Silty soil
120/0.10.125.274.6Silty soil
150/1.71.758.038.6Silty sand
Table 3. Soil particle composition of profile D.
Depth (cm)Particle Composition (%)d: mmLithology
60–22–0.50.5–0.250.25–0.075≤0.075
10//0.114.085.9Silty soil
20//0.114.085.9Silty soil
40///21.778.3Silty soil
60/0.30.334.165.3Silty soil
90/1.65273.1523.2Silty sand
120/2.22.779.615.5Silty sand
150/0.10.291.48.3Fine sand
Table 4. Fine particle contents vs. VWC variation times of different profiles.
Depth (cm)ACD
Fine Particle Content (%)VWC Variation Time (h)Fine Particle Content (%)VWC Variation Time (h)Fine Particle Content (%)VWC Variation Time (h)
10520.581.30.585.90.5
2068.90.581.30.585.90.5
4085.80.585.3178.31
6078.7170.8165.31.5
9058.9170.41.530.92
Table 5. VWC changing amplitudes of different profiles.
Depth (cm)ACD
VWC Changing Amplitude (%)Weighted Average (%)VWC Changing Amplitude (%)Weighted Average (%)VWC Changing Amplitude (%)Weighted Average (%)
10−4.78−2.13−2.52−4.38−7.70−5.61
20−3.20−1.51−4.24
40−2.55−2.07−8.94
60−1.98−12.59−4.99
90−0.89−2.74−2.63
1200.60 0.14 −0.75
1500.27 1.72 −1.38
Table 6. Bulk EC changing amplitudes of different profiles.
Depth (cm)ACD
Bulk EC Changing Amplitude (%)Weighted AverageBulk EC Changing Amplitude (%)Weighted AverageBulk EC Changing Amplitude (%)Weighted Average
105.57−10.88−13.15−10.91−4.49−9.55
20−1.18−10.19−8.04
40−9.27−13.82−7.42
60−16.17−23.30−17.64
90−14.41−5.41−5.50
120−2.40 0.42 1.35
1503.58 11.24 8.76
Disclaimer/Publisher’s Note: The statements, opinions and data contained in all publications are solely those of the individual author(s) and contributor(s) and not of MDPI and/or the editor(s). MDPI and/or the editor(s) disclaim responsibility for any injury to people or property resulting from any ideas, methods, instructions or products referred to in the content.