Article

Technological and Economic Optimization of Wheat Straw Black Liquor Decolorization by Activated Carbon

by
Gabriel Dan Suditu
1,
Elena Niculina Drăgoi
1,2,
Adrian Cătălin Puițel
1 and
Mircea Teodor Nechita
1,*
1
“Cristofor Simionescu” Faculty of Chemical Engineering and Environmental Protection, “Gheorghe Asachi” Technical University, Bld. D Mangeron, No 73, 700050 Iasi, Romania
2
Faculty of Automatic Control and Computer Engineering, “Gheorghe Asachi” Technical University, Bld. D Mangeron, No 27, 700050 Iasi, Romania
*
Author to whom correspondence should be addressed.
Water 2023, 15(16), 2911; https://doi.org/10.3390/w15162911
Submission received: 22 June 2023 / Revised: 10 August 2023 / Accepted: 11 August 2023 / Published: 12 August 2023
(This article belongs to the Special Issue Novel Approaches to Nutrients and Pollutants Removal from Wastewaters)

Abstract

:
Wheat straws are a globally abundant agro-waste that may play a critical role in the global transition from single-use plastics to green materials as an inexpensive and renewable raw material. Vast amounts of wastewater are produced during the technological process of wheat straw-cellulose/hemicellulose conversion. In this context, this work focuses on wastewater decolorization via activated carbon adsorption. A set of carefully planned experiments enabled the identification of a model that described the relationship between the system’s outputs and parameters. While process optimization is frequently connected with identifying process parameters that improve efficiency, this work employed a multi-objective optimization approach from both a technological and economic aspect. Nondominated sorting genetic algorithm versions II and III—NSGA-II and NSGA-III algorithms—were applied. As objectives, maximum efficiency and minimum cost per experiment were followed in different scenarios using pseudoweights and trade-off metrics. When optimizing only the efficiency, the results indicated a 95.54% decolorization yield, costing 0.1228 Euro/experiment, and when considering both the efficiency and cost, different solutions were obtained. The lowest cost was 0.0619, with a 74.42% decolorization. These findings indicate that incorporating an economic perspective into the optimization procedure can improve cost estimation and facilitate managerial decision-making.

1. Introduction

With water consumption ranging from 5 to 100 m3 per ton of paper produced [1,2], the pulp and paper industry (P & P) is recognized as one of the largest producers of wastewater [3,4]. The main concerns about these specific industrial effluents are residual chemical oxygen demand (COD), biochemical oxygen demand (BOD), toxicity (various chlorinated compounds, phenols, lignin, and many others), and color [5,6,7]. As a result, different effluent treatments have been proposed and developed over time in tandem with the technological evolution of P & P [3,8,9,10,11]. Even though the effluents’ color appears less harmful, it was discovered that color in pulping effluent is more than just an aesthetic issue [6]. The chemicals that cause the effluent’s color absorb light, affecting photosynthesis directly, and they also reduce visibility, reducing microorganisms’ chances of feeding or reproducing [5,12,13]. Therefore, several strategies and methods were proposed to decolorize and detoxify P & P effluents [14,15].
Nowadays, there is a global transition from single-use plastics to green materials, which is not as facile as expected [16,17,18]. However, considerable steps in the right direction have been made in the past decade. Scientists and various industries are making great efforts to find solutions, develop new technologies, and discover replacements or new potential raw materials [19,20,21,22]. Agro-wastes are among the most promising resources, and from this category, wheat straws (WS) have attracted much attention [23,24,25]. WS are highly abundant, low-cost, generable, and extensively studied as a source of hemicelluloses [26] that can further be used as constituents for various industrial green packaging applications [23,27,28]. According to a Data Bridge Market Research report, the wheat straw market was valued at 643.6 million USD in 2021 and is expected to grow to 1330.24 million USD by 2029 [29]. The main reason is that WS is a strong alternative to paper and plastic products, and it is simple to dispose of by placing it in soil without any added toxicants to enhance biodegradability [29]. A recent report by the Food and Agriculture Organization of the United Nations [30] showed Asia is the region that produces the most wheat on a global scale, accounting for 43.8% of the total amount produced between 2001 and 2021, followed by Europe (33.3%) and the Americas (16%). China, India, the Russian Federation, the United States, France, Canada, Germany, Pakistan, Australia, and Ukraine are the top 10 world wheat producers for the same period [30]. In the European Union, France produces the most wheat straw (23.7%), followed by Germany (14.8%). The other significant contributors, producing 8.4%, 8.3%, and 7.2% of the EU’s wheat straw, respectively, are the UK, Poland, and Romania [31].
Cellulose paper is an environmentally friendly alternative to some single-use plastics [18,28,32,33]. It is biodegradable, recyclable, and less toxic than plastic [28,34]. Cellulose can be obtained from lignocellulosic biomass using various methods such as Kraft and sulfite pulping processes, alkali, organosolv, ammonia treatment, alkaline hydrogen peroxide bleaching, and others [25,35,36]. This interest in cellulose produced from biomass leads to a rejuvenation of P & P and brings effluent treatment issues to reality, including decolorization. As expected, the use of new raw materials generates new problems. Existing treatments require technological adjustments and optimization to fulfill the modifications in effluent composition and the increasingly restrictive legislation.
Adsorption on activated carbon is one of the most common methods for decolorizing industrial effluents [37,38]. Adsorption has many advantages over other treatment methods (such as [39,40]): it is a straightforward process, it is cost-effective due to the low price of the materials used, it is flexible because it can be combined with other methods, and it is environmentally friendly since it does not produce harmful byproducts and the materials used are typically derived from natural materials or waste.
The current trend is to find low-cost adsorbents prepared from lignocellulosic biomass [41,42,43,44,45,46]. Despite the excellent results in terms of decolorization yields reported by various authors [47,48,49,50], the economic aspects are often overlooked. Even though the starting material is indeed inexpensive (e.g., beet pulp [48], pumpkin peels [49], grape wood [50], potato peel [51], fruit peel [52], hard shells (almonds, hazelnut, walnut) [53]), the journey from there to activated carbon is long [45,54,55] and many steps have to be taken: collecting, transporting, processing (chemical activation, thermal activation), characterization, and each stage has its own cost. Several factors, such as seasonal availability, weather conditions, transportation, storage conditions, origin of the pre-cursors, chemical treatments, thermal treatments, etc., determine the final product’s quantity and quality [56,57]. As a result, commercial activated carbon, which appears to be rather expensive, has several advantages: it is ready to use, has been characterized to some extent, and has a consistent physicochemical composition [58].
A variety of process parameters govern adsorption-based treatment procedures, including adsorbent amount, pollutant concentration, contact time, temperature, pH value, chemical additions (flocculants, coagulants), and stirring intensity (mechanical stirring, ultrasound stirring) [59,60]. Modern optimization techniques enable the identification of critical process parameters and their individual or collective influence on process yields [61,62,63]. However, few papers deal with techno-economical optimization [64,65], and even fewer deal with multiple scenario techno-economical optimization [66]. In this context, multiobjective optimization is justified by the fact that the significance of particular parameters varies depending on the context, thus influencing their economic impact.
For instance, at the laboratory scale, the contact time appears to be the least expensive and, thus, less limiting. In real-life situations, time is crucial because any pollutant must be removed as quickly as possible. Temperature is an essential parameter significantly affecting process yields (adsorption/desorption rate, kinetics, etc.) at the laboratory scale. For some industrial effluents with known flow rates (and compositions), the temperature can be controlled; however, the temperature is an uncontrollable factor for large-scale events in real life. In actual situations, the cost of adjusting the temperature is frequently prohibitive because it requires energy and specialized equipment. pH adjustment and control typically necessitate the addition of chemicals (e.g., acids, bases, buffer solutions), which requires additional treatments and significantly raises operating costs. In some circumstances, pH adjustment may be necessary; it is relatively simple to perform on a laboratory or industrial scale but more challenging in unplanned real-life situations. Economic arguments are always put on hold when severe and immediate environmental consequences are involved (e.g., ecological disaster). However, under normal circumstances, the best-case scenario for a business that generates wastewater is to maximize treatment efficacy while reducing costs.
Following this analysis, four variables—pollutant concentration, adsorbent quantity, contact time, and stirring intensity—were considered as inputs for the experimental investigations and optimization. Two responses (outputs) were considered for the system under study: decolorization effectiveness and financial costs. This multiple-parameter (multiple input) optimization problem yields two interconnected solutions (outputs), one of which should be maximized (decolorization efficacy), and the other should be minimized (costs). Additionally, different scenarios were examined during optimization (for example, considering time as a critical variable or adsorbent amount as a vital variable), but always to maximize the decolorization efficacy and minimize economic costs. To the author’s knowledge, such an approach was never reported for black liquor decolorization with activated carbon. It is essential to emphasize the highly interdisciplinary nature of this particular study, which incorporates expertise in pulp and paper, chemical and environmental engineering, optimization, and computing.
This work aims to demonstrate that through the use of bio-inspired optimizers, multi-objective optimization focusing on both efficiency and reducing costs can be achieved. The selected process is the decolorization of residual black liquor produced from wheat straws via hot alkaline extraction using commercial activated carbon as an adsorbent. Four parameters were considered for optimization: black liquor concentration, amount of activated carbon, stirrer rotation speed, and contact time. The proposed methodology consists of a series of steps that include: (i) the response Surface Method (RSM) and Design of Experiments (DOE) were used to plan the experiments and model the process; (ii) two multi-objective evolutionary algorithms (nondominated sorting genetic algorithm versions II and III—NSGA-II and NSGA-III) were applied to perform the decolorization process’s simultaneous technological and economical optimization.
The combination of outputs and approaches gives this work its novelty. Optimal combinations of process parameters and operation costs were identified, considering multiple scenarios for the same process.

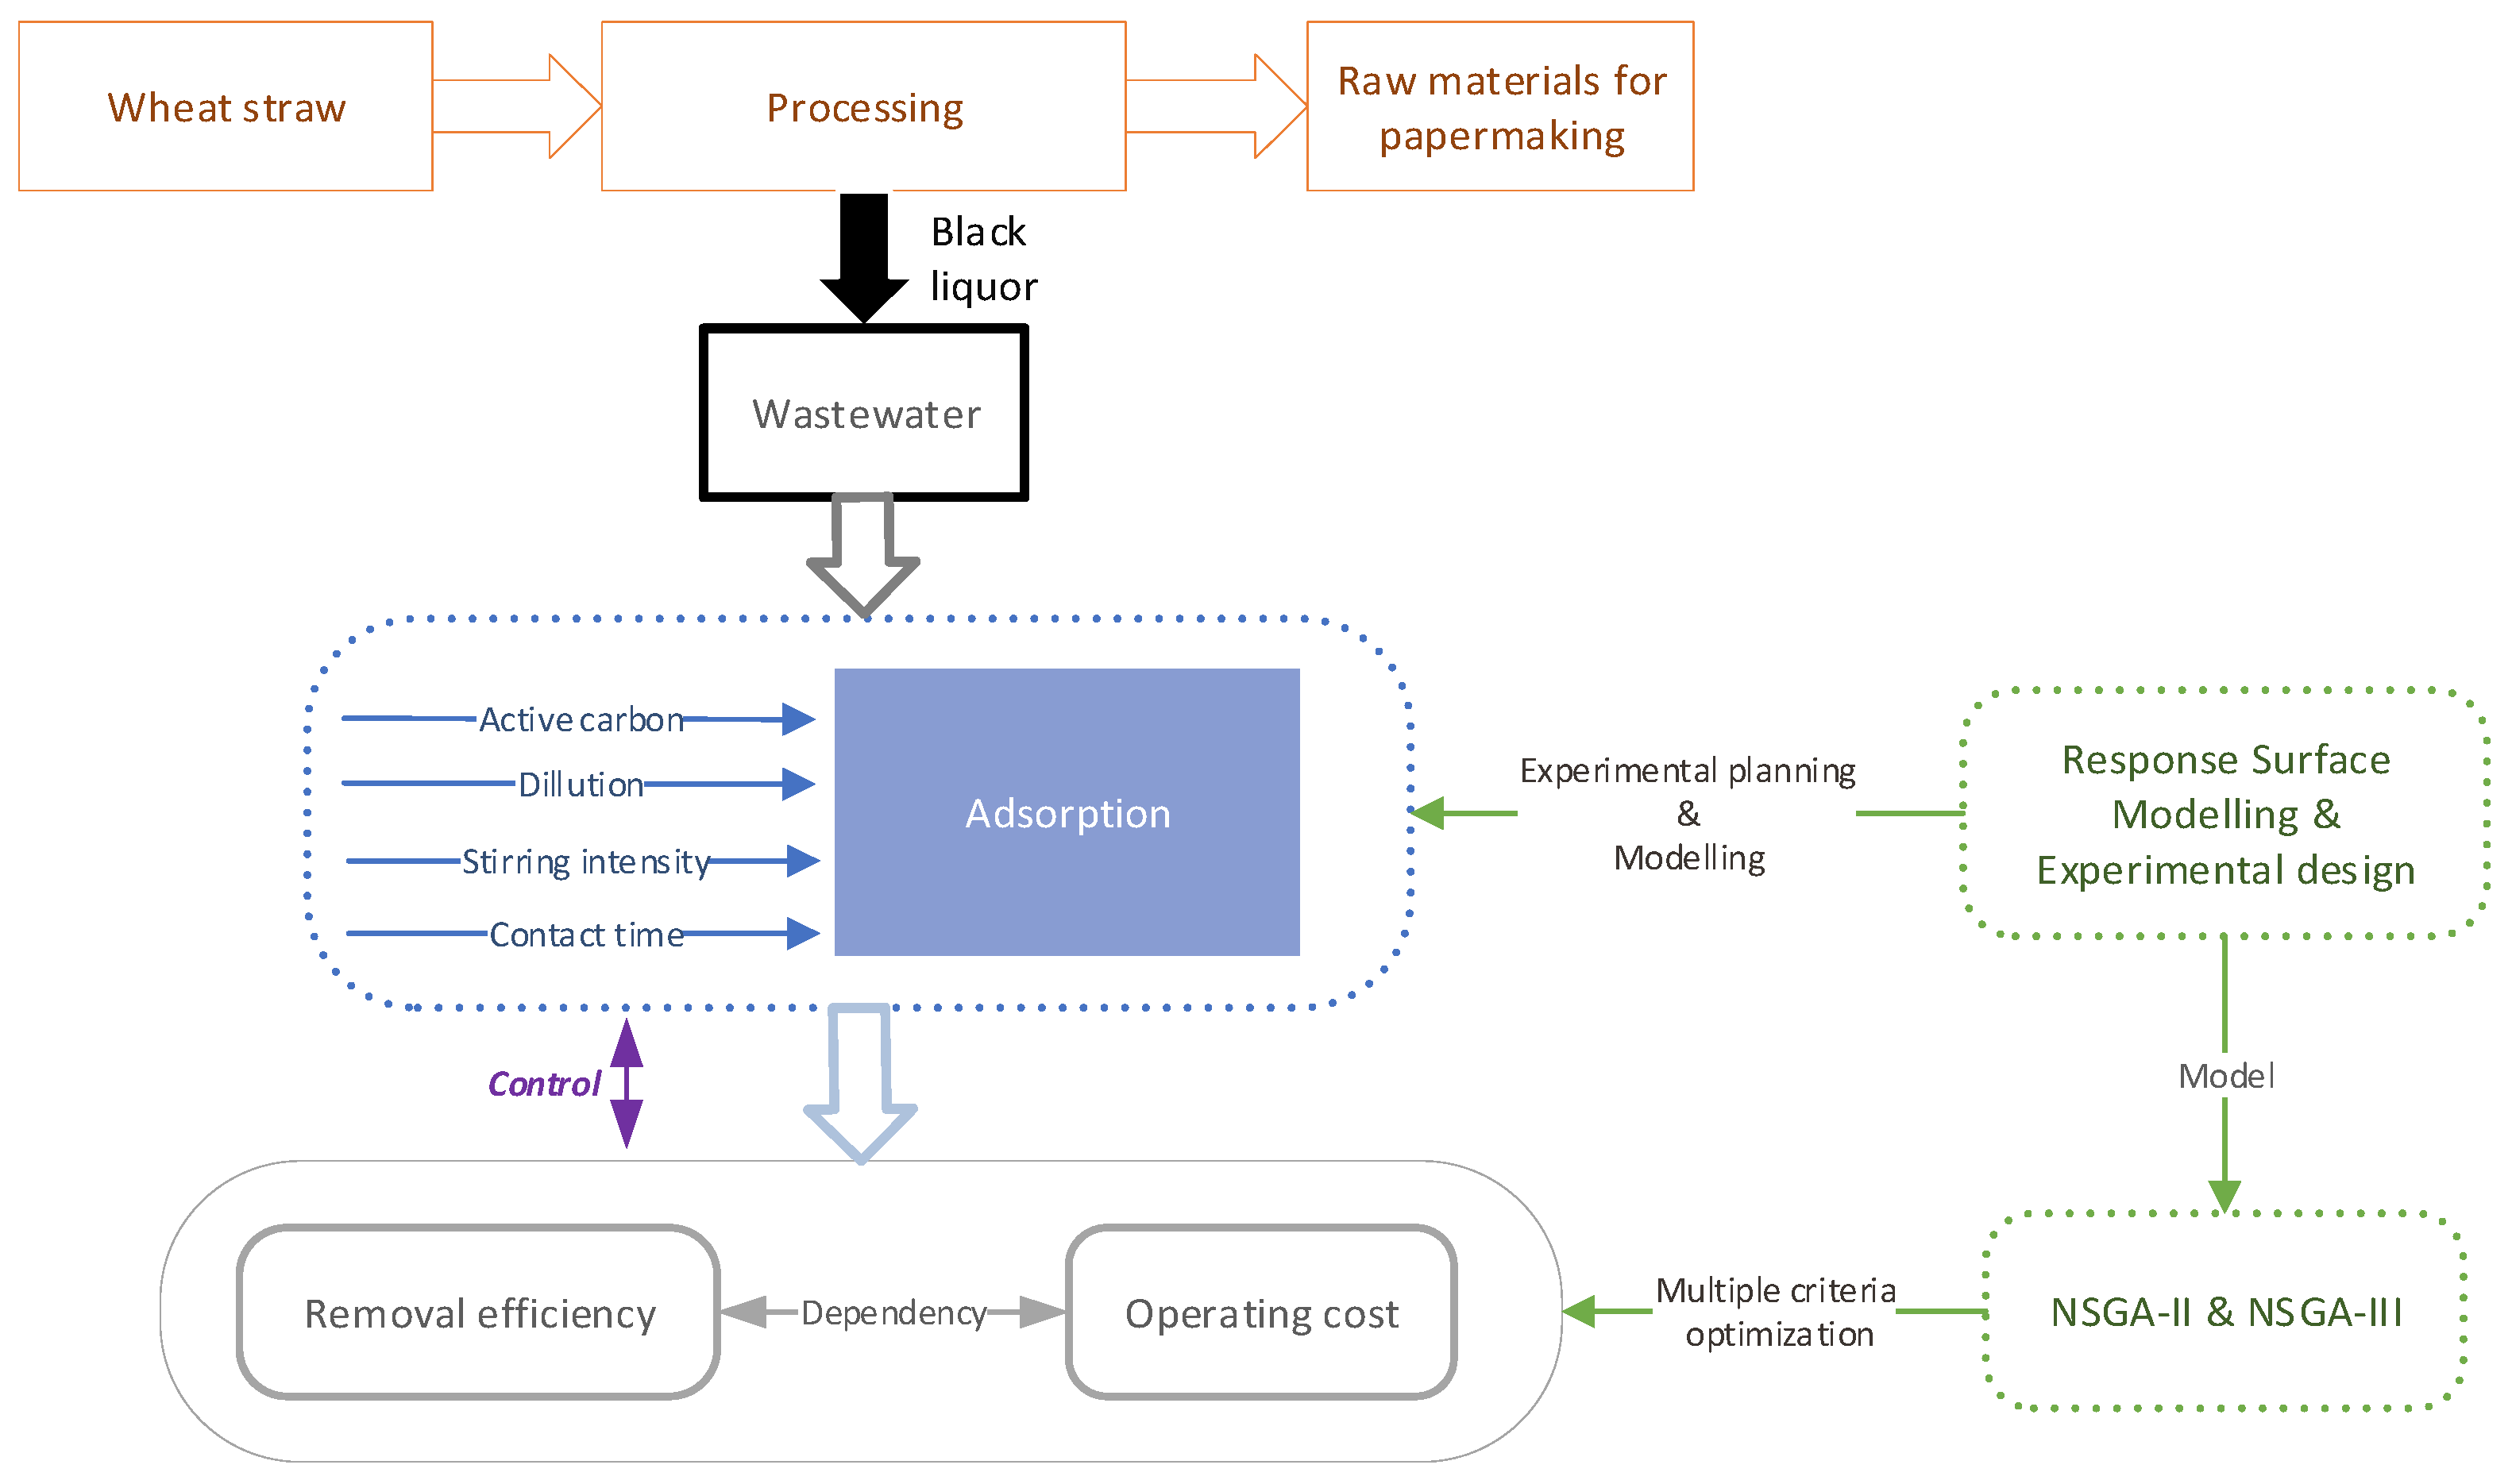
2. Materials and Methods

2.1. Chemicals

The black liquor used in this study was obtained from a laboratory-scale cellulose production system based on wheat straw (WS) pulping. Local farmers near Drăgușeni village, Suceava county, Romania, donated the wheat straws. Preliminary processing of the WS includes removing foreign materials, chopping, grinding, and sieving through a 1 mm sieve. Hot alkali extraction was used to extract the hemicelluloses, using the same equipment and following the same procedure elsewhere described [26]. In brief, 1 mm sieved material was treated with sodium hydroxide solution (NaOH, Merck, Rahway, NJ, USA) in sealed reaction vessels at a solid-to-liquid ratio of 1:30. The resulting liquor has the typical darkish-brown color and the following characteristics: density = 1011.48 kg/m3; conductivity = 3.27 S/m; the total dry solids content is 4.891 × 10⁻² kg/L of which 2.174 × 10⁻² kg/L is inorganic and 2.717 × 10⁻² kg/L is organic; acid-insoluble lignin content = 5.3 × 10⁻³ kg/L; soluble xylan content = 5.4 × 10⁻³ kg/L.
Commercial activated carbon cylinders were provided by Buzău Romcarbon Company (Buzău, Romania). The cylindrical AC were ground and sieved into irregularly shaped carbon particles with average diameters ranging from 2.5 to 3.15 × 10⁻³ m, with the following characteristics: specific microporous volume 0.48 × 10⁻³ m3/kg, total microporous volume 0.66 × 10⁻³ m3/kg, mean pore size 1.62 × 10⁻⁹ m, BET surface 1.403 m2/kg, external surface 3.8 × 10⁻² m2/kg, and total surface 0.631 m2/kg [67]. The SEM analysis of the adsorbent can be found in [68].

2.2. Equipment

The UV-VIS spectra and the absorbance values were recorded using a U5100 HITACHI spectrophotometer. The chemical oxygen demand (COD) g O2 per L was measured using a standard Hach-Lange kit LCK 114. A digital overhead DLS Stirrer (Velp Scientifica, Deer Park, NY, USA) was used to control the stirring intensity.

2.3. Batch Experiments

Batch adsorption experiments were performed at room temperature in 0.5 L Berzelius beakers, under continuous stirring, following the experimental design. All experiments were conducted without pH adjustments to the BL solutions to keep the processes as environmentally friendly as possible (no supplementary chemicals were added).
The decolorization was checked by measuring the absorbance of the solution given by the lignin content at 280 nm (LA). The efficacy of BL decolorization was calculated using the following equation:
η   ( % ) = LA i LA f LA i × 100 ,
where [LA]i and [LA]f denote the initial and final lignin absorbance, respectively.
The correlation between COD and absorbance was determined at various dilution ratios to establish a calibration curve that validates the accuracy of decolorization efficiency calculations. The dependence relation between the absorbance (y) and the COD (x) is y = 0.0057x, with a linear correlation of 0.9935.

2.4. Experimental Design and Operating Cost

Table 1 shows the variation ranges of the designated variables: reaction time, stirrer rotation speed, BL dilution, and activated carbon concentration.
To determine the process yield (Y1), 26 experiments (including center point replications) were carried out, as presented in Table 2. Each experiment’s operating cost (Y2) is determined using Equation (2) based on the following expenses: electrical energy and chemical consumption. The coefficients a = 64 × 10−4 and b = 4.4 × 10⁻⁶ represent the activated carbon price in Euro/g and the average electrical energy price in Euro/W in Romania in February 2022.
Y2 = a × mAC + b × EC × t,
where mAC stands for the amount of activated carbon, [g]; EC signifies the energy consumption, (W/min); and t represents the processing time, (min).

2.5. Multi-Objective Optimization

For the considered process, there are two objectives, Y1 and Y2. The former requires maximization, while the latter requires minimization. The problems where multiple objectives are sought are called multi-objective problems (MOP). A MOP can be defined as a vector of objective functions [69]:
Minimize F(x) = (f1(x),f2(x),...,fn(x))
Subject to xΦ,
where Φ is the decision variable space (the range defined in Table 1), n is the number of objectives, and x = (x1, x2, ..., xm), with m the number of parameters. For the black liquor decolorization process, n = 2 and m = 4.
In this case, multiple solutions are found, yet the goal is to identify the subset of interest (the solutions where a relationship of dominance exists) and the best tradeoff that can be achieved [70,71]. For two solutions u = (u1, …, um) and v = (v1, …, vm), u dominates v if ui < vi ∀i = (1,m). In this context, a solution x* is referred to as Pareto optimal if there is no solution x ∈ Φ such that F(x) dominates F(x*). All optimal Pareto solutions form a Pareto set, and the corresponding objective vectors are referred to as the Pareto front [72].
Not all optimization algorithms can deal with MOP, and in this work, two variants of Genetic Algorithms (namely, NSGA-II [73] and NSGA-III [74]) were used to solve the problem. These approaches were selected based on their popularity and efficiency in various synthetic and real-life situations, providing proper solutions [75,76].
The basis function of NSGA-II is similar to that of every evolutionary algorithm: an initial population of solutions is evolved until a stop criterion is reached. Evolution is based on mutation, crossover, and selection. However, in NSGA-II, the principle of non-dominant level is applied to select the next population. For example, at t generation, from the population Pt (having individuals), the offspring population Qt is created (having individuals). From the combined Pt and Qt populations, the best individuals are selected by employing the non-domination principle combined with a niche-preservation operator based on the crowding distance. More details about NSGA-II can be found in [73].
NSGA-III is similar to NSGA-II. However, there are significant differences between the selection operator and the strategy for diversity maintenance. In NSGA-III, the crowding distance used in NSGA II is replaced with a new procedure that uses: (i) a determination of reference points on a hyper-plane based on the Das and Dennis approach; (ii) an adaptive normalization of individuals; (iii) an association operator that links each individual with a reference point; and (iv) a niche preservation operation that determines the crowding distance based on an objective-wise normalization distance [74].
After the solutions forming the Pareto front were identified by the NSGA-based approaches, the next step consisted of retrieving the best value, a stage referred to as Decision-Making (DM). In this work, DM is carried out using the pseudo-weights approach [77] and the trade-off metric [78]. The pseudo-weights approach is the most commonly used strategy and relies on scalarizing a set of objectives into a single objective. Thus, the solution becomes a function of the ratio of the considered weights [77].
The described methodology was applied using Python and the pymoo framework [79]. All simulations were performed on a computer with an Intel I9 processor, 16 GB of RAM, an NVIDIA Quadro P2000 video card, a 512 GB PCIe NVMe hard disk, and the Windows 11 Pro operating system. A schema of the workflow performed in this work is presented in Figure 1.

3. Results and Discussions
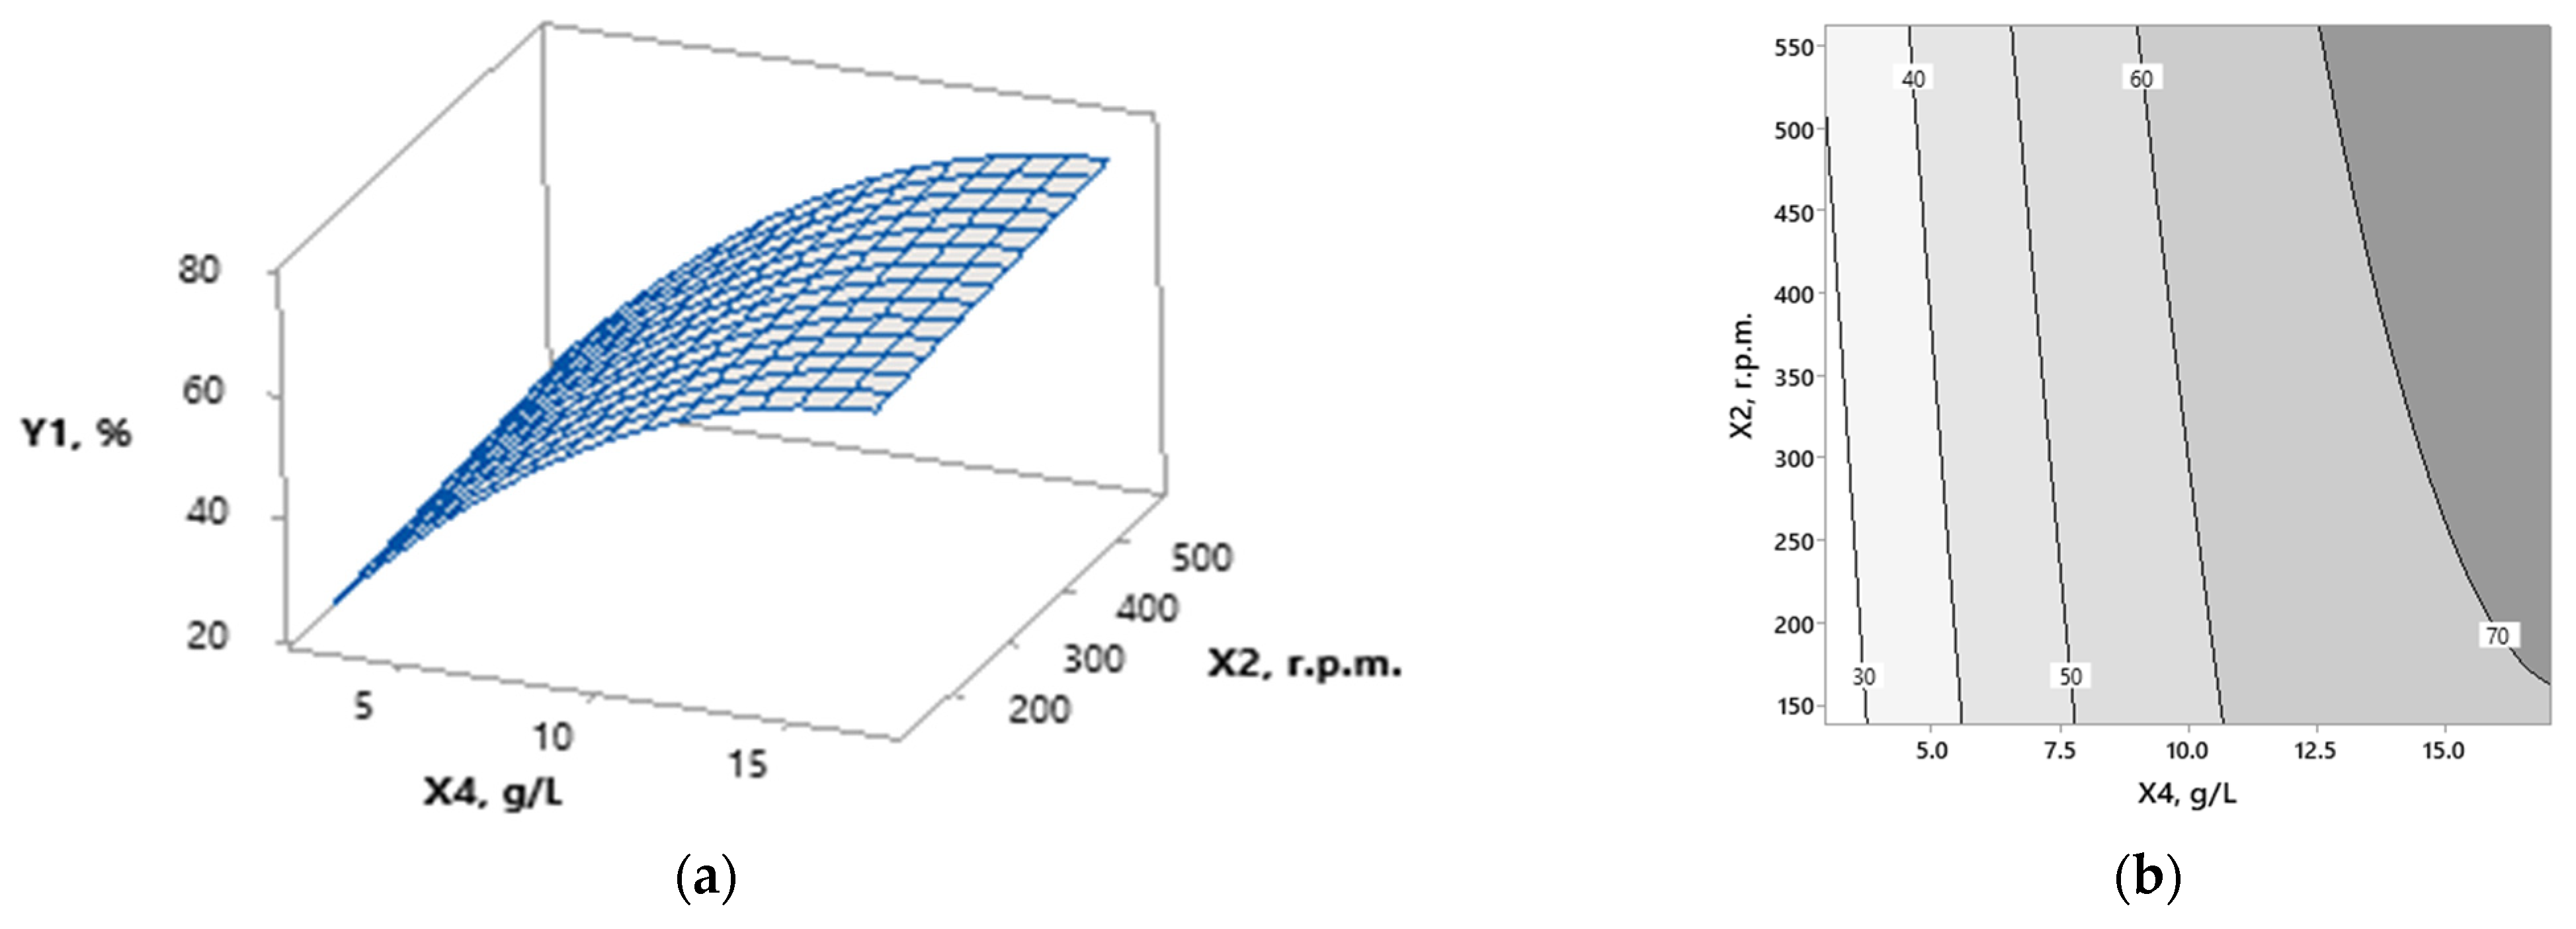
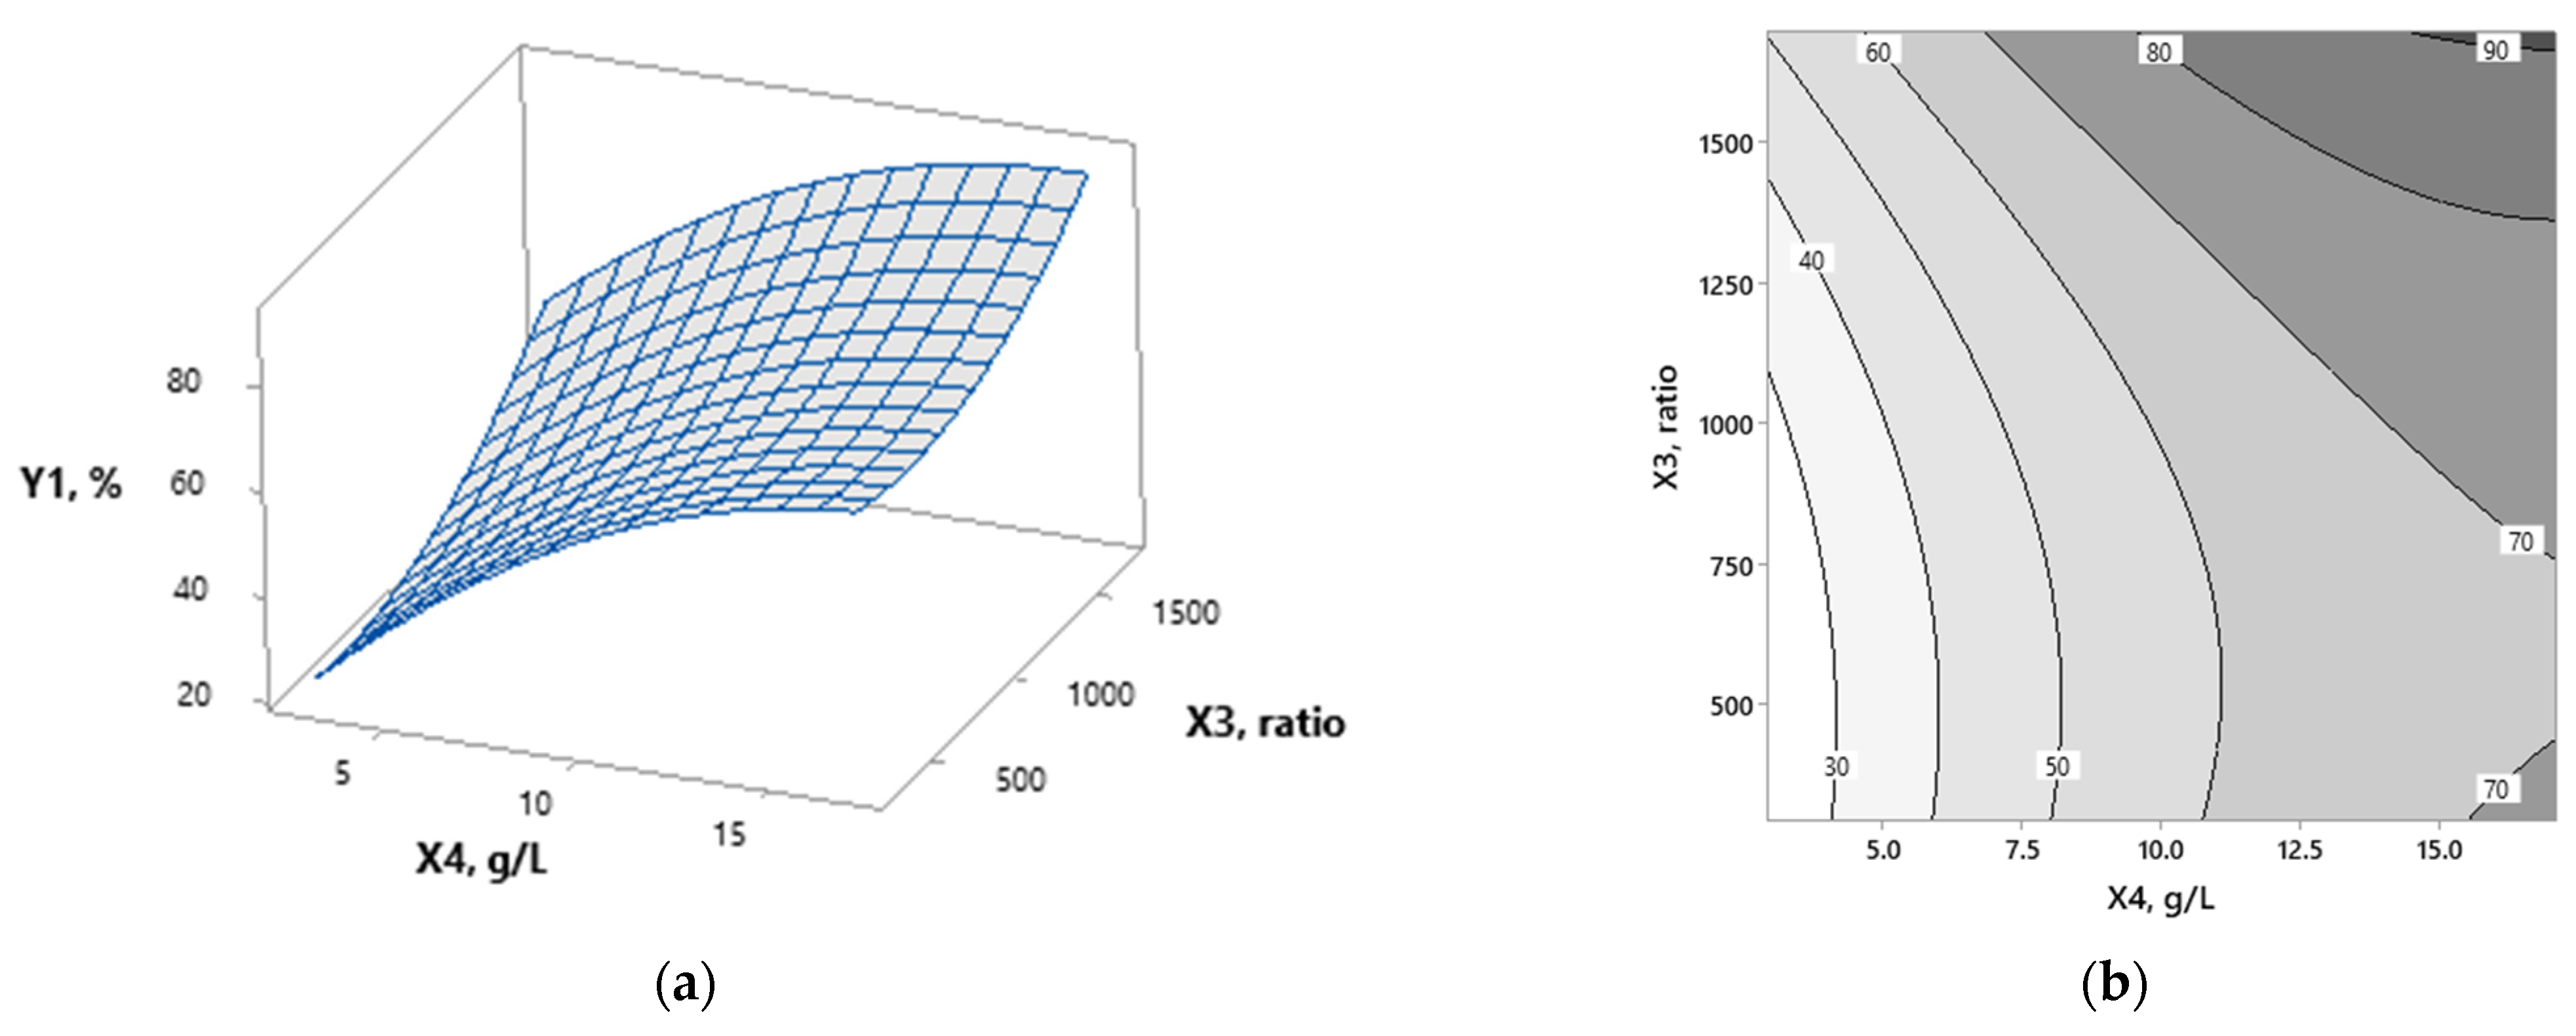
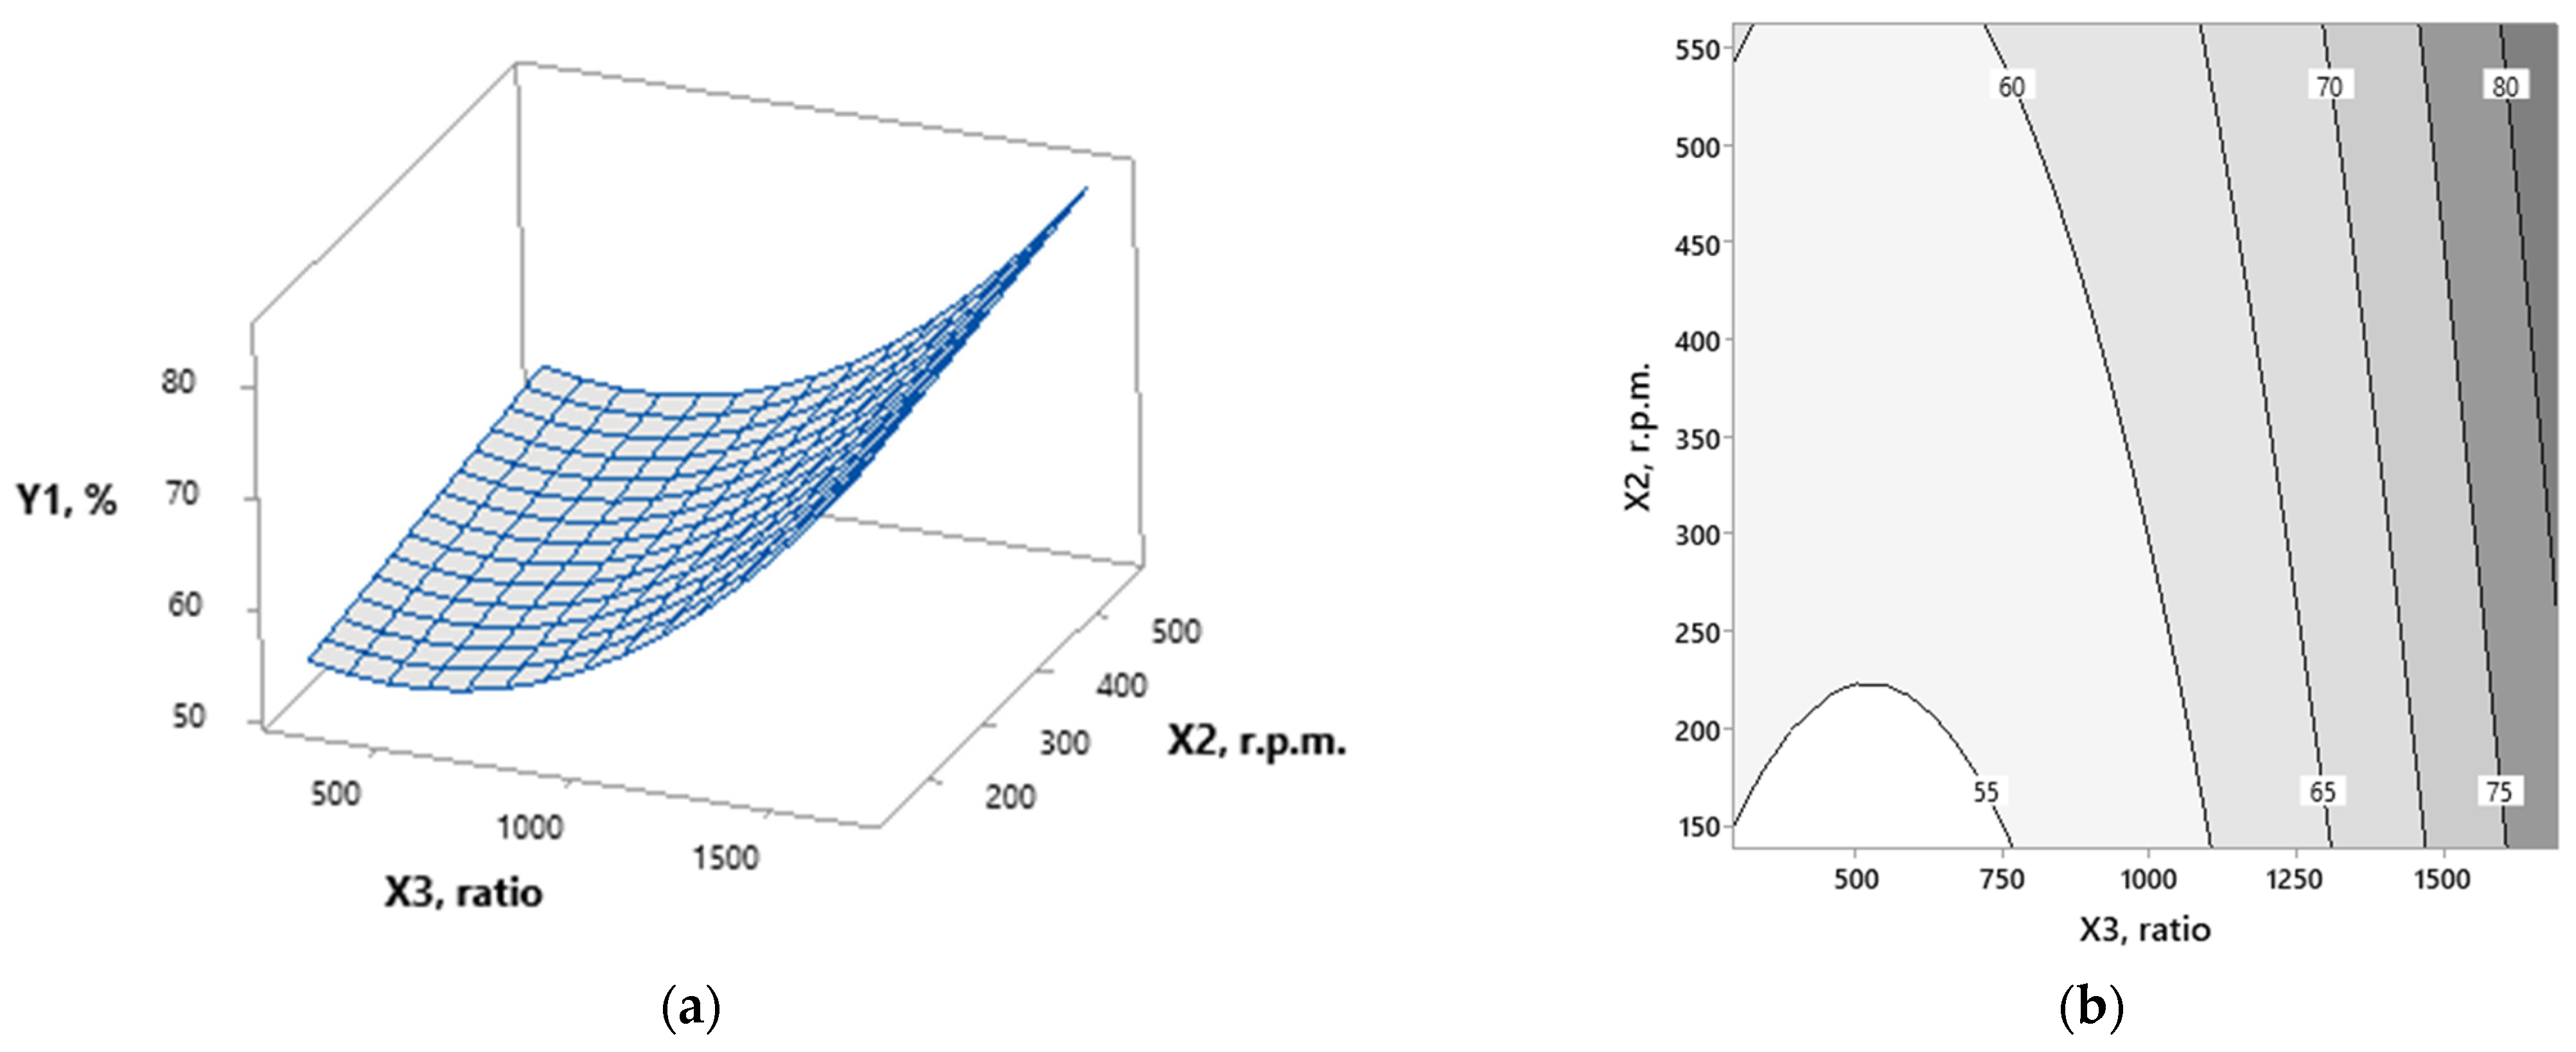
3.1. Modeling

Based on the experimental plan from Table 2, the decolorization yield was determined experimentally, and the economic cost was computed. Based on this data and using Minitab, the Forward Selection (FS) algorithm was applied to select the best-suited statistical model able to predict the yield efficiently. In this case, the starting point is the most significant invariant model. Furthermore, all the independent variables not included are evaluated, and the most significant ones are added until no one is left [80].
The resulting regression model had an R2 of 94.6%, an adjusted R2 of 92.06%, and a predicted R2 of 82.55%, as described by Equation (4). The analysis of variance for this regression model is presented in Table 3, where it can be observed that the most influential parameter on the model is the adsorbent amount (57.99%).
Y1(%) = −28.7 + 1.908 × X1 + 0.01273 × X2 0.0151 × X3 + 7.76·X4 0.02928 × X1 × X1 + 0.000018 × XX3 0.2111 × X4 × X4 0.000378 × X3 × X4.
Three-dimensional plots (surface plots) are drawn by fixing two parameters to the values in the middle of the designated variation interval, as shown in Figure 2, Figure 3, Figure 4, Figure 5, Figure 6 and Figure 7. The effect of the chosen parameters on the decolorization efficiency is highlighted, and the optimal values are readily identifiable.
The interactive effect of activated carbon concentration and stirring intensity on the process yield is illustrated in Figure 2a,b. It is generally acknowledged that the mechanism for pollutants retention by adsorption involves several steps: bulk diffusion, film diffusion, pore diffusion or intra-particle diffusion, and chemical adsorption/reaction [81]. Increasing the AC concentration corresponds to increasing surface area and the number of active sites, whereas increasing the stirring intensity favors bulk and film diffusion. As a result, the individual effect of AC increases leads to a more significant increase in efficiency compared with the individual impact of stirring.
The combined effect of AC concentration and black liquor dilution on the process yield is depicted in Figure 3a,b. It can be observed that the percentage of adsorbed BL increases with the increase in adsorbent dosage, specifically at higher dilution ratios. This indicates that a relatively small number of adsorbate molecules can access a large adsorption surface area.
The evolution of the process yield as a function of the contact time and black liquor dilution is presented in Figure 4a,b. Concerning black liquor, the dilution ratio increase leads to an efficiency increase. At higher black liquor concentrations, the decolorization yield begins to decrease as adsorption becomes competitive with respect to the number of active sites. The number of competitive adsorbate molecules decreases as the dilution ratio increases, and the decolorization yield reaches higher values.
As previously mentioned, stirring intensity affects bulk and film diffusion. This favors the adsorption efficiency for diluted and concentrated BL solutions (as depicted in Figure 5a,b), with a slight advantage for the latter due to less pronounced competitive adsorption.
The collective effect of contact time and stirring intensity on decolorization efficacy is shown in Figure 6a,b. The movement of adsorbent particles into the BL-contaminated wastewater positively affects the process output at the start of the adsorption process. As the number of active adsorption centers reaches a maximum occupancy level, the decolorization yield tends to decrease due to the competitive adsorption and the washing effect generated by the increase in the stirring intensity.
The combined effect of AC concentration and contact time on the process yield (Figure 7a,b) suggests that a maximum level of adsorbed molecules can be attained after a certain time. Following that, there is a slight decrease in decolorization efficiency, most likely due to a decline in available active adsorption sites and competitive adsorption among the black liquor components.

3.2. Optimization

After the statistical regression model of the process was determined (as described in Equation (2)), the process was optimized using: (i) Minitab software; (ii) multi-objective optimization based on NSGA-II and NSGA III. The single-objective optimization focusing on the decolorization yield is presented in Table 4. The corresponding economic cost (Y2), also shown in Table 4, was computed using Equation (2).
For the second optimization approach, the two NSGA versions considered were applied to identify the optimal economic conditions of the process. To run the two GA-based algorithms, the parameters were set as follows: population size = 100, number of offspring = 20, and generation number = 30. The type of crossover used is Simulated Binary Crossover (SBX), the mutation is Polynomial Mutation (PM) [82], and the stop criteria is the number of generations reaching the predefined value. Whereas the Minitab software approach was focused on maximizing the decolorization yield, in this case, the objective was to find the best tradeoff between efficiency and cost. In this case, the tradeoff is defined as the net gain from the improvement of some objectives accompanied by the deterioration of other objectives resulting from substituting one objective vector with another [78].
Figure 8 presents the Pareto solutions obtained with the two algorithms where no constraints are imposed on the process parameters.
Figure 8 depicts the results of the multi-objective evaluation, which included objectives 1/Y1 and Y2. Within the Pymoo framework, all goals must be either minimized or maximized. As a result, the decolorization yield was inverted to its minimum value. A comparison between the solutions indicates that the same interval was determined by the two algorithms applied. However, NSGA-II identified more solutions than NSGA-III (70 vs. 8). These differences can be explained by the distinct mechanisms used for diversity maintenance.
Moreover, by analyzing the values of the intervals for the 1/Y1 and Y2 axes, it can be observed that they are not in the same interval. Thus, Y2 tends to dominate any distance calculation in the objective space due to its more extensive scale. Therefore, a normalization procedure was applied before using the DM procedures, considering the minimum and maximum points in the objective space. The type of normalization carried out in this work is Min-Max [83], and the target interval considered is [0, 1].
After that, the DM procedure was applied to determine the best solutions that fit the objectives of the current problem. The results are presented in Table 5.
As shown in Table 5, the identified best solutions from the Y2 output are higher for the NSGA-II approach compared with NSGA-III. Nevertheless, the decolorization yield (Y1) is slightly lower. This indicates a direct correlation between Y1 and Y2, with the rise in efficiency leading to a higher process cost. The results from Table 5 represent the best equilibrium between the two objectives from the multitude of solutions identified by the two algorithms. The positions of these solutions relative to the entire Pareto for the NSGA-II algorithm are presented in Figure 9.
As can be observed from Figure 9, for the Pseudo-weight variant, a single solution is identified using weight vectors that provide relative importance to each objective in the solution [77]. On the other hand, multiple solutions are provided for the high-tradeoff strategy.
The analysis of variance for the process decolorization efficiency shows that the activated carbon concentration has the highest contribution to the model (as presented in Table 3). Moreover, this parameter highly influences the economic cost. Thus, the multi-objective procedure was also applied when constraining the concentration of the activated carbon to the interval [2.73, 10] g/L. The results obtained after applying the DM strategies are presented in Table 6. As can be observed, the limitation of the considered parameter leads to a mild reduction in efficiency and, at the same time, a cost reduction.
For decolorization efficiency, the analysis of variance shows that the stirrer rotation speed has a minor contribution to the model (as presented in Table 3). However, this parameter might significantly influence the process cost as it can vary substantially in accordance with the energy markets. Thus, the multi-objective procedure was also applied when constraining the stirrer rotation to half of the experimental interval: [137.9, 350] r.p.m. The results obtained after applying the DM strategies are presented in Table 7.
According to Table 7, the values for Y1 and Y2 are comparable to the experimental interval-based optimization (Table 5). This indicates that even when supplementary restrictions are considered, the optimization strategy can identify reasonable solutions that represent a compromise between efficiency and cost.
As previously mentioned, no techno-economic studies have studied black liquor decolorization by adsorption on activated carbon. However, several papers deal with techno-economic studies on wastewater decolorization/remediation using various techniques (see Table 8). It is crucial to note that in the majority of these studies, cost estimations are conducted after technological optimization (Table 7) and are centered on determining the production cost of key ingredients (e. g., cassava peel starch [84], orange peel extract biosynthesized zinc oxide nanoparticles [85], or chickpea powder and chickpea-based biochar [86]).

4. Limitations and Future Work

This study showed that using a bio-inspired metaheuristic, a multi-objective optimization of the decolorization of black liquor from wheat straw focusing on improved efficiency and low economic costs can be achieved. Since the characteristics of the black liquor can differ from batch to batch and from source to source, one of the current study’s limitations is related to the somewhat restricted area of applying the optimization results. Thus, although the selected methodology (combining DOE, RSM, and NSGA) is flexible and can be applied in multiple cases to broaden the optimization data’s applicability area, more use cases (black liquor from different sources) can be combined and simultaneously optimized. Similarly, different types of activated carbon obtained from various sources can be tested to assess the importance of the absorbent characteristics on the overall process performance. In this case, RSM might not be the best-suited modeling strategy, and since additional datasets would be available (including both different black liquor sources and different types of active carbon), Artificial Neural Networks applied simply or combined into stacks could offer enhanced performance.

5. Conclusions

In this work, the decolorization of black liquor obtained from wheat straw was studied using standard commercial activated carbon. The influence of four parameters: reaction time, stirrer rotation speed, black liquor dilution ratio, and activated carbon concentration, was evaluated from a technological and economic perspective. Based on the experimental results, a model describing the relationship between the outputs of the system and its parameters was determined using RSM. According to this model, the highest influence was attributed to activated carbon concentration (57.99%), black liquor dilution (16.46%), contact time (10.3%), and stirrer rotation speed (0.85%).
The resulting regression statistical model was then used for process optimization. Two solutions were tested: (i) classical Minitab and (ii) multi-objective optimization based on NSGA-II and NSGA-III algorithms. In addition, the GA-based optimizers were tested considering: (i) the entire experimental domain; (ii) limiting the activated carbon to a maximum of 10 g/L; and (iii) limiting the stirrer rotation speed to a maximum of 350 r.p.m. The objective was to show that although the tendency is to go towards the highest removal efficiency from economic considerations, this is not always viable, and a tradeoff between efficiency and cost must be followed. The results obtained indicated that a relatively high efficiency (~92%) could be achieved even when restrictive conditions are considered (e.g., limiting the reaction time) with good economic performance (~0.11 Euro/experiment).

Author Contributions

Conceptualization, G.D.S. and M.T.N.; methodology, E.N.D. and M.T.N.; software, E.N.D.; validation, G.D.S. and A.C.P.; formal analysis, M.T.N.; writing—original draft preparation, G.D.S., E.N.D. and M.T.N.; writing—review and editing, E.N.D. and A.C.P.; visualization, A.C.P.; supervision, M.T.N.; funding acquisition, E.N.D. All authors have read and agreed to the published version of the manuscript.

Funding

This research was funded by “Program 4: Fundamental and Frontier Research—Exploratory Research Projects” financed by UEFISCDI (project no. PCE 58/2021).

Data Availability Statement

Data is contained within the article.

Conflicts of Interest

The authors declare no conflict of interest.

References

  1. Thompson, G.; Swain, J.; Kay, M.; Forster, C.F. The treatment of pulp and paper mill effluent: A review. Bioresour. Technol. 2001, 77, 275–286. [Google Scholar] [CrossRef]
  2. Toczyłowska-Mamińska, R. Limits and perspectives of pulp and paper industry wastewater treatment—A review. Renew. Sustain. Energy Rev. 2017, 78, 764–772. [Google Scholar] [CrossRef]
  3. Li, N.; An, X.; Xiao, X.; An, W.; Zhang, Q. Recent advances in the treatment of lignin in papermaking wastewater. World J. Microbiol. Biotechnol. 2022, 38, 116. [Google Scholar] [CrossRef] [PubMed]
  4. Jauhar, S.K.; Raj, P.V.R.P.; Kamble, S.; Pratap, S.; Gupta, S.; Belhadi, A. A deep learning-based approach for performance assessment and prediction: A case study of pulp and paper industries. Ann. Oper. Res. 2022. [Google Scholar] [CrossRef]
  5. Haq, I.; Kalamdhad, A.S.; Pandey, A. Genotoxicity evaluation of paper industry wastewater prior and post-treatment with laccase producing Pseudomonas putida MTCC 7525. J. Clean. Prod. 2022, 342, 130981. [Google Scholar] [CrossRef]
  6. Ali, M.; Sreekrishnan, T.R. Aquatic toxicity from pulp and paper mill effluents: A review. Adv. Environ. Res. 2001, 5, 175–196. [Google Scholar] [CrossRef]
  7. Baturina, M.A.; Kononova, O.N. Impact of Wastewater from the Pulp and Paper Industry on Aquatic Zoocenoses: A Review of the Literature. Contemp. Probl. Ecol. 2021, 14, 579–587. [Google Scholar] [CrossRef]
  8. Kamali, M.; Khodaparast, Z. Review on recent developments on pulp and paper mill wastewater treatment. Ecotoxicol. Environ. Saf. 2015, 114, 326–342. [Google Scholar] [CrossRef] [PubMed]
  9. Ashrafi, O.; Yerushalmi, L.; Haghighat, F. Wastewater treatment in the pulp-and-paper industry: A review of treatment processes and the associated greenhouse gas emission. J. Environ. Manag. 2015, 158, 146–157. [Google Scholar] [CrossRef] [PubMed]
  10. Kumar, A.; Singh, A.K.; Bilal, M.; Prasad, S.; Rameshwari, K.R.T.; Chandra, R. Chapter 17—Paper and pulp mill wastewater: Characterization, microbial-mediated degradation, and challenges. In Nanotechnology in Paper and Wood Engineering; Bhat, R., Kumar, A., Nguyen, T.A., Sharma, S., Eds.; Elsevier: Amsterdam, The Netherlands, 2022; pp. 371–387. [Google Scholar]
  11. Patel, K.; Patel, N.; Vaghamshi, N.; Shah, K.; Duggirala, S.M.; Dudhagara, P. Trends and strategies in the effluent treatment of pulp and paper industries: A review highlighting reactor options. Curr. Res. Microb. Sci. 2021, 2, 100077. [Google Scholar] [CrossRef]
  12. Owens, J.W. The hazard assessment of pulp and paper effluents in the aquatic environment: A review. Environ. Toxicol. Chem. 1991, 10, 1511–1540. [Google Scholar] [CrossRef]
  13. Bajpai, P.; Bajpai, P.K. Biological colour removal of pulp and paper mill wastewaters. J. Biotechnol. 1994, 33, 211–220. [Google Scholar] [CrossRef]
  14. Garg, S.K.; Tripathi, M. Strategies for Decolorization and Detoxification of Pulp and Paper Mill Effluent. In Reviews of Environmental Contamination and Toxicology Volume 212; Whitacre, D.M., Ed.; Springer: New York, NY, USA, 2011; pp. 113–136. [Google Scholar]
  15. Kumar, A.; Srivastava, N.K.; Gera, P. Removal of color from pulp and paper mill wastewater- methods and techniques—A review. J. Environ. Manag. 2021, 298, 113527. [Google Scholar] [CrossRef] [PubMed]
  16. Wani, W.A.; Pathan, S.; Bose, S. The Journey of Alternative and Sustainable Substitutes for “Single-Use” Plastics. Adv. Sustain. Syst. 2021, 5, 2100085. [Google Scholar] [CrossRef]
  17. Tan, J.; Tiwari, S.K.; Ramakrishna, S. Single-Use Plastics in the Food Services Industry: Can It Be Sustainable? Mater. Circ. Econ. 2021, 3, 7. [Google Scholar] [CrossRef]
  18. As’ad Mahpuz, A.S.; Muhamad Sanusi, N.A.S.; Jusoh, A.N.C.; Amin, N.J.M.; Musa, N.F.; Sarabo, Z.; Othman, N.Z. Manifesting sustainable food packaging from biodegradable materials: A review. Environ. Qual. Manag. 2022, 32, 379–396. [Google Scholar] [CrossRef]
  19. Degli Esposti, M.; Morselli, D.; Fava, F.; Bertin, L.; Cavani, F.; Viaggi, D.; Fabbri, P. The role of biotechnology in the transition from plastics to bioplastics: An opportunity to reconnect global growth with sustainability. FEBS Open Bio 2021, 11, 967–983. [Google Scholar] [CrossRef] [PubMed]
  20. Abdelmoez, W.; Dahab, I.; Ragab, E.M.; Abdelsalam, O.A.; Mustafa, A. Bio- and oxo-degradable plastics: Insights on facts and challenges. Polym. Adv. Technol. 2021, 32, 1981–1996. [Google Scholar] [CrossRef]
  21. Phelan, A.; Meissner, K.; Humphrey, J.; Ross, H. Plastic pollution and packaging: Corporate commitments and actions from the food and beverage sector. J. Clean. Prod. 2022, 331, 129827. [Google Scholar] [CrossRef]
  22. Johansen, M.R.; Christensen, T.B.; Ramos, T.M.; Syberg, K. A review of the plastic value chain from a circular economy perspective. J. Environ. Manag. 2022, 302, 113975. [Google Scholar] [CrossRef]
  23. Dixit, S.; Yadav, V.L. Comparative study of polystyrene/chemically modified wheat straw composite for green packaging application. Polym. Bull. 2020, 77, 1307–1326. [Google Scholar] [CrossRef]
  24. Kim, T.; Bamford, J.; Gracida-Alvarez, U.R.; Benavides, P.T. Life Cycle Greenhouse Gas Emissions and Water and Fossil-Fuel Consumptions for Polyethylene Furanoate and Its Coproducts from Wheat Straw. ACS Sustain. Chem. Eng. 2022, 10, 2830–2843. [Google Scholar] [CrossRef]
  25. Mohammad Rahmani, A.; Gahlot, P.; Moustakas, K.; Kazmi, A.A.; Shekhar Prasad Ojha, C.; Tyagi, V.K. Pretreatment methods to enhance solubilization and anaerobic biodegradability of lignocellulosic biomass (wheat straw): Progress and challenges. Fuel 2022, 319, 123726. [Google Scholar] [CrossRef]
  26. Puițel, A.C.; Suditu, G.D.; Danu, M.; Ailiesei, G.-L.; Nechita, M.T. An Experimental Study on the Hot Alkali Extraction of Xylan-Based Hemicelluloses from Wheat Straw and Corn Stalks and Optimization Methods. Polymers 2022, 14, 1662. [Google Scholar] [CrossRef]
  27. Huang, L.-Z.; Ma, M.-G.; Ji, X.-X.; Choi, S.-E.; Si, C. Recent Developments and Applications of Hemicellulose From Wheat Straw: A Review. Front. Bioeng. Biotechnol. 2021, 9, 690773. [Google Scholar] [CrossRef] [PubMed]
  28. Janaswamy, S.; Yadav, M.P.; Hoque, M.; Bhattarai, S.; Ahmed, S. Cellulosic fraction from agricultural biomass as a viable alternative for plastics and plastic products. Ind. Crops Prod. 2022, 179, 114692. [Google Scholar] [CrossRef]
  29. Data Bridge Market Research. Global Wheat Straw Market—Industry Trends and Forecast to 2029. Available online: https://www.databridgemarketresearch.com/reports/global-wheat-straw-market (accessed on 5 August 2023).
  30. Foodand Agriculture Organization of United Nations. Crops and Livestock Products. Available online: https://www.fao.org/ (accessed on 5 August 2023).
  31. Holmatov, B.; Hoekstra, A.Y.; Krol, M.S. EU’s bioethanol potential from wheat straw and maize stover and the environmental footprint of residue-based bioethanol. Mitig. Adapt. Strateg. Glob. Chang. 2021, 27, 6. [Google Scholar] [CrossRef]
  32. Jiang, B.; Chen, C.; Liang, Z.; He, S.; Kuang, Y.; Song, J.; Mi, R.; Chen, G.; Jiao, M.; Hu, L. Lignin as a Wood-Inspired Binder Enabled Strong, Water Stable, and Biodegradable Paper for Plastic Replacement. Adv. Funct. Mater. 2020, 30, 1906307. [Google Scholar] [CrossRef]
  33. Su, Y.; Yang, B.; Liu, J.; Sun, B.; Cao, C.; Zou, X.; Lutes, R.; He, Z. Prospects for Replacement of Some Plastics in Packaging with Lignocellulose Materials: A Brief Review. BioResources 2018, 13, 27. [Google Scholar] [CrossRef] [Green Version]
  34. Wang, X.; Xia, Q.; Jing, S.; Li, C.; Chen, Q.; Chen, B.; Pang, Z.; Jiang, B.; Gan, W.; Chen, G.; et al. Strong, Hydrostable, and Degradable Straws Based on Cellulose-Lignin Reinforced Composites. Small 2021, 17, 2008011. [Google Scholar] [CrossRef]
  35. Pires, J.R.A.; de Souza, V.G.L.; Fernando, A.L. Production of Nanocellulose from Lignocellulosic Biomass Wastes: Prospects and Limitations; Springer: Cham, Switzerland, 2019; pp. 719–725. [Google Scholar]
  36. Raj, T.; Chandrasekhar, K.; Naresh Kumar, A.; Kim, S.-H. Lignocellulosic biomass as renewable feedstock for biodegradable and recyclable plastics production: A sustainable approach. Renew. Sustain. Energy Rev. 2022, 158, 112130. [Google Scholar] [CrossRef]
  37. Hao, O.J.; Kim, H.; Chiang, P.-C. Decolorization of Wastewater. Crit. Rev. Environ. Sci. Technol. 2000, 30, 449–505. [Google Scholar] [CrossRef]
  38. Lin, Y.-H.; Ho, B.-H. Kinetics and Performance of Biological Activated Carbon Reactor for Advanced Treatment of Textile Dye Wastewater. Processes 2022, 10, 129. [Google Scholar] [CrossRef]
  39. Issa, Y.S.; Hamad, K.I.; Algawi, R.J.; Humadi, J.I.; Al-Salihi, S.; Ahmed, M.A.; Hassan, A.A.; Jasim, A.-K.A. Removal efficiency and reaction kinetics of phenolic compounds in refinery wastewater by nano catalytic wet oxidation. Int. J. Renew. Energy Dev. 2023, 12, 508–519. [Google Scholar] [CrossRef]
  40. AlRubaiea, J.F.; Latteiff, F.A.; Mahdi, J.M.; Atiya, M.A.; Majdi, H.S. Desalination of Agricultural Wastewater by Solar Adsorption System: A Numerical Study. Int. J. Renew. Energy Dev. 2021, 10, 901–910. [Google Scholar] [CrossRef]
  41. Devi, M.M.; Saravanamurugan, S. Chapter 16—Biomass-derived carbonaceous materials and their applications. In Biomass, Biofuels, Biochemicals; Li, H., Saravanamurugan, S., Pandey, A., Elumalai, S., Eds.; Elsevier: Amsterdam, The Netherlands, 2022; pp. 431–467. [Google Scholar]
  42. Sherugar, P.; Padaki, M.; Naik, N.S.; George, S.D.; Murthy, D.H.K. Biomass-derived versatile activated carbon removes both heavy metals and dye molecules from wastewater with near-unity efficiency: Mechanism and kinetics. Chemosphere 2022, 287, 132085. [Google Scholar] [CrossRef] [PubMed]
  43. Kadirvelu, K.; Kavipriya, M.; Karthika, C.; Radhika, M.; Vennilamani, N.; Pattabhi, S. Utilization of various agricultural wastes for activated carbon preparation and application for the removal of dyes and metal ions from aqueous solutions. Bioresour. Technol. 2003, 87, 129–132. [Google Scholar] [CrossRef] [PubMed]
  44. Osman, A.I.; Farrell, C.; Al-Muhtaseb, A.a.H.; Harrison, J.; Rooney, D.W. The production and application of carbon nanomaterials from high alkali silicate herbaceous biomass. Sci. Rep. 2020, 10, 2563. [Google Scholar] [CrossRef] [Green Version]
  45. Rashidi, N.A.; Chai, Y.H.; Ismail, I.S.; Othman, M.F.H.; Yusup, S. Biomass as activated carbon precursor and potential in supercapacitor applications. Biomass Convers. Biorefinery 2022. [Google Scholar] [CrossRef]
  46. Jjagwe, J.; Olupot, P.W.; Menya, E.; Kalibbala, H.M. Synthesis and Application of Granular Activated Carbon from Biomass Waste Materials for Water Treatment: A Review. J. Bioresour. Bioprod. 2021, 6, 292–322. [Google Scholar] [CrossRef]
  47. Ahmedna, M.; Marshall, W.E.; Rao, R.M. Surface properties of granular activated carbons from agricultural by-products and their effects on raw sugar decolorization. Bioresour. Technol. 2000, 71, 103–112. [Google Scholar] [CrossRef]
  48. Mudoga, H.L.; Yucel, H.; Kincal, N.S. Decolorization of sugar syrups using commercial and sugar beet pulp based activated carbons. Bioresour. Technol. 2008, 99, 3528–3533. [Google Scholar] [CrossRef]
  49. Rashid, J.; Tehreem, F.; Rehman, A.; Kumar, R. Synthesis using natural functionalization of activated carbon from pumpkin peels for decolourization of aqueous methylene blue. Sci. Total Environ. 2019, 671, 369–376. [Google Scholar] [CrossRef] [PubMed]
  50. Shahbazi, D.; Mousavi, S.A.; Nayeri, D. Low-cost activated carbon: Characterization, decolorization, modeling, optimization and kinetics. Int. J. Environ. Sci. Technol. 2020, 17, 3935–3946. [Google Scholar] [CrossRef]
  51. Osman, A.I.; Blewitt, J.; Abu-Dahrieh, J.K.; Farrell, C.; Al-Muhtaseb, A.a.H.; Harrison, J.; Rooney, D.W. Production and characterisation of activated carbon and carbon nanotubes from potato peel waste and their application in heavy metal removal. Environ. Sci. Pollut. Res. 2019, 26, 37228–37241. [Google Scholar] [CrossRef] [Green Version]
  52. Hussain, O.A.; Hathout, A.S.; Abdel-Mobdy, Y.E.; Rashed, M.M.; Abdel Rahim, E.A.; Fouzy, A.S.M. Preparation and characterization of activated carbon from agricultural wastes and their ability to remove chlorpyrifos from water. Toxicol. Rep. 2023, 10, 146–154. [Google Scholar] [CrossRef] [PubMed]
  53. Soleimani, M.; Kaghazchi, T. Agricultural Waste Conversion to Activated Carbon by Chemical Activation with Phosphoric Acid. Chem. Eng. Technol. 2007, 30, 649–654. [Google Scholar] [CrossRef]
  54. Naji, S.Z.; Tye, C.T. A review of the synthesis of activated carbon for biodiesel production: Precursor, preparation, and modification. Energy Convers. Manag. X 2022, 13, 100152. [Google Scholar] [CrossRef]
  55. Sieradzka, M.; Kirczuk, C.; Kalemba-Rec, I.; Mlonka-Mędrala, A.; Magdziarz, A. Pyrolysis of Biomass Wastes into Carbon Materials. Energies 2022, 15, 1941. [Google Scholar] [CrossRef]
  56. Kosheleva, R.I.; Mitropoulos, A.C.; Kyzas, G.Z. Synthesis of activated carbon from food waste. Environ. Chem. Lett. 2019, 17, 429–438. [Google Scholar] [CrossRef]
  57. Gayathiri, M.; Pulingam, T.; Lee, K.T.; Sudesh, K. Activated carbon from biomass waste precursors: Factors affecting production and adsorption mechanism. Chemosphere 2022, 294, 133764. [Google Scholar] [CrossRef]
  58. Nechita, M.T.; Suditu, G.D.; Puițel, A.C.; Drăgoi, E.N. Differential evolution-based optimization of corn stalks black liquor decolorization using active carbon and TiO2/UV. Sci. Rep. 2021, 11, 18481. [Google Scholar] [CrossRef] [PubMed]
  59. Dashti, A.F.; Salman, N.A.S.; Adnan, R.; Zahed, M.A. Palm oil mill effluent treatment using combination of low cost chickpea coagulant and granular activated carbon: Optimization via response surface methodology. Groundw. Sustain. Dev. 2022, 16, 100709. [Google Scholar] [CrossRef]
  60. Rao, A.; Kumar, A.; Dhodapkar, R.; Pal, S. Adsorption of five emerging contaminants on activated carbon from aqueous medium: Kinetic characteristics and computational modeling for plausible mechanism. Environ. Sci. Pollut. Res. 2021, 28, 21347–21358. [Google Scholar] [CrossRef]
  61. Alam, G.; Ihsanullah, I.; Naushad, M.; Sillanpää, M. Applications of artificial intelligence in water treatment for optimization and automation of adsorption processes: Recent advances and prospects. Chem. Eng. J. 2022, 427, 130011. [Google Scholar] [CrossRef]
  62. Altowayti, W.A.H.; Shahir, S.; Othman, N.; Eisa, T.A.E.; Yafooz, W.M.S.; Al-Dhaqm, A.; Soon, C.Y.; Yahya, I.B.; Che Rahim, N.A.N.b.; Abaker, M.; et al. The Role of Conventional Methods and Artificial Intelligence in the Wastewater Treatment: A Comprehensive Review. Processes 2022, 10, 1832. [Google Scholar] [CrossRef]
  63. Lowe, M.; Qin, R.; Mao, X. A Review on Machine Learning, Artificial Intelligence, and Smart Technology in Water Treatment and Monitoring. Water 2022, 14, 1384. [Google Scholar] [CrossRef]
  64. Mpongwana, N.; Rathilal, S. A Review of the Techno-Economic Feasibility of Nanoparticle Application for Wastewater Treatment. Water 2022, 14, 1550. [Google Scholar] [CrossRef]
  65. Singh, N.K.; Kazmi, A.A.; Starkl, M. A review on full-scale decentralized wastewater treatment systems: Techno-economical approach. Water Sci. Technol. 2014, 71, 468–478. [Google Scholar] [CrossRef] [PubMed]
  66. Ozturk, E.; Cinperi, N.C. Water efficiency and wastewater reduction in an integrated woolen textile mill. J. Clean. Prod. 2018, 201, 686–696. [Google Scholar] [CrossRef]
  67. Secula, M.S.; Cagnon, B.; Cretescu, I.; Diaconu, M.; Petrescu, S. Removal of an acid dye from aqueous solutions by adsorption on a commercial granular activated carbon: Equilibrium, kinetic and thermodynamic study. Sci. Study Res. Chem. Chem. Eng. Biotechnol. Food Ind. 2011, 12, 307. [Google Scholar]
  68. Suditu, G.D.; Drăgoi, E.N.; Apostică, A.G.; Mănăilă, A.M.; Radu, V.M.; Puițel, A.C.; Nechita, M.T. Artificial Intelligence-Based Tools for Process Optimization: Case Study—Bromocresol Green Decolorization with Active Carbon. Adsorpt. Sci. Technol. 2022, 2022, 8110436. [Google Scholar] [CrossRef]
  69. Iorio, A.; Li, X. Solving rotated multi-objective optimization problems using differential evolution. In AI 2004: Advances in Artificial Intelligence; Springer: Berlin/Heidelberg, Germany, 2005. [Google Scholar]
  70. Collette, Y.; Siarry, P. Multiobjective Optimization: Principles and Case Studies; Springer Science & Business Media: Berlin/Heidelberg, Germany, 2004. [Google Scholar]
  71. Pavan, M.; Todeschini, R. Multicriteria decision-making methods. In Comprehensive Chemometrics [Recurso Electrónico]: Chemical and Biochemical Data Analysis; Springer: Berlin/Heidelberg, Germany, 2020; Volume 1, pp. 585–615. [Google Scholar]
  72. Li, H.; Zhang, Q. Multiobjective optimization problems with complicated Pareto sets, MOEA/D and NSGA-II. IEEE Trans. Evol. Comput. 2009, 13, 284–302. [Google Scholar] [CrossRef]
  73. Deb, K.; Pratap, A.; Agarwal, S.; Meyarivan, T. A fast and elitist multiobjective genetic algorithm: NSGA-II. IEEE Trans. Evol. Comput. 2002, 6, 182–197. [Google Scholar] [CrossRef] [Green Version]
  74. Deb, K.; Jain, H. An evolutionary many-objective optimization algorithm using reference-point-based nondominated sorting approach, part I: Solving problems with box constraints. IEEE Trans. Evol. Comput. 2013, 18, 577–601. [Google Scholar] [CrossRef]
  75. Nebro, A.J.; Durillo, J.J.; Machin, M.; Coello, C.A.C.; Dorronsoro, B. A Study of the Combination of Variation Operators in the NSGA-II Algorithm. In Advances in Artificial Intelligence; Bietza, C., Salmeron, A., Alonso-Betanzos, A., Hidalgo, J.I., Martinez, L., Troncoso, A., Corchado, E., Corchado, J., Eds.; Springer: Berlin/Heidelberg, Germany, 2013; Volume 8109, pp. 269–278. [Google Scholar]
  76. Zheng, F.; Zecchin, A.C.; Maier, H.R.; Simpson, A.R. Comparison of the searching behavior of NSGA-II, SAMODE, and borg MOEAs applied to water distribution system design problems. J. Water Resour. Plan. Manag. 2016, 142, 04016017. [Google Scholar] [CrossRef]
  77. Deb, K. Multi-Objective Optimisation Using Evolutionary Algorithms; Wiley: Chichester, UK, 2001. [Google Scholar]
  78. Rachmawati, L.; Srinivasan, D. Multiobjective Evolutionary Algorithm With Controllable Focus on the Knees of the Pareto Front. IEEE Trans. Evol. Comput. 2009, 13, 810–824. [Google Scholar] [CrossRef]
  79. Blank, J.; Deb, K. Pymoo: Multi-Objective Optimization in Python. IEEE Access 2020, 8, 89497–89509. [Google Scholar] [CrossRef]
  80. Heinze, G.; Wallisch, C.; Dunkler, D. Variable selection—A review and recommendations for the practicing statistician. Biom. J. 2018, 60, 431–449. [Google Scholar] [CrossRef] [Green Version]
  81. Shearer, L.; Pap, S.; Gibb, S.W. Removal of pharmaceuticals from wastewater: A review of adsorptive approaches, modelling and mechanisms for metformin and macrolides. J. Environ. Chem. Eng. 2022, 10, 108106. [Google Scholar] [CrossRef]
  82. Deb, K.; Sindhya, K.; Okabe, T. Self-adaptive simulated binary crossover for real-parameter optimization. In Proceedings of the 9th Annual Conference on Genetic and Evolutionary Computation, London, UK, 7–11 July 2007; pp. 1187–1194. [Google Scholar]
  83. Priddy, K.; Keller, P. Artificial Neural Networks:An Introduction; SPIE Press: Washington, DC, USA, 2005. [Google Scholar]
  84. Kumar, V.; Al-Gheethi, A.; Asharuddin, S.M.; Othman, N. Potential of cassava peels as a sustainable coagulant aid for institutional wastewater treatment: Characterisation, optimisation and techno-economic analysis. Chem. Eng. J. 2021, 420, 127642. [Google Scholar] [CrossRef]
  85. Yashni, G.; Al-Gheethi, A.; Radin Mohamed, R.M.S.; Dai-Viet, N.V.; Al-Kahtani, A.A.; Al-Sahari, M.; Nor Hazhar, N.J.; Noman, E.; Alkhadher, S. Bio-inspired ZnO NPs synthesized from Citrus sinensis peels extract for Congo red removal from textile wastewater via photocatalysis: Optimization, mechanisms, techno-economic analysis. Chemosphere 2021, 281, 130661. [Google Scholar] [CrossRef] [PubMed]
  86. Dadebo, D.; Nasr, M.; Fujii, M.; Ibrahim, M.G. Bio-coagulation using Cicer arietinum combined with pyrolyzed residual sludge-based adsorption for carwash wastewater treatment: A techno-economic and sustainable approach. J. Water Process Eng. 2022, 49, 103063. [Google Scholar] [CrossRef]
  87. Ano, J.; Henri Briton, B.G.; Kouassi, K.E.; Adouby, K. Nitrate removal by electrocoagulation process using experimental design methodology: A techno-economic optimization. J. Environ. Chem. Eng. 2020, 8, 104292. [Google Scholar] [CrossRef]
  88. Saad, M.S.; Kai, O.B.; Wirzal, M.D.H. Process modelling and techno economic analysis for optimal design of integrated electrocoagulation-membrane system for dye removal in wastewater. Chemosphere 2022, 306, 135623. [Google Scholar] [CrossRef]
Figure 1. Graphic description of the work performed in this manuscript.
Water 15 02911 g001
Figure 2. Surface (a) and contour plot (b) of decolorization yield vs. stirrer rotation speed and activated carbon concentration after 25 min of reaction time at 1:1000 black liquor dilution.
Water 15 02911 g002
Figure 3. Surface (a) and contour plot (b) of decolorization yield vs. black liquor dilution and activated carbon concentration after 25 min of reaction time at 350 r.p.m.
Water 15 02911 g003
Figure 4. Surface (a) and contour plot (b) of decolorization yield vs. reaction time and black liquor dilution at 350 r.p.m. and 10 g/L activated carbon concentration.
Water 15 02911 g004
Figure 5. Surface (a) and contour plot (b) of decolorization yield vs. stirrer rotation speed and black liquor dilution after 25 min. reaction time and 10 g/L activated carbon concentration.
Water 15 02911 g005
Figure 6. Surface (a) and contour plot (b) of decolorization yield vs. stirrer rotation speed and reaction time at 1:1000 black liquor dilution and 10 g/L activated carbon concentration.
Water 15 02911 g006
Figure 7. Surface (a) and contour plot (b) of decolorization yield vs. activated carbon concentration and reaction time at 1:1000 black liquor dilution and 350 r.p.m.
Water 15 02911 g007
Figure 8. Solutions obtained with NSGA-II and with NSGA-III without constraints.
Water 15 02911 g008
Figure 9. The equilibrium solutions for the two DM strategies for NSGA-II.
Water 15 02911 g009
Table 1. Designated variables and variation range.
Independent
Variables
NotationMeasure UnitsRange
CodedUncoded
FromToFromTo
Reaction timeX1min.−111040
Stirrer rotation speedX2r.p.m.−11200500
Black liquor dilutionX3ratio−111:5001:1500
Activated carbon concentrationX4g/L−11515
Table 2. Experimental planning and results.
NX1X2X3X4Y1, %Y2
1405001:15001583.420.99
2105001:15001576.050.97
3402001:15001582.230.98
4102001:15001571.420.96
5405001:5001568.080.99
6105001:5001553.400.97
7402001:5001564.410.98
8102001:5001550.140.96
9405001:1500555.200.35
10105001:1500546.390.37
11402001:1500553.030.38
12102001:1500539.180.32
13405001:500532.530.35
14105001:500522.530.37
15402001:500531.210.38
16102001:500515.430.32
1746.213501:10001062.290.66
183.793501:10001035.820.64
1925562.11:10001062.960.66
2025137.91:10001057.550.64
21253501:17071070.550.65
22253501:2931071.240.65
23253501:100017.0773.581.10
24253501:10002.9329.770.197
25253501:10001058.950.65
26253501:10001060.270.65
Table 3. Analysis of variance.
SourceDFSeq SSContributionAdj SSAdj MSF-Valuep-Value
Regression88125.5294.60%8125.521015.6937.240
X11884.510.30%605.21605.2122.190
X2172.930.85%72.9372.932.670.12
X311413.7616.46%25.6825.680.940.345
X414980.4357.99%690.33690.3325.310
X1 × X11380.334.43%370.26370.2613.580.002
X3 × X31141.911.65%167.2167.26.130.024
X4 × X41237.562.77%237.56237.568.710.009
X3 × X4114.10.16%14.114.10.520.482
Error17463.625.40%463.6227.27
Lack-of-Fit16462.745.39%462.7428.9233.050.136
Pure error10.880.01%0.880.88
Total258589.14100.00%
Table 4. Optimization of decolorization yield using Minitab software.
Sol No.X1X2X3X4Yield (Y1, %)Economic Cost (Y2, Euro)
132.49562.11:1694.9216.7895.540.1228
246.21137.91:1694.9217.0784.680.1162
312.22562.11:1694.9217.0783.410.1150
Table 5. The best solutions for economic optimization when no constraints are considered.
Reaction Time, Min.Stirrer Rotation Speed, r.p.m.Dilution, RatioActivated Carbon Concentration, g/LY1, %Y2, Euro
NSGA-IIPseudoweights25.85371.101:1705.2513.4889.930.0978
High Tradeoff32.35379.921:1703.9113.5191.360.1016
31.90392.121:1706.5613.8192.010.1041
30.33377.361:1704.8112.1389.220.0928
NSGA-IIIPseudoweights33.01366.881:1694.8511.2886.610.0867
High Tradeoff30.26378.621:1703.4410.1283.950.0788
Table 6. The best solutions for economic optimization when the concentration of the activated carbon is set to a maximum of 10 g/L.
Reaction Time, Min.Stirrer Rotation Speed, r.p.m.Dilution, RatioActivated Carbon Concentration, g/LY1, %Y2, Euro
NSGA-IIPseudoweights32.02375.411:1697.177.3874.420.0619
High Tradeoff25.41352.711:1703.386.5269.280.0522
30.09549.341:1699.729.483.790.0874
NSGA-IIIPseudoweights25.70360.581:1690.298.8978.140.0679
High Tradeoff31.76352.541:1705.428.7979.690.0694
Table 7. The best solutions for economical optimization when the stirrer rotation speed is set to a maximum of 350 rpm.
Reaction Time, Min.Stirrer Rotation Speed, r.p.m.Dilution, RatioActivated Carbon Concentration, g/LY1, %Y2, Euro
NSGA-IIPseudoweights25.84307.841:1706.451287.850.0897
High Tradeoff30.16276.611:1706.7816.6192.330.1151
NSGA-IIIPseudoweights High Tradeoff28.41305.621:1699.7510.9184.650.0794
Table 8. Comparison with other techno-economic studies on wastewater decolorization/remediation.
Wastewater SourceMethodProcess ParametersOptimization MethodologyMulti-ObjectiveScaleYear, Ref.
syntheticelectrocoagulationcurrent intensity,
electrode type,
electrolyte type,
pH, and time
Plackett-Burman design and Box-Behnken designyescost per m32020, [87]
institutionalflocculation/
coagulation
pH, coagulant dosage, and settling timeRSMnoannual operation cost2021, [84]
textilephotocatalysisZnO nanoparticle loading, pH, and
Congo Red concentration
RSMnoannual
operation cost
2021, [85]
textileelectrocoagulationVoltage and timeStandard Least Squares Modelno15-yeartime frame2022, [88]
electrocoagulation + membrane
carwashbio-coagulationpH and coagulant dosageRSM and Feed-forward ANNno30 m3 of wastewater/day2022, [86]
adsorptionbed heights, flow ratesno
black liquoradsorptionContact time, dilution, active carbon concentration, and stirring intensityRSM,
NSGA—II, and
NSGA—III
yescost per each experimentthis work
Disclaimer/Publisher’s Note: The statements, opinions and data contained in all publications are solely those of the individual author(s) and contributor(s) and not of MDPI and/or the editor(s). MDPI and/or the editor(s) disclaim responsibility for any injury to people or property resulting from any ideas, methods, instructions or products referred to in the content.

