Abstract
The construction of large-scale water diversion projects has effectively alleviated the current situation of the uneven distribution of water resources in China. However, due to the siltation of very fine sediment and organic matter on the side wall of an open channel, and the slow velocity of the side wall flow field, it is easy for epipelic algae to be produced, which affects water quality. Because prototype observation cannot be used to predict the series of flow in real time, and the calculation of the mathematical model is affected by parameter limitations, these two methods often cannot truly reflect the hydrodynamic characteristics of an open channel with epipelic algae. Therefore, by referring to the design parameters of the water diversion project channel, this study took the epipelic algae growing on the side wall of an open channel as the research object and used the scale of 1:30 to carry out a generalized flume experiment. Through the analysis of the physical characteristics of the prototype sample, and the simulation of the cohesive force between the oblique side wall and the epipelic algae, multi-group and multi-series hydrodynamic tests were carried out. The velocity distribution law and flow field distribution law were analyzed. The research results show that the presence of epipelic algae has a certain hindering effect on the flow velocity and significantly reduces the range of the peak velocity of the channel along the water depth. The position of the maximum velocity on the vertical line of the channel flow appears at the relative water depth of 0.6. In the case of small flow, the epipelic algae group only reduces the average flow rate of the channel by 5~6%; in the case of large flow, the effect of epipelic algae on the channel flow rate is minimal. This paper includes important scientific guiding significance and practical value for the regulation of water quantity and water quality safety, as well as the protection of long-distance projects.
1. Introduction
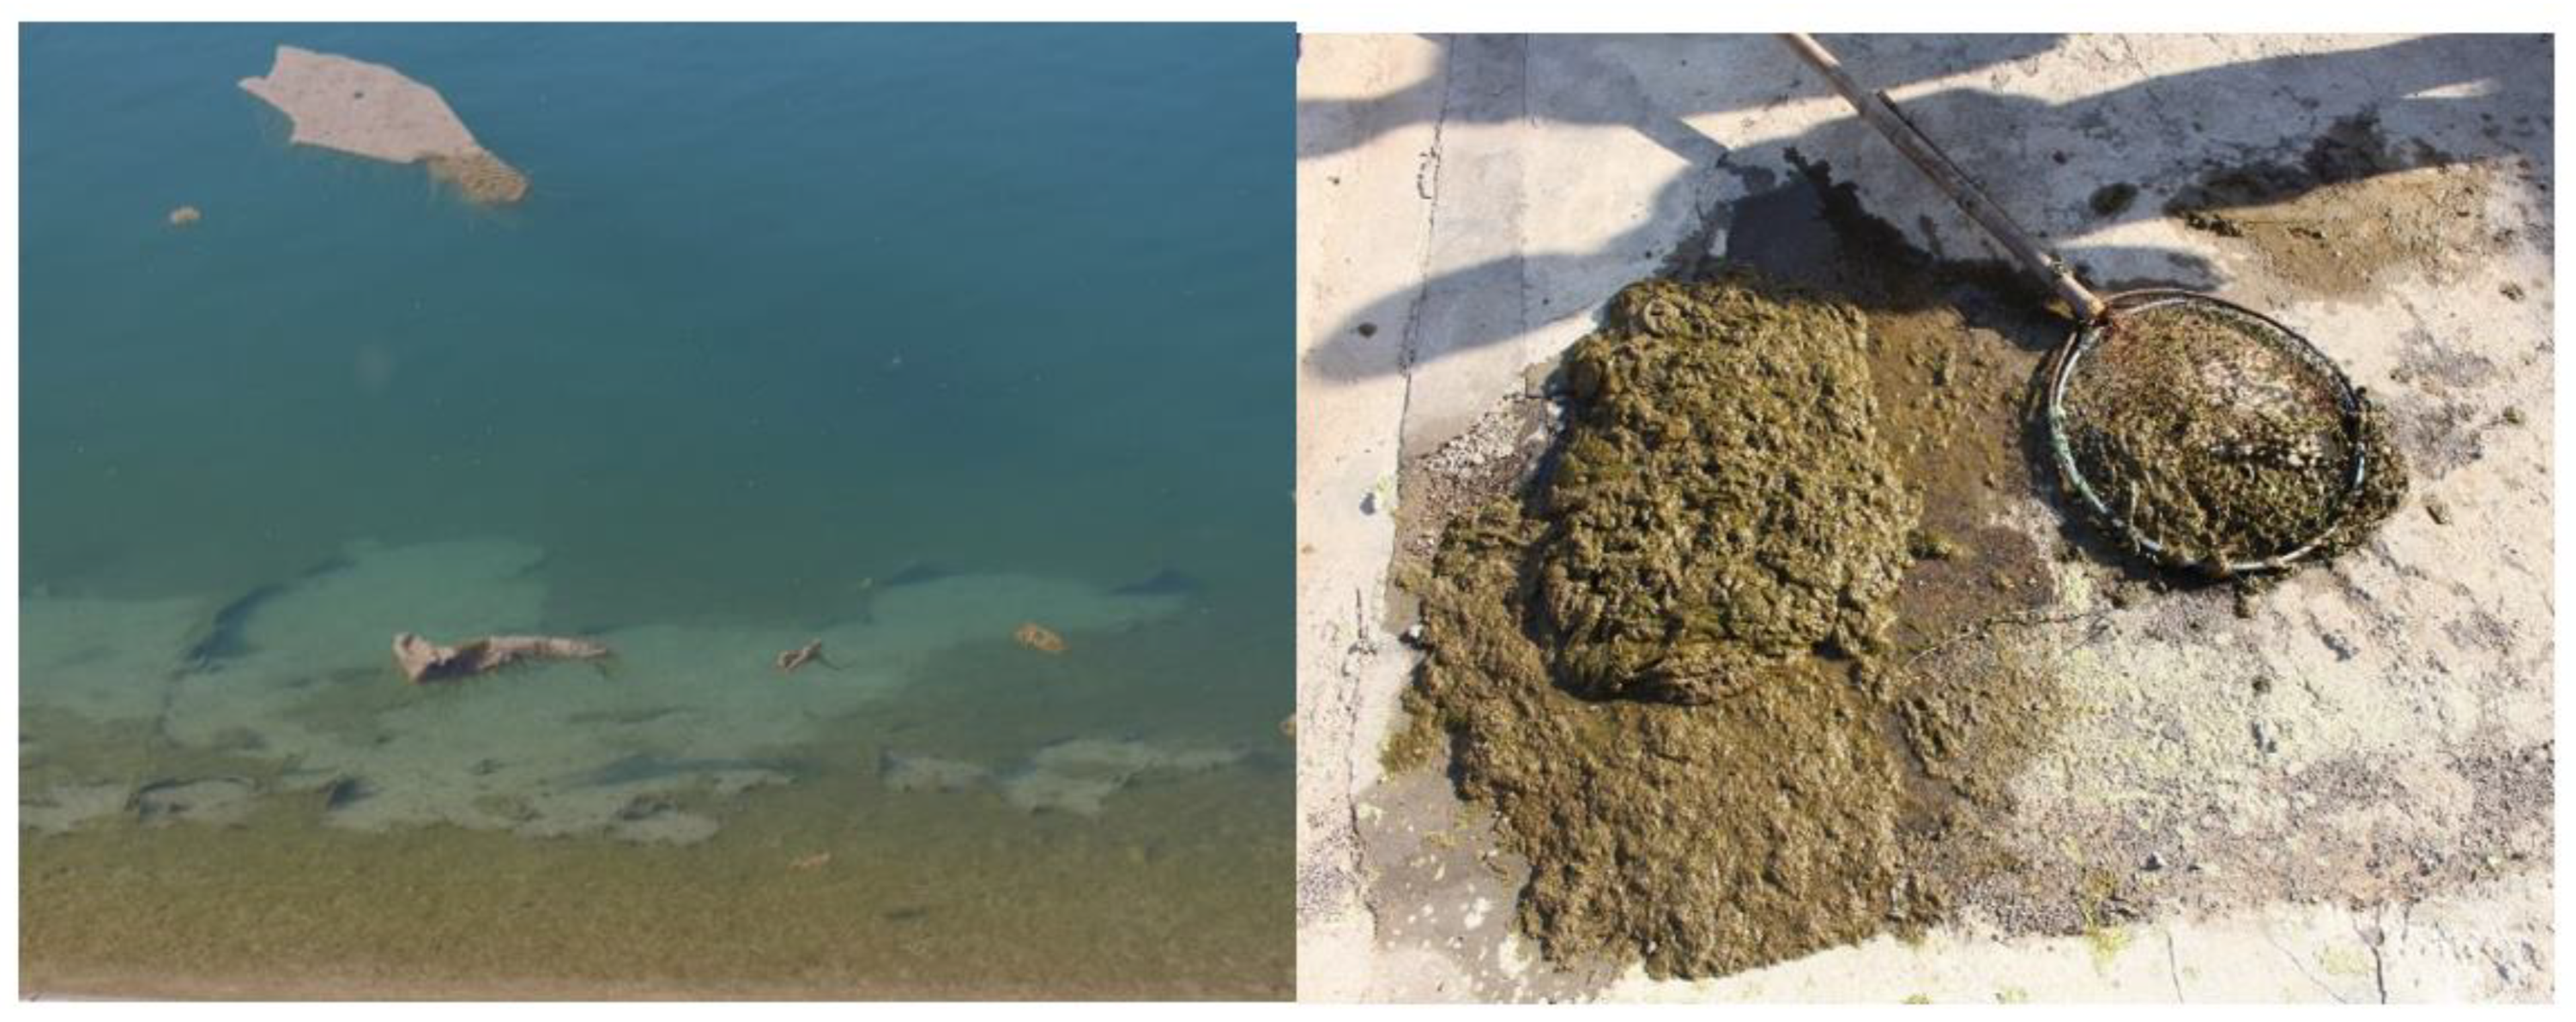
Through the investigation of the oblique side wall of the artificial open channel, it has been found that, due to the slow flow velocity, the precipitation of river organic matter and very fine sediment, and the nourishment of sunlight, the side wall of an open channel often produces epipelic algae that affect the water quality and landscape environment (Figure 1). In recent years, the water transfer project has attracted much attention. Through the connection between the three water transfer lines of the east, middle, and west lines and the four major rivers of the Yangtze River, Yellow River, Huaihe River, and Haihe River, the overall layout with ‘four horizontal and three vertical’ as the main body is formed, which is conducive to the realization of the rational allocation of water resources in China from north to south and from east to west. However, the problem of water quality safety in the development of water diversion projects is particularly important. Large-scale water diversion projects have many potential safety hazards of water pollution accidents due to long channels and multiple canal sections intersecting with many rivers and transportation buildings. A small amount of fine-grained sediment due to wind carrying on the side wall of the artificial channel provides nutrients for the growth of algal clusters. When natural conditions such as light are suitable in some channels with low flow rates, it is extremely easy for the frenzied proliferation of algal clusters to break out.
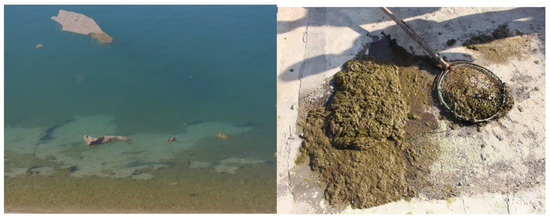
Figure 1.
Epipelic algae attached to the oblique side wall of open channel.
Experts and scholars have achieved rich results in the study of planktonic algae in rivers, lakes, and reservoirs. However, research on the hydrodynamic mechanism of the erosion and shedding of algae mass is quite rare. At present, research on the growth of algae mass mainly focuses on two aspects: hydrodynamic factors and environmental factors such as nutrients, light, and temperature. The growth and reproduction of algal clusters and the occurrence of algal blooms are the result of the combined effects of the water environment and hydrodynamic forces [1,2]. Their effects on the growth of different algal clusters are qualitatively consistent, but there are certain differences among algal clusters in quantification. The results of Desortová B [3] showed that the slow flow rate was the main reason for the frequent blooms. Nie Kaixia [4] proposed that the water flow velocity of 0.45 m/s was most conducive to the growth of Microcystis. Li Bo [5] showed that the flow velocity of 1 m/s had a significant inhibitory effect on the growth of algal cells in the South-to-North Water Diversion Project. Zhang Haihan [6] proposed that hydrodynamic conditions affected the growth of algae. Zhou Jing [7] proposed that different continuous flow conditions were an important reason for the changes in the number of planktonic algae and physiological indicators. Chen Yongcan [8] believed that water erosion and the corresponding changes in light intensity have an important impact on the growth of algae in rivers. Huisman J [9] believed that water flow affects the growth of algal clusters by using the mixing and material transport of water bodies such as dissipative vortices, and the scale of turbulent dissipative vortices is an important parameter affecting the growth of algal clusters. The growth characteristics of periphyton have a great relationship with its substrate. Pei Guofeng et al. [10] compared the growth of periphyton on different artificial substrates and found that polyethylene plastic plate was the most suitable for the growth of benthic periphyton compared with granite, glass, and wood plate. There was no significant difference in the species and biodiversity index of periphyton on granite and natural matrix pebble. Yi Kelang and Dai Zhigang [11] found that the community establishment of the algal mass was not related to the roughness of the substrate but rather determined by the living habits and structure of the algal mass. Liu Haiping et al. [12] believed that the surface roughness of the substrate can affect the growth of the algal mass, and the species richness of the algal mass growing on the rough surface is larger than that of the smooth-surface substrate. The epipelic algae attached to the oblique side wall of the open channel directly determines its difference from the cohesive fine sediment incipience at the bottom of the river or channel.
The influence of algae clusters on the water environment of the channel wall is more prominent only when they are washed off into the water flow, especially when the algae clusters washed off along the way are gathered somewhere downstream, which will cause great harm to the water quality of the local channel section. Unfortunately, there are few reports on the research of the problem of the erosion and shedding of the algae group, especially because the algae group and the attached mud are interwoven and mixed together on the concrete, which makes the problem more complicated and brings great difficulties to the management and dispatching of water. Due to the inability to analyze the hydrodynamic changes in the epipelic algae on the side wall of the open channel in real time according to the changes in the flow conditions in the prototype observation, and the inability to simulate and observe the erosion and shedding process in the whole cycle, the rationality of the model design will directly determine the authenticity of the simulation and the reliability of the test results.
By referring to the design parameters of the water diversion project channel, this study took the epipelic algae growing on the side wall of the open channel as the research object and used the scale of 1:30 to carry out a generalized flume experiment. Considering the physical characteristics of the epipelic algae analyzed using prototype sampling, artificial cultivation and the simulation of the adhesion force of the side wall were adopted. Through the analysis of the physical characteristics of the prototype sample, and the simulation of the cohesive force between the oblique side wall and the epipelic algae, multi-group and multi-series hydrodynamic tests were carried out. Through the study of the channel flow field with and without epipelic algae, the hydrodynamic law was analyzed.
This study provides basic theoretical support for the later in-depth study of its erosion and shedding. The research results of the hydrodynamic law of the oblique side wall will further improve the relevant research results of the vegetation flow. It also has important scientific guiding significance and practical value for the regulation of water quantity and water quality safety, as well as the protection of long-distance water diversion projects.
2. Materials and Methods
2.1. Archetypal Analysis
2.1.1. Characteristics of Mud Attached to Oblique Side Wall
The very fine sediment deposited on the oblique side wall of the open channel gradually flocculated and settled, and the organic matter was wrapped in the flocculation grid, forming the first element of the production of the epipelic algae. Therefore, the selection of the side wall sediment will directly determine the success or failure of the test. At present, many scholars have achieved relatively mature results in the study of the critical particle size of sediment flocculation in quiet water and moving water [13,14,15]: the critical particle size of flocculation is slightly different for different sources of sediment, but they all belong to fine-grained sediment, the particle size range belongs to silt or clay, and the critical particle size of flocculation is between 0.02 mm and 0.03 mm.
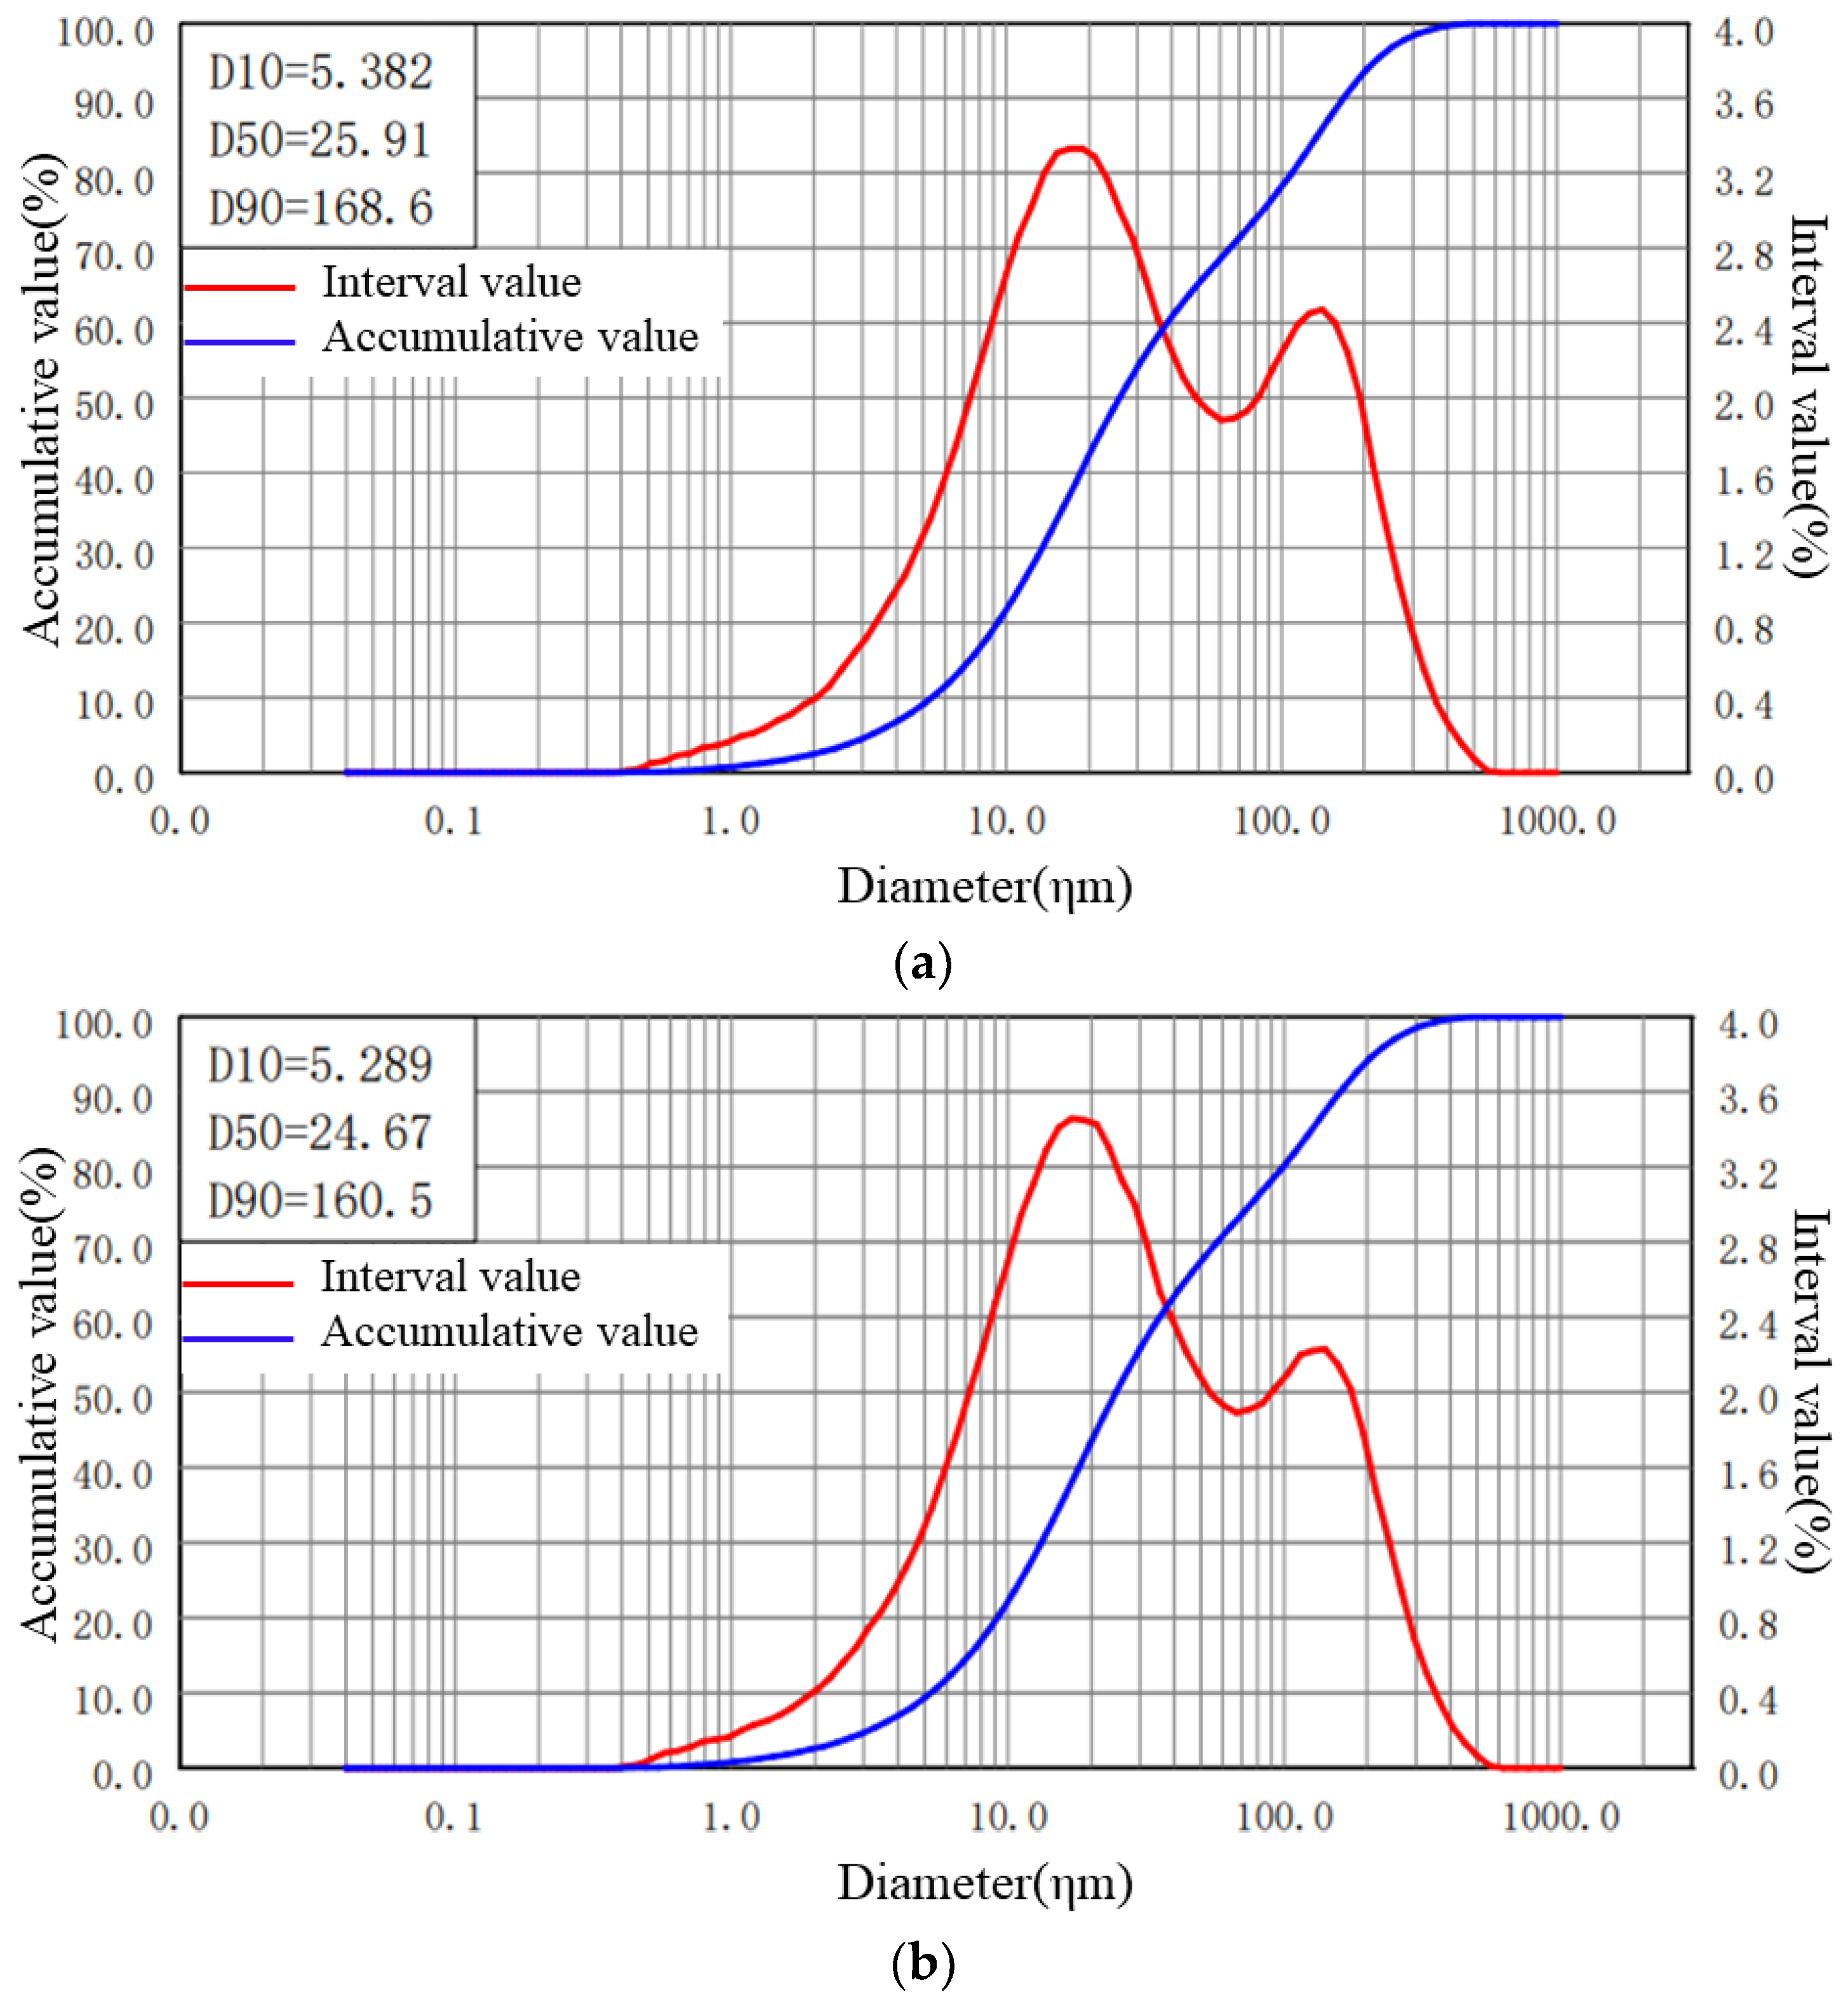
According to the particle size analysis of the sediment sample on the oblique wall of the prototype channel, the median particle size (D50) is 0.025 mm, which belongs to the range of sediment flocculation (Figure 2). In addition, the flow velocity of the oblique wall is in the low-velocity zone. Therefore, this study mainly considers the reference to the existing hydrodynamic flocculation results, that is, the flow of the oblique side wall of the channel having an enhanced effect on its sediment flocculation.
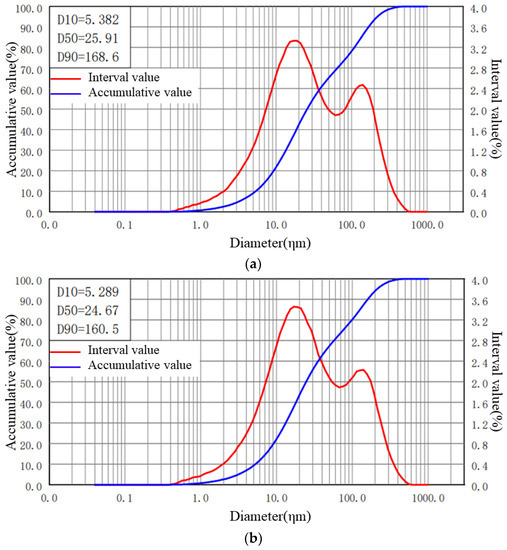
Figure 2.
Sediment gradation curve of oblique side wall of prototype channel: (a) sediment sample 1; and (b) sediment sample 2.
2.1.2. Composition of Epipelic Algae
In order to simulate the scouring process of the epipelic algae group on the side wall more realistically, to improve the reliability of the simulation test data, and to consider the characteristics of epipelic algae attached to the side wall, the samples of epipelic algae attached to the side wall in the open channel of the moat in the city were used as the standard. In order to avoid the contingency and particularity of the collected samples, each of the two sets of samples was taken at the same side wall position at an interval of 1 km within 5 km of the channel, and a total of 10 good-quality samples were selected at the sampling site. The composition of sediment content, sediment particle size, and mass ratio were analyzed as the control conditions for shaping the epipelic algae.
Considering the need to obtain sediment content and the accuracy and reliability of the proportion of mud and algae, it was necessary to separate algae and mud. In order to achieve the separation of the algae and mud, two different methods of water washing and static separation were used to calculate the proportion of the components of the epipelic algae.
(1) The method of water washing: In order to avoid errors and meet the accuracy requirements as the primary condition, the epipelic algae mass is naturally dried in a windless environment and its total mass is weighed. Then, under the continuous flushing and sieving operation of the water flow, the sediment is removed, the algae part is retained, and the algae is weighed again after drying. The mass collected for the second time is the net weight of the algae. The proportion of algae in the epipelic algae mass is obtained by using the mass collected for the second time rather than the total mass of the first time.
(2) The method of static separation: Similarly, this method also requires the weighing of the epipelic algae mass after natural drying in a windless environment, and then it is put it into a transparent test beaker with its known net weight. The amount of water in the beaker can completely submerge the epipelic algae mass and is a certain distance from the bottom of the beaker. After the epipelic algae mass is completely immersed in the beaker and fully absorbs the water, it is clamped with tweezers. The attached mud algae mass is washed back and forth, and the cup body is continuously shaken; then, the beaker is replaced with a new one to continue washing. The above operation is repeated several times until the state of the separation of algae and mud is stable, then the algae floating above is taken out. Finally, all beakers are dried in the sun and weighed again. The net weight of the sediment in the epipelic algae mass can be obtained by subtracting the weight of the beaker from the final measured total mass.
Through calculation, it is found that the sediment proportion of the 10 samples obtained by the two calculation methods of the proportion of epipelic algae is 50.6%, 51.0%, 49.8%, 49.9%, and 50.7% and 50.4%, 50.8%, 49.9%, 50.6%, and 50.8%, respectively, that is, the average sediment proportion obtained by the method of water washing is 50.4%, and the average sediment proportion obtained by the method of static separation is 50.5%. In order to reflect the normalization of the test data, the average value of the above two methods is 50.45% as the standard proportion of the sediment of the epipelic algae group in this study, that is, the sediment proportion of the epipelic algae group is 50.45%, and the algae proportion is 100%–50.45%. This provides important data support for the subsequent selection of epipelic algae required for the experiment.
2.2. Experimental Design
2.2.1. Flume Design
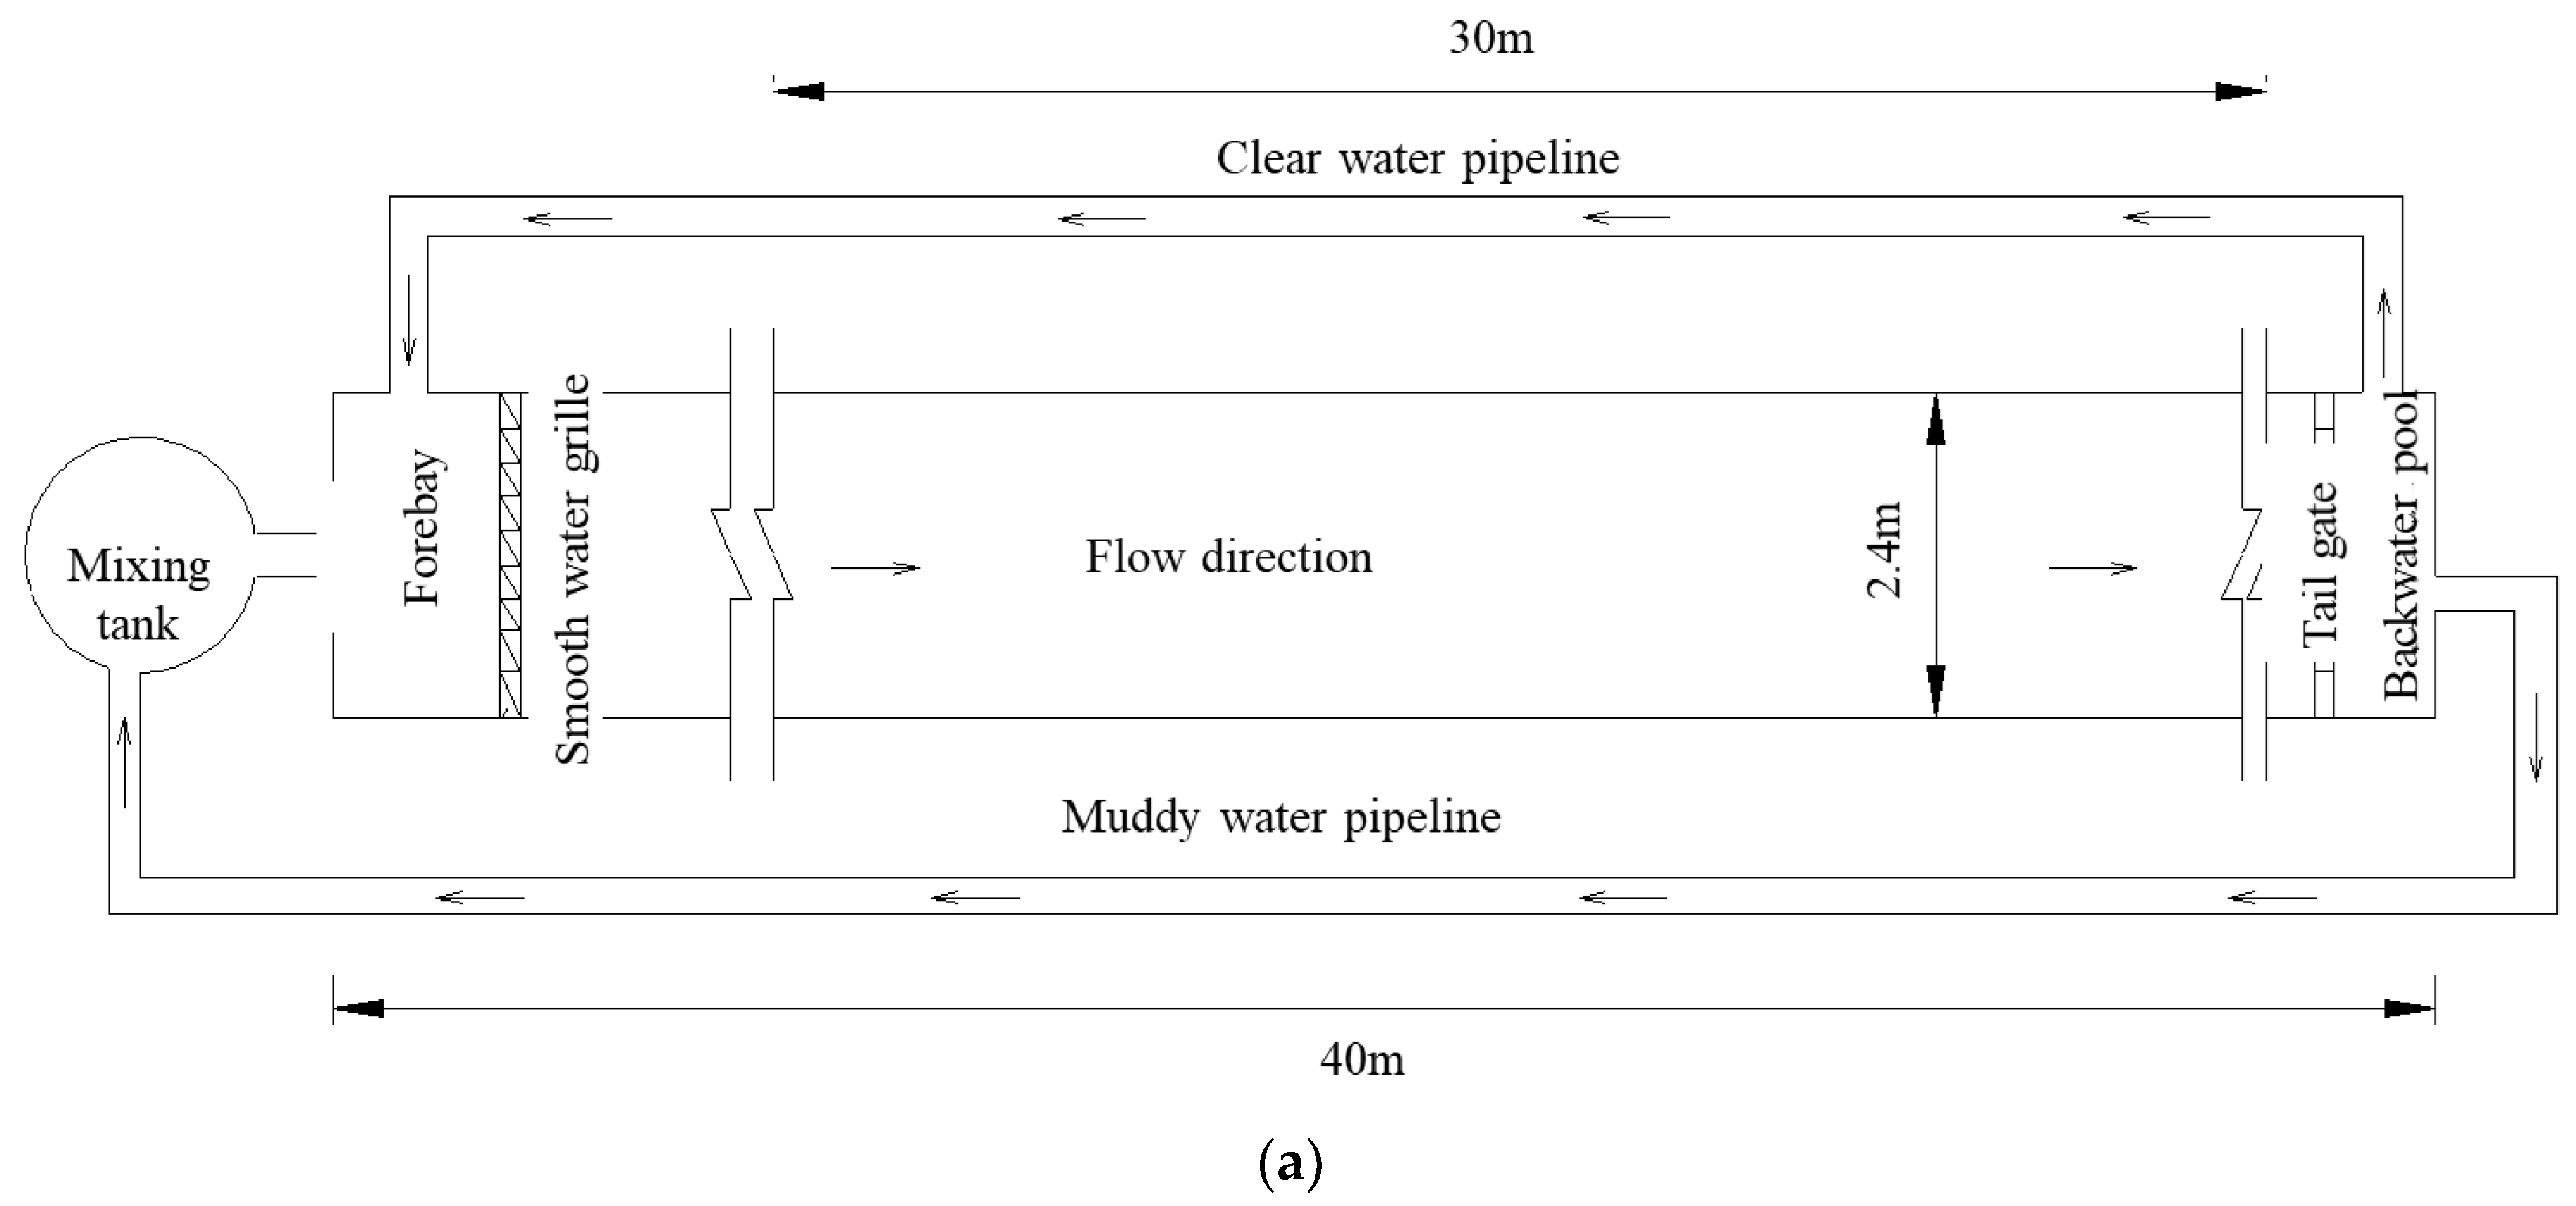
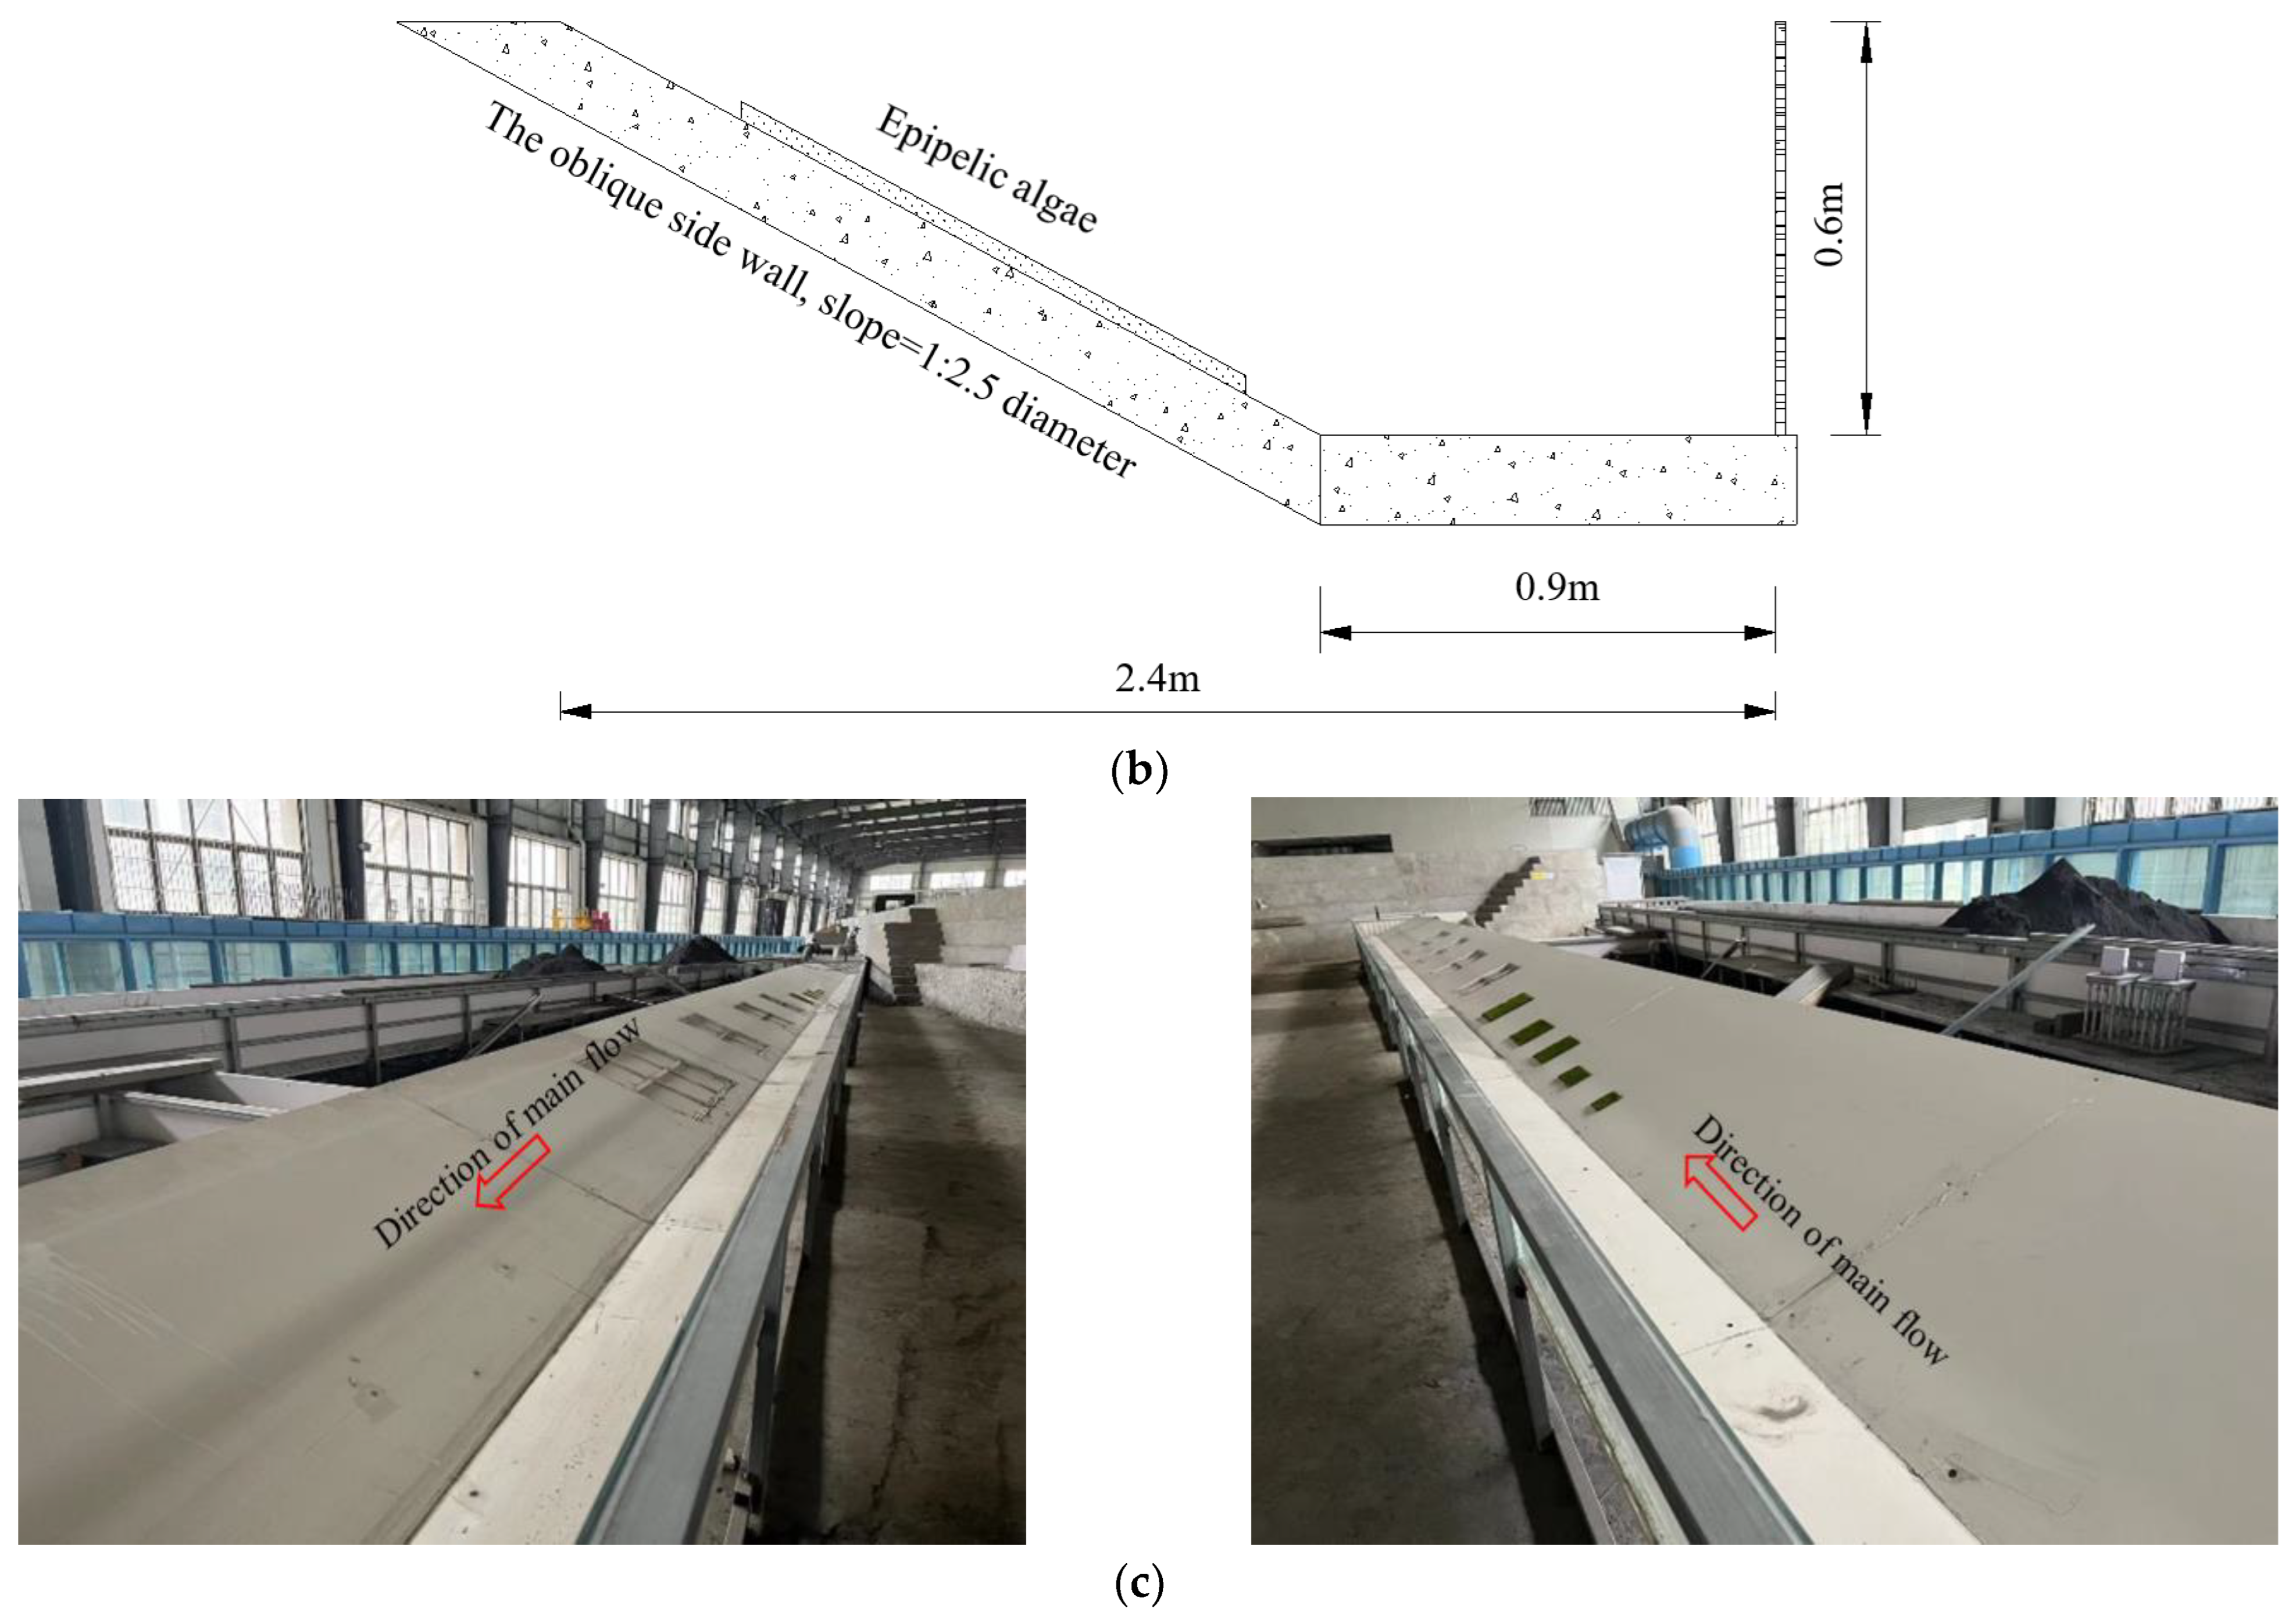
In order to carry out more targeted research and enhance the engineering value of the research results, the channel of the Henan section of the middle route of the South-to-North Water Diversion Project was referred to. The longitudinal slope is 1:26,000, the slope of the oblique side wall is 1:2.5, and the maximum flow discharge is 420 m3/s. The generalized model flume was designed according to the scale of 1:30. A glass flume with a length of 30 m and a top width of 2.4 m was built indoors (Figure 3). One side of the wall was a concrete slope, and the other side was vertical glass. The implantation of epipelic algae was used to study the hydrodynamic characteristics of the open channel flow of epipelic algae.
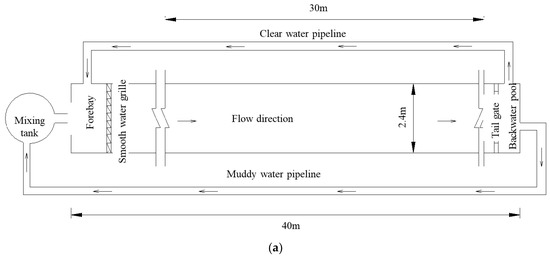
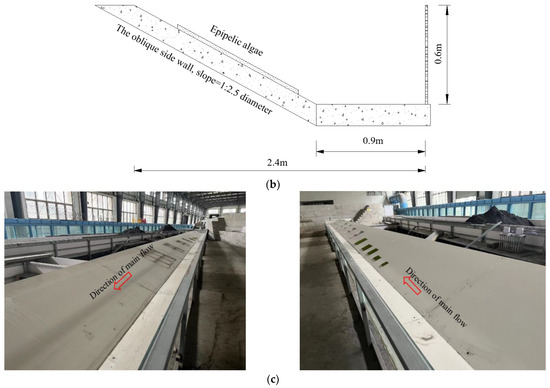
Figure 3.
Schematic diagram of generalized model test: (a) plan view of model circulation system; (b) cross section of generalized model test; and (c) photograph of flume.
2.2.2. Simulation Design of Epipelic Algae
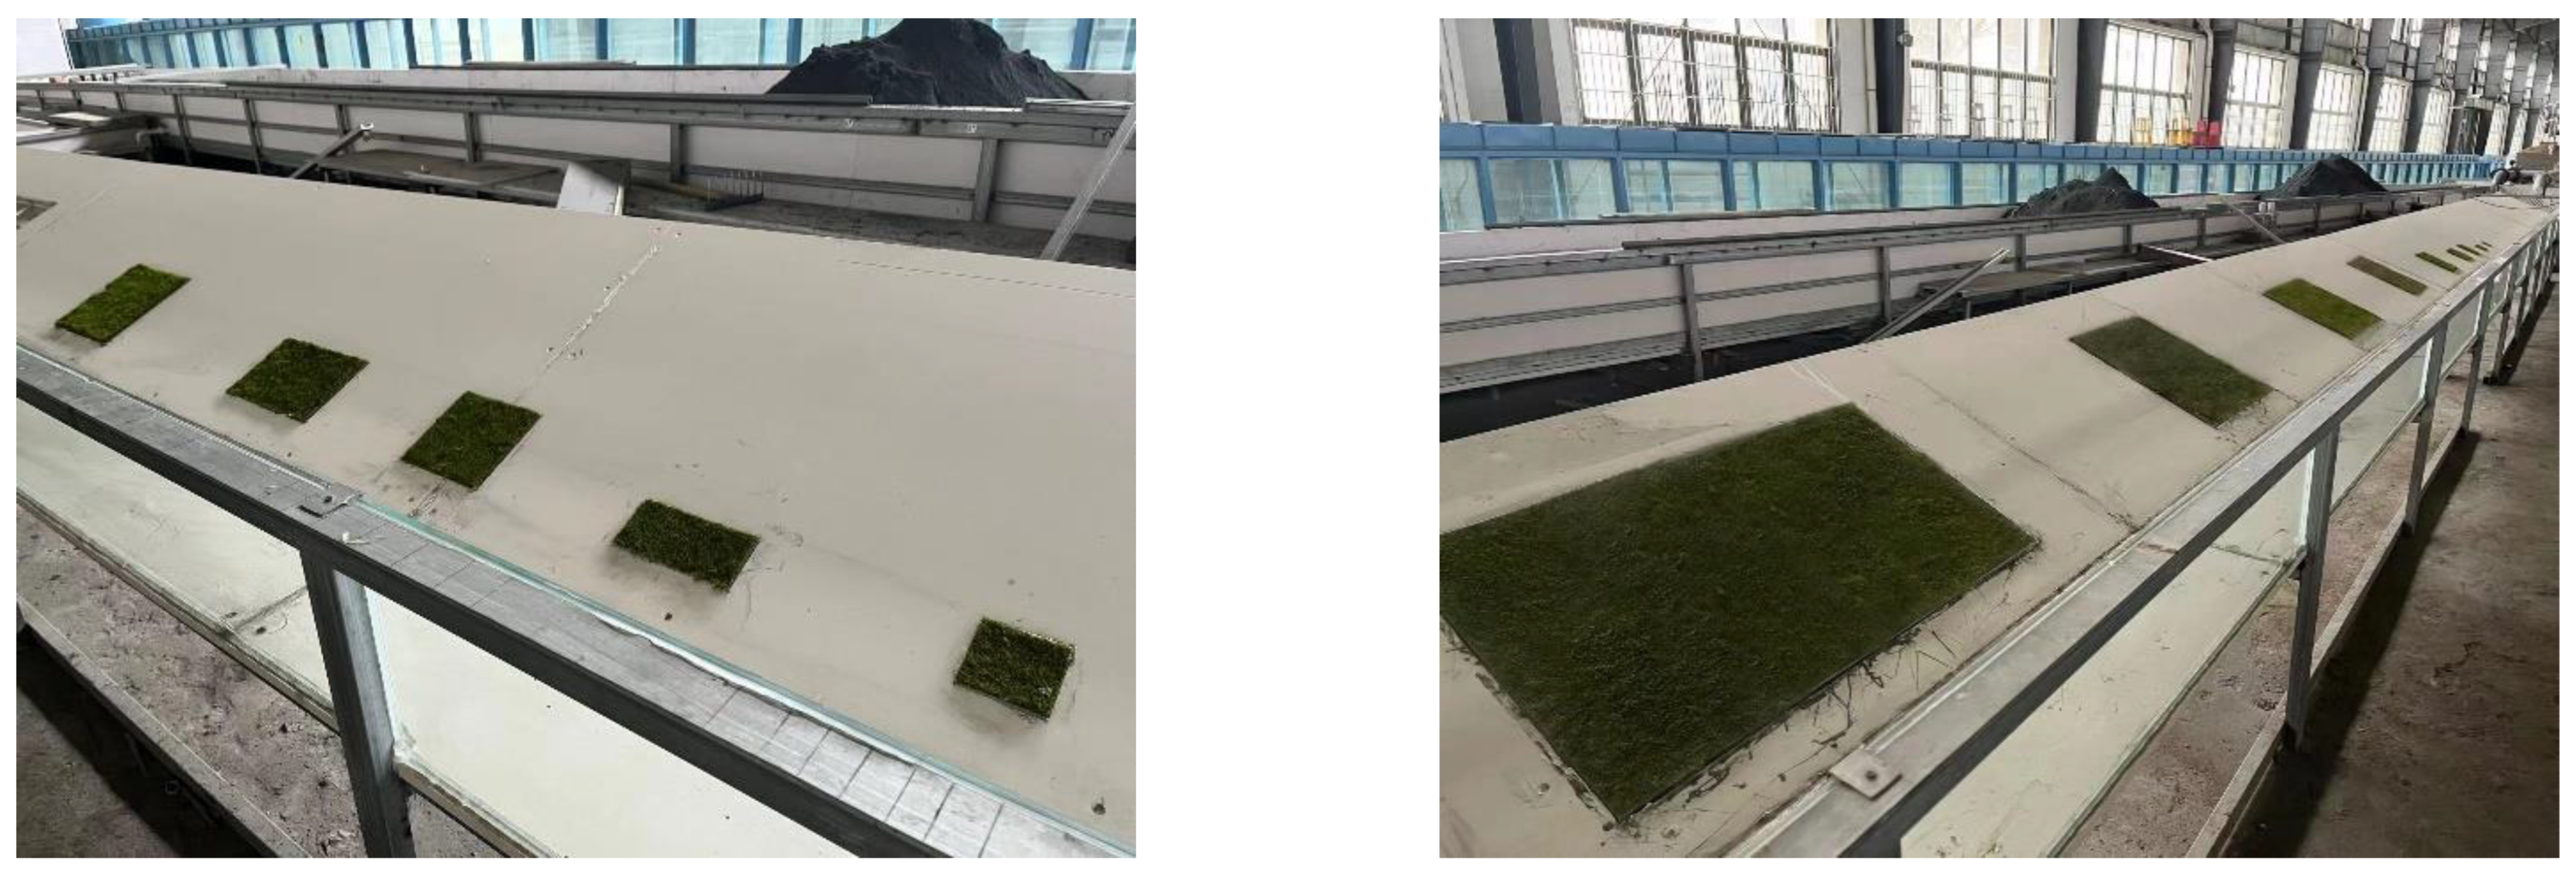
In order to study the effect of different flow rates on the erosion of side-wall epipelic algae, combined with the actual size of the epipelic algae in the prototype observation, nine detachable algae boxes of different sizes were designed at each interval of the side-wall slope position to place the epipelic algae clusters to distinguish the epipelic algae clusters of different sheet sizes (Figure 4). The flow rate is based on the ability to submerge the attached mud algae of different sheet sizes.
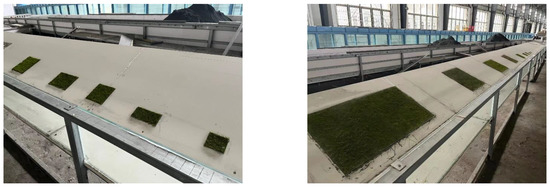
Figure 4.
Distribution of epipelic algae clusters of different sheet sizes on the side wall.
If the prototype sediment of extremely fine viscous particles with a median particle size of 0.025 mm is used to shape the mud attached to the side wall, although the mud–algae–mud can be alternately shaped to a predetermined thickness, it is still impossible to achieve the corresponding ratio of mud and algae in the prototype sample analysis results after multiple sets of test comparisons. Therefore, in this experiment, the cultivated algae were selected, and the flour with a particle size of 0.025 mm was mixed with the prototype sand at the bottom to bond to the oblique wall to meet the similar proportion of mud and algae and adhesion in the prototype.
2.2.3. Measuring Instrument and Measuring Design
Instruments such as a velocity meter and electromagnetic flowmeter were used in the test.
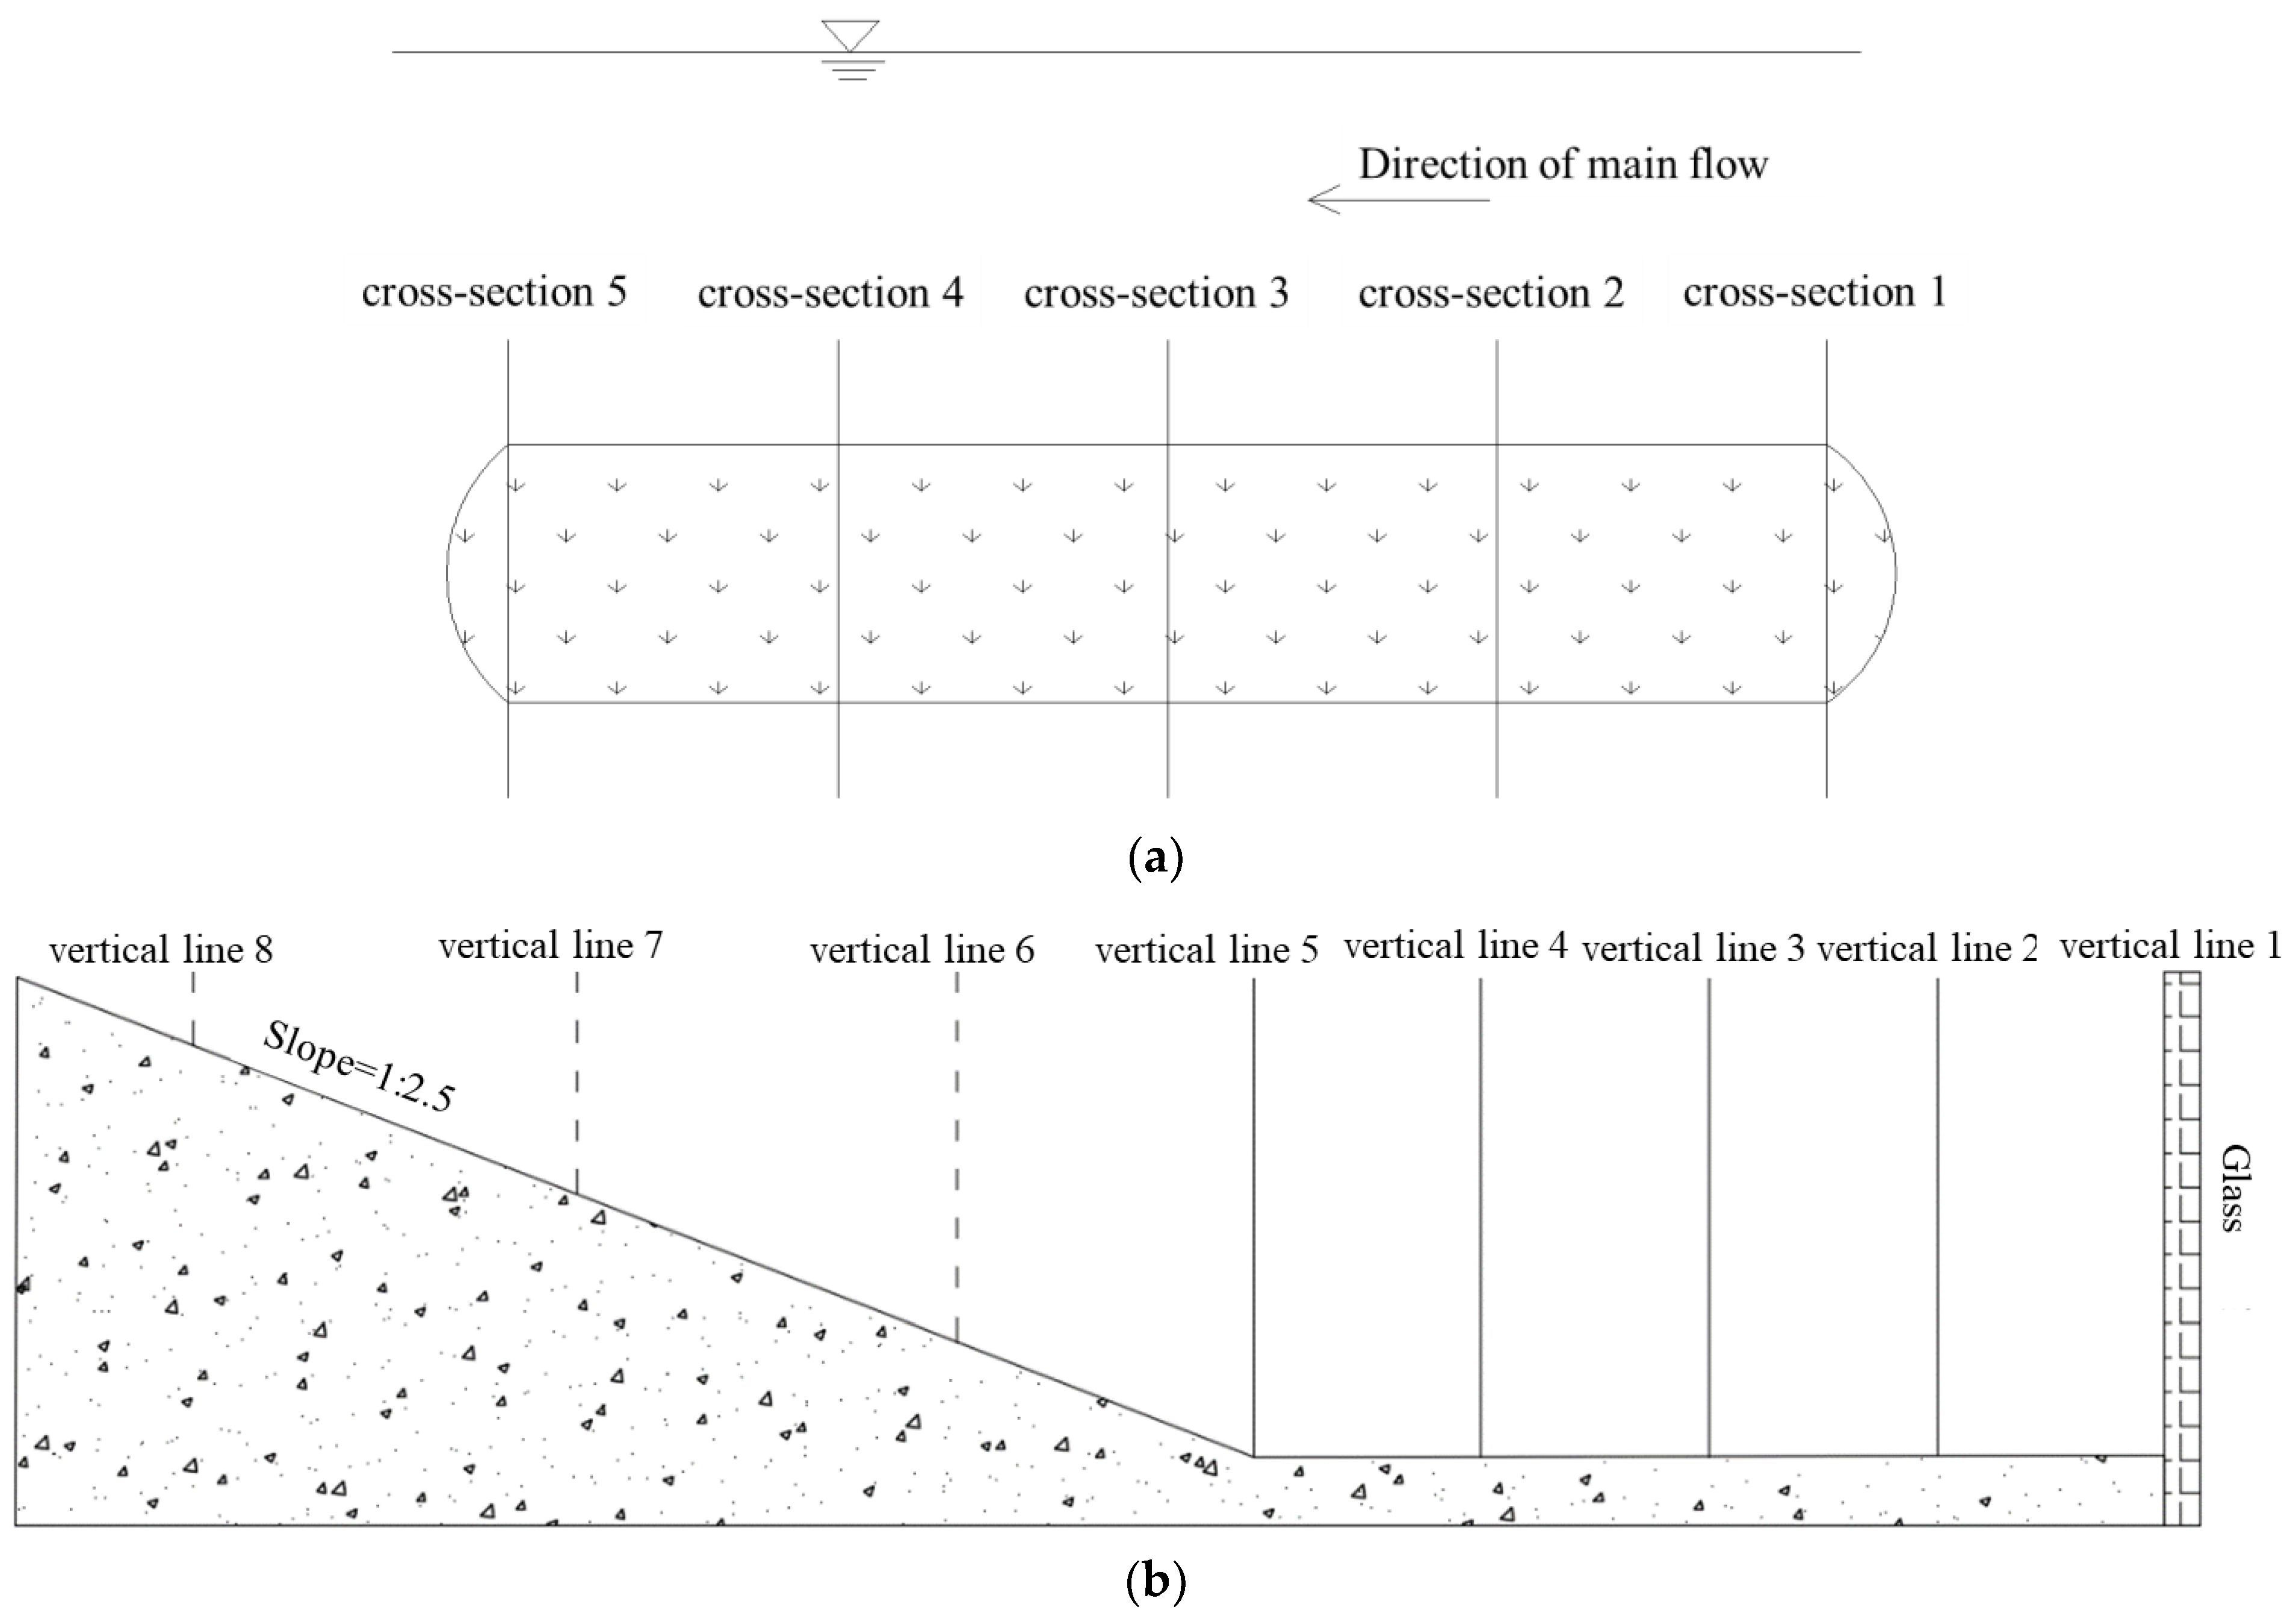
Five sections were arranged on the side wall (Figure 5a), and different vertical lines were arranged on each section (Figure 5b) to form a flow velocity grid. Not only was the flow velocity measured around the side wall of the epipelic algae group, but also, the flow velocity measurement points were arranged in a dense grid form throughout the channel so as to capture the most realistic flow field law of the side wall of the epipelic algae group. After the flow level was stable, the instruments were used to measure the velocity field distribution, water depth, and water surface width around the epipelic algae group.
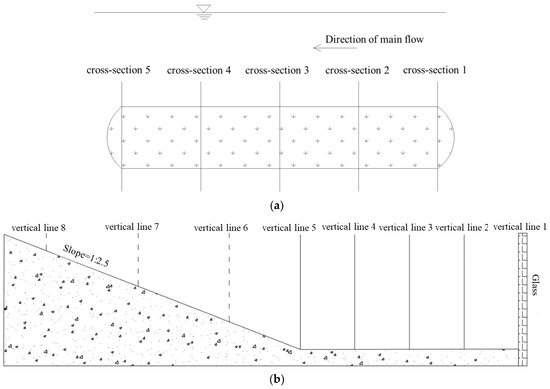
Figure 5.
Layout of measurements: (a) layout of measured section on the side wall around the epipelic algae group; and (b) layout of vertical lines of cross section.
2.2.4. Test Conditions
According to different sizes of the epipelic algae group and different flow rates, nine working conditions were designed in this study (Table 1). According to the gravity similarity, the resistance similarity criterion, and the continuity of water flow, the Froude number similarity condition was used to calculate the scale of flow velocity, discharge, and time. According to the scale of 1:30, the prototype data of each model condition are given.

Table 1.
Test conditions.
3. Results
3.1. Vertical Distribution of Flow Velocity
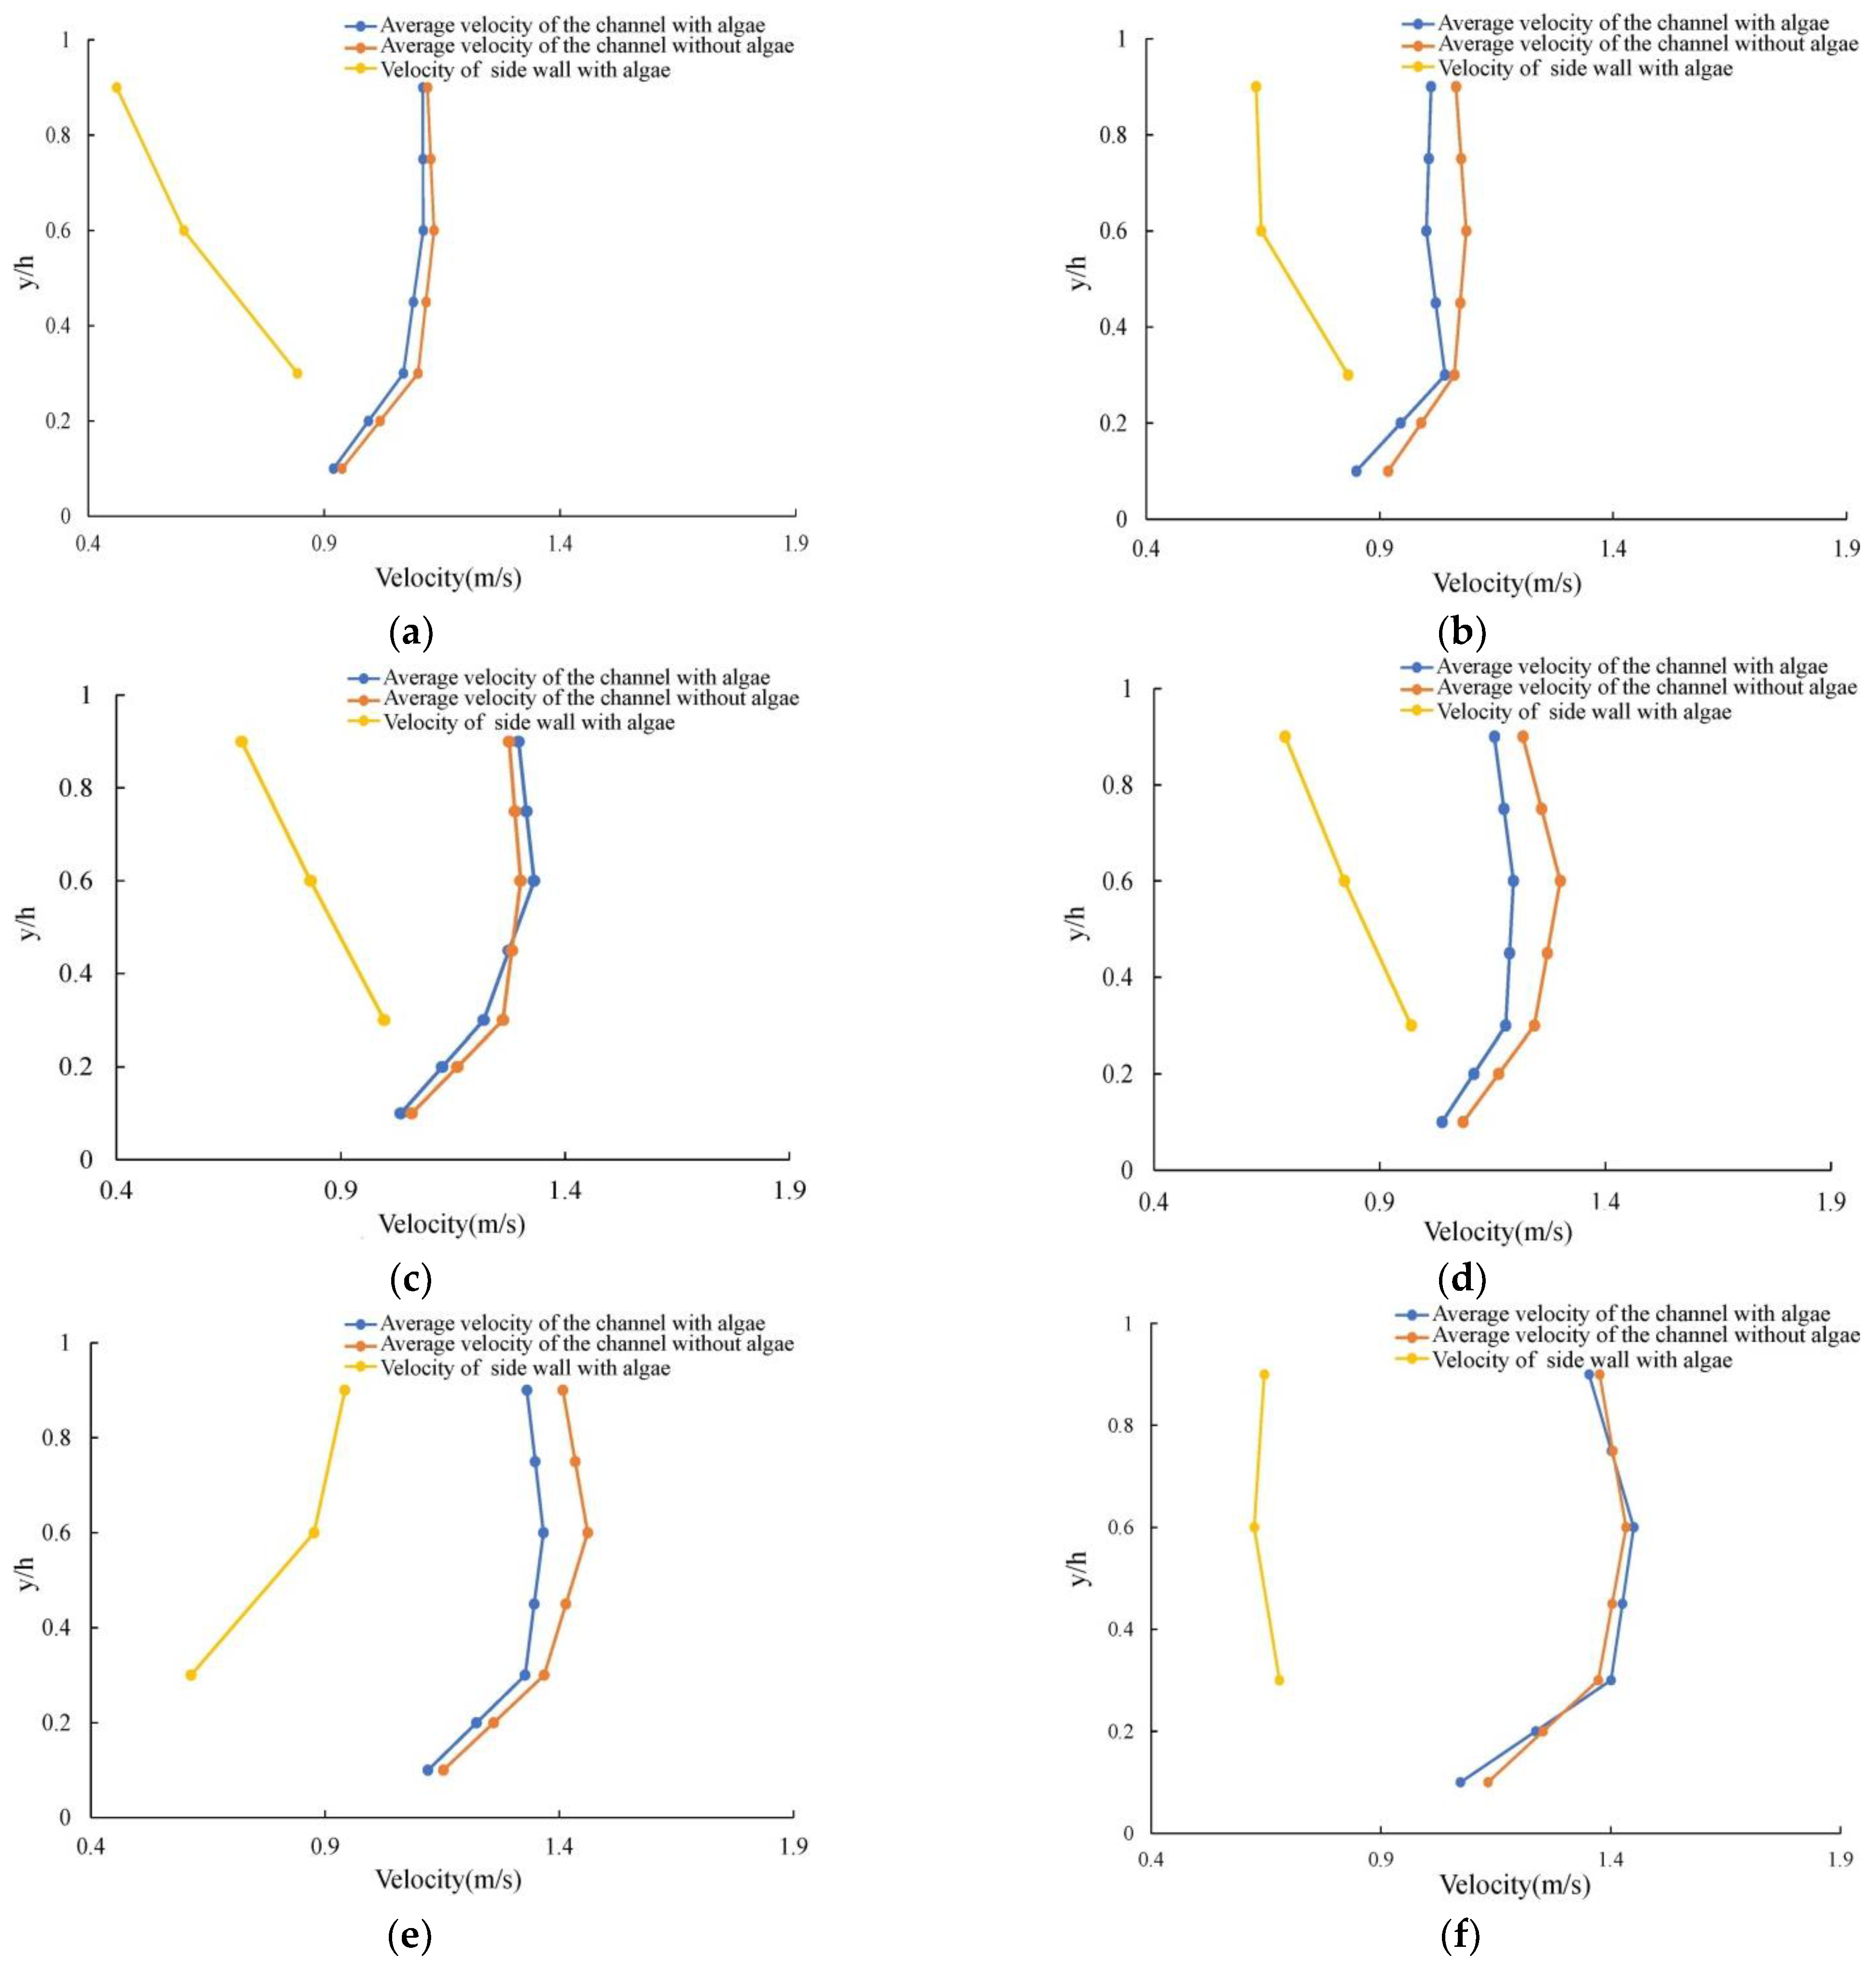
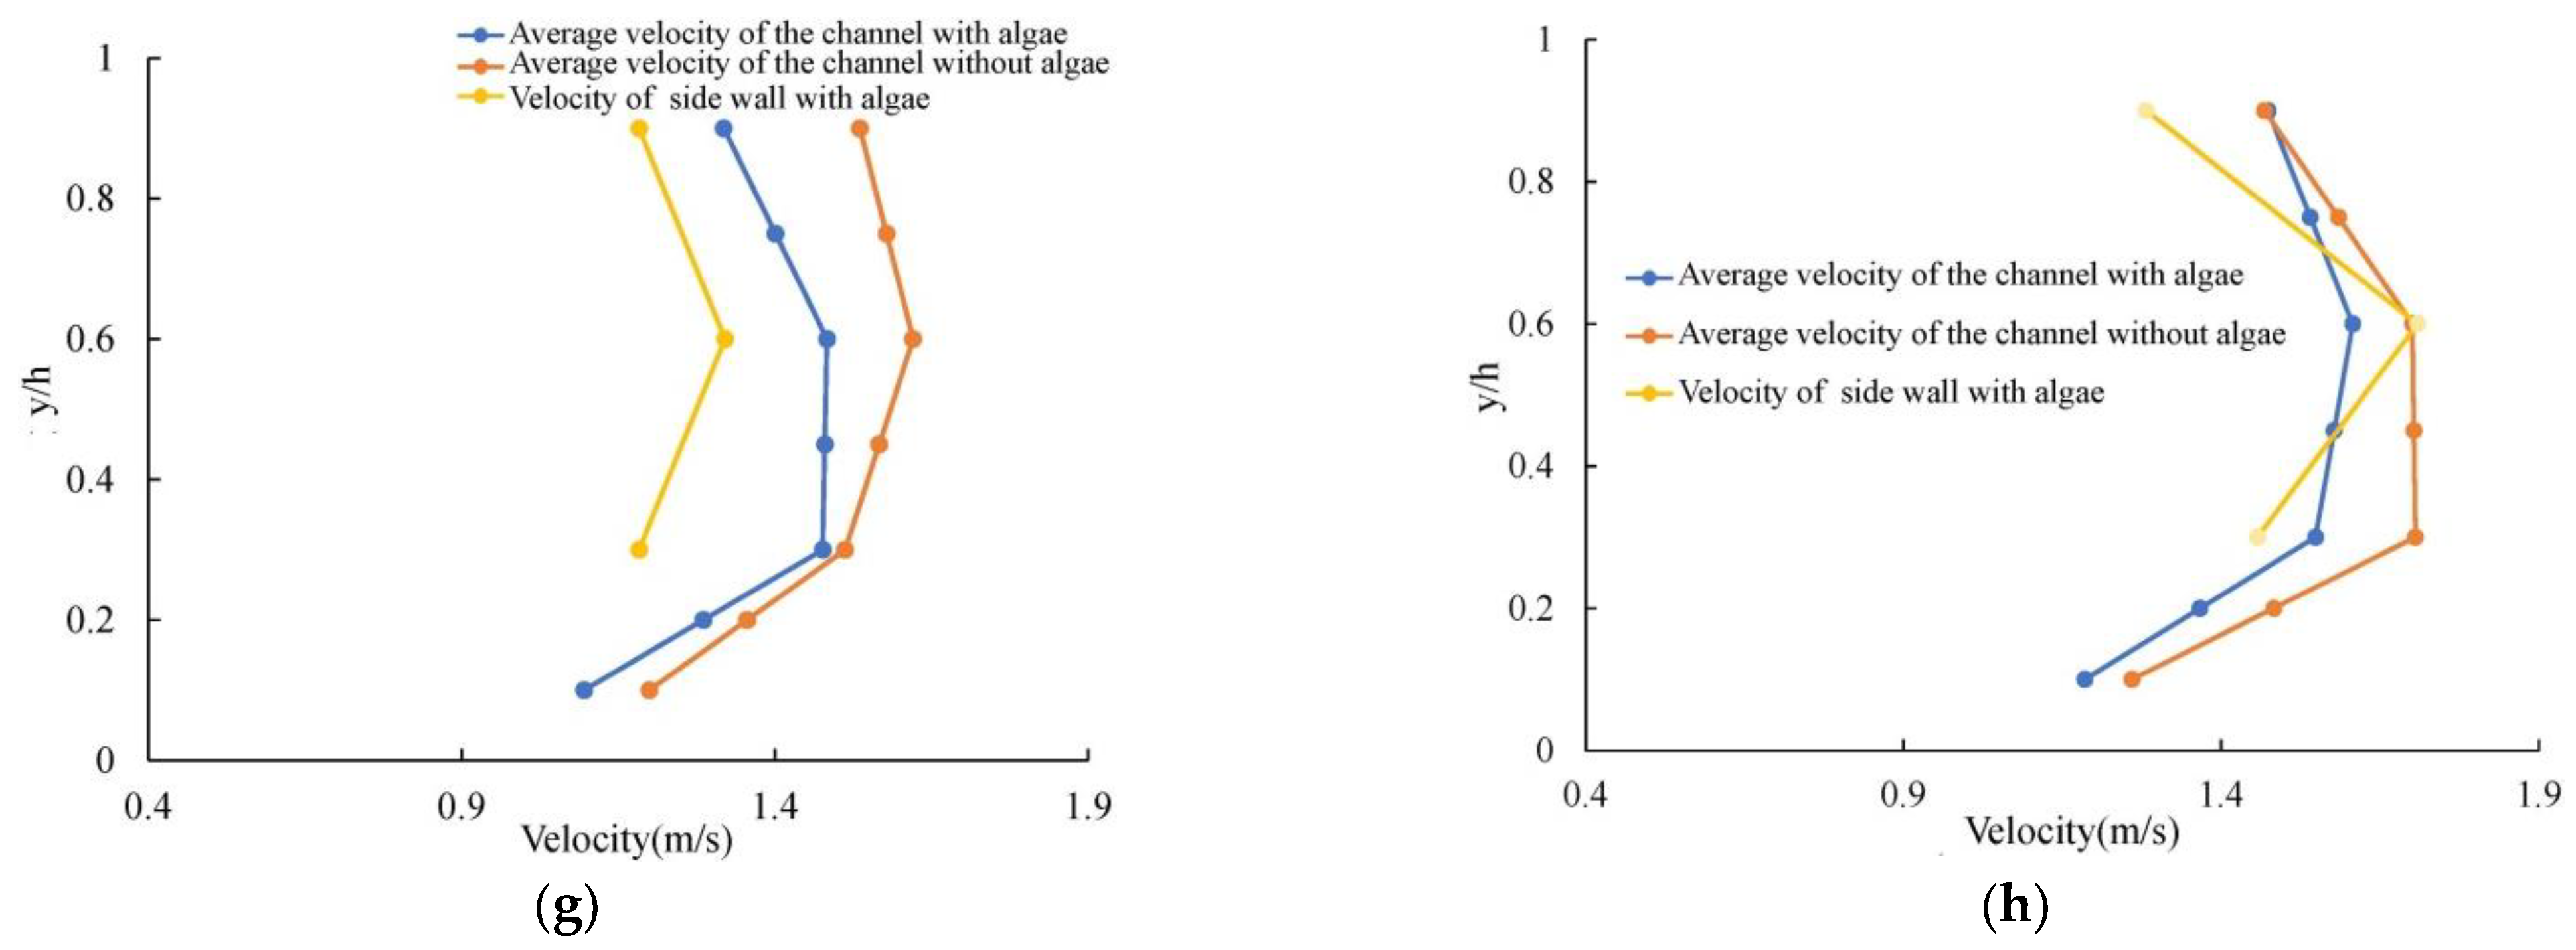
Due to the low flow velocity area at the oblique side wall of the channel and the presence of epipelic algae, it is not known how it affects the flow velocity at different relative water depths of the side wall. Therefore, we analyzed the changes in the flow velocity of the channel and oblique side wall at different flow rates with or without epipelic algae through multiple sets of experiments (Figure 6). The purpose of doing this was to explore the relative relationship between the main flow velocity and the flow velocity of the side wall with epipelic algae and to provide a theoretical basis for the quantitative analysis of the shedding of epipelic algae in the follow-up study.
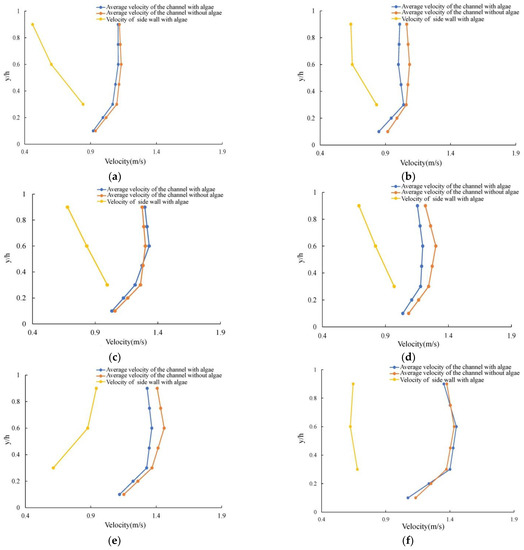
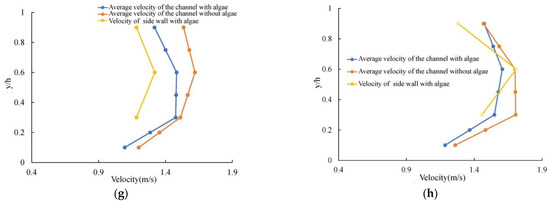
Figure 6.
Vertical distribution of flow velocity of the channel with epipelic algae group attached to the oblique side wall: (a) Q = 36.53 m3/s, a × b = 6 m × 6 m; (b) Q = 36.53 m3/s, a × b = 9 m × 9 m; (c) Q = 68.03 m3/s, a × b = 6 m × 6 m; (d) Q = 68.03 m3/s, a × b = 9 m × 9 m; (e) Q = 102.04 m3/s, a × b = 6 m × 6 m; (f) Q = 102.04 m3/s, a × b = 9 m × 9 m; (g) Q = 220.84 m3/s, a × b = 9 m × 9 m; and (h) Q = 301.69 m3/s, a × b = 9 m × 9 m.
When the discharge is 36.53 m3/s, the average velocity of the channel is maintained at about 1.25 m/s. With the increase in the size of the epipelic algae group, the influence of the presence of the epipelic algae on the near-wall flow velocity of the side wall area is obviously increased, and the sudden change in the near-wall flow velocity is more obvious (Figure 6a,b). The influence of epipelic algae on the distribution of the flow velocity in the channel is not significant, which is as follows: when the relative water depth in the channel is less than 0.3, the velocity gradient is large and the velocity distribution is uneven; when the relative water depth is greater than 0.3, it gradually tends to be uniform.
When the discharge is 68.03 m3/s, the average velocity of the channel is maintained at about 1.36 m/s. With the increase in the size of the epipelic algae group, the near-wall flow velocity of the side wall with epipelic algae is only 0.5 m/s~0.9 m/s, and the influence of epipelic algae on the average flow velocity of the channel increases with the increase in the size of the epipelic algae group (Figure 6c,d).
As the flow discharge continues to increase, the mutation point of the near-wall velocity in the range of the epipelic algae group is still at the relative depth of 0.6, but the near-wall velocity is also affected by the average velocity of the channel. The difference between the near-wall velocity and the average main velocity is slightly smaller than that of the small flow discharge. We believe that this is due to the intensification of flow turbulence at large flow rates, so it has a more obvious effect on the increase in the near-wall velocity (Figure 6e,f).
When the discharge is greater than 200 m3/s, the mutation point of the near-wall velocity in the range of the epipelic algae group still remains at the relative depth of 0.6. At the same time, the maximum near-wall velocity is also at the relative depth of 0.6, and it is closer to the average velocity of the channel, but the distribution of the near-wall velocity along the relative depth is more uneven. When the flow discharge is large and the size of the epipelic algae group is small, the near-wall flow velocity is larger and the distribution along the relative depth is more uniform. We believe that the flow conditions at this time are more conducive to the shedding of the small-sized epipelic algae group (Figure 6g,h).
With the gradual increase in the flow discharge, the velocity distribution is more uneven when the relative water depth is less than 0.3, and the velocity gradient changes more greatly. The velocity inhomogeneity gradually appears when the relative water depth is greater than 0.3, but the effect is still less than the relative water depth below 0.3.
On the whole, when the flow discharge is small, the vertical distribution of the average velocity of the near-wall area where the epipelic algae is located does not conform to the logarithmic distribution. With the increase in the flow discharge, the velocity mutation is more obvious. Regardless of the presence or absence of epipelic algae, the vertical distribution of the average velocity of the channel basically conforms to the logarithmic distribution.
3.2. Distribution Law of Flow Field along the Water Depth Plane
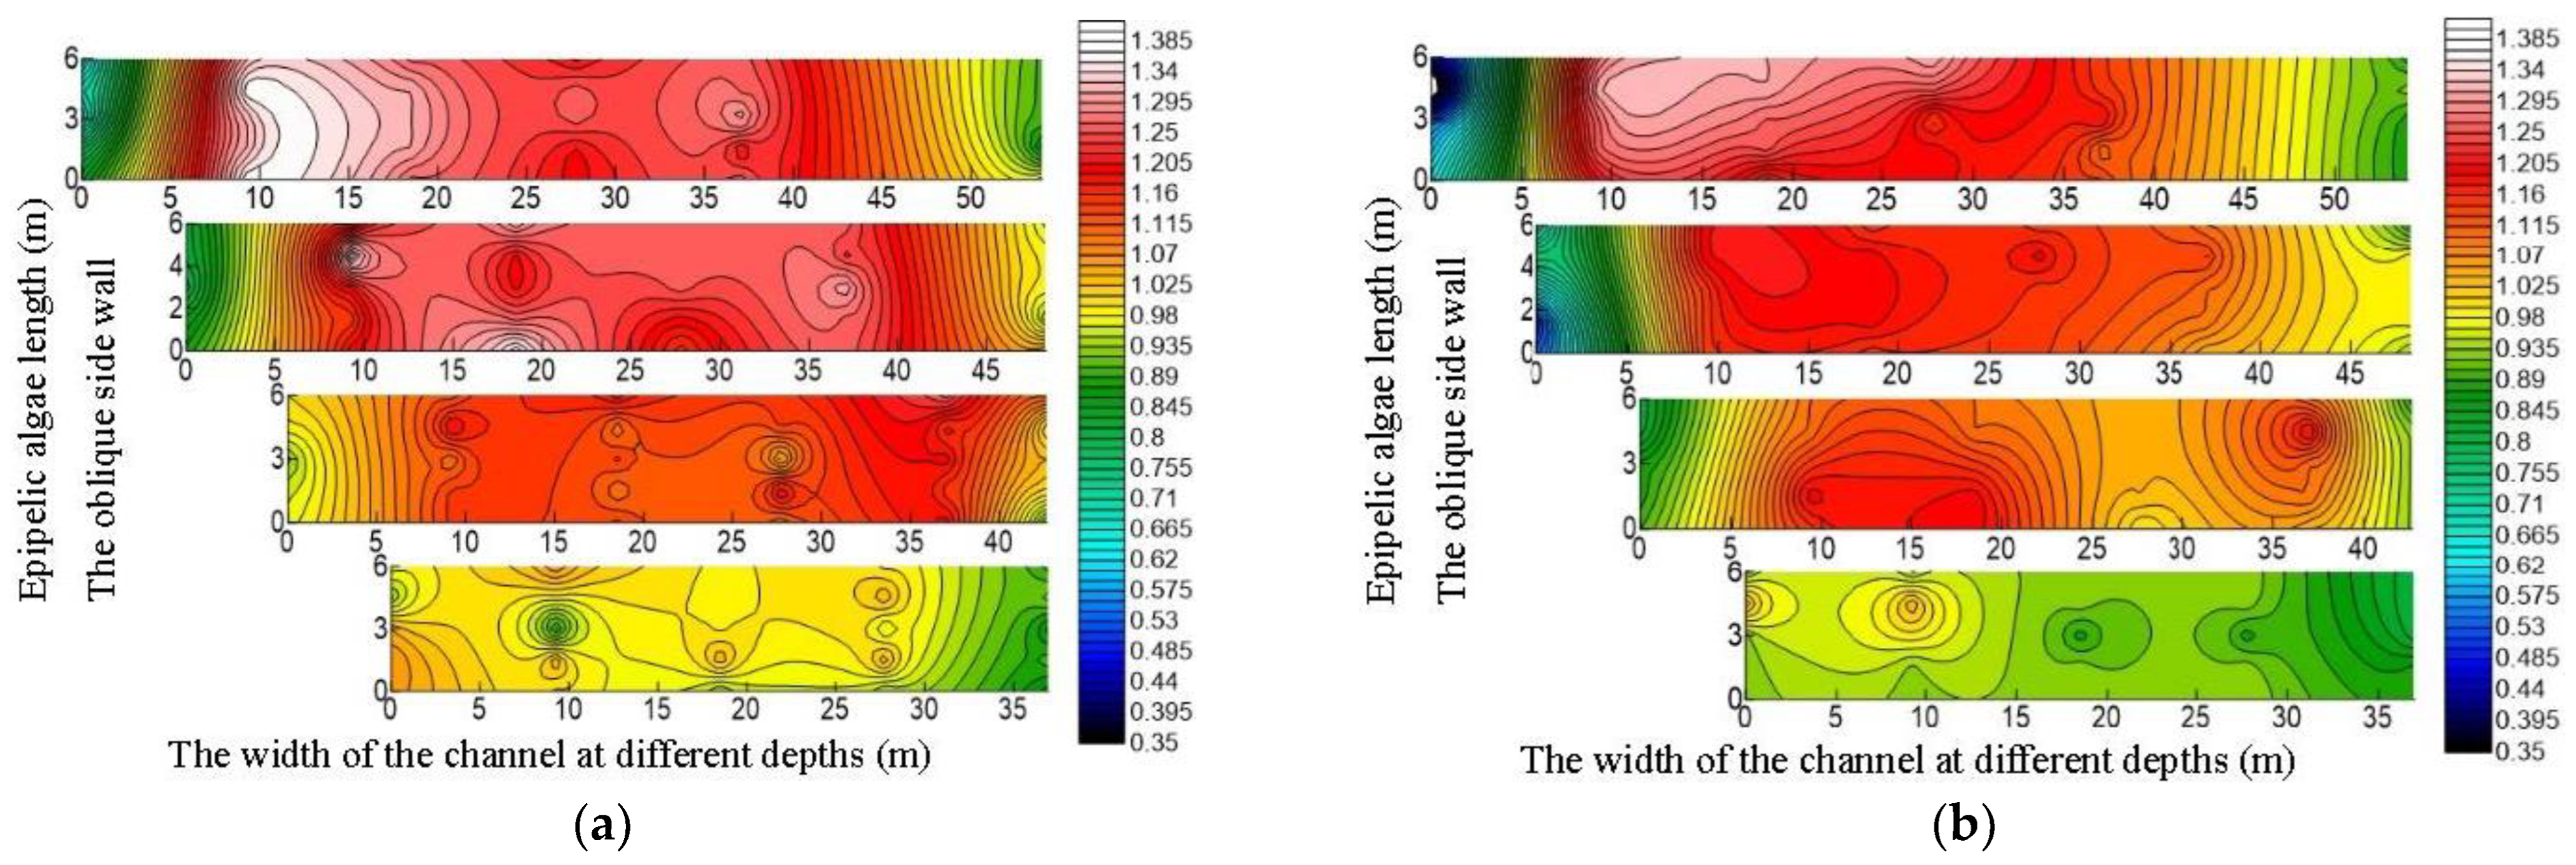
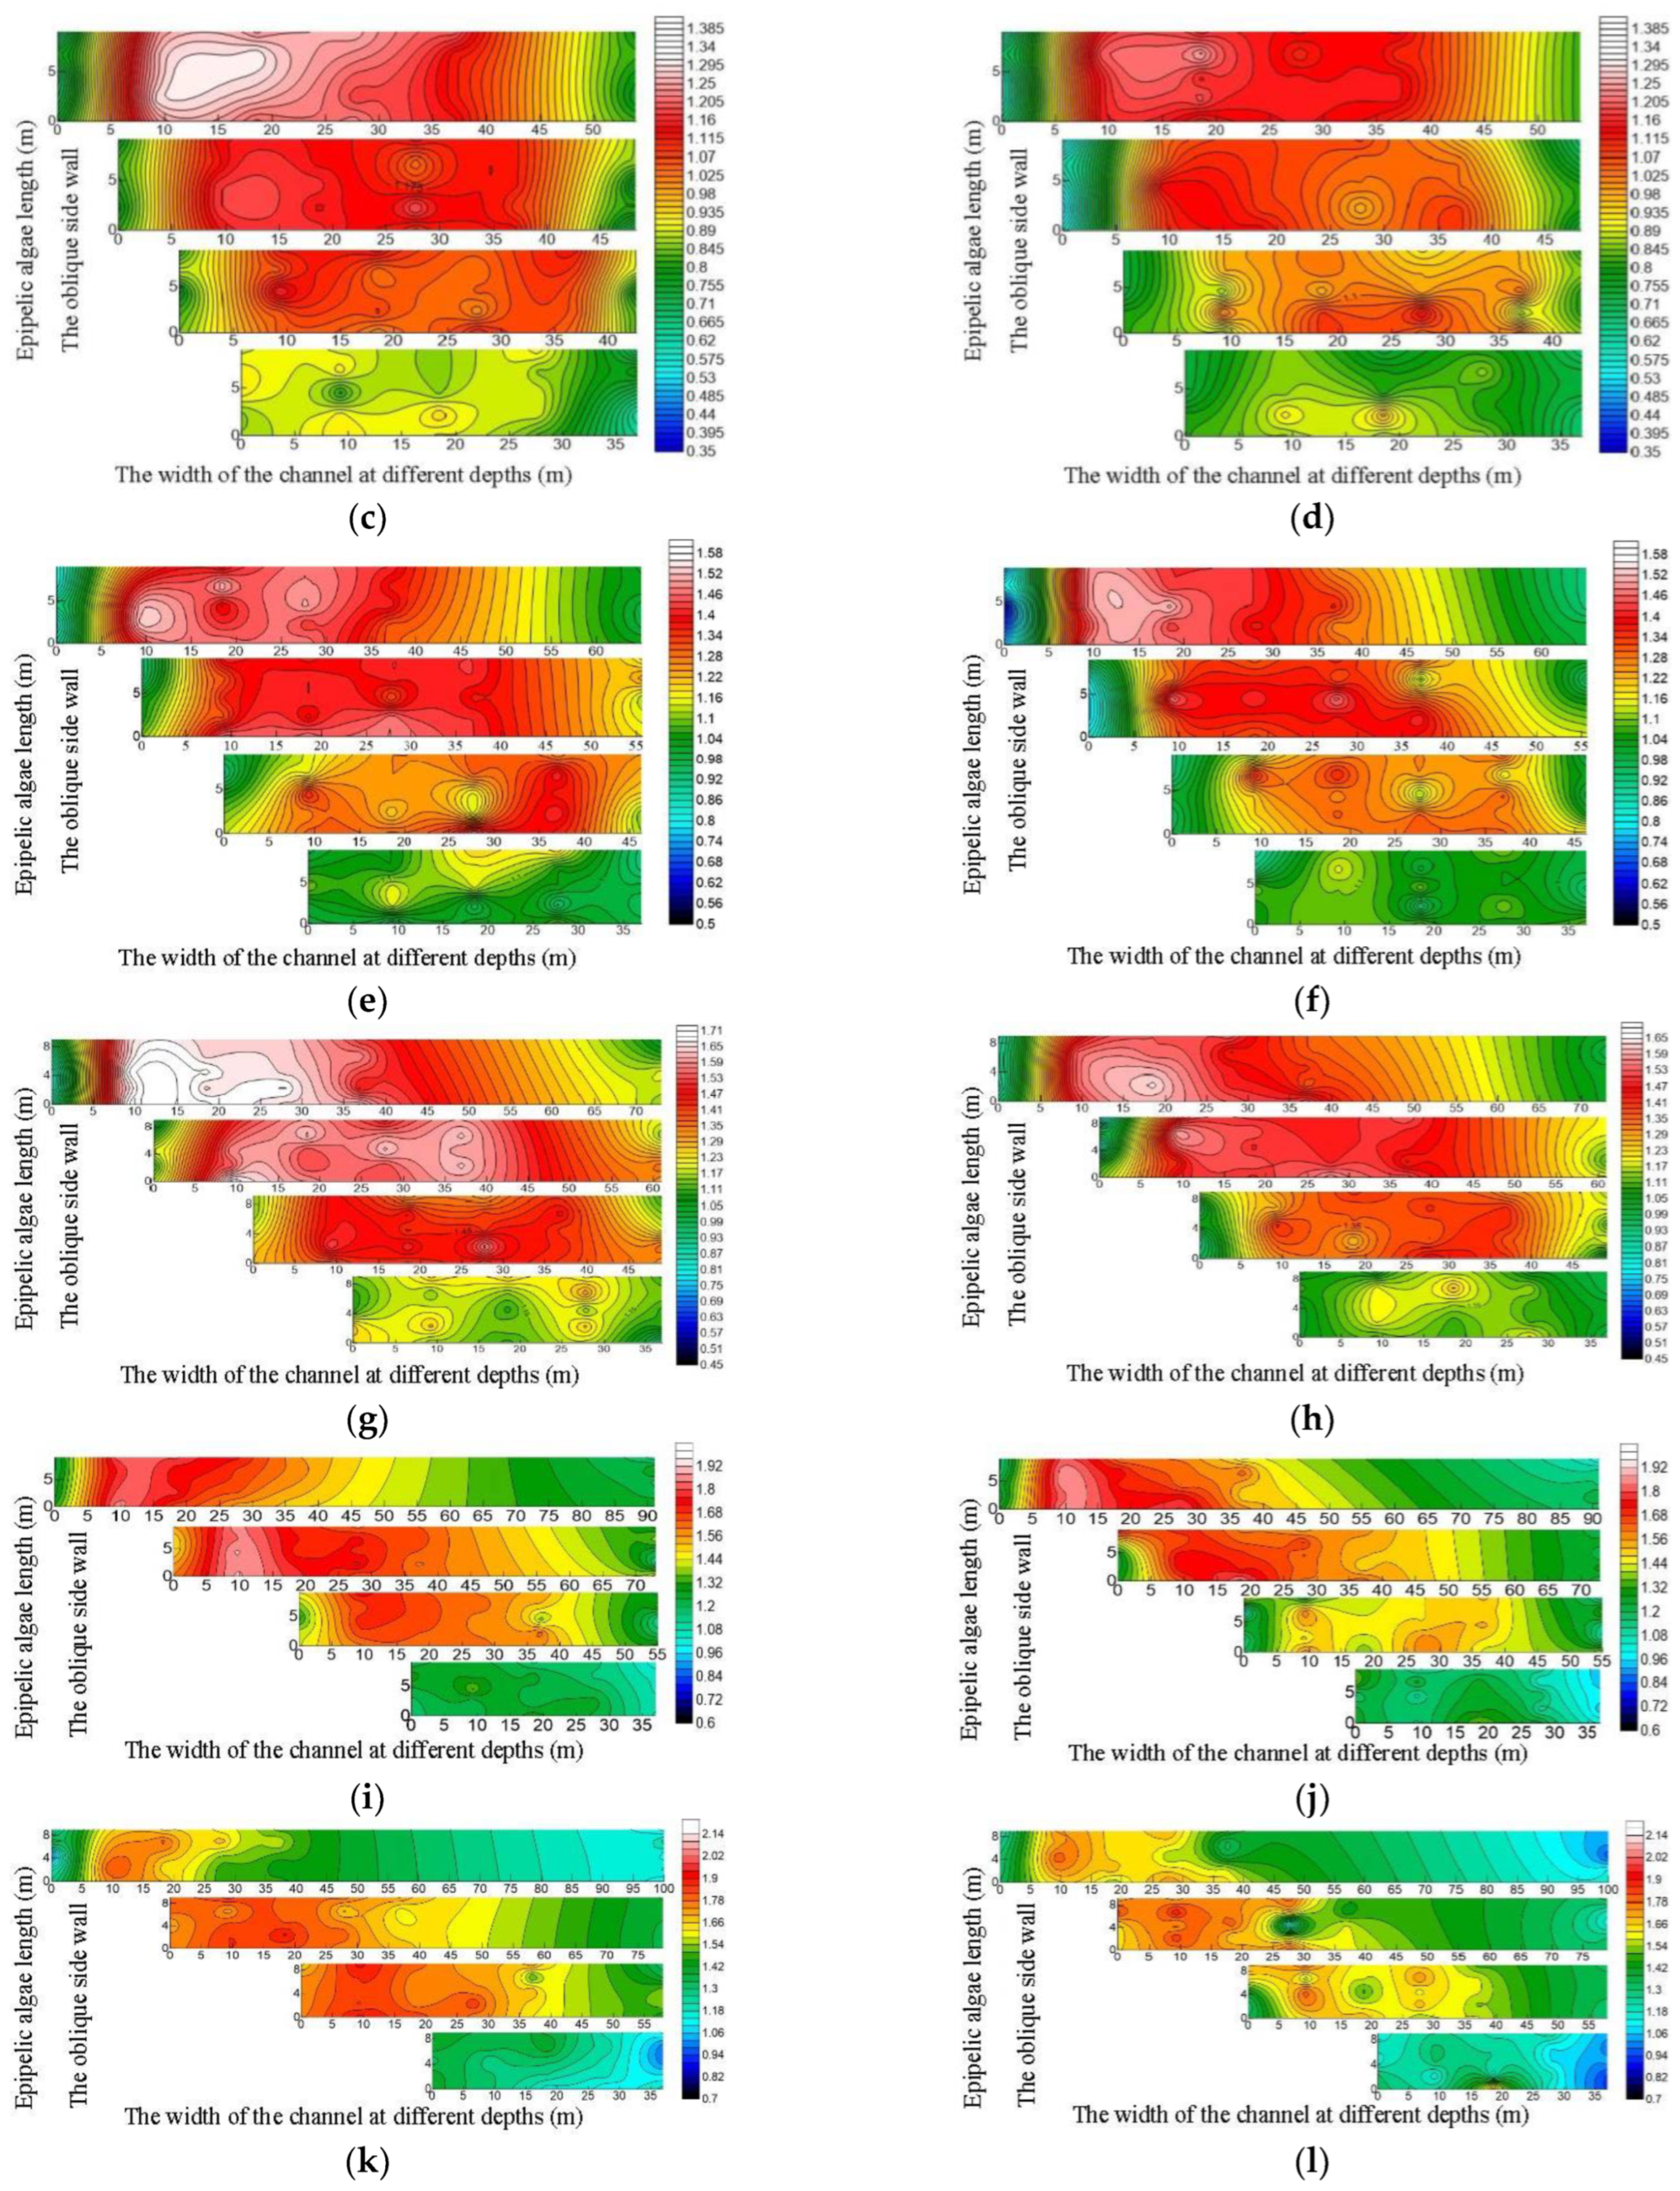
Because research into the epipelic algae group attached to the oblique side wall of the open channel involves interdisciplinary knowledge such as biology, sediment mechanics, and hydrodynamics, the internal decomposition form of the epipelic algae group and the distribution of the surrounding flow field are quite complicated. In this study, we took the epipelic algae group as the research object and studied the flow field distribution under different flow level conditions. In order to more intuitively and truly reflect the flow velocity distribution along the water depth plane of the oblique side wall with the epipelic algae, we drew the flow field diagram of the open channel with algae attached to the side wall according to the flow velocity grid (Figure 7).
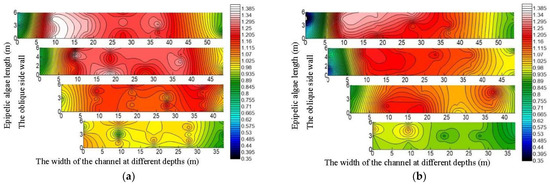
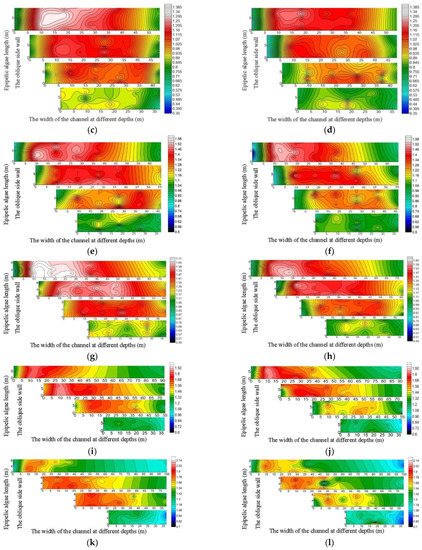
Figure 7.
Flow field of open channel along the water depth plane: (a) Q = 36.53 m3/s, a × b = 6 m × 6 m, without epipelic algae; (b) Q = 36.53 m3/s, a × b = 6 m × 6 m, with epipelic algae; (c) Q = 36.53 m3/s, a × b = 9 m × 9 m, without epipelic algae; (d) Q = 36.53 m3/s, a × b = 9 m × 9 m, with epipelic algae; (e) Q = 68.03 m3/s, a × b = 9 m × 6 m, without epipelic algae; (f) Q = 68.03 m3/s, a × b = 9 m × 6 m, with epipelic algae; (g) Q = 102.04 m3/s, a × b = 9 m × 6 m, without epipelic algae; (h) Q = 102.04 m3/s, a × b = 9 m × 6 m, with epipelic algae; (i) Q = 220.84 m3/s, a × b = 9 m × 9 m, without epipelic algae; (j) Q = 220.84 m3/s, a × b = 9 m × 9 m, with epipelic algae; (k) Q = 301.69 m3/s, a × b = 9 m × 9 m, without epipelic algae; and (l) Q = 301.69 m3/s, a × b = 9 m × 9 m, with epipelic algae.
The minimum velocity of the channel along the water depth plane is located near the wall, and the maximum velocity is not located in the middle of the channel but rather in the center of the channel inclined to the side wall. Under the action of epipelic algae, the velocity of the side wall is significantly reduced (Figure 7a,d). The epipelic algae significantly reduces the range of the peak flow velocity along the water depth plane of the channel (Figure 7e–h). The closer the water flow is to the side wall, the greater the velocity gradient changes so that the flow field becomes more uneven. The closer to the water surface, the smaller the turbulent vortex is. The turbulent vortex gradually increases with the increase in the flow rate (Figure 7i–l).
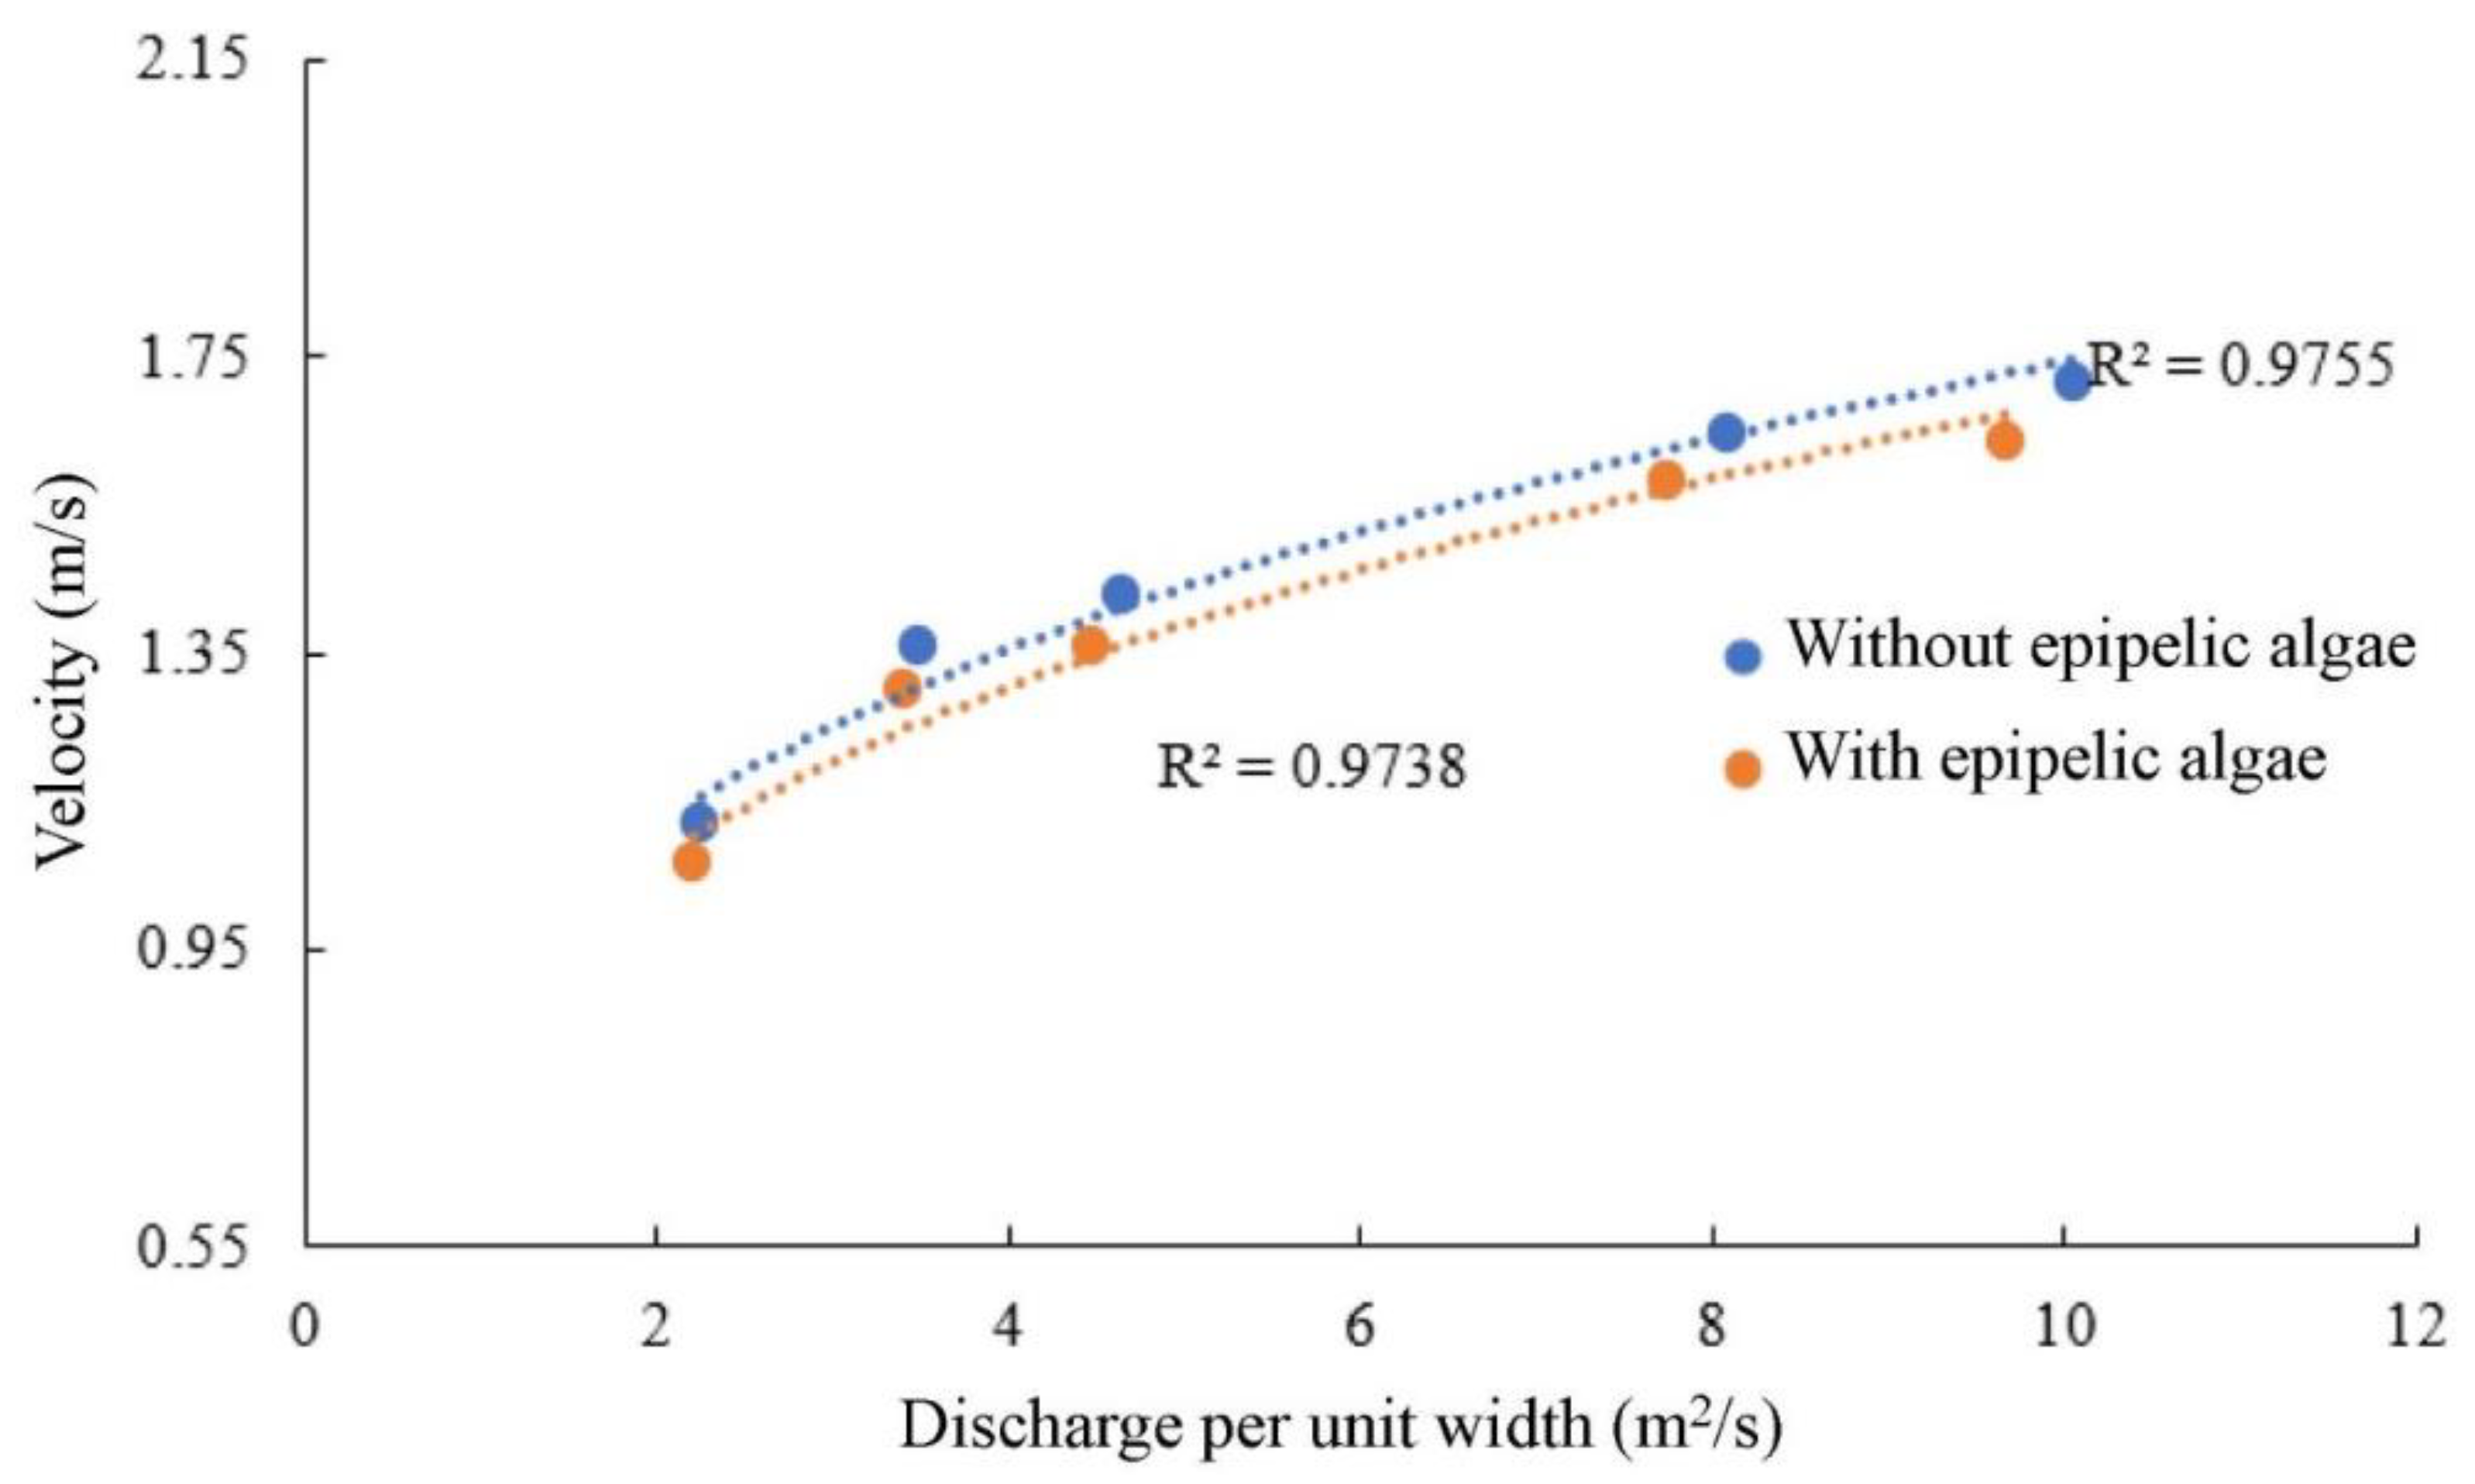
Through the results of the measured flow velocity grid, in the case of small flow, when the size of the epipelic algae group is small, the epipelic algae group is of minimal hindrance to the average flow velocity of the channel, and the epipelic algae group only reduces the average flow velocity of the channel by 5~6%. With the increase in the size of the epipelic algae group, the influence on the flow rate gradually increases; in the case of a large flow, the effect of epipelic algae on the channel flow velocity is minimal. In addition, through the relation between the average flow velocity and discharge per unit width on the side wall with or without epipelic algae (Figure 8), the average flow velocity of the channel increases with the increase in the discharge per unit width. The correlation is strong, and the correlation coefficient is above 0.97. However, as the flow discharge increases, the increase in the flow velocity decreases.
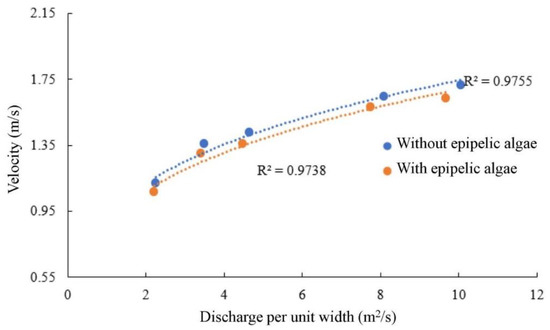
Figure 8.
The relation between the average flow velocity and discharge per unit width on the side wall with or without epipelic algae.
4. Discussion
4.1. The Effect of Epipelic Algae under Maximum Velocity in the Vertical Distribution
The effect of epipelic algae on the side wall makes the maximum velocity in the vertical distribution appear within the relative water depth of 0.6, which slightly deviates from the existing results of the vertical distribution of velocity in the open channel with vegetation.
For example, Niu Mengfei et al. [16] found that the maximum velocity of the vertical distribution occurs at the relative water depth of 0.7~0.8 in the study of the distribution law of velocity of the thin layer on the slope under the condition of a low sediment concentration. Xie Zhifeng et al. [17] believed that the peak value of flow velocity appeared at one-fifth of the vertical line from the water surface to the bottom. Xie Xuedong et al. [18] analyzed the evolution law of the vertical distribution of velocity under the ice cover at the three hydrological stations of Bayangaole, Sanhuhekou, and Toudaoguai in the Inner Mongolia section of the Yellow River during the whole freezing period. The results show that the maximum velocity position often appears at the relative water depth of 0.6~0.8 in the early stage of freezing, and the maximum velocity position has been kept near the relative water depth of 0.4 from the early stage of freezing to the beginning of the river thawing. This is because the existing research on open channel vegetation is mostly based on the growth of vegetation at the bottom of the channel, and the particularity of this study lies in the growth of epipelic algae on the oblique side wall. The complexity of the turbulent flow on the oblique side wall and the physical and biochemical effects of epipelic algae will inevitably lead to deviation between these research results and the existing research results of open channel vegetation.
4.2. The Effect of Epipelic Algae under Different Flow Rates
In the case of small flow, when the size of the epipelic algae group is small, the epipelic algae group has a minimal hindrance to the average flow rate of the channel. The data results show that the epipelic algae group only reduces the average flow rate of the channel by 5~6%. With the increase in the size of the epipelic algae group, the influence on the flow rate gradually increases; in the case of large flow, the effect of epipelic algae on the channel flow rate is minimal.
Through the relation between the average flow velocity and discharge per unit width on the side wall with or without epipelic algae, the average flow velocity of the channel increases with the increase in the discharge per unit width. As the flow discharge increases, the increase in the flow velocity decreases. This result is the same as the experimental conclusion obtained by Zhang Guanghui [19]. The side wall has little effect on the average flow velocity of the whole channel. Ou Zuxian [20] concluded that the velocity near the side wall of the channel is small due to the obstruction of the side wall roughness, but he did not propose the relation between the flow field near the wall and the main channel.
4.3. The Effect of Epipelic Algae under Vertical Distribution of Velocity
When the flow discharge is small, the vertical distribution of the average velocity of the near-wall area where the epipelic algae is located does not conform to the logarithmic distribution. This study is different from the research results of Zhang Peng [21]. Zhang Peng believes that the vertical velocity distribution in the near-wall region of non-uniform flow still conforms to the logarithmic law. With the gradual increase in the flow discharge, the velocity distribution is more uneven when the relative water depth is less than 0.3, and the velocity gradient changes more greatly. The velocity inhomogeneity gradually appears when the relative water depth is greater than 0.3, but the effect is still less than the relative water depth below 0.3. Gong Weijun [22] proposed that when the relative water depth is less than 0.2, the velocity gradient is larger, and the velocity gradient is smaller when it is greater than 0.2.
4.4. The Influence of Epipelic Algae on the Main Flow
The minimum velocity of the channel along the water depth plane is located near the wall, and the maximum velocity is not located in the middle of the channel but rather in the center of the channel inclined to the side wall. A possible reason for this is that the existence of epipelic algae leads to turbulent energy exchange in the open channel, and the convergence of turbulent energy is the maximum velocity. In addition, the presence of epipelic algae increases the roughness of the side wall. Under the action of epipelic algae, the velocity of the side wall is significantly reduced.
4.5. The Influence of Epipelic Algae on Sediment Deposition
The epipelic algae not only reduces the flow velocity of the channel but also significantly reduces the range of the peak flow velocity along the water depth plane of the channel, which will lead to the continuous deposition of sediment on the side wall in the later period, and the amount of deposition will be significantly higher than that without epipelic algae. Therefore, we will consider the sediment deposited on the mud algae as the influencing factor of the shedding of the mud algae.
4.6. The Influence of Epipelic Algae on Turbulent Vortex
The closer the water flow is to the side wall, the greater the velocity gradient changes, so that the flow field becomes more uneven. Because it is easily affected by the secondary flow near the wall, the direction of the main flow velocity and the position of the main flow are changed. The turbulent flow around the oblique side wall diverges from the bottom of the channel to the water surface. The closer to the water surface, the smaller the turbulent vortex is. The turbulent vortex gradually increases with the increase in the flow rate.
5. Conclusions
Through the analysis of the physical characteristics of the prototype sample, and the simulation of the cohesive force between the oblique side wall and the epipelic algae, multi-group and multi-series hydrodynamic tests were carried out. The flow velocity distribution law and the development and change in the turbulent vortex on the side wall were analyzed.
(1) The effect of epipelic algae on the side wall makes the maximum velocity in the vertical distribution appear within the relative water depth of 0.6, which is slightly deviated from the existing results of the vertical distribution of velocity in the open channel with vegetation. This is because the existing research on open channel vegetation is mostly based on the growth of vegetation at the bottom of the channel, and the particularity of this study lies in the growth of epipelic algae on the oblique side wall. The complexity of the turbulent flow on the oblique side wall and the physical and biochemical effects of epipelic algae will inevitably lead to deviation between these research results and the existing research results of open channel vegetation.
(2) In the case of small flow, when the size of the epipelic algae group is small, the epipelic algae group is of minimal hindrance to the average flow rate of the channel. The data results show that the epipelic algae group only reduces the average flow rate of the channel by 5~6%. With the increase in the size of the epipelic algae group, the influence on the flow rate gradually increases; in the case of large flow, the effect of epipelic algae on the channel flow rate is minimal.
(3) With the gradual increase in the flow discharge, the velocity distribution is more uneven when the relative water depth is less than 0.3, and the velocity gradient changes more greatly. The velocity inhomogeneity gradually appears when the relative water depth is greater than 0.3, but the effect is still less than the relative water depth below 0.3. When the flow discharge is small, the vertical distribution of the average velocity of the near-wall area where the epipelic algae is located does not conform to the logarithmic distribution. With the increase in the flow discharge, the velocity mutation is more obvious. Regardless of the presence or absence of epipelic algae, the vertical distribution of the average velocity of the channel basically conforms to the logarithmic distribution.
(4) The attached mud algae group significantly reduces the range of the peak velocity of the channel along the water depth plane, and the flow velocity of each section on the epipelic algae will be significantly reduced. It is easy to be affected by the secondary flow near the wall, which leads to the change in the main flow velocity direction and the main flow position. The maximum flow velocity of the channel along the water depth plane appears at the center of the channel inclined to the side wall. The turbulent flow around the oblique side wall diverges from the bottom of the channel to the water surface, and the turbulent vortex gradually increases with the increase in the flow rate.
In the future, more in-depth and detailed research is needed, for instance, (1) the conversion relation between the turbulent kinetic energy of the side wall and the main channel will be further explored, and the shedding mechanism of the epipelic algae group of the side wall will be studied with regard to the energy conversion at a deeper level. (2) The physical figure and the critical formula of the shedding of the epipelic algae group attached to the oblique side wall of the open channel will be further analyzed and established so as to deepen the theory of the development and change in the turbulent vortex in water flow.
Author Contributions
Conceptualization, M.Z.; methodology, L.P.; validation, M.Z.; formal analysis, M.Z.; investigation, L.P.; resources, L.P.; data curation, L.P.; writing—original draft preparation, L.P.; writing—review and editing, M.Z.; visualization, L.Z.; supervision, M.Z.; project administration, L.P.; funding acquisition, Z.L. All authors have read and agreed to the published version of the manuscript.
Funding
This research was funded by the Basic Research and Development Special Fund of Central Government for Non-profit Research Institute, grant number HKY-JBYW-2020-05, HKY-JBYW-2023-10, HKY-JBYW-2021-01, the Excellent Youth Science Fund of Henan Province, grant number 232300421065, the Promotion and Transformation Fund of Yellow River Institute of Hydraulic Research, grant number HKY-YF-2022-03, and the Yellow River Conservancy Commission of the Ministry of Water Resources Project of Outstanding Young Talents, grant number HQK-202312.
Institutional Review Board Statement
Not applicable.
Informed Consent Statement
Not applicable.
Data Availability Statement
The data presented in this study are available on request from the corresponding author.
Acknowledgments
We would like to thank the potential reviewers very much for their valuable comments and suggestions. We also thank my colleagues’ valuable comments and suggestions that have helped improve this manuscript.
Conflicts of Interest
The authors declare no conflict of interest.
Notation and Abbreviations
The following symbols are used in this paper:
| a | long side length of the rectangle of the epipelic algae group |
| b | short side length of the rectangle of the epipelic algae group |
| D50 | the median particle size |
| h | flow depth |
| Q | flow discharge |
| y | distance from bottom |
References
- Pannard, A.; Bormans, M.; Lagadeuc, Y. Short-term variability in physical forcing in temperate reservoirs: Effects on phytoplankton dynamics and sedimentary fluxes. Freshw. Biol. 2007, 52, 12–27. [Google Scholar] [CrossRef]
- Hondzo, M.; Al-Homoud, A. Model development and verification for mass transport to Escherichia coli cells in a turbulent flow. Water Resour. Res. 2007, 43, 199–212. [Google Scholar] [CrossRef]
- Desortová, B.; Puncochár, P. Variability of phytoplankton biomass in a lowland river: Response to climate conditions. Limnologica 2011, 41, 160–166. [Google Scholar] [CrossRef]
- Nie, K.; Xiong, L.; Wang, J.; Shen, Y.; Li, L. The effects of water flow on the growth of Microcystis aeruginosa in raw water culture of Cuoji Lake, Poyang Lake. J. Jiangxi Norm. Univ. 2022, 46, 107–110. [Google Scholar]
- Li, B.; Zhang, Y.H.; Deng, R.; Zhu, Y.; Song, G.; Mi, W.; Bi, Y. Effects of water velocity on the growth and photosynth eticactivity of Cyclotella meneghiniana (diatom). Chin. J. Ecol. 2022, 41, 1385–1390. [Google Scholar]
- Zhang, H.; Wang, N.; Zong, R.; Huang, T.; Miao, Y.; Shi, Y.; Ma, M.; Liu, X.; Qi, X. Research Progress on Influence of Hydrodynamic Conditions on Algal Physiology and Ecology. Res. Environ. Sci. 2022, 35, 181–190. [Google Scholar]
- Zhou, J.; Gou, T.; Zhang, L.; Lan, Y.; Ma, Q.; Liang, R.; Zhao, X. The effect of flow velocity on the growth of different phytoplankton. Ecol. Sci. 2018, 37, 75–82. [Google Scholar]
- Chen, Y.; Yu, Q.; Zhu, D.; Liu, Z. Research progress and prospects on possible influencing factors of planktonic algae growth in rivers. J. Hydroelectr. Power 2014, 33, 186–195. [Google Scholar]
- Huisman, J.; Sharples, H.; Stroom, J.M.; Visser, P.M.; Kardinaal, W.E.; Verspagen, J.; Sommeijer, B. Changes in turbulent mixing shift competition for light between phytoplankton species. Ecology 2004, 85, 2960–2970. [Google Scholar] [CrossRef]
- Pei, G.; Liu, M. Comparison of the growth of benthic algae on different substrates in Wuhan East Lake. Lake Sci. 2009, 21, 357–362. [Google Scholar]
- Yi, K.L.; Dai, Z.G.; Liu, B.Y.; Lin, Q.; Zeng, L.; Xu, D.; He, F.; Wu, Z. Effects of vertical location and artificial substrate on colonization of algal periphyton. Acta Ecol. Sin. 2016, 36, 864–4872. [Google Scholar]
- Liu, H.; Ye, S.; Yang, X.; Zhang, L.; Zhong, G.; Li, Z. Spatiotemporal dynamics of aquatic community in Nyang River, Tibet and its relationship with environmental factors: 2. epiphytic algae. Lake Sci. 2013, 25, 907–915. [Google Scholar]
- He, F. Study on the Settling Characteristics and Flocculation Mechanism of Fine Sediment in the Three Gorges Reservoir; Minzu University of China: Beijing, China, 2016. [Google Scholar]
- Jiang, G.; Yao, Y.; Tang, Z. Analysis of factors affecting the flocculation and sedimentation of fine sediment in the Yangtze River Estuary. J. Oceanogr. 2002, 24, 51–57. [Google Scholar]
- Wang, D.; Yang, G.; Yu, M. Determination of critical particle size for flocculation of cohesive fine sediment in still water and analysis of its influencing factors. Sediment Res. 2009, 74–80. [Google Scholar]
- Niu, M.; Sun, S.; Gong, Z. Experimental Analysis on Characteristics of Vertical Velocity of Overland Flow on Low Sediment Concentration. J. Lanzhou Jiaotong Univ. 2022, 41, 96–102. [Google Scholar]
- Xie, Z. Analysis and Practice of Vertical Average Velocity Based on Mixed Length Theory. Zhejiang Univ. of Wat. Res. Electric. Pow. 2022, 34, 47–51. [Google Scholar]
- Xie, X.; Li, W.; Zhao, H.; Wang, W.; Yi, Q.; Lu, B. Analysis of the vertical velocity distribution in the Inner Mongolia section of the Yellow River during the freezing period. Yellow River 2005, 27, 30–32. [Google Scholar]
- Zhang, G. Study on hydraulic properties of shallow flow. Adv. Water Sci. 2002, 13, 159–165. [Google Scholar]
- Ou, Z.; Yang, H.; Wang, Z.; Chen, L.; Li, S.; Zhang, Y. Study on Influence of Variation of Channel Side Wall Roughness to the Water Carrying Capacity. Yellow River 2022, 44, 128–131. [Google Scholar]
- Zhang, P. Turbulent Structure in Open-Channel Non-Uniform Flows; Chongqing Jiaotong University: Chongqing, China, 2018. [Google Scholar]
- Gong, W. Open Channel Uniform Flow Velocity Distribution Law Research; Northwest A&F University: Xianyang, China, 2016. [Google Scholar]
Disclaimer/Publisher’s Note: The statements, opinions and data contained in all publications are solely those of the individual author(s) and contributor(s) and not of MDPI and/or the editor(s). MDPI and/or the editor(s) disclaim responsibility for any injury to people or property resulting from any ideas, methods, instructions or products referred to in the content. |
© 2023 by the authors. Licensee MDPI, Basel, Switzerland. This article is an open access article distributed under the terms and conditions of the Creative Commons Attribution (CC BY) license (https://creativecommons.org/licenses/by/4.0/).

