Article

The Chemical Compatibility of Sand–Attapulgite Cut-Off Walls for Landfills

1
PowerChina Huadong Engineering Corporation Limited, Hangzhou 311122, China
2
College of Earth Sciences and Engineering, Hohai University, Nanjing 211100, China
3
Zhejiang Huadong Geotechnical Investigation and Design Institute Corporation Limited, Hangzhou 310030, China
4
Zhejiang Deqing Transportation and Water Resources Investment Group Corporation Limited, Deqing 313200, China
*
Author to whom correspondence should be addressed.
Water 2023, 15(16), 2940; https://doi.org/10.3390/w15162940
Submission received: 18 July 2023 / Revised: 8 August 2023 / Accepted: 10 August 2023 / Published: 15 August 2023

Abstract

:
Soil–bentonite cut-off walls have been widely used to control landfill pollution but they do not have good chemical compatibility with landfill leachate. Attapulgite can be substituted for bentonite in landfill cut-off walls. However, little is known about the chemical compatibility of attapulgite cut-off walls and leachate. This study experimentally investigated the chemical compatibility of attapulgite cut-off wall specimens with organic and inorganic contaminants and found that a sand–attapulgite cut-off wall has good chemical compatibility with organic contaminants. A CaCl2 solution was used to represent inorganic contaminants, and chemical oxygen demand (COD) was used as an indicator of organic content. The hydraulic conductivity of the cut-off wall initially decreased and then increased to become approximately constant as Ca2+ concentration increased. Changes in COD concentration were divided into a decreasing stage (0–10,000 mg/L) and a constant stage (10,000–40,000 mg/L). The increase or decrease in hydraulic conductivity was by no more than one order of magnitude. The increase in the hydraulic conductivity of the sand–attapulgite cut-off wall is explained in terms of bound water content and pore structure. An increase in Ca2+ concentration decreased the bound water content of the cut-off wall while the CaCl2 solution increased macropore and mesopore volume and decreased small pore volume in the sand–attapulgite cut-off wall. The purpose of this study was to elucidate the chemical compatibility of a sand–attapulgite cut-off wall with organic and inorganic contaminants and to increase the understanding of the interactions between the cut-off wall and the contaminants. The results of this research are informative for improving the application, design, and construction of sand–attapulgite cut-off walls.

1. Introduction

Large amounts of municipal solid waste (MSW) are generated as a result of China’s economic growth [1]. According to the statistics of China’s Environmental Protection Industry Report in 2020, the volume of municipal solid waste generated in China in 2018 was 228 million tons, of which 117 million tons (more than 50%) were disposed through landfill [2]. Most early landfill sites were constructed simply and without leakage control systems, and natural clay layers were used as containment liners [3]. It is now common to build cut-off walls around landfills to prevent surrounding soil and groundwater contamination [3,4,5]. Soil–bentonite cut-off walls are commonly used because they are low-cost and simple to construct with low hydraulic conductivity [6,7,8,9,10,11].
However, the chemical compatibility of soil–bentonite cut-off walls with landfill leachate is poor, and its antifouling properties are easily affected by landfill leachate (most importantly, to increase the hydraulic conductivity of the cut-off walls) [6,12,13,14,15,16,17]. Attapulgite is a clay mineral that is cheap and readily available [18,19], and it seems to be well suited for use in pollution containment barriers [20,21,22,23,24,25,26,27]; it is considered to be a viable alternative to bentonite in landfill cut-off walls [20,21,28]. Some research has experimentally confirmed the technical feasibility of using attapulgite as a landfill cut-off wall material [20,29,30,31]. Zhang et al. [31] found that when the attapulgite content in a cut-off wall was ≥30%, the hydraulic conductivity of a sand–attapulgite cut-off wall was lower than 1.0 × 10⁻⁹ m/s.
Chemical compatibility, in geoenvironmental engineering, is the degree of influence a chemical contaminant has on the engineering properties of a soil, such as stress–strain properties, shear strength, compressibility, and permeability [32]. A contaminant is considered to be compatible with the soil if the soil can be mixed with the contaminant without affecting the soil engineering properties. Conversely, if the contaminant alters soil engineering properties, the contaminant and the soil are incompatible. The chemical compatibility of an attapulgite cut-off wall therefore depends on the influence of landfill leachate on the soil, particularly its effects on wall hydraulic conductivity and so determining chemical compatibility requires an understanding of the effects of leachate on wall hydraulic conductivity.
Day [21] investigated the chemical compatibility between leachate and three commercial clays (premium bentonite, salt-resistant bentonite, and attapulgite) in cut-off walls, and attapulgite showed greater chemical compatibility than the other two clays. Stern and Shackelford [20] investigated the chemical compatibility of a sand–bentonite mixture, a sand–attapulgite–bentonite mixture, and a sand–attapulgite mixture with tap water and a 0.5 M CaCl2 solution used as permeates in hydraulic conductivity tests. They found that the chemical resistance of the soil mix increased with the addition of attapulgite and that when the bentonite in the mixture was completely replaced by attapulgite, the CaCl2 solution had almost no effect on the hydraulic conductivity of the sand–attapulgite mixture. Zhu et al. [30] investigated hydraulic conductivity in four kinds of sand–clay soil mixes: sand–kaolin, sand–Jiangning clay, sand–attapulgite, and sand–bentonite using a 0.2 mol/L CaCl2 solution as the permeate. The hydraulic conductivity of the sand–kaolin and sand–attapulgite mixtures varied within an order of magnitude but the hydraulic conductivity of the sand–bentonite mixtures varied more.
Silva and Almanza [24] investigated the hydraulic conductivity of attapulgite compacted clay liners (attapulgite CCL), bentonite compacted clay liners (bentonite CCL), and geosynthetic clay liners (GCL) using distilled water and KCl solutions as comparative permeates. They found that the hydraulic conductivity of attapulgite CCL was almost unchanged, increasing from 0.19 × 10⁻⁹ m/s for the distilled water permeate to 0.25 × 10⁻⁹ m/s for the 80% KCl solution permeate. When the permeate was the 40% KCl solution, the hydraulic conductivity of bentonite CCL increased from <0.01 × 10⁻⁹ m/s (distilled water) to >27.0 × 10⁻⁹ m/s (KCl), increasing by three orders of magnitude. When the permeate solution was the 35% KCl solution, the hydraulic conductivity of GCL changed from <0.17 × 10⁻⁹ m/s (distilled water) to >27.0 × 10⁻⁹ m/s, an increase of two orders of magnitude.
However, previous studies only focused on the influence of inorganic salt solutions on the hydraulic conductivity of sand–attapulgite cut-off walls [20,21,30], and did not clearly explain the mechanism of the hydraulic conductivity change caused by inorganic salt solutions. In addition, the composition of landfill leachate is complex, not only with inorganic contaminants but also organic contaminants [5]. The organic contaminants may also have an impact on the hydraulic conductivity of sand–attapulgite cut-off walls. The amount of organic matter is usually indicated and quantified with the chemical oxygen demand (COD) of the leachate. The concentration of organic contaminants in landfill leachate is usually very high, with an average COD of 18,000 mg/L, and affects the containment performance of the wall [5]. There has been little research into how organic contaminants affect the hydraulic conductivity of sand–attapulgite cut-off walls.
The purpose of this study was to elucidate the chemical compatibility of a sand–attapulgite cut-off wall with organic and inorganic contaminants, that is, to study the influence of organic and inorganic contaminants on the hydraulic conductivity of a sand–attapulgite cut-off wall, and the mechanism of contaminants causing the change of the hydraulic conductivity of the wall is discussed. This study examined chemical compatibility by testing hydraulic conductivity and using mercury intrusion porosimetry to determine pore size distribution, and this study tested for bound water content. The results of this research are informative for improving the application, design, and construction of sand–attapulgite cut-off walls.

2. Materials and Methods

2.1. Materials and Permeate Solutions

The sand–attapulgite cut-off wall specimens were composed of Fujian standard sand and powdered attapulgite. Powdered attapulgite (a particle size below 200 mesh) was purchased from Xuyi County, Jiangsu Province, China. The basic physical properties of Fujian standard sand are given by Xu et al. [3], and the basic physical properties of attapulgite are given by Zhang et al. [31].
An X-ray diffraction (XRD) analysis of attapulgite showed that its mineral components were primarily attapulgite, calcite, dolomite, and quartz (Figure 1). The particle size distributions of Fujian standard sand and attapulgite are shown in Figure 2 [31]. Fujian standard sand is a poorly graded sand and attapulgite is a high-plasticity clay [31].
Refer to the results of contaminant concentrations in the leachate of typical landfills, both in China and elsewhere, summarized by previous studies, and draw on the previous research methods on the chemical compatibility of cut-off walls [3,5,20,30,33]; this study used CaCl2 solutions and glucose solutions at various concentrations (a 1 mg/L glucose solution is equivalent to 1.067 mg/L of COD) as permeates in hydraulic conductivity tests of the sand–attapulgite cut-off wall. The concentrations of Ca2+ and COD used to model contaminant concentrations in the worst-case landfill scenario were 0 mg/L (deionized water), 1250 mg/L, 2500 mg/L, 5000 mg/L, 10,000 mg/L, 20,000 mg/L, and 40,000 mg/L.

2.2. Sample Preparation

Based on the previous work of the research group, when the attapulgite content in a cut-off wall was ≥30%, the hydraulic conductivity of a sand–attapulgite cut-off wall was lower than 1.0 × 10⁻⁹ m/s. So, in this study, the experimental cut-off wall specimens were created using sand–attapulgite mixtures with dry weight attapulgite contents (Ap) of 30%, 40%, and 60%, referred to, respectively, as A30S70, A40S60, and A60S40. Preparation methods are given by Zhang et al. [31]. Liquid limits (wL) of the cut-off wall specimens were, respectively, 28.8%, 36.9%, and 53.7% [34].

2.3. Rigid-Wall Hydraulic Conductivity Tests

The hydraulic conductivity (k) of the sand–attapulgite cut-off wall specimens was determined with a rigid-wall hydraulic conductivity test. The specimens were consolidated under 50 kPa effective stress for 24 h, and then a hydraulic conductivity test was conducted as described by Zhang et al. [31].

2.4. Determination of Bound Water Content

After the hydraulic conductivity test, the pore water content and bound water content of the wall specimens were determined. Pore water content was determined with a drying method. The samples were dried in an oven at 105 °C for 8 h. Bound water content was determined using high-speed centrifugation (Himac high-speed centrifuge, HITACHI, Tokyo, Japan) (Figure 3). The bound water content of the wall was obtained from the soil–water characteristic curve of the sand–attapulgite cut-off wall. The testing methods were as follows.
After the hydraulic conductivity testing, the specimens were cut using a cutting ring and loaded into the centrifuge. The specimens were consecutively centrifuged for 20 h at each of the following speeds: 500 rpm, 1000 rpm, 3000 rpm, 5000 rpm, 7000 rpm, and 9000 rpm. Each specimen was weighed on a balance before being loaded into the centrifuge and at the end of each 20 h speed cycle, and the length h between the sample surface and the top surface of the cutting ring was measured using a vernier caliper. After weighing and measurement, each specimen was centrifuged at the next speed cycle. After the final centrifugation, the specimen was weighed and then dried in an oven at 105 °C for 8 h before being weighed again. The temperature of the centrifuge was set to 25 °C.
The soil–water binding potential energy pF of the specimen at each speed cycle was found by substituting the measured data into the following equation:
pF = 2 log ( n ) + log ( r 0 r 1 ) + log ( r 0 + r 1 ) 2 4.953
where n is the speed of the centrifuge (rpm); r0 is the distance from the bottom of the specimen to the rotation center of the centrifuge, which was fixed at 9.8 cm (Figure 4); r1 is the distance from the center of the specimen to the rotation center of the centrifuge (cm); and r1 = r0 −  5.09     h 2  (Figure 4), where 5.09 is the fixed height of the cutting ring (cm), and h is the distance from the surface of the specimen to the top surface of the cutting ring (cm).

2.5. Mercury Intrusion Porosimetry

After the hydraulic conductivity test, the specimens were tested using a mercury intrusion porosimeter (MIP) (AutoPore 9500 automatic mercury intrusion porosimeter, Micromeritics, Norcross, GA, USA). The specimens were freeze-dried to remove moisture before MIP.

3. Results and Discussion

3.1. Effect of the Inorganic Contaminant on the Hydraulic Conductivity

The hydraulic conductivity of the sand–attapulgite cut-off wall initially decreased, then increased, and then stabilized as the Ca2+ concentration increased (Figure 5). Three stages were identified. (1) A decreasing stage: when the Ca2+ concentration increased from 0 mg/L to 5000 mg/L, the hydraulic conductivity of the cut-off wall decreased slightly as the Ca2+ concentration increased. (2) An increasing stage: the hydraulic conductivity of the cut-off wall increased as the concentration of Ca2+ increased from 5000 mg/L to 10,000 mg/L. (3) A stable stage: the hydraulic conductivity of the cut-off wall remained approximately unchanged as the concentration of Ca2+ was >10,000 mg/L. It should be noted that the hydraulic conductivity of the cut-off wall was greater than 1.0 × 10⁻⁹ m/s in this stage.
The hydraulic conductivity of the sand–attapulgite cut-off wall varied with the Ca2+ concentration within a single order of magnitude, whether increasing or decreasing. In contrast, the hydraulic conductivity of the soil–bentonite cut-off wall varied greatly with the Ca2+ concentration in a range of 1~4 orders of magnitude, and lower Ca2+ concentrations caused an increase in the hydraulic conductivity of the soil–bentonite cut-off wall [35,36,37] (Figure 5). The figure shows that the sand–attapulgite cut-off wall has better chemical compatibility with the inorganic contaminant than the soil–bentonite cut-off wall.
Stern and Shackelford [20] examined the hydraulic conductivity of sand–attapulgite soils with a 10%, 15%, or 20% attapulgite content infiltrated with a CaCl2 solution with a Ca2+ concentration of 20,000 mg/L. It is concluded that the hydraulic conductivity of sand–attapulgite mixed soil varied within the same order of magnitude. Zhu et al. [30] examined the hydraulic conductivity of sand–attapulgite soil with a 10% attapulgite content infiltrated with tap water and a CaCl2 solution with a Ca2+ concentration of 8000 mg/L, and they found that the hydraulic conductivity of the sand–attapulgite soil increased within a single order of magnitude when the permeate was changed from tap water to the CaCl2 solution.

3.2. Effect of the Organic Contaminant on the Hydraulic Conductivity

The hydraulic conductivity of the sand–attapulgite cut-off wall varied with the COD concentration in two stages (Figure 6). (1) A decreasing stage: as the COD concentration increased from 0 mg/L to 10,000 mg/L, the hydraulic conductivity of the wall decreased slightly. (2) A stable stage: when the COD concentration increased from 10,000 mg/L to 40,000 mg/L, the hydraulic conductivity of the wall was approximately unchanged. The hydraulic conductivity of the sand–attapulgite cut-off wall was less than 1.0 × 10⁻⁹ m/s at all stages.
Xu et al. [5] investigated the influence of different COD concentrations on the hydraulic conductivity of sand–bentonite cut-off walls. They found that the hydraulic conductivity of the wall increased as the COD concentration increased. Hydraulic conductivity was greater when the COD concentration was 0~10,000 mg/L than when it was 10,000~20,000 mg/L (Figure 6).
The hydraulic conductivity of the sand–attapulgite cut-off wall varied within a single order of magnitude as COD concentration increased (Figure 6), which indicates that the sand–attapulgite cut-off wall had better chemical compatibility with the organic contaminants than the soil–bentonite cut-off wall.
The previous analysis shows that inorganic contaminants have a greater adverse effect than organic contaminants on the hydraulic conductivity of the sand–attapulgite cut-off wall. In Section 3.3 and Section 3.4, this paper analyzes the impact mechanism of an inorganic salt solution as a permeate solution on the hydraulic conductivity of the cut-off wall from two aspects: the pore structure and bound water content of the sand–attapulgite cut-off wall.

3.3. Change in Pore Structure with the Contaminant Concentration

The pore size distribution of the sand–attapulgite cut-off wall changed after permeation with the CaCl2 solution (Figure 7). The pore diameter (d) corresponding to the highest pore distribution peak first decreased and then increased as the Ca2+ concentration increased, and the pore diameter corresponding to the second peak was basically not changed as the Ca2+ concentration increased (Figure 7). The porosity of the cut-off wall varied greatly with pore diameters ranging from 0.25 µm to 30 µm (Figure 7). This study inferred that pores in this size range have a great influence on the hydraulic conductivity of the sand–attapulgite cut-off wall.
Different scholars have different standards for the classification of soil pore sizes [38,39,40]. This study used a five-category classification of the pores in the sand–attapulgite cut-off wall based on other classification criteria of soil pore size distributions together with the pore distribution curve characteristics. The categories, in descending order of size, were as follows. (1) Macropores (d > 30 µm): mainly pores between clusters of particles. (2) Mesopores (5 µm < d ≤ 30 µm): mainly pores within clusters of particles. (3) Small pores (0.25 µm ≤ d ≤ 5 µm): mainly intergranular pores and pores partially within clusters of particles. (4) Micropores (0.05 µm ≤ d ≤ 0.25 µm): mainly intergranular pores. (5) Extreme micropores (d < 0.05 µm): mainly intragranular pores.
When the Ca2+ concentration increased from 0 mg/L to 5000 mg/L, the macropore and mesopore proportions in the sand–attapulgite cut-off wall decreased, and the proportion of small pores increased (Table 1). This study inferred that some chemical reactions occurred between the sand–attapulgite cut-off wall and CaCl2, forming new chemical products [41], which increased the proportion of small pores and blocked the macropores and mesopores in the wall, thus decreasing hydraulic conductivity.
When the Ca2+ concentration increased from 5000 mg/L to 10,000 mg/L, the proportion of macropores and mesopores in the sand–attapulgite cut-off wall increased, and the proportion of small pores decreased (Table 1), which was an important factor of the increase in hydraulic conductivity. In addition, the compression of the wall diffuse double layer (DDL) with the CaCl2 solution was also a reason for the increase in hydraulic conductivity. As CaCl2 concentration increased, the effect of the solution on DDL increased, which allowed for increased water passage in the cut-off wall. The CaCl2 solution carried fine particles out of the sample during permeation, resulting in an increase in macropore and mesopore proportions and a decrease in the micropore proportion in the sample.

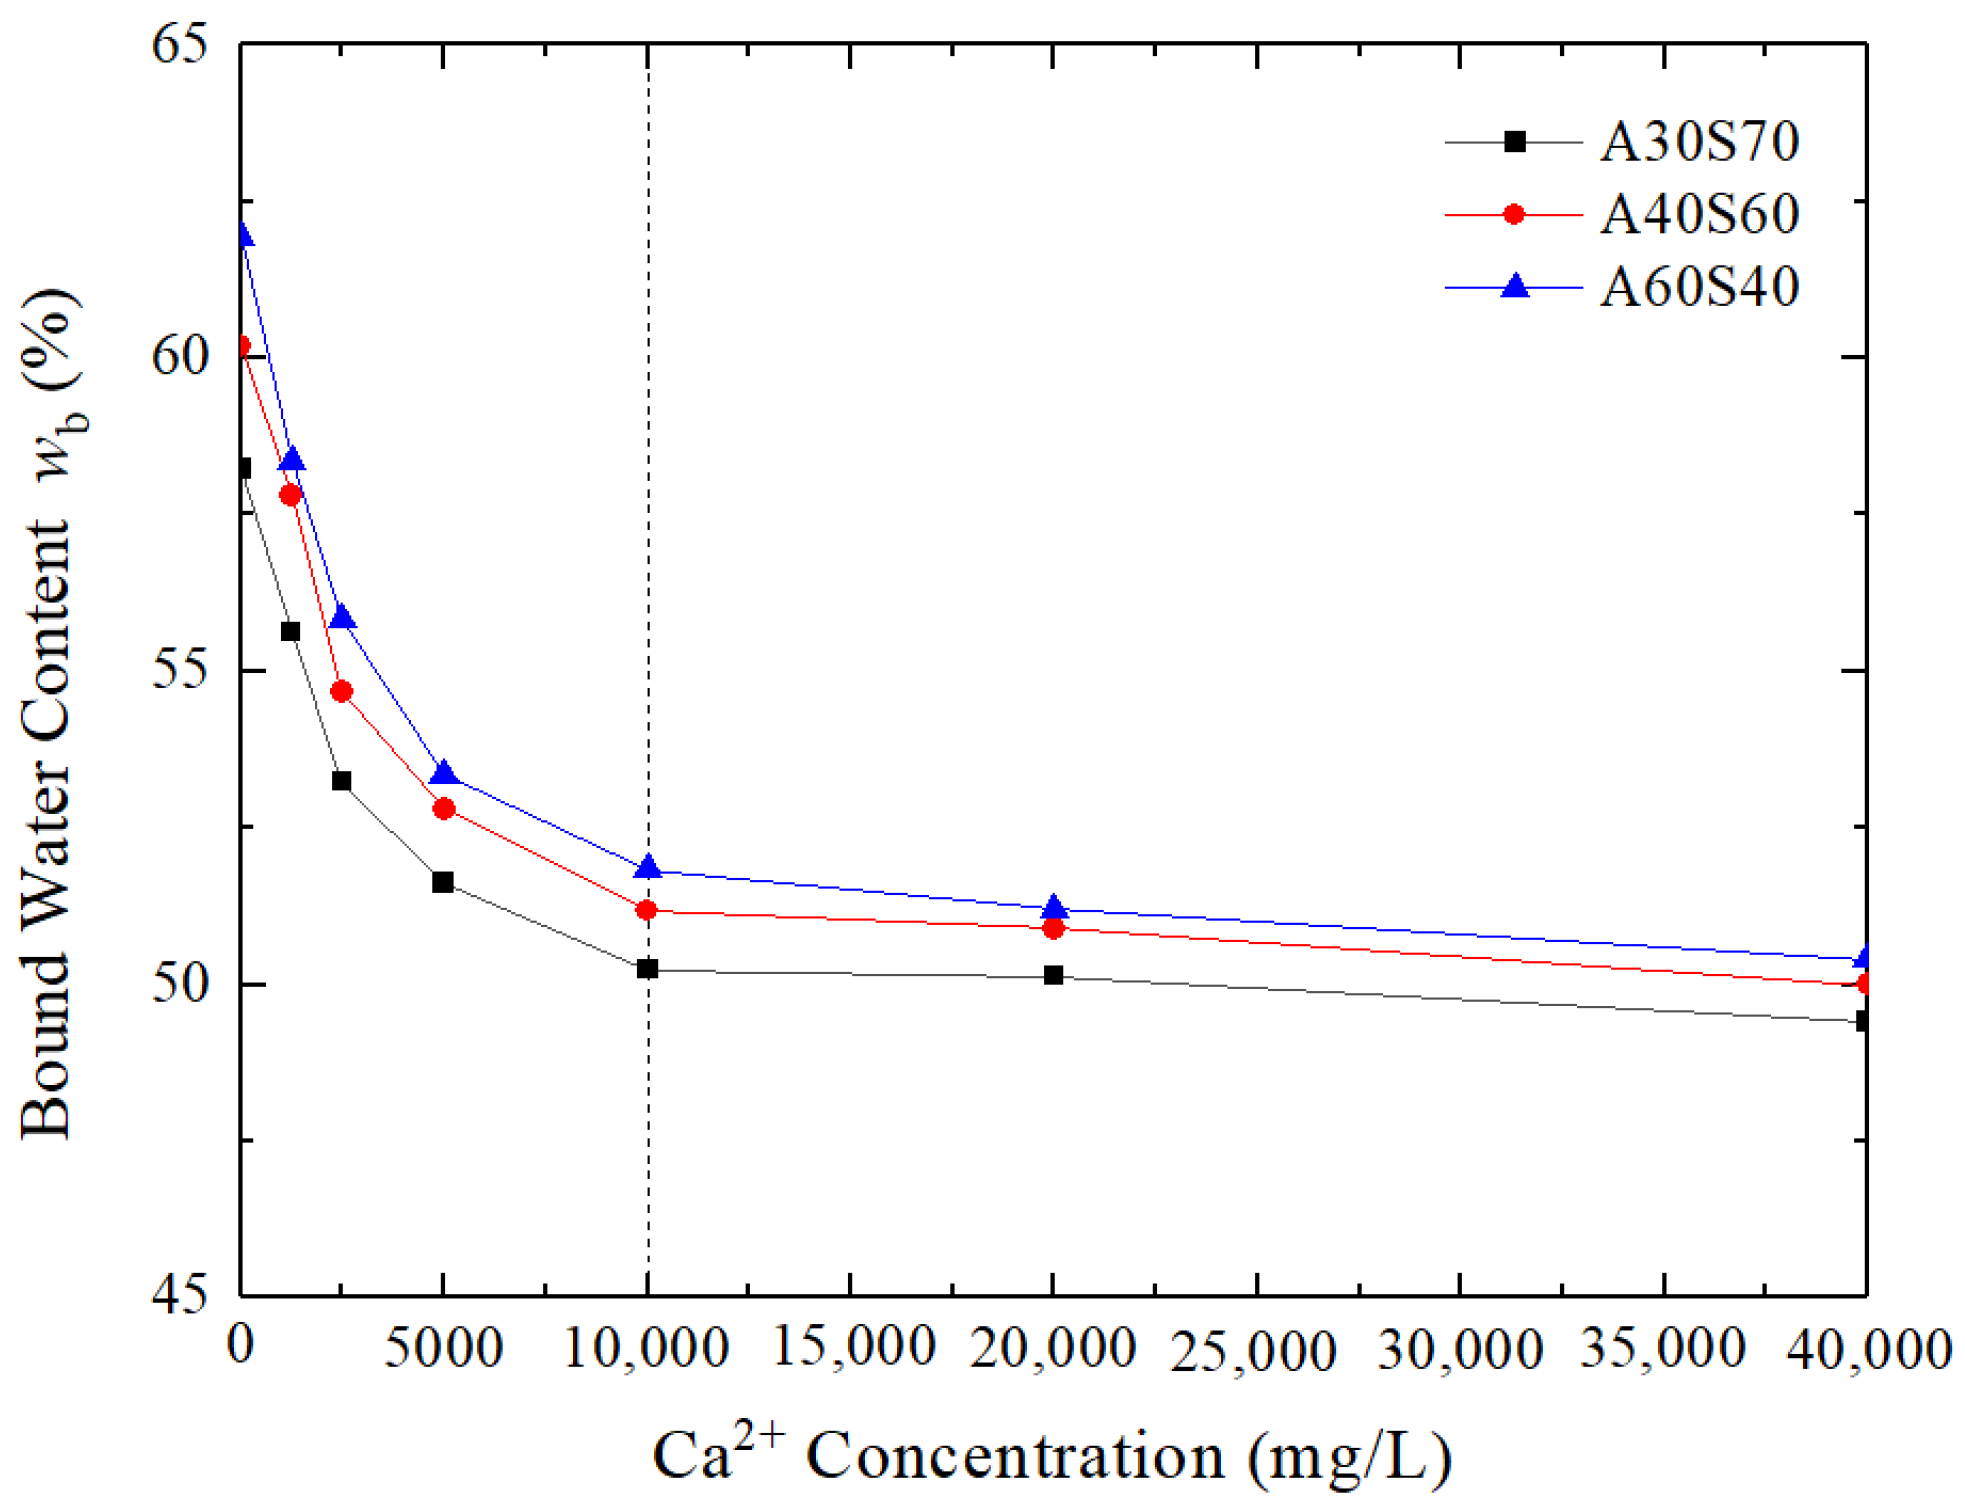
3.4. Change of Bound Water Content with Contaminant Concentration

The change in DDL (bound water content) of the cut-off wall also changed hydraulic conductivity, and the compression of the DDL increased hydraulic conductivity. The distribution of cations in the solution around the surfaces of clay particles is influenced both by the electrostatic attraction of the negative charges on the particle surfaces and by Brownian motion [42,43]. The electrostatic effect draws the cations to become close to the surfaces of the clay particles, while Brownian motion diffuses the cations away from the clay particle surfaces. These two forces combine the anions on the clay particle surfaces and the cations in the solution to form the DDL. The Guoy–Chapman model is widely used to describe DDL [42,43].
According to the Guoy–Chapman model, the thickness D of the DDL on the surface of clay particles in the dispersed state can be approximated with the following equation [44]:
D = ε k B T 8 π c Q 2 v 2
where ε is the permittivity of the pore fluid; kB is the Boltzmann constant; T is the absolute temperature (K); c is the molar concentration of cations; Q is the quantity of elementary charge; and v is the valence of the cations.
It can be seen from Equation (2) that an increase in the molar concentration of cations (c) in the solution will reduce the thickness of the DDL on the surface of the clay particles, which will decrease the bound water content wb of the specimen and increase its hydraulic conductivity.
Figure 8 shows that a change in the bound water content wb can be divided into two stages. (1) A decreasing stage: when the Ca2+ concentration increased from 0 mg/L to 10,000 mg/L, the bound water content wb decreased as the Ca2+ concentration increased. This is because as the Ca2+ concentration increases, the molar concentration of cations (c) in the solution will also increase, resulting in the compression of the DDL on the surface of the sand–attapulgite cut-off wall particles, that is, the reduction of the bound water content wb. (2) A stable stage: when the Ca2+ concentration increased from 10,000 mg/L to 40,000 mg/L, the bound water content wb of the wall remained approximately constant, although it decreased slightly. The figure shows that when the Ca2+ concentration is >10,000 mg/L, the thickness of the DDL was at a minimum, and the influence of the concentration of the solution was also small. Together, these observations provide an important reason for the hydraulic conductivity of the specimen to remain unchanged at this concentration (Figure 5).
Theoretically, a decrease in bound water content will increase the hydraulic conductivity of the sand–attapulgite cut-off wall. However, when the Ca2+ concentration increased from 0 mg/L to 5000 mg/L, the hydraulic conductivity decreased slightly (Figure 5), which indicates that when the fine particle content of the wall is large, the effect of pore structure on hydraulic conductivity is greater than the effect of bound water content (Figure 9a). The staggered distribution of the clay particles and the associated pore structure offset the effect of reduced bound water content on hydraulic conductivity (Figure 9b). Only when the bound water content decreases to a particular level will it adversely affect the hydraulic conductivity of the wall (Figure 9c).
The chemical compatibility of the sand–attapulgite cut-off wall with inorganic and organic contaminants is studied, and the mechanism of inorganic contaminants causing the hydraulic conductivity change in the sand–attapulgite cut-off wall is discussed in this study. The results of this research are informative for improving the application, design, and construction of sand–attapulgite cut-off walls. However, this study discusses the chemical compatibility of the sand–attapulgite cut-off wall with a single contaminant (inorganic contaminant or organic contaminant), which may have certain limitations due to the complex contaminants in landfill leachate (multiple contaminants present at the same time). Subsequent studies can focus on the chemical compatibility of a sand–attapulgite cut-off wall with composite contaminants.

4. Conclusions

In this study, the chemical compatibility of a sand–attapulgite cut-off wall and the mechanisms of a hydraulic conductivity change were investigated with a hydraulic conductivity test, bound water content determination, and a mercury intrusion porosimeter test, and the following conclusions were drawn:
(1)
As the Ca2+ concentration increased, the hydraulic conductivity of the sand–attapulgite cut-off wall first decreased, then increased, and then stabilized. Whether increasing or decreasing, it varied within a single order of magnitude. The results show that the sand–attapulgite cut-off wall has better chemical compatibility with inorganic contaminants than the soil–bentonite cut-off wall (the hydraulic conductivity increased by one to four orders of magnitude as the Ca2+ concentration increased). When the Ca2+ concentration exceeded 10,000 mg/L, the hydraulic conductivity of the sand–attapulgite cut-off wall was greater than 1.0 × 10⁻⁹ m/s.
(2)
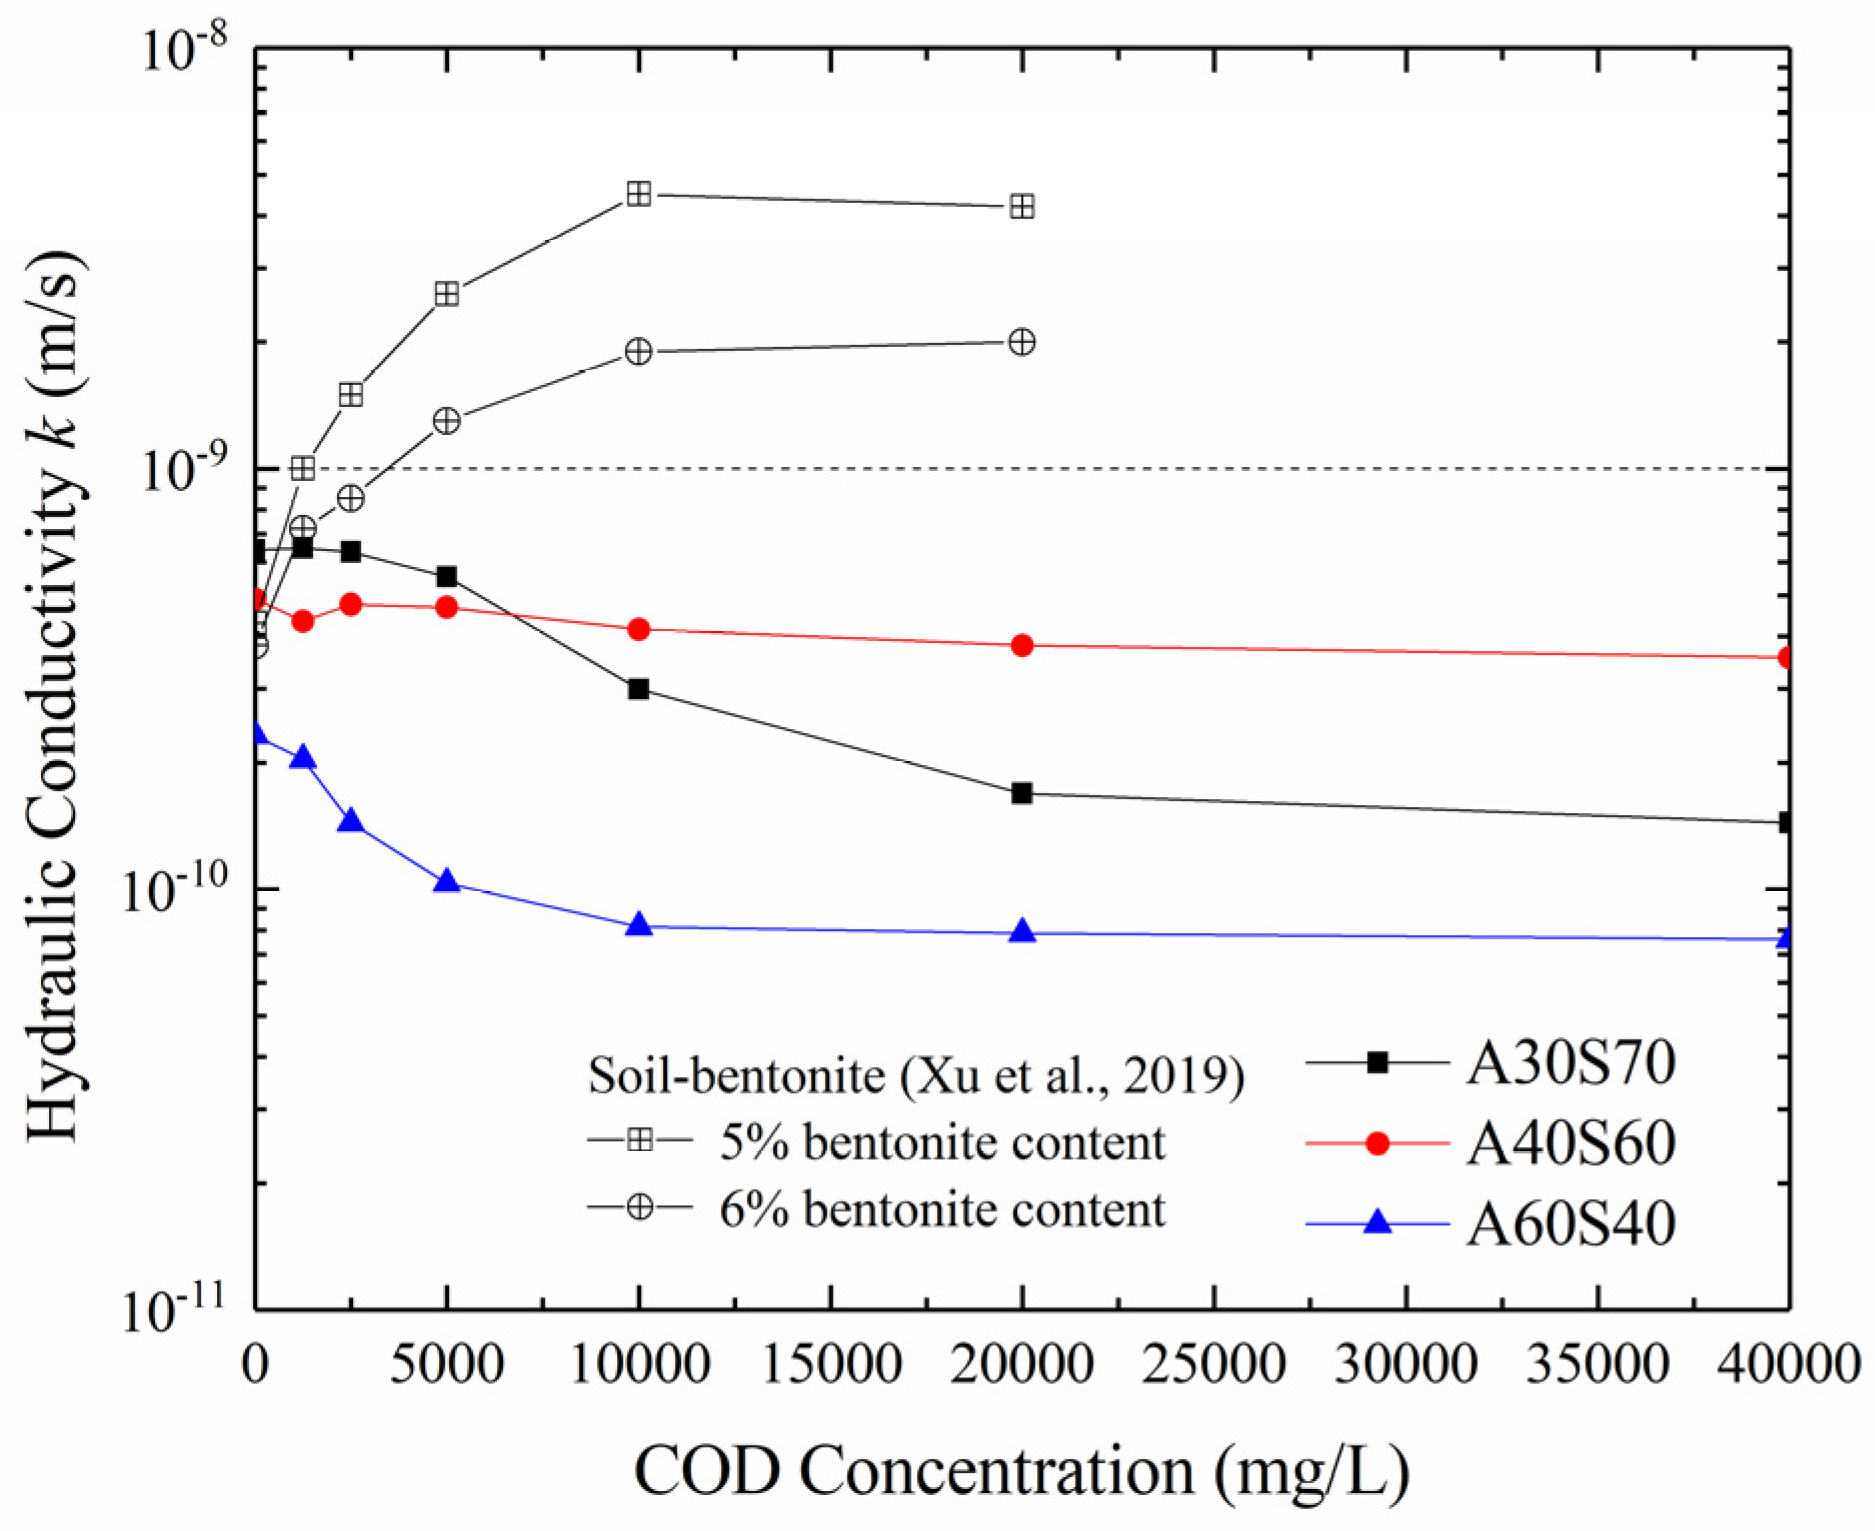
The hydraulic conductivity of the sand–attapulgite cut-off wall with a COD concentration was divided into a decreasing stage (0 mg/L–10,000 mg/L) and a stable stage (10,000 mg/L–40,000 mg/L). The hydraulic conductivity of the sand–attapulgite cut-off wall was less than 1.0 × 10⁻⁹ m/s in both stages, and the range of variation as COD varied was within one order of magnitude, which indicates that the sand–attapulgite cut-off wall had good chemical compatibility with the COD solution.
(3)
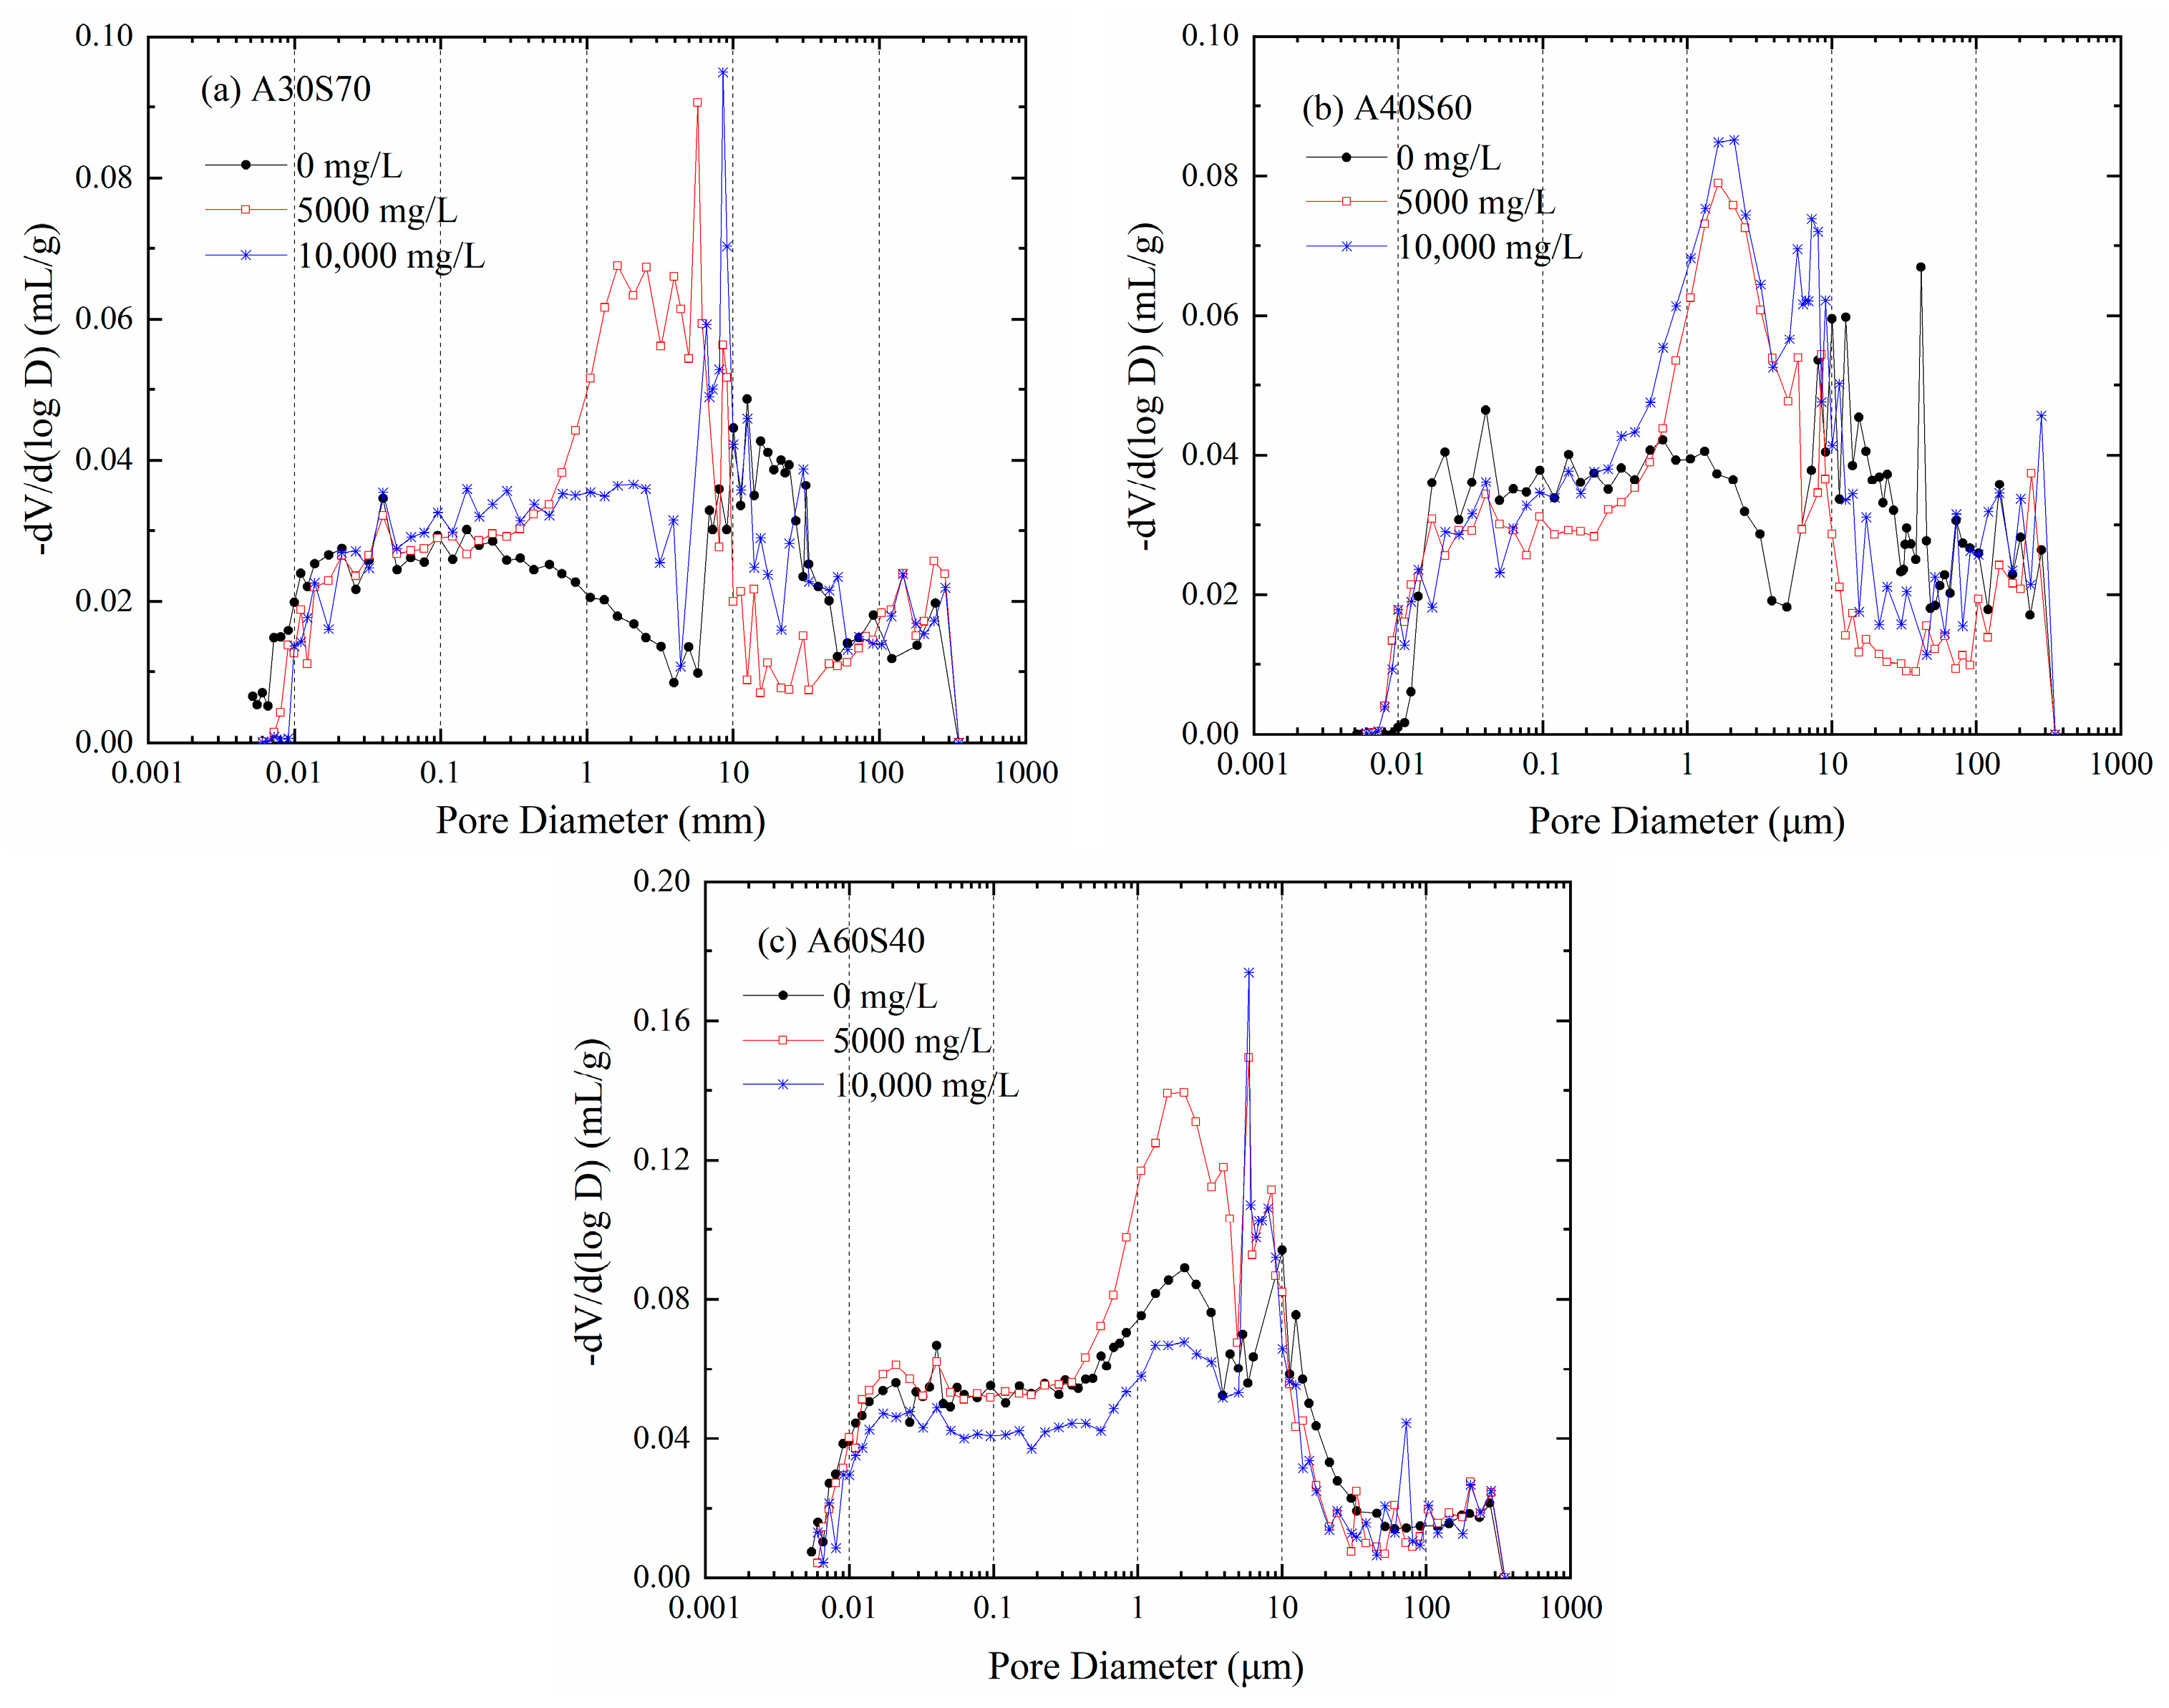
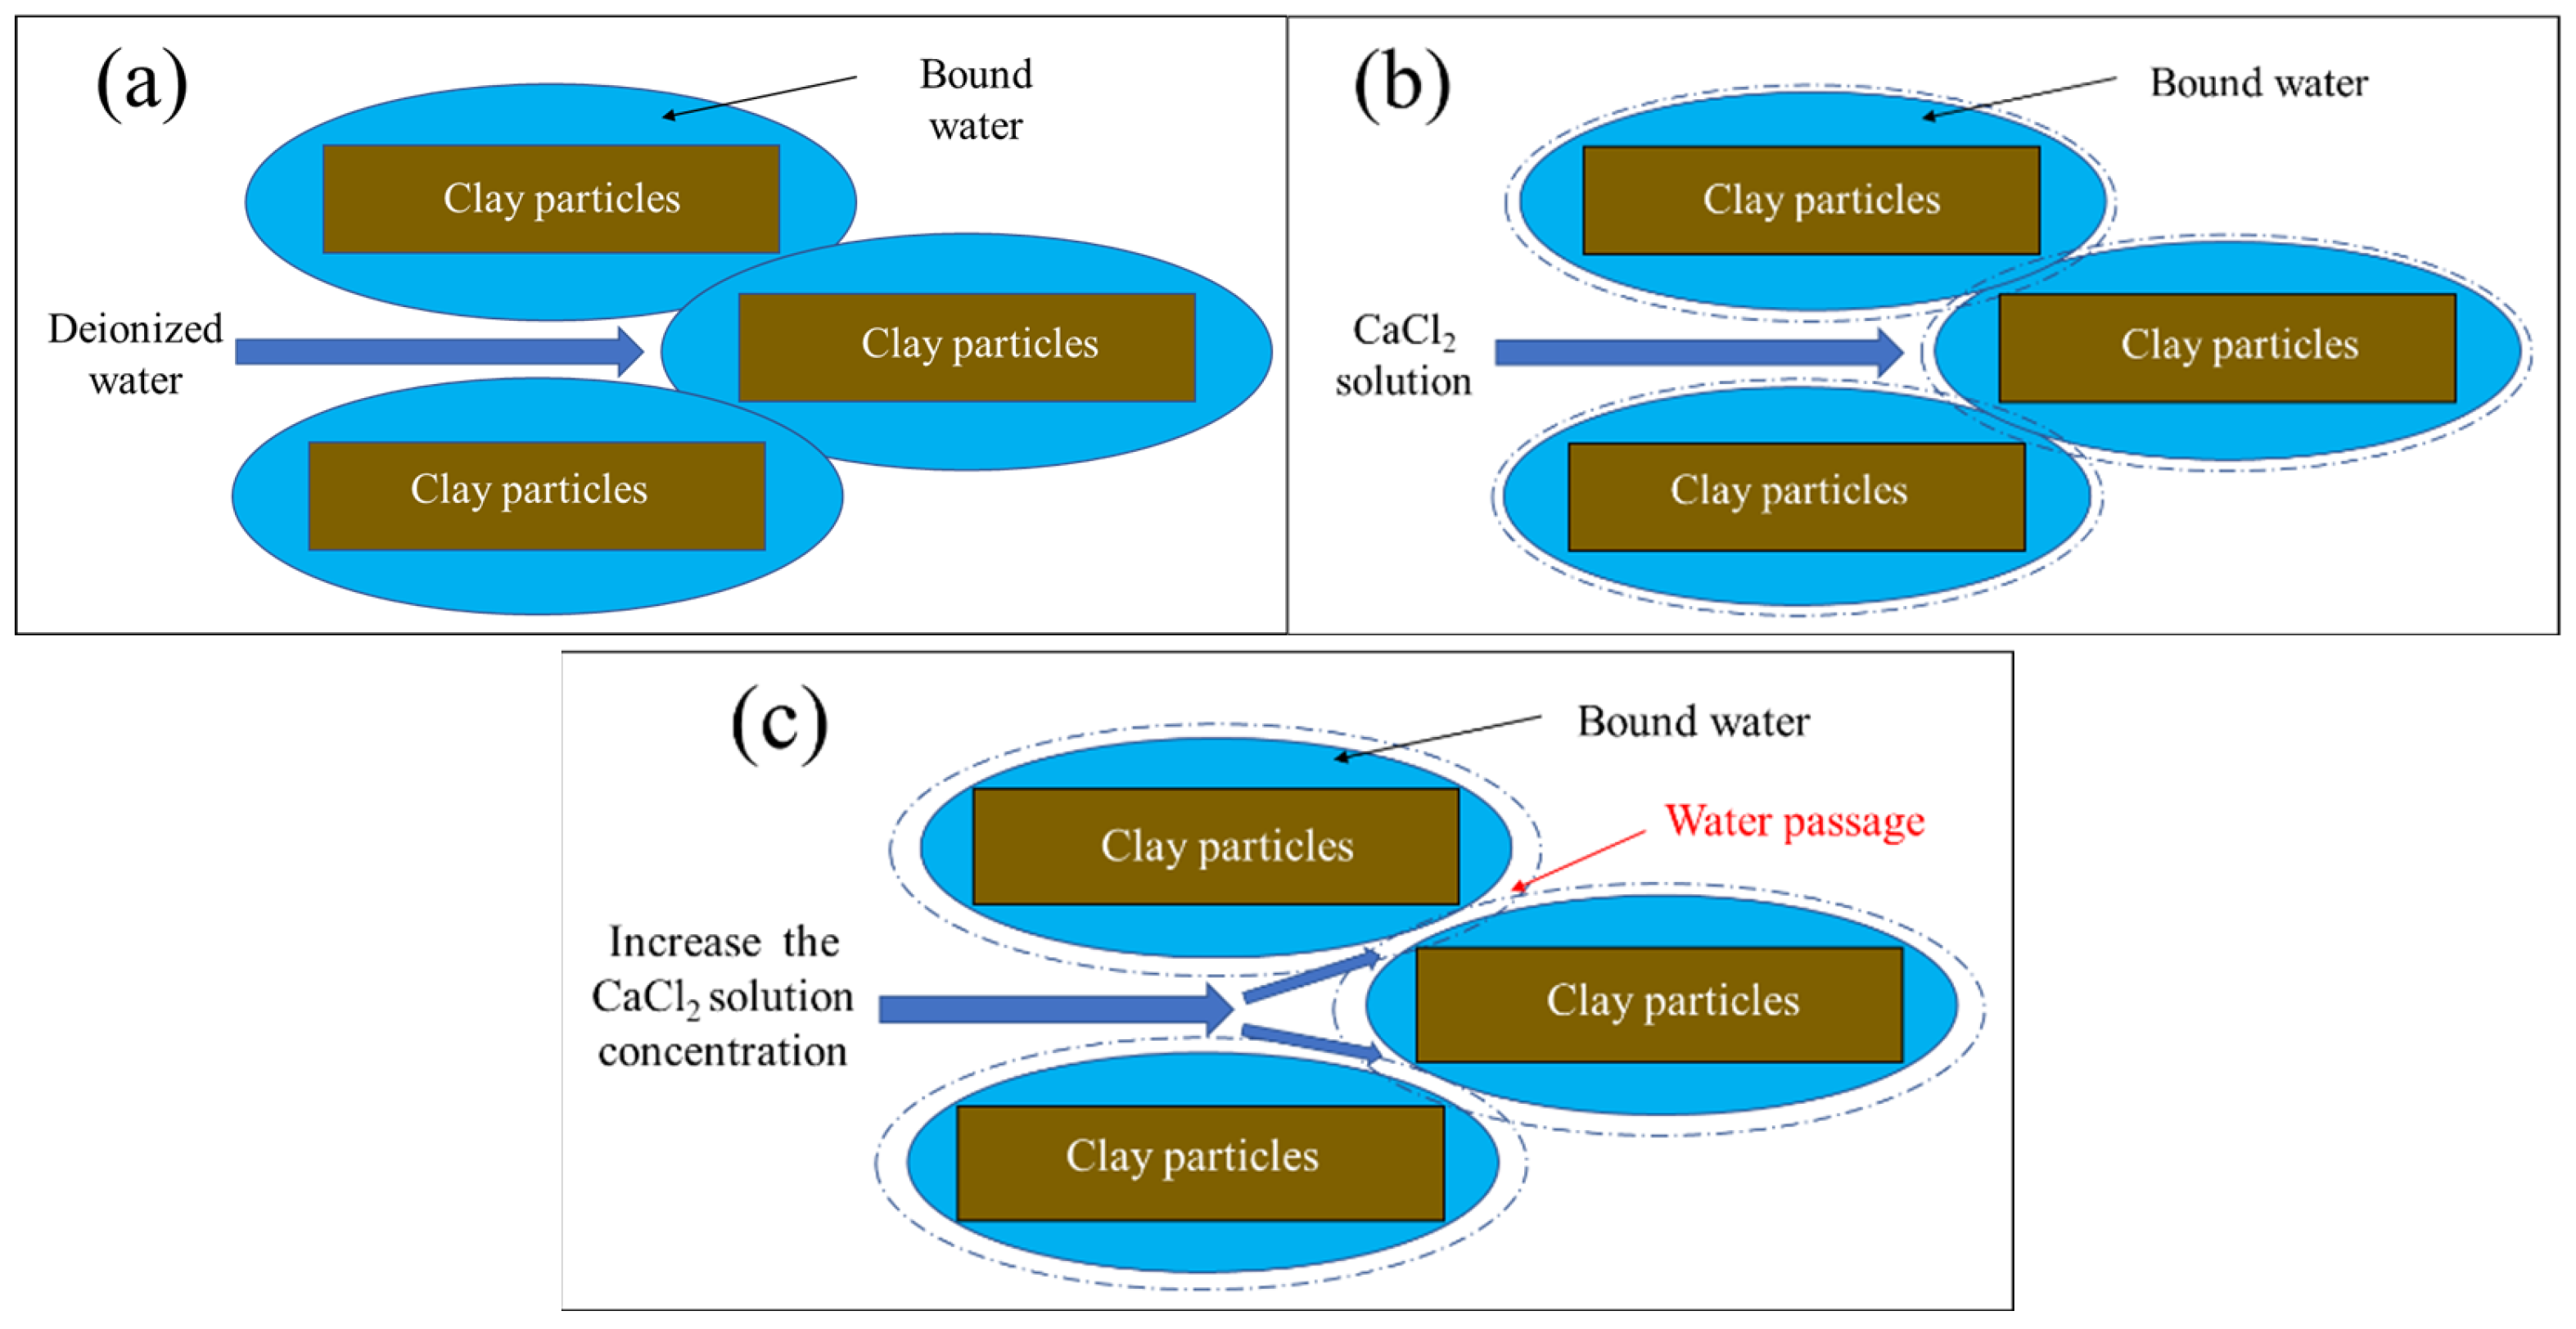
The increase in the hydraulic conductivity of the sand–attapulgite cut-off wall due to the CaCl2 permeate can be explained in terms of bound water content and pore structure. The increase in Ca2+ concentration decreased the bound water content of the wall, and the CaCl2 solution increased the proportion of macropores and mesopores and decreased the proportion of small pores in the sand–attapulgite cut-off wall.

Author Contributions

Conceptualization, W.Z. and W.R.; methodology, W.Z. and H.Y.; software, W.Z.; validation, Y.L., L.Z. and X.X.; writing—original draft preparation, W.Z. All authors have read and agreed to the published version of the manuscript.

Funding

This research was funded by the Science and Technology Project of Zhejiang Huadong Geotechnical Investigation and Design Institute Corporation Limited (No. KY2019-HDJS-10).

Institutional Review Board Statement

Not applicable.

Informed Consent Statement

Not applicable.

Data Availability Statement

Not applicable.

Conflicts of Interest

The authors declare no conflict of interest.

References

  1. Peng, L.J.; Gu, M.; Peng, Z. Study on the optimized mode of waste governance with sustainable urban development-case from China’s urban waste classified collection. Sustainability 2020, 12, 3706. [Google Scholar] [CrossRef]
  2. Solid Waste Treatment and Utilization Industry 2019 Development Report. China Environmental Protection Industry Association. China Environmental Protection Industry Development Report (2020); China Meteorological Press: Beijing, China, 2020; pp. 149–160.
  3. Xu, H.Q.; Zhu, W.; Qian, X.D.; Wang, S.W.; Fan, X.H. Studies on hydraulic conductivity and compressibility of backfills for soil-bentonite cutoff walls. Appl. Clay Sci. 2016, 132–133, 326–335. [Google Scholar] [CrossRef]
  4. Lee, T.; Benson, C.H. Flow past bench-scale vertical ground-water cutoff walls. J. Geotech. Geoenviron. 2000, 126, 511–520. [Google Scholar] [CrossRef]
  5. Xu, H.Q.; Shu, S.; Wang, S.W.; Zhou, A.Z.; Jiang, P.M.; Zhu, W.; Fan, X.H.; Chen, L. Studies on the chemical compatibility of soil-bentonite cut-off walls for landfills. J. Environ. Manag. 2019, 237, 155–162. [Google Scholar] [CrossRef] [PubMed]
  6. D’Appolonia, D.J. Soil-bentonite slurry trench cutoffs. J. Geotech. Geoenviron. 1980, 106, 399–417. [Google Scholar] [CrossRef]
  7. Evans, J.C.; Costa, M.J.; Cooley, B. The state-of-stress in soil-bentonite slurry trench cutoff walls. In Geoenvironment 2000: Characterization, Containment, Remediation, and Performance in Environmental Geotechnics; Acar, Y.N., Daniel, D.E., Eds.; American Society of Civil Engineers: Reston, VA, USA, 1995; pp. 1173–1191. [Google Scholar]
  8. Sharma, H.D.; Reddy, K.R. Geoenvironmental Engineering: Site Remediation, Waste Containment, and Emerging Waste Management Technologies; Wiley: Hoboken, NJ, USA, 2004. [Google Scholar]
  9. Yeo, S.S.; Shackelford, C.D.; Evans, J.C. Consolidation and hydraulic conductivity of nine model soil-bentonite backfills. J. Geotech. Geoenviron. 2005, 131, 1189–1198. [Google Scholar] [CrossRef]
  10. Malusis, M.A.; McKeehan, M.D. Chemical compatibility of model soil-bentonite backfill containing multiswellable bentonite. J. Geotech. Geoenviron. 2013, 139, 189–198. [Google Scholar] [CrossRef] [Green Version]
  11. Du, Y.J.; Fan, R.D.; Reddy, K.R.; Liu, S.Y.; Yang, Y.L. Impacts of presence of lead contamination in clayey soil-calcium bentonite cutoff wall backfills. Appl. Clay Sci. 2015, 108, 111–122. [Google Scholar] [CrossRef]
  12. Lo, I.M.C.; Yang, X.Y. Use of organoclay as secondary containment for gasoline storage tanks. J. Environ. Eng. 2001, 127, 154–161. [Google Scholar] [CrossRef]
  13. Mishra, A.K.; Ohtsubo, M.; Li, L.Y.; Higashi, T.; Park, J. Effect of salt of various concentrations on liquid limit, and hydraulic conductivity of different soil-bentonite mixtures. Environ. Geol. 2009, 57, 1145–1153. [Google Scholar] [CrossRef]
  14. Yong, R.N.; Ouhadi, V.R.; Goodarzi, A.R. Effect of Cu2+ ions and buffering capacity on smectite microstructure and performance. J. Geotech. Geoenviron. 2009, 135, 1981–1985. [Google Scholar] [CrossRef]
  15. Fu, X.L.; Shen, S.Q.; Reddy, K.R.; Yang, Y.L.; Du, Y.J. Hydraulic Conductivity of Sand/Biopolymer-Amended Bentonite Backfills in Vertical Cutoff Walls Permeated with Lead Solutions. J. Geotech. Geoenviron. 2021, 148, 04021186. [Google Scholar] [CrossRef]
  16. Yang, Y.L.; Reddy, K.R.; Zhan, H.B.; Fan, R.D.; Liu, S.Y.; Xue, Q.; Du, Y.J. Hydraulic conductivity of soil-bentonite backfill comprised of SHMP-amended Ca-bentonite to Cr(VI)-impacted groundwate. J. Contam. Hydrol. 2021, 242, 103856. [Google Scholar] [CrossRef]
  17. Li, Q.; Jia, Z.; Li, J.G.; Tang, H.M.; Zhan, C.; Zhao, Y.S. Cutoff Phenol Polluted Groundwater with Activated Carbon Modified Soil-Bentonite Slurry Wall. J. Jilin Univ. Earth Sci. Ed. 2023, 53, 251–260. (In Chinese) [Google Scholar] [CrossRef]
  18. Ye, H.P.; Chen, F.Z.; Sheng, Y.Q.; Sheng, G.Y.; Fu, J.M. Adsorption of phosphate from aqueous solution onto modified palygorskites. Sep. Purif. Technol. 2006, 50, 283–290. [Google Scholar] [CrossRef]
  19. Rusmin, R.; Sarkar, B.; Biswas, B.; Churchman, J.; Liu, Y.J.; Naidu, R. Structural, electrokinetic and surface properties of activated palygorskite for environmental application. Appl. Clay Sci. 2016, 134, 95–102. [Google Scholar] [CrossRef]
  20. Stern, R.T.; Shackelford, C.D. Permeation of sand-processed clay mixtures with calcium chloride solutions. J. Geotech. Geoenviron. 1998, 124, 231–241. [Google Scholar] [CrossRef]
  21. Day, S.R. The compatibility of slurry cutoff wall materials with contaminated groundwater. In Hydraulic Conductivity and Waste Contaminant Transport in Soils, ASTM STP 1142; Daniel, D.E., Trautwein, S.J., Eds.; American Society for Testing and Materials: West Conshohocken, PA, USA, 1994. [Google Scholar]
  22. Broderick, G.P.; Daniel, D.E. Stabilizing compacted clay against chemical attack. J. Geotech. Eng. ASCE 1990, 116, 1549–1567. [Google Scholar] [CrossRef]
  23. Al-Rawas, A.A.; Mohamedzein, E.A.; Al-Shabibi, A.S.; Al-Katheiri, S. Sand-attapulgite clay mixtures as a landfill liner. Geotech. Geol. Eng. 2006, 24, 1365–1383. [Google Scholar] [CrossRef]
  24. Silva, G.; Almanza, R. Use of clays as liners in solar ponds. Sol. Energy 2009, 83, 905–919. [Google Scholar] [CrossRef]
  25. Tobin, W.R.; Wild, P.R. Attapulgite: A clay liner solution? Ovil Eng. ASCE N. Y. 1986, 56, 56–58. [Google Scholar]
  26. Zhang, W.B.; Rao, W.B.; Li, L.; Brusseau, M.L.; Liu, Y. Adsorption of cadmium onto sand-attapulgite cutoff wall backfill media. Water Air Soil Pollut. 2021, 232, 47. [Google Scholar] [CrossRef]
  27. Zhang, Z.R.; Matlan, S.J.; Wang, H.; Pishro, A.A.; Zhang, L.L.; Gao, X.; Liang, Z.; Liu, X.Y.; Zhao, P.G. Geotechnical evaluation of loess modifications as the sustainable compacted soil liner material in solid waste landfill. Materials 2022, 15, 4982. [Google Scholar] [CrossRef] [PubMed]
  28. Ryan, C.R. Soil-bentonite cutoff walls. In Geotechnical Practice for Waste Disposal’87; Woods, R.D., Ed.; American Society of Civil Engineers: New York, NY, USA, 1987; pp. 182–204. [Google Scholar]
  29. Zhu, W.; Xu, H.Q.; Wang, S.W.; Fan, X.H. Hydraulic conductivity of model clay-based cut-off wall backfills. In Proceedings of the 7th International Congress on Environmental Geotechnics, Melbourne, Australia, 10–14 November 2014; pp. 1516–1523. [Google Scholar]
  30. Zhu, W.; Xu, H.Q.; Wang, S.W.; Fan, X.H. Influence of CaCl2 solution on the permeability of different clay-based cutoff walls. Rock Soil Mech. 2016, 37, 1224–1230. (In Chinese) [Google Scholar] [CrossRef]
  31. Zhang, W.B.; Rao, W.B.; Li, L.; Liu, Y.; Wang, S.; Jin, K.; Zheng, F.W. Compressibility and hydraulic conductivity of sand-attapulgite cut-off wall backfills. J. Zhejiang Univ.-Sci. A 2019, 20, 218–228. [Google Scholar] [CrossRef]
  32. Shackelford, C.D.; Sample-Lord, K.M. Hydraulic conductivity and compatibility of bentonite for hydraulic containment barriers. Soil Behav. Fundam. Innov. Geotech. Eng. Honor. Roy E. Olson 2014, 370–387. [Google Scholar] [CrossRef]
  33. Kjeldsen, P.; Barlaz, M.A.; Rooker, A.P.; Baun, A.; Ledin, A.; Christensen, T.H. Present and long-term composition of MSW landfill leachate: A review. Crit. Rev. Environ. Control. 2002, 32, 297–336. [Google Scholar] [CrossRef]
  34. ASTM D4318-10; ASTM (American Society for Testing and Materials) Standard Test Methods for Liquid Limit, Plastic Limit, and Plasticity Index of Soils. ASTM International: Philadelphia, PA, USA, 2010.
  35. Jo, H.Y.; Katsumi, T.; Benson, C.H.; Edil, T.B. Hydraulic conductivity and swelling of nonprehydrated GCLs permeated with single-species salt solutions. J. Geotech. Geoenviron. 2001, 127, 557–567. [Google Scholar] [CrossRef]
  36. Katsumi, T.; Kamon, M.; Inui, T.; Araki, S. Hydraulic barrier performance of SBM cut-off wall constructed by the trench cutting and re-mixing deep wall method. GeoCongress 2008, 628–635. [Google Scholar] [CrossRef]
  37. Bohnhoff, G.L.; Shackelford, C.D. Hydraulic conductivity of polymerized bentonite-amended backfills. J. Geotech. Geoenviron. 2014, 140, 04013028. [Google Scholar] [CrossRef]
  38. Shear, D.L.; Olsen, H.W.; Nelson, K.R. Effects of Desiccation on the Hydraulic Conductivity Versus Void Ratio Relationship for a Natural Clay; National Academy Press: Washington, DC, USA, 1993; pp. 1365–1370. [Google Scholar]
  39. Zhang, P.; Fang, Y.G.; Yan, X.Q.; He, Z.W. Study of different dry methods for drying remolded bentonite sample with mercury intrusion test. Rock Soil Mech. 2011, 32, 388–391. (In Chinese) [Google Scholar] [CrossRef]
  40. Qu, Z.K.; Wang, H.J.; Xun, W.F.; Liu, F.S.; Bian, H.B. Study on permeability characteristics of modified soil based on mercury intrusion. S-N Water Transf. Water Sci. Technol. 2017, 15, 172–178. (In Chinese) [Google Scholar] [CrossRef]
  41. Yanful, E.K.; Shikatani, K.S.; Quirt, D.H. Hydraulic conductivity of natural soils permeated with acid mine drainage. Can. Geotech. J. 1995, 32, 624–646. [Google Scholar] [CrossRef]
  42. Gouy, G. Constitution of the electric charge at the surface of an electrolyte. J. Phys. Radium 1910, 9, 457–467. [Google Scholar]
  43. Chapman, D.L. A contribution to the theory of electrocapillanty. Philos. Mag. 1913, 25, 475–481. [Google Scholar] [CrossRef] [Green Version]
  44. Mitchell, J.K.; Soga, K. Fundamentals of Soil Behavior, 3rd ed.; John Wiley and Sons: New York, NY, USA, 2005. [Google Scholar]
Figure 1. XRD pattern of attapulgite mineral composition.
Water 15 02940 g001
Figure 2. Particle size distribution curve of Fujian standard sand and attapulgite.
Water 15 02940 g002
Figure 3. (a) Himac high-speed centrifuge and (b) matching rotor and rotating cup.
Water 15 02940 g003
Figure 4. Schematic diagram of Himac high-speed centrifuge rotating cup.
Water 15 02940 g004
Figure 5. Hydraulic conductivity of sand–attapulgite backfill infiltration with CaCl2 solution [35,36,37].
Water 15 02940 g005
Figure 6. Hydraulic conductivity of sand–attapulgite backfill under different COD concentrations [5].
Water 15 02940 g006
Figure 7. Pore distribution curve of sand–attapulgite backfill with attapulgite contents of (a) 30%, (b) 40%, and (c) 60% after infiltration with CaCl2 solution.
Water 15 02940 g007
Figure 8. Bound water content in the cut-off wall after infiltration with CaCl2 solution.
Water 15 02940 g008
Figure 9. Schematic diagram of the influence of bound water on the hydraulic conductivity of the cut-off wall. (a) The Ca2+ concentration is 0 mg/L in the CaCl2 solution, (b) the Ca2+ concentration is 0 mg/L~5000 mg/L in the CaCl2 solution, (c) the Ca2+ concentration is >5000 mg/L in the CaCl2 solution.
Water 15 02940 g009
Table 1. Pore size distribution of sand–attapulgite cut-off wall after infiltration with CaCl2 solution.
Ca2+ Concentration (mg/L)Pore Size Distribution (%)
A30S70A40S60A60S40
0500010,0000500010,0000500010,000
Macropores
(d > 30 µm)
16.4112.2116.0318.9613.0914.967.756.489.44
Mesopores
(5 µm < d ≤ 30 µm)
22.5614.2920.0217.6510.7319.4918.1015.1422.66
Small pores
(25 µm ≤ d ≤ 5 µm)
23.2746.1432.7631.7148.3941.8138.7147.8734.92
Micropores
(0.05 µm ≤ d ≤ 0.25 µm)
18.5215.0318.2518.1614.6413.5217.2814.6915.64
Extremely microporous
(d < 0.05 µm)
19.2412.3212.9413.5213.1410.2118.1615.8217.33
Small pores + micropores
+ extremely microporous
(d ≤ 5 µm)
61.0373.4963.9563.3976.1765.5474.1578.3867.89
Disclaimer/Publisher’s Note: The statements, opinions and data contained in all publications are solely those of the individual author(s) and contributor(s) and not of MDPI and/or the editor(s). MDPI and/or the editor(s) disclaim responsibility for any injury to people or property resulting from any ideas, methods, instructions or products referred to in the content.

