Abstract
Individuals and communities use and value water in multiple and complex ways. In Sub-Saharan Africa (SSA), the pluralistic nature of water values is poorly documented, and the existing and potential value trade-offs are unidentified. This study was undertaken in the Central Rift Valley (CRV) of Ethiopia to understand and map water values, priorities, risks, and trade-offs in a multi-stakeholder engagement process to provide the basis for more transparent and accountable decision-making. Integrated assessment methods, combining bio-physical and social methods, were applied. The results show 24 community-perceived and articulated water values that are diverse but interconnected, including values of water, landscapes, the river system, and downstream water bodies. Connections between people and landscape structures are articulated. In terms of priority water values, the overall results reflect the primary but basic need for water for food security and domestic uses. The results further illustrate the pluralistic nature of water values and the dichotomy of preferences among people of different backgrounds. The scenario-based Environmental Flow (EF) assessment exercise integrated into community value preferences and the event calendar that was used show that the river systems in CRV (Ketar, Kulumsa, and Gusha-Temela) have different ecological and socio-cultural flow requirements and that there are marked water value trade-offs. The conclusions of the study suggest that overlapping governance structures are affecting people’s perceptions of water and the way they articulate water values. Policy directions and decision-making need to recognize and acknowledge the multiple water values and competing uses of water in the CRV as a starting point to reconcile trade-offs that will then improve water security. Findings suggest that EF estimation and decision support tools can be customized to local ecological requirements through engaging local stakeholders in the assessment process.
1. Introduction
Ethiopia is often described as the “water tower of Africa”, reflecting its large water resources endowment: 122 billion cubic meters (BCM) of river water, 70 BCM of lake water, and 36 BCM of groundwater across 12 river basins [1]. However, the growing economy and rapidly growing population of over 100 million people are exerting unprecedented pressure on water security through increased and competitive water consumption and encroachment into ecologically sensitive ecosystems (e.g., land use/land cover change).
The Rift Valley Basin (RVB) of Ethiopia is an important eco-region, hosting National Parks and significant, often endemic, flora and fauna. It includes approximately four BCM of annual average flow into its lake system and is commonly divided into three interdependent sub-basins: (i) the Central Rift Valley (CRV) (also known as Ziway-Shala) sub-basin (14,000 km2); (ii) the Hawasa sub-basin (1400 km2); (iii) and the Abaya-Chamo-Chew Bahir sub-basin (37,000 km2).
The CRV, on which this study focuses, is noted as being ecologically the most sensitive and overused system and is primarily under pressure from anthropogenic impacts [2,3]. Major freshwater flows to the CRV basin from rivers Meki (180 Mm3 yr−1) and Ketar (396 Mm3 yr−1). These two major rivers originate from the elevated east (Mount Chilalao, Galama, and Kubas) and west (Mount Gurage) sides of the CRV and flow in a southerly direction into the terminal lakes: Ziway, Shala, Abjata, and Langano [4,5]. The CRV basin is a hydrologically closed system (endorheic), with no surface outflow from lakes. This means that any alteration of river system structure in the major water suppliers (Ketar, Meki, and other small streams) would affect the CRV water system and thus could lead to the loss of the multiple water values held by communities (more than 1.5 million [6]) that rely on the system.
Agriculture, both smallholder and commercial, in the RVB is intensifying thanks to the RVB’s proximity to infrastructure, settlement centers, and markets—including international air freight—and easy access to water resources. Supported by the government, donors, and the private sector, agro-processing industries are developing rapidly, including Bulbula agro-industrial park, the beef processing industry, wineries, textile industries (in Hawassa), and a booming floriculture sector.
While these investment efforts are opportunities to improve overall economic growth in the country and support livelihood transformation for local populations, they also pose daunting challenges to multiple water values and sustainable water resource management. Understanding the pluralistic and diverse nature of water values is understood to be a core foundation for sustainable water management [7].
Valuing water has been identified as gauging the importance, worth, desirability, and trade-off strength between different water values [7]. Values are identified through biophysical, economic, and sociocultural indicators [8]. Water valuation is commonly carried out through economic, monetary, and single-unit-focused methods [9,10,11,12,13]. This valuation overlooks other important sociocultural values that have been described as intrinsic, instrumental, and relational and cannot be expressed in monetary terms [14,15]. Sociocultural water values include intangible values that can be understood by examining spiritual, emotional, recreational, intrinsic, and aesthetic values expressed by both individuals and communities. Such values develop through the social experience, satisfaction, pursuit, and benefits of society’s spiritual and moral characteristics [11,16,17]. Such water values reflect the relationship between places and people; they reflect individual and community behaviors and may be related to time [18]. Hence, understanding water values should be carried out on a multidimensional basis, including ecological, economic, and sociocultural assessments, using multiple disciplinary approaches, methods, and scales [17,19]. The multidimensionality of water values requires a transformation from a single valuation approach to the emergence of an integrated and pluralistic valuation approach [19,20]. This study considers economic, cultural, and environmental indicators to develop multi-dimensional valuation using engineering and social science methods [20].
In Sub-Saharan Africa, identifying water values has been a challenging task for many researchers and development experts, due at least in part to limited baseline historical data [21]. Researchers studying water values have focused mainly on using monetary methods such as the actual price paid or the willingness to pay from the consumer’s point of view by adopting contingent valuation methods [15,22]. Moreover, many studies valuing water in Sub-Saharan Africa have mostly focused on domestic water use rather than a more holistic approach to thinking about water [21]. Ethiopian water policy tends to focus more on the economic value of water, leaving a microscopic space for social and environmental values [1] and dissonance in water management, especially in rural areas [23].
This study is based around the hypothesis that understanding and mapping the different values of water, as well as identifying the actors who define them in a multi-stakeholder engagement process will provide the basis for more transparent and accountable decision-making that acknowledges competing uses of water and aims to reconcile trade-offs between different water users and different uses. Against this background, the main objectives of this study were: (i) to document the diversity and priority of water values and advancing threats to them; (ii) to investigate major value conflicts.
2. Materials and Methods
2.1. Functions and Structure of the Central Rift Valley and Ketar Water Systems
2.1.1. The Central Rift Valley
The Central Rift Valley (CRV) is found in the central lowland part of the country, located in two regional states: Oromia and the Southern Nations, Nationalities, and Peoples’ Region [SNNPR [24]]. The elevation of the basin ranges from 1550 m.a.s.l. (meters above sea level) to more than 4200 m.a.s.l. [25,26]. The CRV is a center of biodiversity, acting as a migration corridor for critical bird species [27,28].
The mean annual rainfall of the basin varies between 600 mm near the lakes (Ziway, Abjata, and Shala) and 1200 mm in the highlands. Overall, the total precipitation is estimated at 12.95 BCM of surface water resources, and the average minimum temperature is 10.5 °C, while the average maximum temperature is 24.3 °C [29]. In addition to the lakes, the river systems that feed fresh water to the lakes make up an important structure of the CRV water system.
There are several perennial rivers, including the Meki (180 Mm3/year), Ketar (396 Mm3/year), Bulbula (200 Mm3/year), and Horakelo (50 Mm3/year). Abijata is connected to both Ziway and Langano through the Bulbula and Horakelo rivers, respectively, and it is more sensitive to the reduced flows of the Bulbula since Bulubul is the main feeder compared to those of the Horakelo river [29].
Another key system structure is land use. Among the seven major identified Land Use Land Cover (LULC) classes [30], farmlands, settlements, and bare lands showed positive changes (increments), while forestlands, grasslands, shrublands, and waterbodies showed negative changes (decreases) over the last 47 years. According to Mekuria et al. [30], the expansion of farmlands, for example, has occurred at the expense of grasslands, forestlands, and shrublands. Agriculture-led livelihoods dominate in the CRV. Agricultural practice in the CRV is heavily rain-fed, such as the rest of the country. Given this, agriculture accounts for more than 90% of water consumption, and it is important to pay attention to how transformations now—and in the future—might take place in the smallholder system and how this affects multiple water values.
While all the sub-basins are important in their context, the Ministry of Water and Energy and the River Basin Development offices put major emphasis on the CRV. This is mainly related to the economic importance of this basin. Given the number of publications indicating the emerging environmental threat, the CRV basin has faced multiple challenges, including water level reduction and land degradation [29,31]. According to stakeholder consultation participants, during the last three to four decades, many smallholder farmers, as well as large agribusiness, have been increasingly abstracting a considerable amount of water for irrigation from Lake Ziway and its feeder rivers, Meki and Katar. The water abstraction for domestic, livestock, irrigation from Ziway, and Soda ash production from Abjata increased from 72,26 MCM to 102.3 in 2018 [31]. This is causing the water-level reduction of Lake Abijata, which connects with Lake Ziway through the Bulbula River (e.g., Goshime et al. [31]).
Reflecting multiple values inherent in this resource base, the lakes in the rift valley are used for multiple purposes, including irrigation, fishing, domestic water supply, transportation, recreation [32], and religious and cultural festivals. A multitude of users and a lack of proper coordination systems can introduce environmental externalities, with respective regional states (Southern National Nationality Region and Oromiya) striving to maximize economic benefit at the expense of environmental and socio-cultural water values. In the Focused Group Discussion (FGD), these were major points of debate.
The interconnectivity of the water system structure in CRV suggests the need for holistic recognition and stewardship of multiple values of water. An example in this regard is the over-extraction of water from Lake Ziway, which impacts the level of salinity of Lake Abijata [31,33], arguably leading to biodiversity degradation and therefore challenging the multiple water values inherent in the system. In particular, the two neighboring lakes, Abijata and Shalla, in CRV are of special importance to wildlife by providing feeding and breeding grounds for a rich bird fauna of over 360 species, including both resident and migratory birds. The two lakes have been enclosed as part of a national park since the 1970s [26,34].
Although comprehensive and reliable data on water use is limited, Goshime et al. [31] reported that the actual storage and outflow of Lake Ziway are significantly impacted by the existing water withdrawal. Implementation of future development plans (2029–2038) will result in an annual water withdrawal of about 95 mm3, and the consequence is a drop in lake level by the magnitude of 0.94 m, or 38 km2 reductions in the lake surface area, or a loss of 26.5% of its actual storage volume compared to the observed storage between 1986 and 2000. This will impact lake Abjata and the Bulbula rivers [33].
Elias et al. [33] work on CRV substantiates the suggestion of Goshime et al. [31], and accordingly, lakes in CRV are experiencing a decreasing trend. In this regard, the authors demonstrated the case of Lake Abjiata, which is shrinking at an annual rate of 12.07%. This situation can be accounted for through an examination of investment policies. Water extraction from the river Bulbula, which increased from 11.7 mm3 to 13.01 from 2007 to 2018 [31], which connects Abijata and Ziway, for irrigation and factories has caused the river to dry up, contributing to the shrinkage of Lake Abjiata. Now the question is how this affects water ecosystem services and associated values. It is important to understand which and whose water values are most affected and the policy implications.
2.1.2. Ketar River Water System
Ketar basin is a sub-system of the CRV, as indicated in Figure 1, with a drainage area of 3360 km2 and a 103.1 km long river course. It arises from the slopes of Mount Kaka and Mount Badda in the Arsi Zone. The gradient of the river is generally steep, and the Ketar river flows through rugged terrain with steep slopes and high sediment movement, which is a major occurrence. The Ketar river system supports more than 675,000 households’ livelihoods that mainly rely on substance farming and serves 1.6 million livestock.
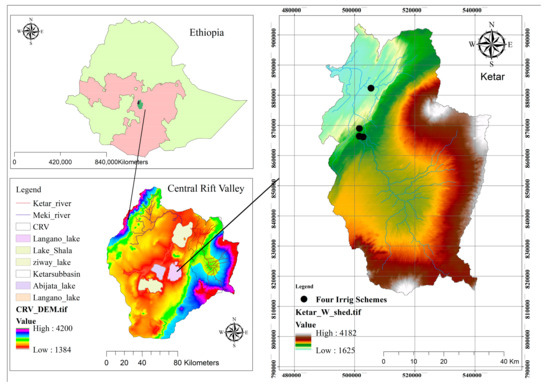
Figure 1.
Location of the study areas (Central rift valley and Ketra River water system).
According to the Ethiopian Central Statistics Agency (CSA), the Ketar sub-basin Woreda (Woreda and kebele are the lowest and second lowest administrative units in Ethiopia, respectively) 2022 projected population data are 836,544 of which 45.4% and 54.6% are male and female respectively [6]. The religious composition of the Woreda population is 47.4% Christian and 52.1% Muslim [35]. Ketar is characterized by an altitude that ranges between 1667–4188 m.a.s.l. Based on the agroecological classification by Hurni [36], the Ketar river system altitude range is used as a proxy indicator to define agroecology, namely Wurch, Dega (Highland), and Woyna-Dega (Midland) (Table 1). The largest area is covered by Woyna-Dega, followed by Dega and Wurch (Table 1).

Table 1.
Agroecological classification of the Ketar sub-basin based on Hurni’s [36] agroecology classes.
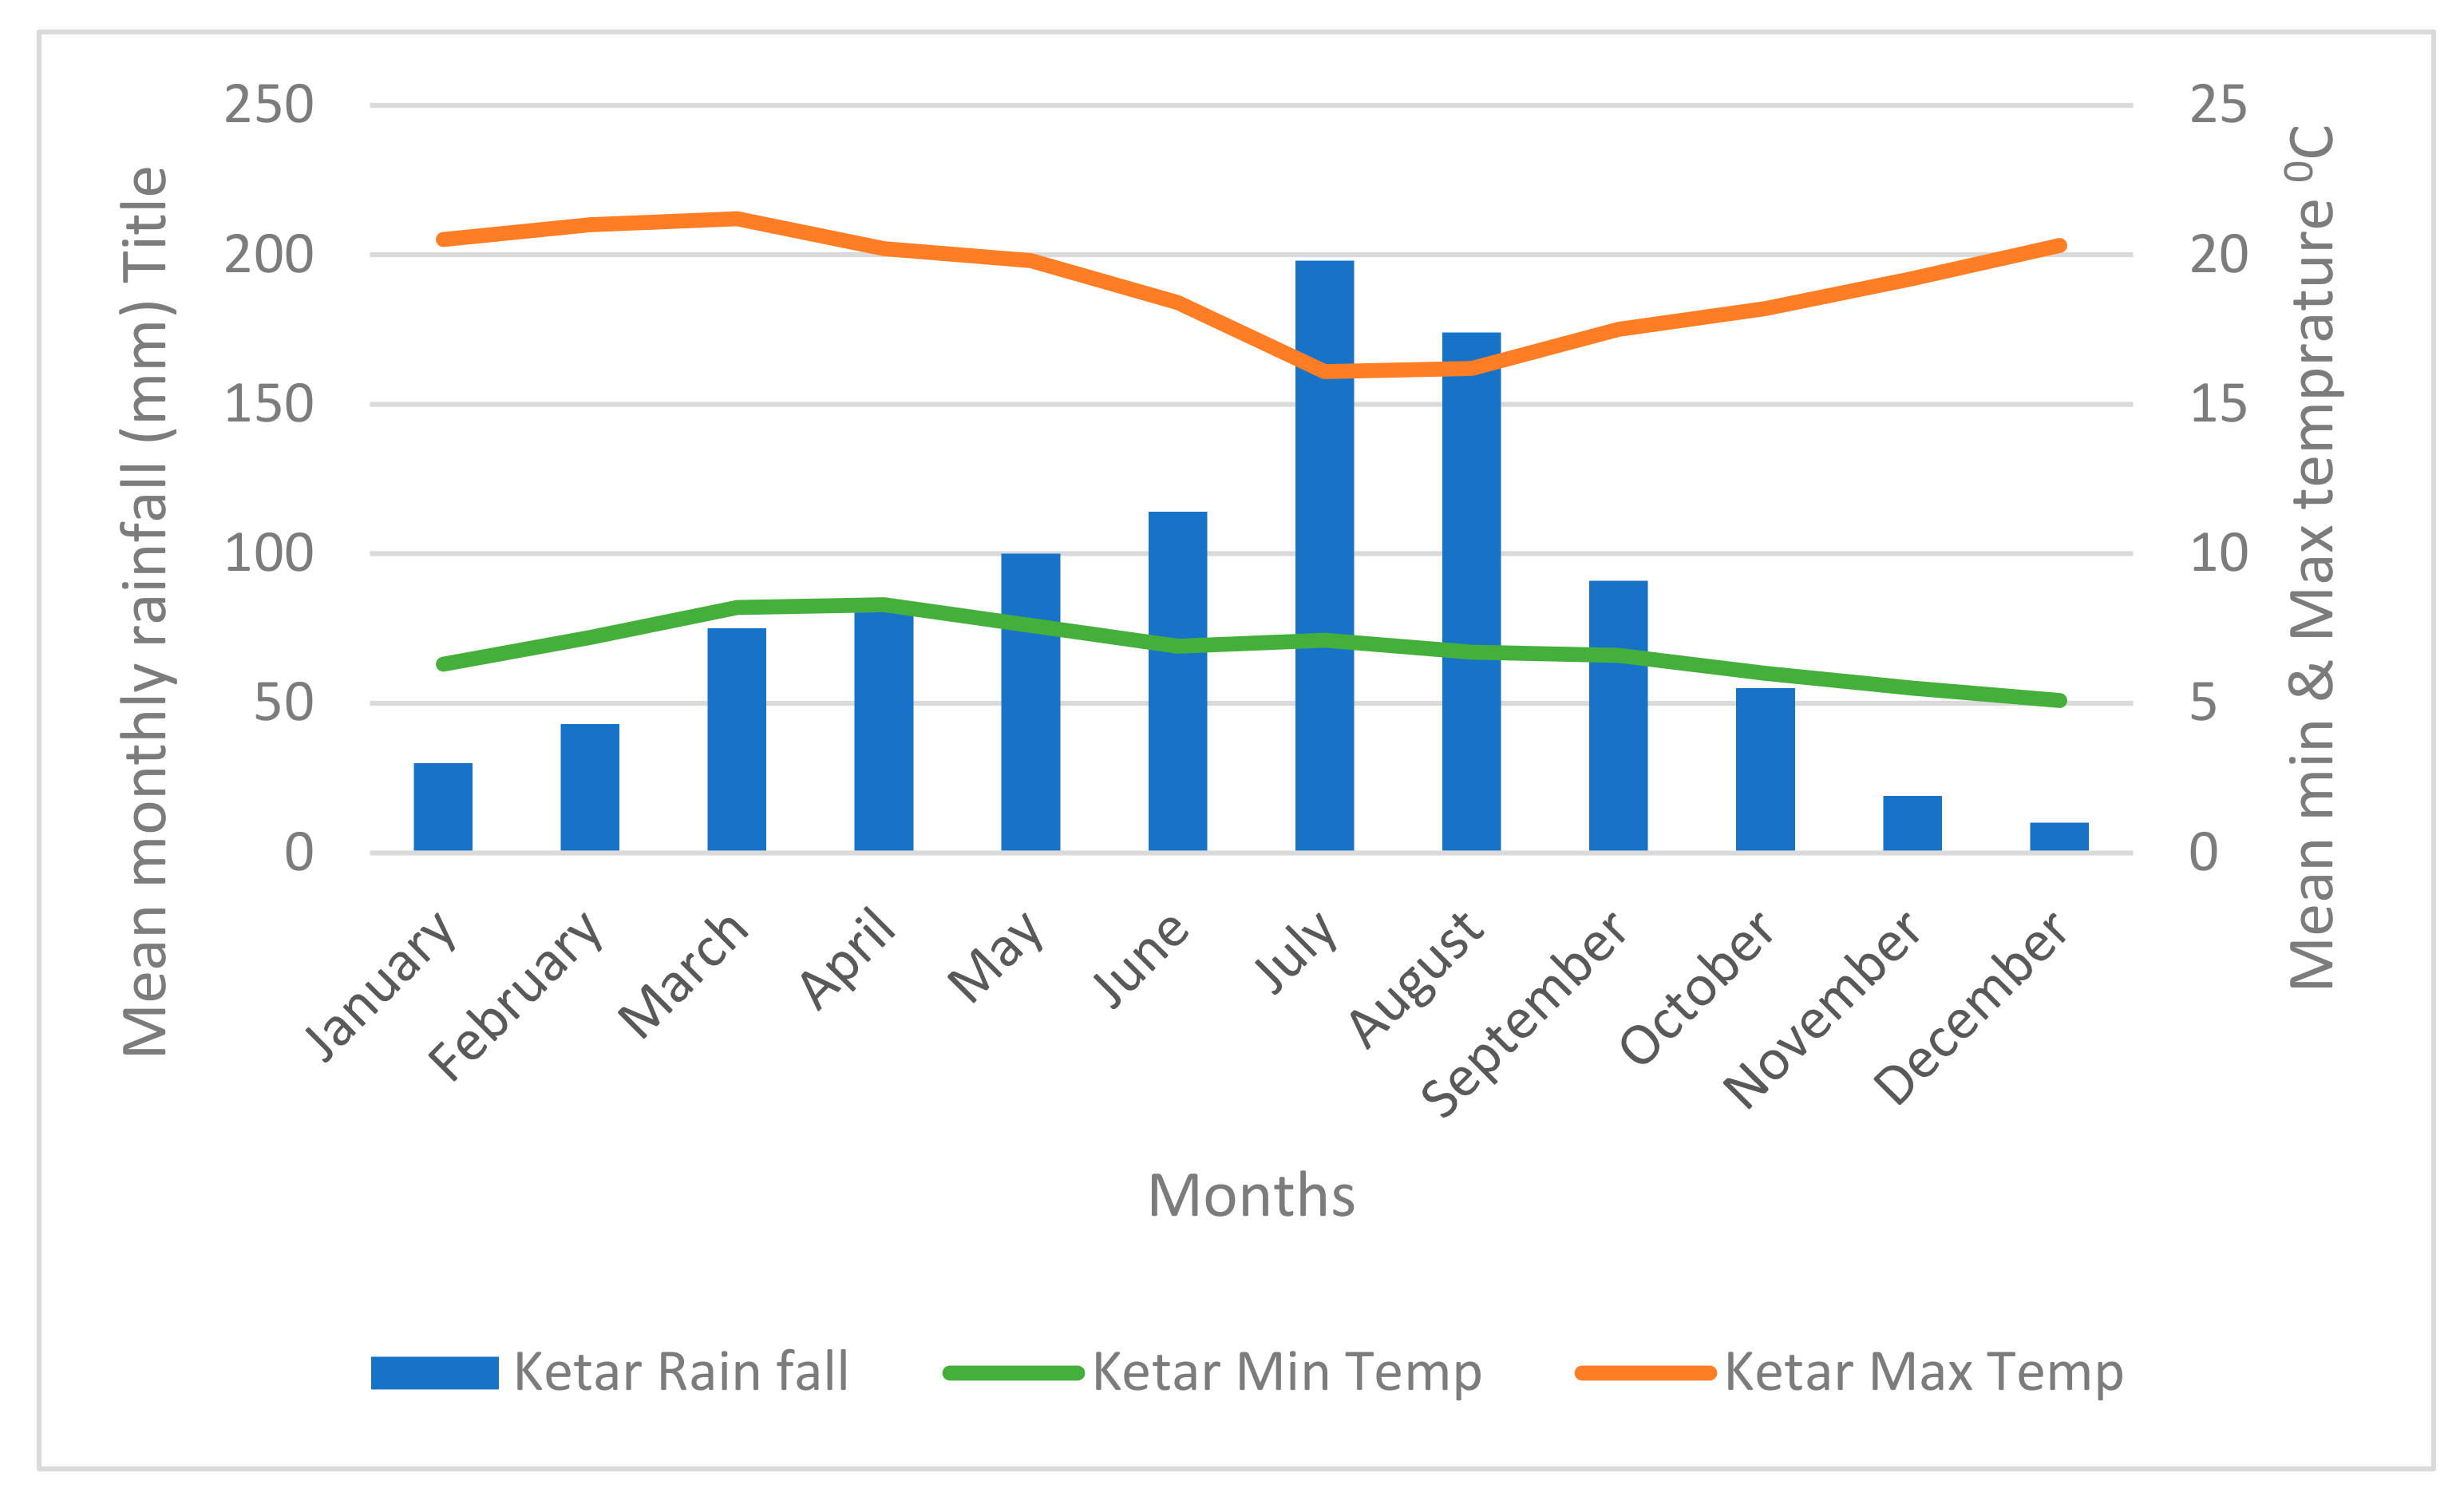
The overall mean of Ketar is indicated in Figure 2. The climatic conditions characterizing the rift floor, the escarpment, and the highlands differ greatly. The mean annual rainfall over the entire basin is around 900 mm. There are high spatial variations in Ketar, with 700 mm/year and as high as 1200 mm/year in the rift floor and highlands, respectively.
There is also temporal variability in total rainfall, with about 59% occurring during the rainy season (June–September), the remaining 28%, and 13% during the months of Match–May and October–February respectively [37]. The mean annual temperature is about 15 °C in the highlands and around 20 °C in the rift, and actual Evapotranspiration (ET) varies from around 900 mm/year in the rift to 650 mm/year in the highlands. The climate is humid to sub-humid in the highlands and semi-arid on the rift floor. The hydrology of the region is characterized by seasonal variations [38]. Since precipitation is the only input of water that is available for ET, surface runoff, recharge to groundwater, and interflow, it determines stream flow that mostly feeds the lakes (Figure 2).

Figure 2.
Climatic pattern of the Ketar water system (extracted from Geleta et al. [38]).
Figure 2.
Climatic pattern of the Ketar water system (extracted from Geleta et al. [38]).
In the Ketar river, land cover is dominated by cultivated land (64%) and forest (20%). The remaining 16% of land use land cover is shared among grassland, shrubland, and bare land, and this influences its climate, hydrological variables, and paedogenic processes. Erosion and land degradation are one of the major sources of pollution in the Ketar River and threaten access to water [30].
Tufa et al. [39] evaluated the SWAT model response to the land-use-land-cover change (LULC) in Ketar and illustrated that the mean wet monthly flow for 2010 land cover increased by 3.8% compared to 1986 land cover, when there was more forest and less cultivated land. On the other hand, the average monthly flow in the dry season decreased by 12.3% in 2010 compared to 1986. The authors concluded that due to increasing population, there is a high probability that the existing marginal lands will be converted to agricultural lands, and this affects the health of the hydrological process and water ecosystem service values within the watershed and in downstream lake areas (e.g., Mekuria et al. [30]).
The Ketar river regulates the lake chemistry and water quantity, thus the habitat quality of the Ziway-Abjata complex [33]. Ketar contributes 57% of the freshwater flowing into Lake Ziway and overflowing from Lake Ziway through the Bulbula river to Abjata lake. It has a major role in sustaining Lake Abijata and maintaining its water quality. Currently, decreasing base flow [39] and increasing use of water for irrigation in the upstream area of Ketar [40] are interrupting this natural connectivity and impacting Lake Abjata and Ziway’s [33] economic, socio-cultural, and environmental water values. As it stands now, evidence on water value perception, plurality, priorities, and risks across social and geographic strata is scarce. Information as to which values are most affected, where, why, and by whom, is generally limited. Additionally, an informed policy decision to steward water values requires systematically organized information on water value conflicts and complementarities between values [41].
2.2. Water Governance and Power Relationships in the Central Rift Valley and Ketar River Systems
According to Rogers and Hall [42], “water system governance” refers to the norms, institutions, and processes that figure out how power and responsibilities over allocation and access to natural resources in the water system are exercised and Vialatte et al. [43] suggested that water governance is how decisions are taken and how all citizens participate in and benefit from the management of water and associated natural resources. The effectiveness and equity of governance processes critically determine the strength of the bond between socio-cultural and economic water uses.
To materialize the general development goal of Ethiopia’s (ten-year development plan), the goals of national-level organizations’ powers and duties were defined and established [44,45]. Accordingly, the Ministry of Water and Energy (MoWE), the Ministry of Irrigation and Lowland (MoIL), the Ministry of Agriculture, and the Ethiopian Environmental Protection Authority (EPA) are key institutions in relation to water-resource governance.
According to the Ethiopian Council of Ministers (ECoM) [45], the MoWE is mandated, among others, with river basin development, sustainable water resource management, and access to safe drinking water and sanitation. The MoWE is responsible for creating the framework, strategy, and regulations for the nation’s water laws, along with mobilizing capital for large-scale water resource development initiatives. Besides, enforcement of policies and regulations is the responsibility of the MoWE and Basin Development Authority at the basin level (one of the MoWE’s departments). MoWE is an important stakeholder with a keen interest in and power over water resource development. Instrumental water value is the focus of MoWE’s water policy goals. The water policy, legal structures, and regulations do not give enough consideration to multiple water values, and they emphasize domestic water uses, water for livestock, and water for agriculture [1]. A new water resource policy, which is under formulation, considers multiple water values and is submitted to the councils of the ministers of the Federal Democratic Republic of Ethiopia for approval.
The MoIL is mandated for quality and sustainable irrigation infrastructure development [45]. The MoIL is a recently founded ministry (Proclamation No. 1263/2021), and it was established to bridge the gap to meet the required agricultural productivity and is responsible for the nation’s large (>3000 ha) and medium-scale (2000–3000 ha) irrigation development [45]. Similar to MoWE, MoIL has influence and a stake in the development of irrigation systems, while major gaps exist in managing water use conflict and value trade-offs as a result of the expansion of irrigation. It has high-interest and high-power for economic water use.
In addition to the MoIL, the MoA is another Ministry in the Federal Democratic Republic of Ethiopia that is in charge of small-scale irrigation (<2000 ha) development. MoA is mandated to contribute beyond food and nutrition security to the economic development of the country by making the agricultural sector more productive and competitive in the coming ten years [46]. Additionally, the MoA is accountable for fisheries. MoA has implemented various agricultural programs such as the Sustainable Development and Poverty Reduction Program, Participatory and Accelerated Sustainable Development to Eradicate Poverty, and successive Growth and Transformation Plans I and II to raise productivity in agriculture between 1991 and 2016. All these policy interventions have been implemented to increase agricultural productivity and production, which, in turn, reduces poverty and food insecurity. This puts MoA among the high-interest and high-power institutes for the economic use of water.
The Federal Democratic Republic of Ethiopian council of Ministers issued proclamation No. 1263/2021, which gives power to the Ethiopian Environmental Protection Agency (EPA) to develop environmental policies, strategies, regulations, and standards. In addition, EPA is given a mandate for environmental clearance for development activities and audits the environmental assessment results management plan for mitigating negative impacts [45]. One of the major policy goals of the EPA is to promote sustainable social and economic development through the sound management and use of natural, man-made, cultural, and environmental resources. Under its water sector environmental policy, among others, the EPA stipulates that it recognizes that natural ecosystems, particularly wetlands and upstream forests, are fundamental in regulating water quality and quantity. Water-resource developments in the country should pass through an environmental impact assessment and need to acquire environmental clearance [47]. In fact, this is where the rights of different water users could be ensured and the pluralistic nature of water values maintained. However, the Ethiopian Environmental Protection Authority (EEPA) lacks the real power to monitor and audit this (e.g., Hailu et al. [48]).
Other national-level entities, such as the Ethiopian Electric and Power Authority and the Ministry of Tourism, have interests in the governance of water. The regional level water, agricultural, and irrigation offices and environmental protection agencies are governance structures on the second layer of the water governance hierarchy in Ethiopia. The Woreda and Kebele structures add grass-roots-level water resource governance. There are community-level organizations such as these dealing with watershed management, irrigation water management, and domestic water supply infrastructure management. Some of these (e.g., water user associations are legal bodies) have functional linkages with government structures [49].
On the other hand, water, agricultural, and irrigation offices at the regional and woreda levels have authority and interest in water for agriculture and domestic water uses but less interest in environmental, social, and cultural water uses and associated values. The local community has influence over and an interest in water governance. Most of the time, they are exposed to the tragedy of the commons in managing water resources. The community, however, wants water governance that is optimized and addresses all water values.
In addition to formal governance, social norms are operating locally in the CRV and Ketar basins. Social norms provide individuals with an expected idea of how to behave in a particular social group or culture (Heinrichs and Rojas, 2022). The idea of norms provides a key to understanding social influence in general. Socio-cultural norms influence people’s perceptions, knowledge, and commitment, therefore, affecting how they use and how communities provide access to water [50]. There are local community-level institutions (e.g., Churches, Mosques) that are operating independently by focusing on customary laws [50] and safeguarding their environment.
As discussed above, the Federal Government is responsible for drawing up general policies pertaining to common interests and benefits, while Regional Governments are usually responsible for contextualizing and implementing these policies.
The key point of interest here would be how these policies and regulations are cascaded to grass-roots level implementers (woreda and kebele level governance). Is the formal governance policy aligned with community water management goals? In this regard, Hailu et al. [48] argue that the policies are not cascading to the lower level as they are fundamentally top-down. Several stakeholders were not involved in the policy-making process, and customary water institutions were undermined. In a study on the perception of the local community on available policies and regulations and their enforcement by Desta et al. [51], most respondents stated that they do not know about provisions (nationally or regionally) pertaining to the conservation of water resources. This illustrates the low level of community engagement in policy formulation by the formal governance [26]).
Besides, the drive for development to address poverty and mandate overlaps among the institutions are two of the major obstacles to managing water values in an integrated way. As an illustration, article 51.11 of the Ethiopian constitution states, “It [the federal government] shall determine and administer the utilization of the waters or rivers and lakes linking two or more states or crossing the boundaries of the national territorial jurisdiction”, while article 52.1 declares that “All powers not expressly granted to the Federal Government alone, or currently to the Federal Government and the states, are reserved to the states” [52]. This is cited by regional institutions to govern water bodies such as Ziway and Hawasa lakes and other bodies of water. Such overlaps erode the power and interest of the organization in water resources management [26]. In water valuation discourse, sometimes conflict between formal and informal institutions can arise. This can be because local and public institutions’ water management goals are different. For example, informal institutions may focus on the relational or intrinsic use of water while paying less attention to its instrumental value, or vice versa. Such conditions may lead the one who has the power at the time to enforce its value of interest and ignore the priority value of the other party.
In view of the reviewed literature [1,26,44,45,47,48,49,52], focus group discussion, and key informant interview, it is apparent that the following governance gaps contributed to the current state of the water system structure and functions.
There are vivid policy gaps in terms of the process by which policies are developed (a top-down approach) and the recognition of multiple water values.
Lack of alignment of public policy goals with local community governance goals for water management.
Overlaps of duties and responsibilities among the federal institutions, federal and regional level institutions (e.g., river basin authority and EPA, regional water bureau and MoWE; (e.g., Hailu et al. [48]; Bantider et al. [26]).
2.3. Overall Conceptual Framework
Different people will place different values on the same water, even if they are of the same culture. One person might value water most highly for irrigation, another for watering their animals, and yet another for drinking clean water themselves. Water use is characterized by consumption conflict, and thus, very often, uses of water are impossible to reconcile [53]. Haileslassie et al. [54] emphasize that water values are context-specific, and contexts can be investigated through the mapping of water systems and sub-systems and the different water users and uses within them. System mapping can identify options, scenarios, and their potential trade-offs, which could inform decisions on modification or changing systems to achieve higher levels of water ecosystem service performance and examine the effects of other external factors (e.g., climate change). This helps to target and contextualize water value principles, enabling synergies and complementarities to be built and the system to move in the desired direction (e.g., HLPW 2017 [53]). Against this background, Haileslassie et al. [54] identified a water system as a system with defined structures (natural and manmade), functions (supporting, provisioning, regulating, and cultural services), and direct and indirect interactions among its diverse components. It is key to envisage water systems as inherently unstable, undergoing change across time and space physically; however, also as new forms of institutional governance arise from formal (e.g., policy change) to informal (e.g., shifts in water value norms).
The present study developed a conceptual framework (depicted in Figure 3) to illustrate the research process to achieve the objectives. The framework suggests a need to start with a review of water policies and strategies to understand water systems where a threat to multiple water values is at stake in Ethiopia [1]. As presented by Mekuria et al. [30] and Jansen et al. [4], the central rift valley (CRV) water system’s ecosystem services and the associated values are deteriorating [26]. The CRV system lakes are fed by the Ketar and Meki River systems, which flow from the Aris and Gurage highlands, respectively. The growing demand for food production is increasing the amount of water used for irrigation sourced from the Meki and Ketar rivers [40]. This is with the water that is directly pumped from Lake Ziway [37 × 106 m3 yr−1] [31]. Thus, this study examines the implications for multiple water values across scales (basin, sub-basin, community, and farm) resulting from these changing demands on the water system (nesting the Ketar water system into the CRV—Figure 3).
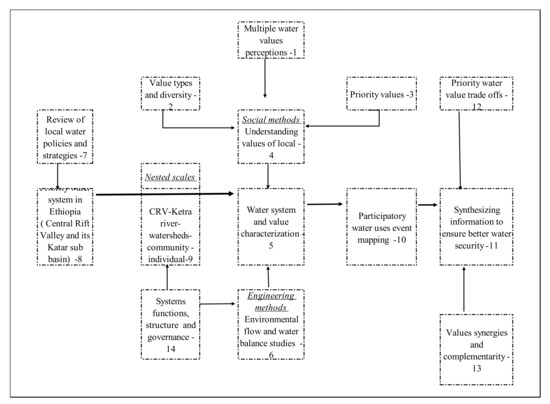
Figure 3.
Conceptual framework to understand local multiple water value perception, synergies and trade-offs of in the Central Rift Valley and its sub basin (Ketar) water system in Ethiopia.
The second step, as depicted in the conceptual framework (Figure 2), is the CRV and Ketar water systems and water value characterization. The suggestion by Haileslassie et al. [54] was followed to disentangle methods that highlight water system structures and functions, its governance, and methods to capture multiple values of locals. Temporal and spatial mapping of multiple water values based on information gathered during the second step was undertaken. This allows us to identify spots for overlaps, co-existence, competing water uses and attached values, and to synthesize information into global experiences in terms of how understanding multiple values, nurturing synergies, and managing trade-offs can ensure better water security [53].
2.4. Multiple Scales: Nested Approach
Water systems are interconnected [54]. There is a material flow between system components and between adjacent systems [55]. This influences use types, value perception, and the valuation of water ecosystem services. Therefore, the scale of focus in this work ranges from the CRV water system through sub-basins (the Ketar water system and its smaller watersheds, Figure 2) to communities and households. This is a multiscale nested approach whereby (a set of smaller scales (e.g., Ketar, community, and households) fit inside a larger scale (CRV) [56]. Without a better understanding of water uses, values, and connectivity across scales, it is difficult to capture risks and opportunities [55]. Haileslassie et al. [54] suggested that the values that people hold can be multidimensional (ecological, economic, and sociocultural) or “plural”. People may also hold multiple different values.
This justifies the need for a nested approach in constructing water value-related solutions based on an understanding of the multi-institution, multi-scale, multi-stakeholder mosaic of interests surrounding water values in CRV. Against this background, the present study conducted an overall water system assessment and water value mapping at the CRV scale (Figure 3). Then zoomed into the detail of the Ketar river sub-system and its smaller catchments and communities to understand how the community articulates water value, value co-existence, and conflicts.
2.5. Data Sources and Acquisition
Data sourcing for this study follows value quantification, local ecological knowledge, and deliberation [57]. However, data on groundwater use is very limited, and we could not find literature on this. So we prefer not to indicate any figures regarding the groundwater. For each of these data sourcing techniques, details are provided below (also in Figure 4).

Figure 4.
A framework showing integrated (engineering and socio-cultural) water value mapping [applying local ecological knowledge and deliberation (Peck and Kirfhan [57]).
Water value perception, plurality, priorities, and risks: to understand the diversity of local water value, a household survey was conducted in the CRV water system in January 2021. About 128 farm households representing different community segments (gender, religion, culture, level of education, etc.) have participated in this study. First, in the rift valley basin, qualitatively representative Woredas were objectively selected. Then Kebles, the lowest administrative units, were identified in consultation with extension agents, along with accessibility to roads and the level of water use diversity. In each of the surveys, a list of households was collected from local extension agents. Then households were randomly selected from the list. A questionnaire covering priority water values, values at risk, and conflict was developed and pretested. The pretested questionnaire was implemented in four Woredas (Adami-Tulu; Batu; Arsi-Negele; Dugda; Ziway-dugda), covering 42 kebeles in the CRV and Ketar river sub-systems and their sub-catchments. In this part, our methods focus on the local ecological knowledge and deliberation as suggested by Peck and Kirfan [57] to document the pragmatic socio-cultural values of water [58]. The household survey was supported by ten Focus Group Discussion (FGD) and five Key Informants Interview (KII) at Ketar and its catchments. Topics for FGD and KII cover issues on trends in water ecosystem services (for triangulation of literature and the household survey results) and water value perception, plurality, priorities, and risks. Information regarding the water-related events calendar (irrigation, scenery, Thanksgiving Day (Irreechaa—Lega is the annual Thanksgiving Day of the Oromo people, which they celebrate annually by the last week of September around major water bodies), (Irreechaa—Lega); orthodox church epiphany, holy water use, etc…). The method for collecting these data sets was consensus-based, meaning that on certain topics, participants of the FGD presented their context and finally reached an agreement on what better represented the locality or what all members could feel comfortable with [59]. The information generated from the household survey, FGD, and KI was integrated into the FAO(WEAP) model results (details provided below), and a qualitative comparison was made between the economic use of water vis a vis environmental water flow and socio-cultural demand. With the help of local people’s guides, the geographic position of selected water use practices and associated values was mapped using GPS.
Estimation of water flow: this activity was undertaken for the Ketar river and its catchments (CRV sub-basin). It estimates water discharge at the Ketar water system and its catchments (Kulumsa and Gusha-Temela). Flow data from Ketar river gauges from 1972 to 2016 was collected from the Ministry of Water and Energy (MoWE). The flow of ungauged rivers, which are sub-catchments in the Ketar rivers (Kulumsa and Gusha-Temela), was estimated using the catchment area ratio method as illustrated by Equation (1) [38].
where Qsd—the discharge of the ungauged river; Asd—the catchment area of the ungauged river, is the catchment area of the gauged river (Ketar in this case); and the discharge of the gauged river. These data were checked for quality, including missed and outlier values. Missing data were filled in using an arithmetic mean [38].
Estimation of major water demand: the demand side, as illustrated in Figure 4, considers the consumptive use of water for irrigation and livestock, which makes up the largest consumptive water use in sub-Saharan Africa [60]. Irrigation crop water demand was estimated using FAO CropWat 8.0 software. Climate data input was collected from the nearby Ogolcho and Asela metrological stations, representing the midland and highland areas.
Data from the district agricultural office indicates that the dominant irrigated crops in Ketar catchments and its sub-basin are Tomato (Solanum lycopersicum), Potato (Solanum tuberosum), Onion (Allium cepa), and Wheat (Triticum spcies). The area coverage of these crops in the catchment varies yearly based on crop rotation, market conditions, and seed availability, and thus 2020/21 was considered the base year. The past three years (2018/19—2020/21) of irrigation area coverage were considered for crop water demand estimation both at Ketar and its subbasin. Hence, in this study, the irrigation water demand of wheat covering 50%, potato 25%, tomato 10%, and onion 15% of the irrigation area in the catchment was considered [40]. The present study adopted Doorenbos and Pruitt [61] and Van Halsema et al. [62] suggestions of 55% of overall irrigation efficiency for estimation of irrigation water requirements in the case study sub catchments.
Livestock is an important water consumer. However, estimating the total water requirement needs data on animal physiology and activity. Currently, this is lacking in Ethiopia, and therefore an average livestock water requirement of 14.4 litters per day per head, as suggested by Sileshi et al. [63], was applied. Data on the livestock population was collected from the Woreda Agriculture offices in the study area.
Estimation of environmental flow: environmental flow (EF) is one of the disputed areas of water balance estimation in many studies in Ethiopia. Traditionally, engineers use 15% of the base flow; however, there is neither a standard at the national level nor efforts to customize EF estimation to the local context. Environmental flow assessments vary across a wide range of complexity and depth, as dictated by the level of funding, availability of data, technical capacity, time frame, priority of the site, or expected level of controversy [64,65]. Most environmental flow assessment methodologies are categorized into hydrological, hydraulic rating, habitat simulation (or rating), and holistic methodologies [66,67,68,69]. Each methodology can be used as a decision tool to identify failures in EF in quantity, timing, and quality that lead to failure to support estuarine ecosystems and human livelihoods and well-being [70]. In this study, a scenario-based approach was adopted to estimate EF. In scenario I, the Tennant method, scenario II, Q95, and scenario III, local thumb rules (e.g., Geleta [38]) were applied. Environmental flow for the Ketar river and its two selected sub-catchments (Kulumsa and Gusha-Temela) was estimated to understand scale effects and competing water demands between environment, economy, and socio-cultural water needs. Methodological details for each of the EF scenarios are presented below [38,71].
The Tennant method uses historical flow data to set a fixed percentage of annual average flow (AAF) as environmental flow. Accordingly, 10% of AAF is recommended as a minimum environmental flow [38].
The Q95 is estimated as an EF using flow duration curves (FDC). The FDC was plotted by arranging the statistical flow data in descending order against the percentage of exceedance [38,72,73].
To determine the Ethiopian thumb rule in the ungauged small catchments, the dry month flow was estimated by direct measurement in the driest part of a year using the float method. However, in this study, the flow was estimated using the catchment area ratio method, and the January flow was used as the driest month of the year. The 15% flow of January is taken as the EF [38,71].
The results of the three methods were compared against the water abstraction for agriculture and overlayed on the community-selected event calendar of qualitative sociocultural water requirements.
Water balance computation: Water Evaluation and Planning WEAP tool was selected to analyze the water balance and EF of the Ketar and its sub-catchments. WEAP was developed by the Stockholm Environment Institute (SEI [74]). The tool places the demand side on equal footing with the supply side. WEAP simulates different scenarios between demand and supply, considering different development options and environments [74]. The result was verified at the field level through observation and FGD with irrigation farmers and the local irrigation officers.
3. Results and Discussion
3.1. Plurality of Water Values in the Central Rift Valley Water System
Figure 5 presents household survey results on priority water uses and associated values as perceived by diverse water users in the CRV of Ethiopia. About 24 perceived values were identified. Respondents were given the option to choose more than one use type and associated values. Accordingly, the result indicates that the highest frequency of mentions was recorded for domestic water use related values, followed by agriculture and livestock. The smallest number of mentions of the water use types by the household survey respondents were on water as a commodity (27) and water as a source of energy (8). Based on the identified use and practices (Houston et al. [75]), multiple water values were apparent in the CRV. The instrumental value type dominates the top and bottom of Figure 6. The middle layer is dominated by examples of relational water value. The lowest preference was recorded for uses related to intrinsic water value. This suggests that people’s value preferences reflect their livelihood activities and practices [75].
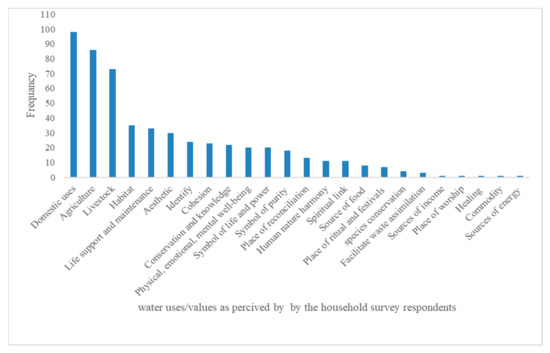
Figure 5.
Diversity of water use and values in the Central Rift Valley water system (the number of times a certain value was mentioned by the household survey respondents). Examples and descriptions of each of the value categories are provided in Table A1.
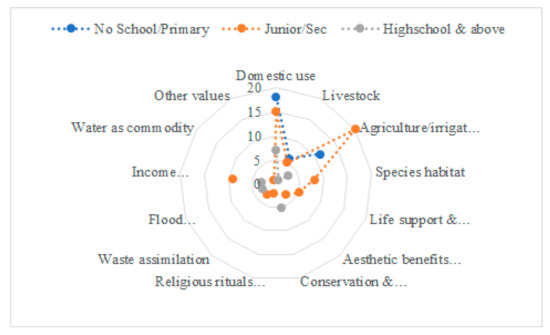
Figure 6.
Pluralistic nature of water value and dichotomy of preference by people of different educational backgrounds in the CRV (number of Reponses).
While the term ‘value’ and the process of ‘valuation’ are well defined, there are several different views and perspectives of what ‘value’ specifically means to various user groups and stakeholders [21] (UNESCO 2021). Figure 7 depicts the pluralistic nature of water value based on the educational background of the household survey participants (illiterate, primary and secondary school, and high school and above) in CRV. Accordingly, while preference for instrumental (e.g., domestic and agricultural water uses) as the most preferred value is shared among all the participants, relational values (e.g., aesthetic benefits) are more important value attributes for respondents who were above secondary school. Similarly, the pluralistic and multiple nature of water value is depicted in Table 2, as deducted from the focus group discussion in the Ketar river system.
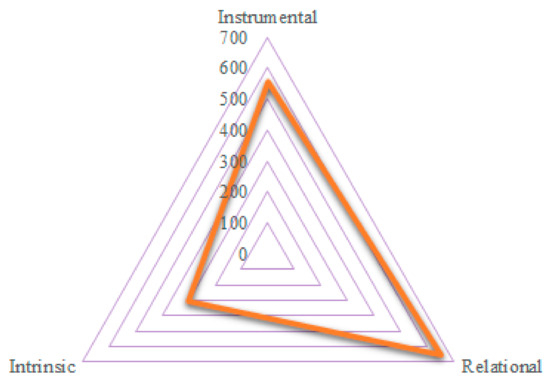
Figure 7.
Aggregated water values are a priority in the central rift valley water system (values are the sum of the number of times the survey respondents mentioned specific water use and associated values).
Table 2.
Articulated water values of the Ketar catchment (generated from group discussion on a consensus basis (Crang and Cook [59]).
The overall result reflects the basic needs for food and water security. It is in line with the former Ethiopian government water policy [1] (In the recent water and agricultural policy reform, the Government of the Federal Democratic Republic of Ethiopia considers multiple values, and the new policy is under approval by the Council of Ministers), which prioritizes domestic water uses and water for livestock in that order of importance without detailing other water uses and values (e.g., environmental flow). Similarly, with the recent water and agricultural policy reform, the Government of the Federal Democratic Republic of Ethiopia considers multiple values, and the new policy is under approval by the Council of Ministers. According to UNESCO [21], the food security value of water is high but rarely quantified, and it is often a political imperative irrespective of other values.
Agriculture uses the majority (>75%) of developing countries’ freshwater resources [21]. Global demand for food and other agricultural products is projected to increase by 50% between 2012 and 2050, driven by population growth [21]. Similarly, food security has long been a challenge for human societies in this part of Africa and will become an increasingly pressing issue over the coming years given the increasing population.
Additionally, Mekuria et al. [30] reported that in many parts of the CRV, increasing demand for water for food production is a major driver of dwindling ecosystem service values. Environmental degradation results in the depletion of aquifers, reduction of river flows, degradation of wildlife habitats, and pollution [21,33,76].
While Figure 5 presents individual value level preferences, Figure 7 shows the attribution of plural values (i.e., intrinsic, relational, and instrumental) to the water systems of the CRV [77]. Accordingly, it is apparent that relational values were the most frequently mentioned values. About 43% of the water values identified were relational, 36% instrumental, and 20% intrinsic. In this relation, intrinsic values (i.e., earth life dependency on water, concerns toward plants and animals), relational values (i.e., health and quality of life), and instrumental values (i.e., economic dependency on water and associated landscape) were conceptualized as elaborated in Arias-Arévalo et al. [77]. The result in Figure 6 (number of responses) contrasts with Figure 7 but substantiates the findings by Arévalo et al. [77], where relational value ecosystem services for urban and rural communities received the highest score. However, Arévalo et al. [77] and the present studies vary by the order of magnitude of preference for Intrinsic and Instrumental values. Instrumental value is the second highest preference in CRV, while it is the last in the Arévalo et al. [77] study.
In CRV, most of the population lives on agricultural, livestock, fishing, and other natural resource-based activities. The level of dependence on natural resources and the livelihood associated therewith explains the dichotomy in priority between intrinsic and instrumental values for the community in CRV [75]. The reason behind the highest number of scores for relational value is due to the diversity of water use compared to instrumental values. Values are interdependent; relational value is critical to ensuring sustained ecosystem services and access to water for food security and economic activities instrumental (e.g., HLP [53]).
The status of water resources in CRV highlights the need for improved water resource management [31,33]. Recognizing, measuring, and expressing water’s worth and incorporating it into decision-making are fundamental to achieving sustainable and equitable water resources management and the Sustainable Development Goals (SDGs) of the United Nations’ 2030 Agenda for Sustainable Development [21]. The question is whether the integration of collective or individual values is fundamental in policy decision-making.
3.2. Shared Values and Value Articulation: An Example from the Ketar River Water System
There are several different views and perspectives on what ‘value’ specifically means to various user groups and stakeholders [21,53]. Information in Table 2 and Table 3 was generated from FGD and KII. It depicts how different community segments (individuals, public, and religious) have their own priorities and shared values. Accordingly, all the priority water uses and associated values listed in Table 3 are shared among private, public, and religious groups. Specific to the public interest, only those related to instrumental value obtained the strongest backing. Although different relational values attract the stronger interest of the public (e.g., cultural and fear values), the instrumental values outweigh them when it comes to actual implementation. For example, failure to implement the allocation of 15% of the annual flow to environmental flow (in small-scale irrigation development studies) is caused by a lack of standard methods and policy enforcement. In this regard, McClain et al. [78] concluded that the implementation of environmental flow faces multiple challenges in general in Africa, ranging from a lack of will on the part of water authorities to a lack of technical capacity.
Table 3.
Plurality and priority of water values (as demonstrated in FGD and KII sessions, 1 is the most preferred value and 5 is the least preferred value).
Addressing these challenges will require continued cooperation between the multiple stakeholders involved in the process. Community segments connected to Christianity and Muslim religion were more in the category of Thanksgiving days, holy water, and Ethiopian Orthodox Christian Epiphany, though they also demonstrated their interest in other values.
At a policy level, water policy decisions are driven by the country’s economic and legal systems’ values, such as economic efficiency, justice, equity, development, and others [21]. At community levels, water choices and decisions are motivated by shared plural water values within a community but are always limited to the existing structures, such as water use practices, infrastructure, legal use frames, and others [75]. At micro-levels, in people’s everyday lives, values do not underpin decisions or choices related to water, at least when understood as people’s values. Individuals perform practices, a routinized and socially shared type of behavior that possesses their own logic and values. Therefore, most of the time, the value of water does not lie in the individual but in the practice [75]. An important question for sustainable management of water is how to reconcile these different practices and interests.
According to Euzen and Morehouse [79], how water value is defined depends on who is doing the definition, the context, and the entities involved. Thus, water may be considered a symbolic element, a resource, a commercial product, or a service. Each perspective will attribute different kinds of values to the water and articulate them differently; however, there will also be many interconnections between the perspective and the values attributed to the water in question. The interconnections established, in turn, serve to build norms and references that influence decisions made by individuals at higher levels of social organization [79]. Considered a resource for life, water thus becomes an object enfolding a multiplicity of interests and a broad diversity of values. These interests and values vary and change across cultures, communities, states, space, and time, as illustrated in the present study [79].
Accordingly, the value articulation in Table 2 was developed from consensus-based group discussion, and it illustrates that diverse but also interconnected water value. Articulations were not just limited to water, per se. There are cases where water and landscapes, the river system and downstream water bodies, and the connection between human beings are valued and connectively articulated. This supports one of the water value principles, which suggests conserving value at its sources in connection with the landscape from which it is generated [53].
This implies connectivity between system functions and structures when valuing water. For example, the focus group discussant mentioned the Ketar river landscape diversity ranging from the highland 4200 m.a.s.l. to the lowland 1600 m.a.s.l. and how it gives opportunities for learning different livelihoods, cultures, and ecosystem functions and structures and how this relates to psychological enjoyment. In this regard, Euzen and Morehouse [79] argued that when people talk about the water, they talk about a specific idea that they associate with a vital need, a memory, a daily action, a belief, or a landscape. The omnipresence of water, paradoxically revealed by its absence, has encouraged people since ancient times to attribute to it one or more specific values that have become hierarchized and evolved over time.
The focus group discussion also emphasized that the boundary of water uses and associated values is loose, and an example provided in this regard is that of the pastoralists from the Fentale area who are traveling about 100 km with their camels to the Ketar wetland called Sheetamaataa to feed their camels. Sheetamaataa is a wetland that is 1793 ha- 30 km in circumference and formed due to the inundation of the Ketra River before joining lake Ziway. A similar perception was reflected in the use of hot springs and holy waters and also in the celebration of Thanksgiving Day.
3.3. Water Value Trade-Off and Co-Existence in Space and Time: An Example from the Ketar River Water System
Water values are contested as different stakeholders have different interests and policymakers prioritize their policy goals (Table 3). Given the diversity in culture, religion, livelihood, and environment people live in, water has multiple values, and there is value conflict and trade-offs. Understanding and managing trade-offs is one of the multiple water valuation principles. Water is a pillar of life; it cleans, heals, and quenches [53,75,79]. Results of selected water values representing economic, environmental, and socio-cultural aspects are presented in Figure 8, Table 4, Table 5 and Table 6, and interpreted in relation to the event calendar presented in Figure 9.
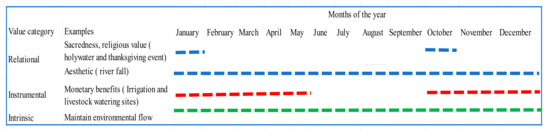
Figure 8.
Calendar of different water use-related events for the Ketar river system (Note that during the rainy season livestock are not taken to rivers due to the availability of water in nearby streams and storages).
Table 4.
Effects of agricultural water demand on Ketar river system environmental flow (000 L/s).
Table 5.
Effects of agricultural water demand on the Kulumsa river system (a smaller catchment in Ketar) and its environmental flow (000 L/s).
Table 6.
Effects of agricultural water demand on the Gusha- Temela river system (smaller catchment in Ketar) system environmental flow (000 L/s).

Figure 9.
Water-related risks (values are the number of times the survey respondents mentioned specific water risks associated with water use and values).
As demonstrated in Table 4, Table 5 and Table 6, the results of scenario-based analysis for water balance and environmental flow estimation show different results across scale (larger rivers, smaller rivers) and across scenarios. For example, at a larger scale (the Ketar river system), in December, January, and February, the environmental flow of the Ketar river according to scenarios I [Tenant a minimum 10% Annual Average Flow (AAF)] and scenario II [ Flow Duration Curve (FDC) Q95] is negative, while under scenario III (Local thumb rule of 15%), the river satisfies the minimum requirement. For the smaller river in Ketar (Kulumsa—Table 5), similar trends to Ketar were observed except for more deficit months in scenario III. In a similar pattern, in the third example, the Gusha river (located upstream of the Ketar catchment), EF observation showed December, January, February, and March under deficit for all scenarios.
The lesson from this scenario-based EF assessment exercise proves the concept that “one size does not fit all”. The different river systems have different ecological and socio-cultural flow requirements [78]. Ecological flow estimation and decision support tools such as those applied for scenario analysis must be context-specific, and this is lacking in the Ethiopian context. Regardless of the difference in magnitude of the estimated EF results, they share one common future: the water value conflict between water for the environment and the economy.
Comparing the water balance tables with the water use event calendar developed in consultation with the community gives a complete picture of the spatial and temporal details of water value trade-offs. Figure 8 illustrates that some relational values are throughout the year (e.g., aesthetic, holly water), while others concentrate in October and January (e.g., spiritual, and cultural values), and in these months the water availability is already deficient for environmental flow under some of the scenarios considered and validations during focus group discussion.
As these cultural and spiritual events are non-consumptive water uses (complementary with the EF), there are arguments that maintaining environmental flow is sufficient to meet the socio-cultural needs. However, as elaborated earlier, under different scenarios and at different scales, the environmental flow has already suffered a shortage, and implicitly so have the socio-cultural needs. Nevertheless, the different values of water need to be reconciled, and the trade-offs between them need to be resolved and incorporated into systematic and inclusive planning and decision-making processes [53].
In contrast to the value trade-offs, there is an aspect of co-exitance of water values in the CRV and Ketar systems as illustrated in Figure A1. Figure A1 shows that irrigation sites, thanksgiving, and Ethiopian orthodox church epiphany space overlap for years. Such coexistence may illustrate the option for co-planning management. The results also demonstrate that the value of coexistence strengthens the cohesion among the members of a group, providing an interactive space in which communal belonging is symbolized and shared norms are respected [80].
3.4. Water-Related Risks and Threats to Multiple Water Values as Perceived by Local Communities
Freshwater is essential for human survival, agriculture, and the survival of our planet’s plants and animals. In addition to the trade-offs illustrated earlier, pollution, climate change, water-related disease, and the destruction of our natural habitat all threaten the purity and availability of water resources.
The current household survey community in the CRV and Ketar water systems underscored about 7 different types and interrelated water value risks communities are confronted with (Figure 9). Among the mentioned risks, the prevalence of water-borne disease and poor water quality scored the highest. In this regard, Desta et al. [51] investigated the public’s perception of water quality and the major cause. Their results suggest that the water quality and shrinking water level of Lake Ziway can be accounted for by anthropogenic factors involving uncontrolled water abstraction from the lake, discharge reduction from feeder rivers, siltation due to deforestation-induced soil erosion in the watershed, and effluent discharges from floriculture industries as well as agrochemical runoff. Similarly, physicochemical water quality parameter assessments in two relatively freshwater lakes (Ziway and Hawassa) substantiate the local community perception reported here [81,82]. According to these authors, the mean value of most water quality parameters they investigated shows clear deterioration over the last few decades. The status of water quality affects the already low level of domestic water supply in the central rift valley [26]. Gleick [83] suggests that access to a basic water requirement is a fundamental human right implicitly and explicitly supported by international law, declarations, and state practice.
The second group of water-related risks, as perceived by the local community, involves increasing invasive weed species (e.g., water hyacinth) and ecosystem degradation (e.g., Mekuria et al. [30]; Elias et al. [33]; Bantider et al. [26]) in CRV. Traditional rainfed agriculture is challenged by uncertainty in rainfall and land degradation across generations. Highlands flanking the valley are prone to land degradation and are the major source of sediments, while valley floors and lakes (Lake Ziway, for example) act as sediment sinks [26,33]. While deposition of fertile topsoil can have positive effects (e.g., nutrient inputs), deposition into lake beds negatively impacts water chemistry, and this, compounded with the over-abstraction of water, reduces reservoir volume [33]. This has a detrimental effect on how and why people use water and how they value it.
To guide the delivery of SDG6, the High-Level Panel on Water (HLPW) identified five principles for valuing water. There are deep interconnections between human needs, social and economic well-being, spiritual beliefs, and the viability of ecosystems that need to be considered, inferring multiple values from water [54]. The first principle refers to recognizing and embracing water’s multiple values, and HLPW [53] suggests identifying, understanding, and considering the multiple and diverse values of water for different groups and interests in all decisions affecting water [21]. Given limited information on the diversity of water values in SSA and specifically in CRV, the information generated through this study is a breakthrough; however, more work is needed as the water system evolves due to mounting population and climate change pressure [26].
The second principle is about reconciling these values and building trust between different users—the upstream, downstream, urban, rural, private, public, etc. Here, reconciling, according to HLPW [53], refers to equitable, transparent, and inclusive ways of managing and sharing resources. Trade-offs are inevitable, particularly in water-scarce areas such as CRV, where diverse uses and users have different interests, priorities, and norms and therefore value water differently (Table 3). In view of HLPWs [53] suggestion that delays in planning and managing trade-offs may have costs in CRV. These processes need to be adaptive in the face of rapid system changes.
Protecting water sources is the third principle in valuing water. This is about the maintenance and restoration of water systems, e.g., structure, function [84]. HLPW [53] emphasizes that all sources of water in a water system, including rivers, aquifers, and associated ecosystem services, as well as return flows of water, must be protected. There is growing urgency to protect sources (erosion in mountain areas of the CRV; [26] control and prevent pollution (in lowland intensive crop production and vegetable/flower farms), and address other pressures across multiple scales in the CRV.
Fourth, HLP calls for educating and empowering people. Our result illustrated the difference in perception among these household survey respondents who went to school and those who did not. Educating and empowering people includes promoting education and public awareness about the interdependence of the different water values, their essential role in all aspects of life, and the sustainability of water ecosystem services. This will support broader participation in water system-wise decisions.
Finally, the fifth principle of valuing water is its investment and innovation. This is the pathway towards realizing the many different benefits derived from water and reducing risks. Investment can take the form of investment in institutions, infrastructure, information, and innovation, and these are not mutually exclusive. It should be emphasized that this is a key driver that spurs the effectiveness of the four principles above and thus requires concerted action and institutional coherence.
Figure 10 illustrates the perception of the local community regarding the threat to multiple water values. It shows the number of times the respondents mentioned it and demonstrates the values that are most affected (e.g., agricultural water value). This implies community concerns about water security for food production (the value of water for food security). An almost similar magnitude of threat was also assigned to values such as aesthetics and habitat for species. Water is a critical input for agricultural production and plays an important role in food security. The growing population in CRV, as in other parts of Ethiopia, is putting more demand on and thus increasing the extraction of water for irrigation [31,33,85]. Along with this, the compound effects of climate change, as suggested by Gadissa et al. [29], would explain respondents’ concerns over the threat to food security of the waters in CRV. Livelihood in the central rift valley is agriculture-based, and the threat to water value for agriculture is a threat to food security for the majority. In this regard, Houston et al. [75] discuss the interdependency among water uses and the importance of scarcity in determining the value of water.
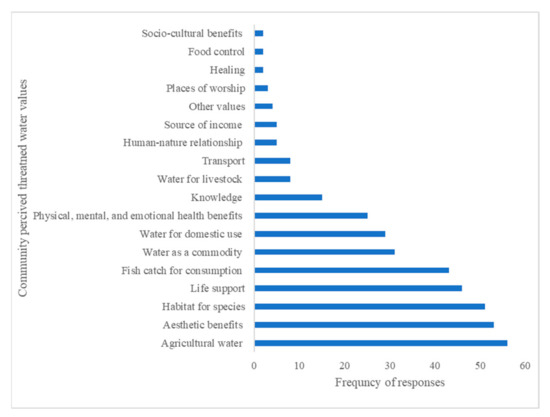
Figure 10.
The most threatened water values, as perceived by the local community in the central rift valley.
The fact that public sector policy goals are focusing more on food production (instrumental value) exacerbates the problem [48]. In this regard, HLPW [53] pointed out in its five principles that there are deep interconnections between human needs, social and economic well-being, spiritual beliefs, and the viability of ecosystems that need to be considered, inferring multiple values of water. This suggests that the solution to water security for agriculture lies in the recognition of other water values (i.e., intrinsic and relational) and reforming and enforcing policies in this direction.
4. Conclusions
Water security is a foundation for sustainable development. In many instances, the pluralistic nature of water values is not documented, and there are marked value trade-offs. In the present study, attempts were made to map water values, priorities, risks, and trade-offs. In view of the results, the following conclusions were drawn: First, our findings suggest the pluralistic nature of water value in CRV, and this concurs with the arguments of other authors [21,53,54]; however, the community in CRV prioritizes water value in relation to their livelihood. Our findings underscore that farmers’ prioritization of water for food security is a reflection of dominant public food security-focused policy goals. Here it is important to emphasize that understanding the interconnections between water values provides a helpful entry point into the causes and consequences of water management problems [41]. Secondly, there was an apparent water value trade-off triggered by food security (irrigation) focused policies, the application of generic decision support tools (EF tools) to manage value conflict in CRV and in Ethiopia in general, and a lack of community engagement in public policy and local norms. Dialogue and alignment thus fail to recognize the plurality of water values. Thirdly, the multiple water values in the CRV are at risk. Water value for food security, which is the key shared value among the majority of the population in CRV, is most threatened because of water ecosystem service deterioration (pollution, climate change, ecosystem degradation). Failure to reverse this may lead to the collapse of the food system and worsen the current food insecurity situation in CRV. This suggests that a solution to water insecurity for agriculture lies in the recognition of the intersecting and multiple water values within communities and landscapes. Reforming and enforcing policies to reflect this fundamental understanding would be an important first step to achieving greater water security in the CRV.
Author Contributions
Conceptualization: Y.G. and A.H.; Methodology: A.H. and Y.G., Formal analysis and investigation: Y.G.; Writing—original draft preparation: Y.G.; Writing—review and editing: A.H., B.S., E.A. and A.B. Supervision: B.S., E.A. and A.H. All authors have read and agreed to the published version of the manuscript.
Funding
The Water Security and Sustainable Development Hub, funded by the UK Research and Innovation’s Global Challenges Research Fund (GCRF) [grant number: ES/S008179/1], financially supported the time of the second author, household survey data collection and publication fee.
Data Availability Statement
Not applicable.
Acknowledgments
The authors would also like to thank the numerous colleagues who have contributed input and comments to the development of this manuscript. Specifically, our thanks go to Tesfaye Muluneh for his support in the household survey. The authors would also like to thank Maggie Roe for her review of the early draft and the Water Security and Sustainable Development Hub funded by the UK Research and Innovation’s Global Challenges Research Fund (GCRF) [grant number: ES/S008179/1]. For covering the second author’s time.
Conflicts of Interest
The authors declare no conflict of interest.
Appendix A
Table A1.
Value categories and local use examples.
Table A1.
Value categories and local use examples.
| Value Category | Local Use Examples |
|---|---|
| Water for domestic use | Drinking, food preparation, cleaning, protection from diseases and hygiene, etc.) |
| Water for livestock raising | Drinking, feed production |
| Agricultural water use | Crop, vegetables, fruits, and other plants) production/growing |
| Fish catch for consumption and market | Fish caught for consumption and market |
| Water as source of energy | Hydroelectricity and geothermal energy |
| water for transport | Conveyance, income source, e.g., boating service |
| Source of income based on water bodies/places and associated landscapes | Service provision, e.g., scouting/tour guide, amenities, lodging, etc. |
| Water as a commodity | Bottled water and related businesses/income |
| Healing/cure from diseases and spiritual satisfaction | Holy/sacred and mineral/hot water springs. |
| Use in cultural/religious rituals and festivals | Water is used in epiphany as a symbol of purity, holiness, cleansing benefits, in irreechaa as an expression of prosperity and thanks giving, as a spiritual link with the creator, “Waaqaa,” cultural/spiritual unity between people, etc.). |
| Please to retore peace and conflict arbitrations. | Use of landscapes, riverbanks, and water related environments as places of worship/thanksgiving, festivals, localities for reconciliation with nature, and meeting places |
| Sources of additional income | Income obtained from service provision, facilities, and access to holy or hot/mineral water sites. |
| Assimilation of waste and toxic substances | surface and ground water for washing and cleaning |
| Life support | Water bodies are used for maintaining the lives of diverse fauna and flora through nutrient provision in water ecosystems. |
| Habitat for species | Living ecology and breeding space for species of animals and plants) that have both ecological, instrumental, and relational value. |
| Absorbing toxic substances | Wetlands/swamps are important for absorbing toxic wastes, flood control, and plant and animal species conservation. |
| Physical, mental, and emotional health benefits | Relaxation from swimming and refreshment along river banks and lake sides |
| Human-nature relationship | Lands/waterscapes as places of interaction between people and natural environment |
| Socio-cultural benefits | Riverbanks; wetness/greenery as places of reconciliation and arbitration. |
| Symbol of life and power | Belief in water as sacred and source of life- place of worship, e.g., symbolic expression of supernatural power and thanks giving—Irrecha. |
| Spiritual link with creator and satisfaction benefits | Worshiping and thanksgiving. |
| Spiritual healing and health benefits | Holy water/hot water/mineral water springs. |
| Symbol of holiness, cleansing and purity | Epiphany: Muslim worshipers clean with water before prayers. |
| Conservation and knowledge | Wetness and greenery as symbols of healthy human-nature relationships, water ecosystems for ecotourism, and protected areas for birds and animals. |
| Aesthetic benefits | Recreational fishing, bird watching, hunting, Lakes ecologies and landscapes. |
| Cultural identity and sense of place | Expression of self and belongingness, e.g., identifying with others as belonging to the same locality. |
| Social/cultural cohesion | Cultural/spiritual unity among people—e.g., Orthodox Christians or Oromo people celebrating Irreechaa. |
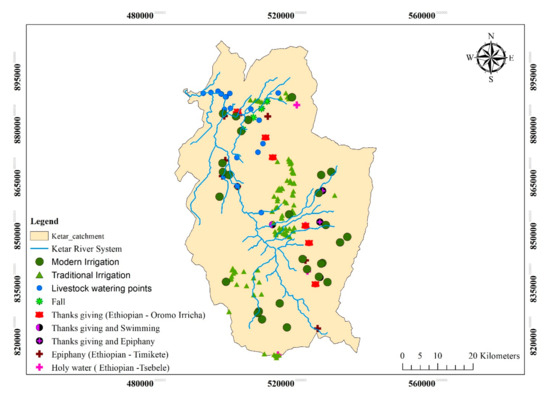
Figure A1.
Examples of water value distribution, overlap, and co-existence in space.
Figure A1.
Examples of water value distribution, overlap, and co-existence in space.

References
- MoWR. Ethiopian Water Resources Management Policy; MoWR: Addis Ababa, Ethiopia, 1999; p. 37.
- Seyoum, W.M.; Milewski, A.M.; Durham, M.C. Understanding the Relative Impacts of Natural Processes and Human Activities on the Hydrology of the Central Rift Valley Lakes, East Africa. Hydrol. Process. 2015, 29, 4312–4324. [Google Scholar] [CrossRef]
- Desta, H.; Fetene, A. Land-Use and Land-Cover Change in Lake Ziway Watershed of the Ethiopian Central Rift Valley Region and Its Environmental Impacts. Land Use Policy 2020, 96, 104682. [Google Scholar] [CrossRef]
- Herco, J.; Huib, H.; Dagnachew, L.; Tenalem, A.; Petra Hellegers, P.S. Land and Water Resources Assessment in the Ethiopian Central Rift Valley; Alterra: Wageningen, The Netherlands, 2007. [Google Scholar]
- MoWR. Rift Valley Lakes Basin Integrated Resources Development Master Plan; MoWR: Addis Ababa, Ethiopia, 2009.
- CSA. The Federal Democratic Republic of Ethiopia Central Statistical Agency 2022 Report; CSA: Addis Ababa, Ethiopia, 2022. [Google Scholar]
- New Foresight; University Nyenrode Business; Wageningen University and Research; Government of the Netherlands. Valuing Water: A Conceptual Framework for Making Better Decisions Impacting Water. 2020. Available online: https://www.gwp.org/contentassets/963260f5a99f44aaab550cf0add4280c/vwiconceptualframeworkfeb2020.pdf (accessed on 1 June 2023).
- Balvanera, P.; Pascual, U.; Christie, M.; Baptiste, B.; Lliso, B.; Monroy, A.S.; Guibrunet, L.; Anderson, C.B.; Athayde, S.; Barton, D.N.; et al. Chapter 1: The Role of the Values of Nature and Valuation for Addressing the Biodiversity Crisis and Navigating towards More Just and Sustainable Futures; IPBES: Bonn, Germany, 2022.
- Bryan, B.A.; Raymond, C.M.; Crossman, N.D.; Macdonald, D.H. Targeting the Management of Ecosystem Services Based on Social Values: Where, What, and How? Landsc. Urban Plan 2010, 97, 111–122. [Google Scholar] [CrossRef]
- Costanza, R.; D’Arge, R.; De Groot, R.; Farber, S.; Grasso, M.; Hannon, B.; Limburg, K.; Naeem, S.; O’Neill, R.V.; Paruelo, J.; et al. The Value of the World’s Ecosystem Services and Natural Capital. Nature 1997, 387, 253–260. [Google Scholar] [CrossRef]
- Paudyal, K.; Baral, H.; Keenan, R.J. Assessing Social Values of Ecosystem Services in the Phewa Lake Watershed, Nepal. For. Policy Econ. 2018, 90, 67–81. [Google Scholar] [CrossRef]
- Rapport, D.J.; Costanza, R.; Mcmichael, A.J. Assessing Ecosystem Health. Trends Ecol. Evol. 1998, 10, 397–402. [Google Scholar] [CrossRef]
- Smith, H.F.; Sullivan, C.A. Ecosystem Services within Agricultural Landscapes-Farmers’ Perceptions. Ecol. Econ. 2014, 98, 72–80. [Google Scholar] [CrossRef]
- Dissanayake, P.; Smakhtin, V. Environmental and Social Values of River Water: Examples from the Menik Ganga, Sri Lanka; International Water Management Institute: Colombo, Sri Lanka, 2007. [Google Scholar]
- Leul, K.; Amare, H.; Nickie, P.; Younis, G.; Fitsum, H.; Tewodros, N.; Kahsay, A.H. NBI Technical Reports: Water Resources Management Series Economic Value of Water for Irrigation in the Nile Basin; Nile Basin Initiative: Addis Ababa, Ethiopia, 2020. [Google Scholar]
- Guo, Z.; Wang, N.; Mao, X.; Ke, X.; Luo, S.; Yu, L. Benefit Analysis of Economic and Social Water Supply in Xi’an Based on the Emergy Method. Sustainability 2022, 14, 5001. [Google Scholar] [CrossRef]
- Haileslassie, A.; Mekuria, W.; Uhlenbrook, S.; Ludi, E.; Schmitter, P. Gap Analysis and Methodological Framework to Assess and Develop Water Centric Sustainable Agricultural Intensification Pathways in Sub-Saharan Africa. Water Hum. Syst. 2022, 4, 747610. [Google Scholar] [CrossRef]
- Jackson, S. Rivers and their cultural values: Assessing cultural water requirements. Oxf. Bibliogr. Environ. Sci. 2021. [CrossRef]
- Scholte, S.S.K.; van Teeffelen, A.J.A.; Verburg, P.H. Integrating Socio-Cultural Perspectives into Ecosystem Service Valuation: A Review of Concepts and Methods. Ecol. Econ. 2015, 114, 67–78. [Google Scholar] [CrossRef]
- Jacobs, S.; Dendoncker, N.; Martín-López, B.; Barton, D.N.; Gomez-Baggethun, E.; Boeraeve, F.; McGrath, F.L.; Vierikko, K.; Geneletti, D.; Sevecke, K.J.; et al. A New Valuation School: Integrating Diverse Values of Nature in Resource and Land Use Decisions. Ecosyst. Serv. 2016, 22, 213–220. [Google Scholar] [CrossRef]
- UNESCO. The United Nations World Water Development Report: Valuing Water; UNESCO: Perugia, Italy, 2021. [Google Scholar]
- Kidane, T.T.; Wei, S.; Sibhatu, K.T. Smallholder Farmers’ Willingness to Pay for Irrigation Water: Insights from Eritrea. Agric. Water Manag. 2019, 222, 30–37. [Google Scholar] [CrossRef]
- Gondo, R.; Kolawole, O.D.; Mbaiwa, J.E. Dissonance in Customary and Statutory Water Management Institutions: Issues of Cultural Diversity in the Management of Water Resources in the Okavango Delta, Botswana. Environ. Dev. Sustain. 2019, 21, 1091–1109. [Google Scholar] [CrossRef]
- Tenalem, A. Natural Lakes of Ethiopia; Addis Ababa University Press: Addis Ababa, Ethiopia, 2009. [Google Scholar]
- Ethiopian Panel on Climate Change Ethiopian Panel on Climate Change (2015), First Assessment Report, Working Group II Water AGeleto, Silnd Energy; Ethiopian Academy of Sciences: Addis Ababa, Ethiopia, 2015.
- Bantider, A.; Tadesse, B.; Mersha, A.N.; Zeleke, G.; Alemayehu, T.; Nagheeby, M.; Amezaga, J. Voices in Shaping Water Governance: Exploring Discourses in the Central Rift Valley, Ethiopia. Water 2023, 15, 803. [Google Scholar] [CrossRef]
- Hamera, Y.; Ali, M.; Eyasu, E. Land Use/Land Cover Dynamics and Its Impact on Biodiversity Resources in the Abijata Shalla National Park, Central Rift Valley Lakes Region, Ethiopia. Environ. Sci. Ind. J. 2017, 13, 152. [Google Scholar]
- Bedru Sherefa Muzein Remote Sensing & GIS for Land Cover, Land Use Change Detection and Analysis in the Semi-Natural Ecosystems and Agriculture Landscapes of the Central. Ph.D. Thesis, Technische Universität Dresden, Dresden, Germany, 2006; p. 142.
- Gadissa, T.; Nyadawa, M.; Mutua, B.; Behulu, F. Comparative Assessment of the Effect of Climate Change and Human Activities on Streamflow Regimes in Central Rift Valley Basin, Ethiopia. Biol. Environ. Sci. 2019, 7, 23–29. [Google Scholar] [CrossRef]
- Mekuria, W.; Diyasa, M.; Tengberg, A.; Haileslassie, A. Effects of Long-Term Land Use and Land Cover Changes on Ecosystem Service Values: An Example from the Central Rift. Land 2021, 10, 1373. [Google Scholar] [CrossRef]
- Goshime, D.W.; Haile, A.T.; Absi, R.; Ledésert, B. Impact of Water Resource Development Plan on Water Abstraction and Water Balance of Lake Ziway, Ethiopia. Sustain. Water Resour. Manag. 2021, 7, 1–16. [Google Scholar] [CrossRef]
- Hirpo, L.A. Current Ecological Scenario of Some Rift Valley Lakes of Ethiopia: A Review. ECronicon-EC Agric. 2016, 3, 570–580. [Google Scholar]
- Elias, E.; Gessesew, W.S.; Haile, B.T. Impact of Land Use/Cover Changes on Lake Ecosystem of Ethiopia Central Rift Valley. Cogent Food Agric. 2019, 5, 1595876. [Google Scholar] [CrossRef]
- Kebede, E.; Zinabu, G.; Ahlgreni, I. The Ethiopian Rift Valley Lakes: Chemical Characteristics of a Salinity- Alkalinity Series The Ethiopian Rift Valley Lakes: Chemical Characteristics of a Salinity-Alkalinity Series. Hydrobiologia 1994, 288, 1–12. [Google Scholar] [CrossRef]
- CSA. The Federal Democratic Republic of Ethiopia Central Statistical Agency Report; CSA: Addis Ababa, Ethiopia, 2007. [Google Scholar]
- Hurni, H. Agroecological Belts of Ethiopia; BERNE: Hong Kong, China, 1998. [Google Scholar]
- Pascual-Ferrer, J.; Pérez-Foguet, A.; Codony, J.; Raventós, E.; Candela, L. Assessment of Water Resources Management in the Ethiopian Central Rift Valley: Environmental Conservation and Poverty Reduction. Int. J. Water Resour. Dev. 2014, 30, 572–587. [Google Scholar] [CrossRef]
- Geleta, Y.; Simane, B.; Assefa, E.; Haileslassie, A. Impacts of Small-Scale Irrigation Water Use on Environmental Flow of Ungauged Rivers in Africa. Environ. Syst. Res. 2023, 12, 1–18. [Google Scholar] [CrossRef]
- Tufa, D.F.; Abbulu, Y.; Rao, G.V.R. Hydrological impacts due to land-use and land-cover changes of ketar watershed, lake ziway catchment, Ethiopia. Int. J. Civ. Eng. Tech. 2015, 6, 36–45. [Google Scholar]
- AZILDO. Arsi Zone Irrigation and Livestock Developemnt Report; AZILDO: Asella, Ethiopia, 2021. [Google Scholar]
- Ioris, A.A.R. The Value of Water Values: Departing from Geography towards an Interdisciplinary Synthesis. Geogr. Ann. Ser. B Hum. Geogr. 2013, 95, 323–337. [Google Scholar] [CrossRef]
- Rogers, B.P.; Hall, A.W. Effective Water Governance; Global Water Partnership: Stockholm, Sweden, 2003; ISBN 9197401293. [Google Scholar]
- Bos, M.G.; Nugteren, J. On Irrigation Efficiencies. ILRI Publ. 1990, 19, 120. [Google Scholar]
- FDRE. Ten Years Development Plan: A Pathway to Prosperity; Federal Democratic Republic of Ethiopia: Addis Ababa, Ethiopia, 2021; Volume 2. [Google Scholar]
- ECoM Ethiopian Council of Ministers. Proclamation No. 1263/2021 Definition of Powers and Duties of the Executive Organs Proclamation. 2021. Available online: https://www.lawethiopia.com/index.php/volume-3/6747-proclamation-no-1263-2021-definition-of-powers-and-duties-of-the-executive-organs-proclamation (accessed on 1 June 2023).
- MOA. Ten Year Strategic Plan; Ethiopiian Minsitry of Agriculture: Addis Ababa, Ethiopia, 2022.
- EEPA. Environmental Policy; Ethiopian Environmental Protection Authority: Addis Ababa, Ethiopia, 1997; p. 31.
- Hailu, R.; Tolossa, D.; Alemu, G. Water Institutions in the Awash Basin of Ethiopia: The Discrepancies between Rhetoric and Realities Water Institutions in the Awash Basin of Ethiopia: The Discrepancies between Rhetoric and Realities. Intl. J. River Basin Manag. 2017, 16, 107–121. [Google Scholar] [CrossRef]
- FDRE. Irrigation Water Users’ Associations Proclamation; No. 841/2014; Federal Democratic Republic of Ethiopia: Addis Ababa, Ethiopia, 2014; p. 27. [Google Scholar]
- Heinrichs, D.H.; Rojas, R. Cultural Values in Water Management and Governance: Where Do We Stand? Water 2022, 14, 803. [Google Scholar] [CrossRef]
- Desta, H.; Lemma, B.; Stellmacher, T.; Gebremariam, E. Water Use and Management of Lake Ziway and Its Watershed, Ethiopia: The Perception of Experts Vis-à-Vis the Latest State of Research. Environ. Dev. Sustain. 2019, 22, 3621–3640. [Google Scholar] [CrossRef]
- FDRE. Constitution of the Federal Democratic Republic of Ethiopia. Fed. Negarit Gaz. 1995, 1, 21. [Google Scholar]
- HLPW Bellagio Principles on Valuing Water. 2017. Available online: https://sdgs.un.org/documents/bellagio-principles-valuing-water-22818 (accessed on 1 June 2023).
- Haileslassie, A.; Ludi, E.; Roe, M.; Button, C. Water Values: Discourses and Perspective. Clean Water Sanit. 2020, 5, 946–955. [Google Scholar] [CrossRef]
- Harris, G.P.; Heathwaite, A.L. Why Is Achieving Good Ecological Outcomes in Rivers so Difficult? Freshw. Biol. 2012, 57, 91–107. [Google Scholar] [CrossRef]
- Corneil, D.; Villeneuve, B.; Piffady, J.; Chandesris, A.; Usseglio-Polatera, P.; Souchon, Y. Introducing Nested Spatial Scales in Multi-Stress Models: Towards Better Assessment of Human Impacts on River Ecosystems. Hydrobiologia 2018, 806, 347–361. [Google Scholar] [CrossRef]
- Peck, M.; Khirfan, L. Improving the Validity and Credibility of the Sociocultural Valuation of Ecosystem Services in Amman, Jordan. Ecol. Econ. 2021, 189, 107111. [Google Scholar] [CrossRef]
- Kuruppu, N. Adapting Water Resources to Climate Change in Kiribati: The Importance of Cultural Values and Meanings. Environ. Sci. Policy 2009, 12, 799–809. [Google Scholar] [CrossRef]
- Crang, M.; Cook, I. Doing Ethnographies; SAGE Publications Ltd.: London, UK, 2007; ISBN 9780761944454. [Google Scholar]
- Descheemaeker, K.; Amede, T.; Haileslassie, A. Improving Water Productivity in Mixed Crop—Livestock Farming Systems of Sub-Saharan Africa. Agric. Water Manag. 2010, 97, 579–586. [Google Scholar] [CrossRef]
- Doorenbos, J.; Pruitt, W.O. Guidelines for Predicting Crop Water Requirements. FAO Irrig. Drain. Pap. 1977, 24, 144. [Google Scholar]
- Van Halsema, G.E.; Keddi Lencha, B.; Assefa, M.; Hengsdijk, H.; Wesseler, J. Performance Assessment of Smallholder Irrigation in the Central Rift Valley of Ethiopia. Irrig. Drain. 2011, 60, 622–634. [Google Scholar] [CrossRef]
- Sileshi, Z.; Tegegne, A.; Tsadik, G.T. Water Resources for Livestock in Ethiopia: Implications for Research and Development. Integr. Water Land Manag. Res. Capacit. Build. Priorities Ethiop. 2003, 66, 66–79. [Google Scholar]
- Jacobson, P.C.; Cross, T.K.; Dustin, D.L.; Duval, M. Stream Hydrology An Introduction for Ecologists; John Wiley and Sons: New Jersey, NJ, USA, 2016; Volume 41, ISBN 0470843578. [Google Scholar]
- Karakoyun, Y.; Yumurtaci, Z.; Dönmez, A.H. Environmental Flow Assessment Methods: A Case Study. In Exergetic, Energetic and Environmental Dimensions; Academic Press: Cambridge, MA, USA, 2018; pp. 1061–1074. [Google Scholar] [CrossRef]
- King, J.; Brown, C.; Sabet, H. A Scenario-Based Holistic Approach to Environmental Flow Assessment for Rivers. River Res. Appl. 2003, 19, 619–639. [Google Scholar] [CrossRef]
- Poff, N.L.R.; Tharme, R.E.; Arthington, A.H. Evolution of Environmental Flows Assessment Science, Principles, and Methodologies; Elsevier: Amsterdam, The Netherlands, 2017; ISBN 9780128039458. [Google Scholar]
- Reitberger, B.; Mccartney, M. Nile River Basin. In Nile River Basin; Springer: Dordrecht, The Netherlands, 2011. [Google Scholar] [CrossRef]
- Tharme, R.E. A Global Perspective on Environmental Flow Assessment: Emerging Trends in the Development and Application of Environmental Flow Methodologies for Rivers. River Res. Appl. 2003, 19, 397–441. [Google Scholar] [CrossRef]
- Arthington, A.H.; Bhaduri, A.; Bunn, S.E.; Jackson, S.E.; Tharme, R.E.; Tickner, D.; Young, B.; Acreman, M.; Baker, N.; Capon, S.; et al. The Brisbane Declaration and Global Action Agenda on Environmental Flows (2018). Front. Environ. Sci. 2018, 6, 45. [Google Scholar] [CrossRef]
- Sedighkia, M.; Abdoli, A.; Datta, B. Optimizing Monthly Ecological Flow Regime by a Coupled Fuzzy Physical Habitat Simulation–Genetic Algorithm Method. Environ. Syst. Decis. 2021, 41, 425–436. [Google Scholar] [CrossRef]
- Acreman, M.; Dunbar, M.; Hannaford, J.; Mountford, O.; Wood, P.; Holmes, N.; Cowx, I.A.N.; Noble, R.; Extence, C.; Aldrick, J.; et al. Developing Environmental Standards for Abstractions from UK Rivers to Implement the EU Water Framework Directive/Développement de Standards Environnementaux Sur Les Prélèvements d’... Developing Environmental Standards for Abstractions from UK Rivers T. Hydrol. Sci. J. 2008, 53, 1105–1120. [Google Scholar] [CrossRef]
- Hart, B.; Chan, T. Bayesian Network Models for Environmental Flow Decision-Making: 1. Latrobe River Australia bayesian network models for environmental flow decision-making. River Res. Appl. 2011, 27, 283–296. [Google Scholar] [CrossRef]
- Sieber, J.; Purkey, D. WEAP User Guide; Stockholm Environment Institute, U.S. Center: Somerville, MA, USA, 2015; 400p. [Google Scholar]
- Houston, S. Reflecting on Habitus, Field and Capital: Towards a Culturally Sensitive Social Work. J. Soc. Work 2002, 2, 149–167. [Google Scholar] [CrossRef]
- Gebretsadik, T. Threats and Opportunities to Major Rift Valley ¡H Lakes Wetlands of Ethiopia. Agric. Res. Technol. Open Access J. 2017, 9, 1–6. [Google Scholar] [CrossRef]
- Arias-Arévalo, P.; Martín-López, B.; Gómez-Baggethun, E. Exploring Intrinsic, Instrumental, and Relational Values for Sustainable Management of Social-Ecological Systems. Ecol. Soc. 2017, 22, 43. [Google Scholar] [CrossRef]
- McClain, M.E.; Kashaigili, J.J.; Ndomba, P. Environmental Flow Assessment as a Tool for Achieving Environmental Objectives of African Water Policy, with Examples from East Africa. Int. J. Water Resour. Dev. 2013, 29, 650–665. [Google Scholar] [CrossRef]
- Agathe Euzen and Barbara Morehouse Water: What Values? Policy Soc. 2011, 30, 237–247. [CrossRef]
- Giacoman, C. The Dimensions and Role of Commensality: A Theoretical Model Drawn from the Significance of Communal Eating among Adults in Santiago, Chile. Appetite 2016, 107, 460–470. [Google Scholar] [CrossRef] [PubMed]
- Merga, L.B.; Mengistie, A.A.; Faber, J.H.; Van den Brink, P.J. Trends in Chemical Pollution and Ecological Status of Lake Ziway, Ethiopia: A Review Focussing on Nutrients, Metals and Pesticides. Afr. J. Aquat. Sci. 2020, 45, 386–400. [Google Scholar] [CrossRef]
- Haile, M.Z.; Mohammed, E.T. Evaluation of the Current Water Quality of Lake Hawassa, Ethiopia. Int. J. Water Resour. Environ. Eng. 2019, 11, 120–128. [Google Scholar] [CrossRef]
- Gleick, P.H. Water Use. Annu. Rev. Environ. Resour. 2003, 28, 275–314. [Google Scholar] [CrossRef]
- Agide, Z.; Haileslassie, A.; Sally, H.; Erkossa, T.; Schmitter, P.; Langan, S.; Hoekstra, D. Analysis of Water Delivery Performance of Smallholder Irrigation Schemes in Ethiopia: Diversity and Lessons across Schemes, Typologies and Reaches. LIVES Work. Pap. 2016, 15, 38. [Google Scholar]
- AZILDO. Arsi Zone Irrigation and Livestock Developemnt; AZILDO: Asella, Ethiopia, 2017. [Google Scholar]


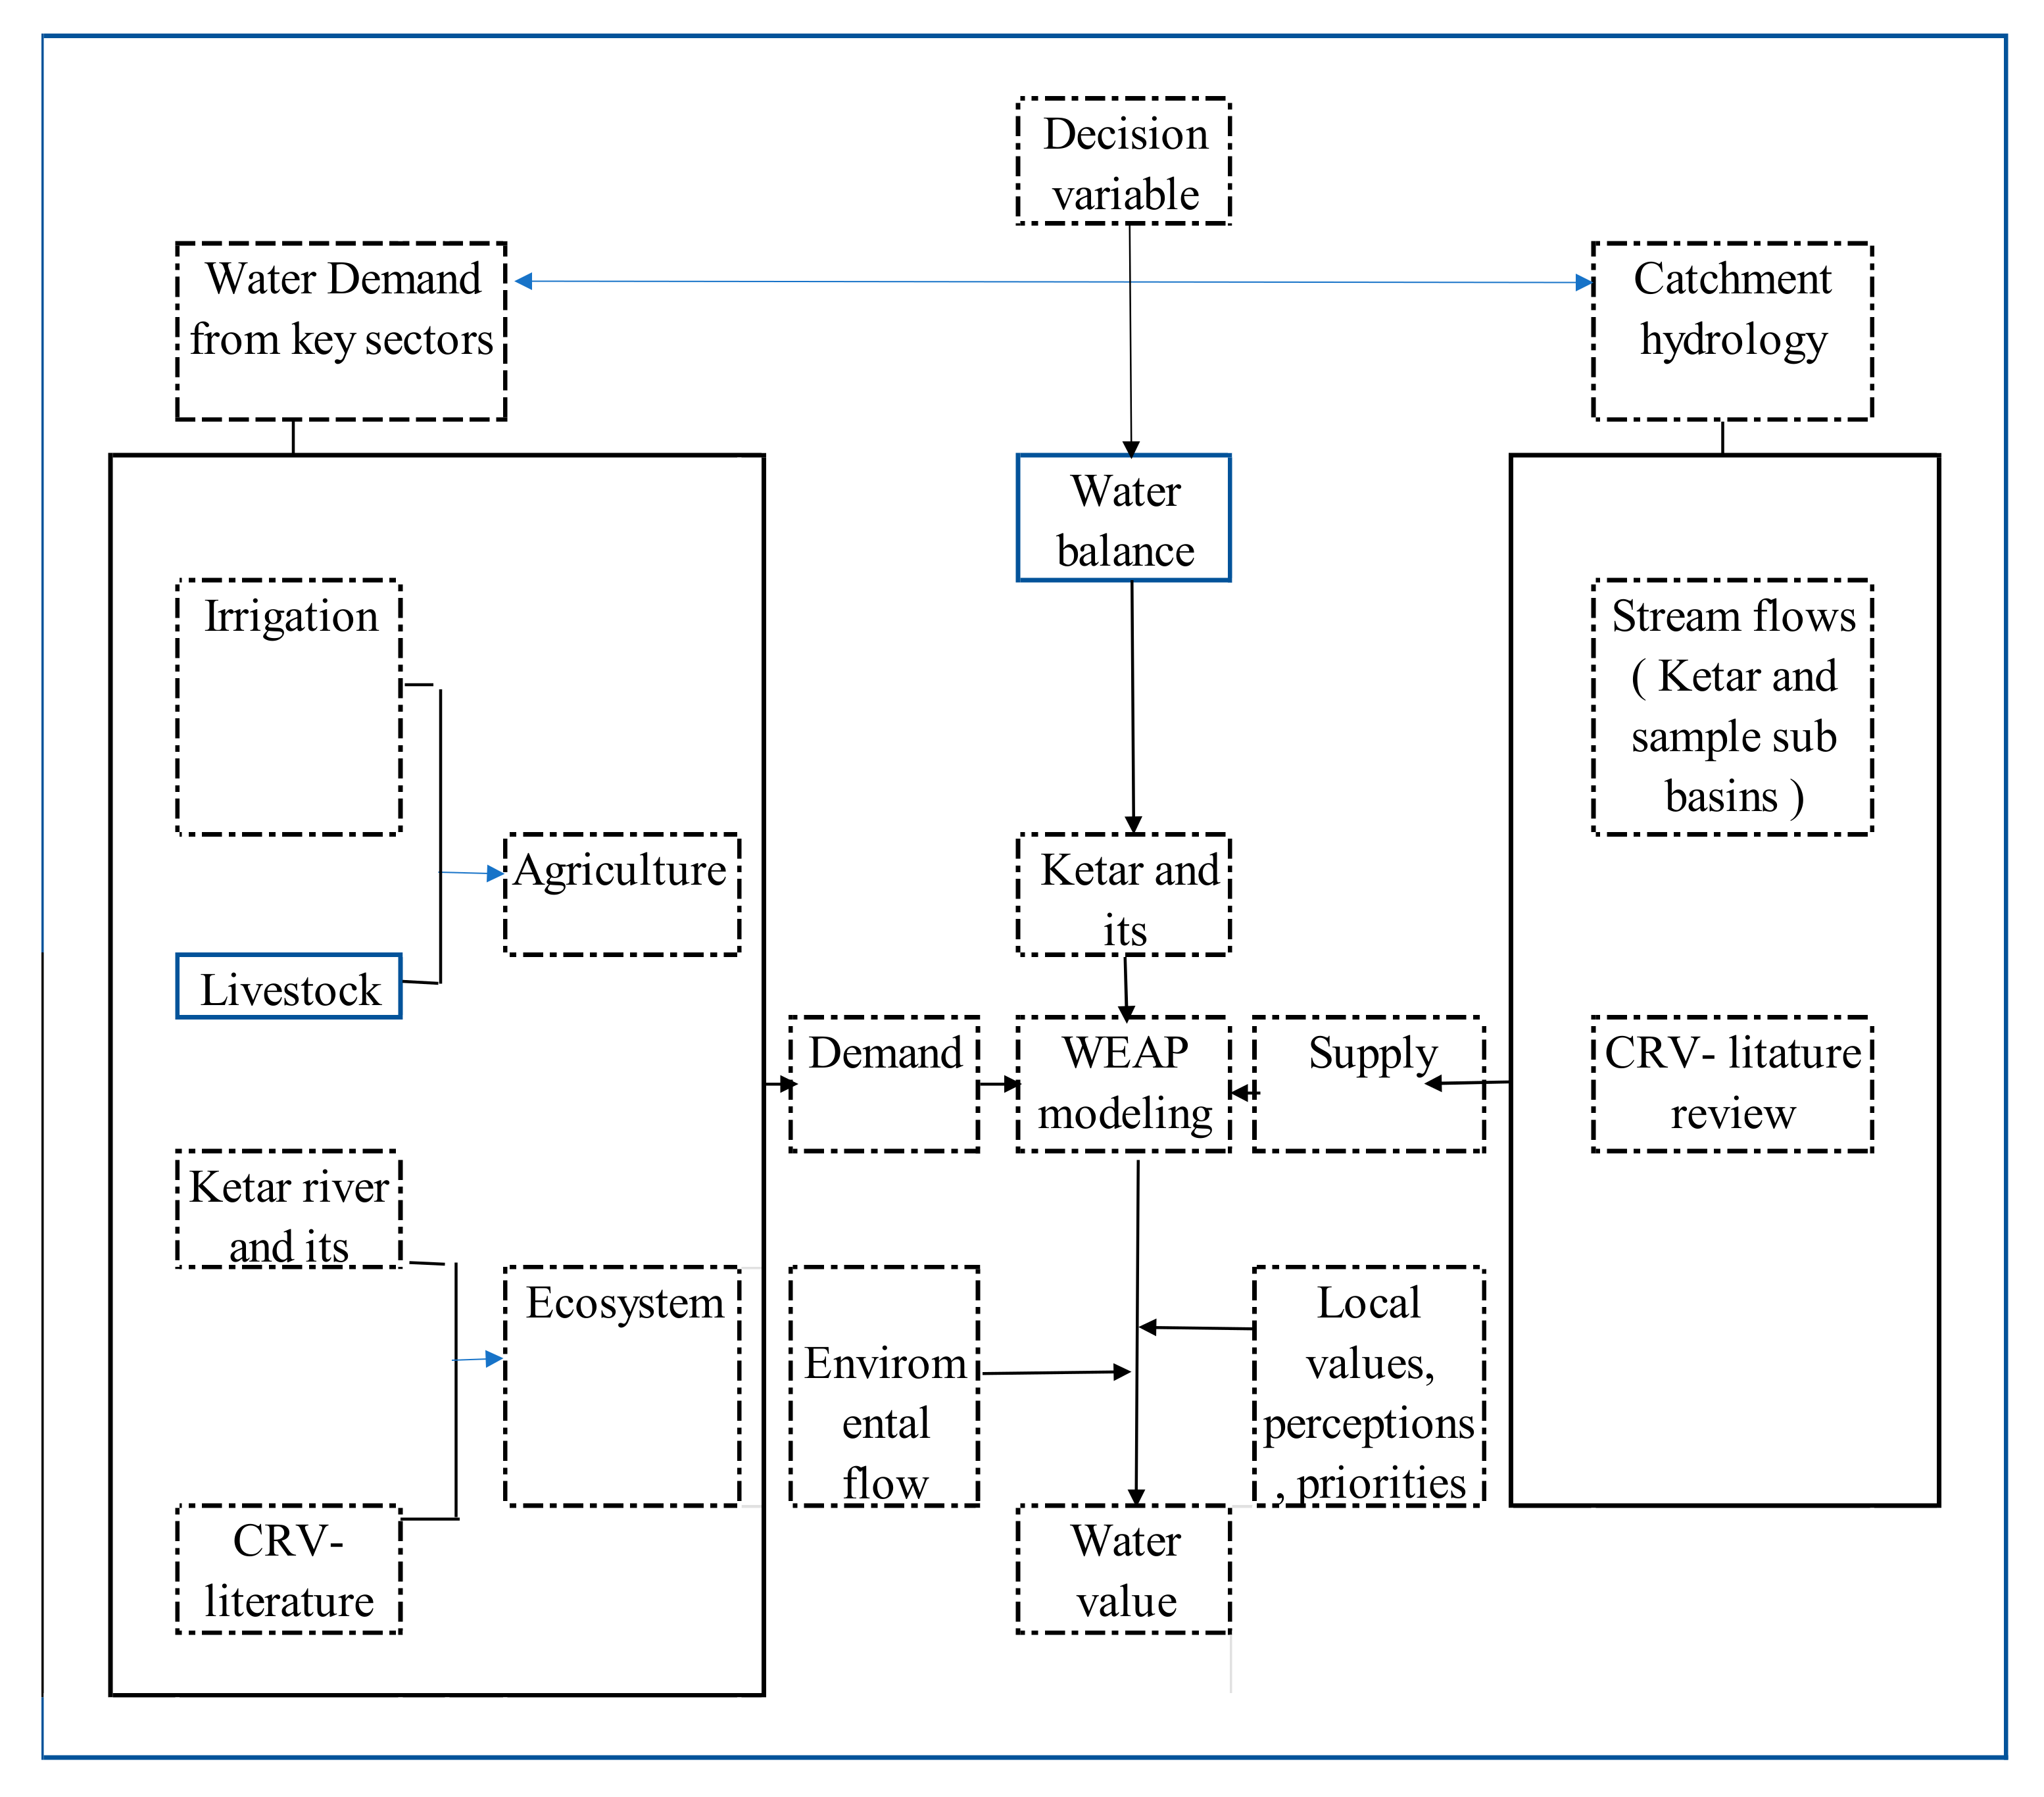
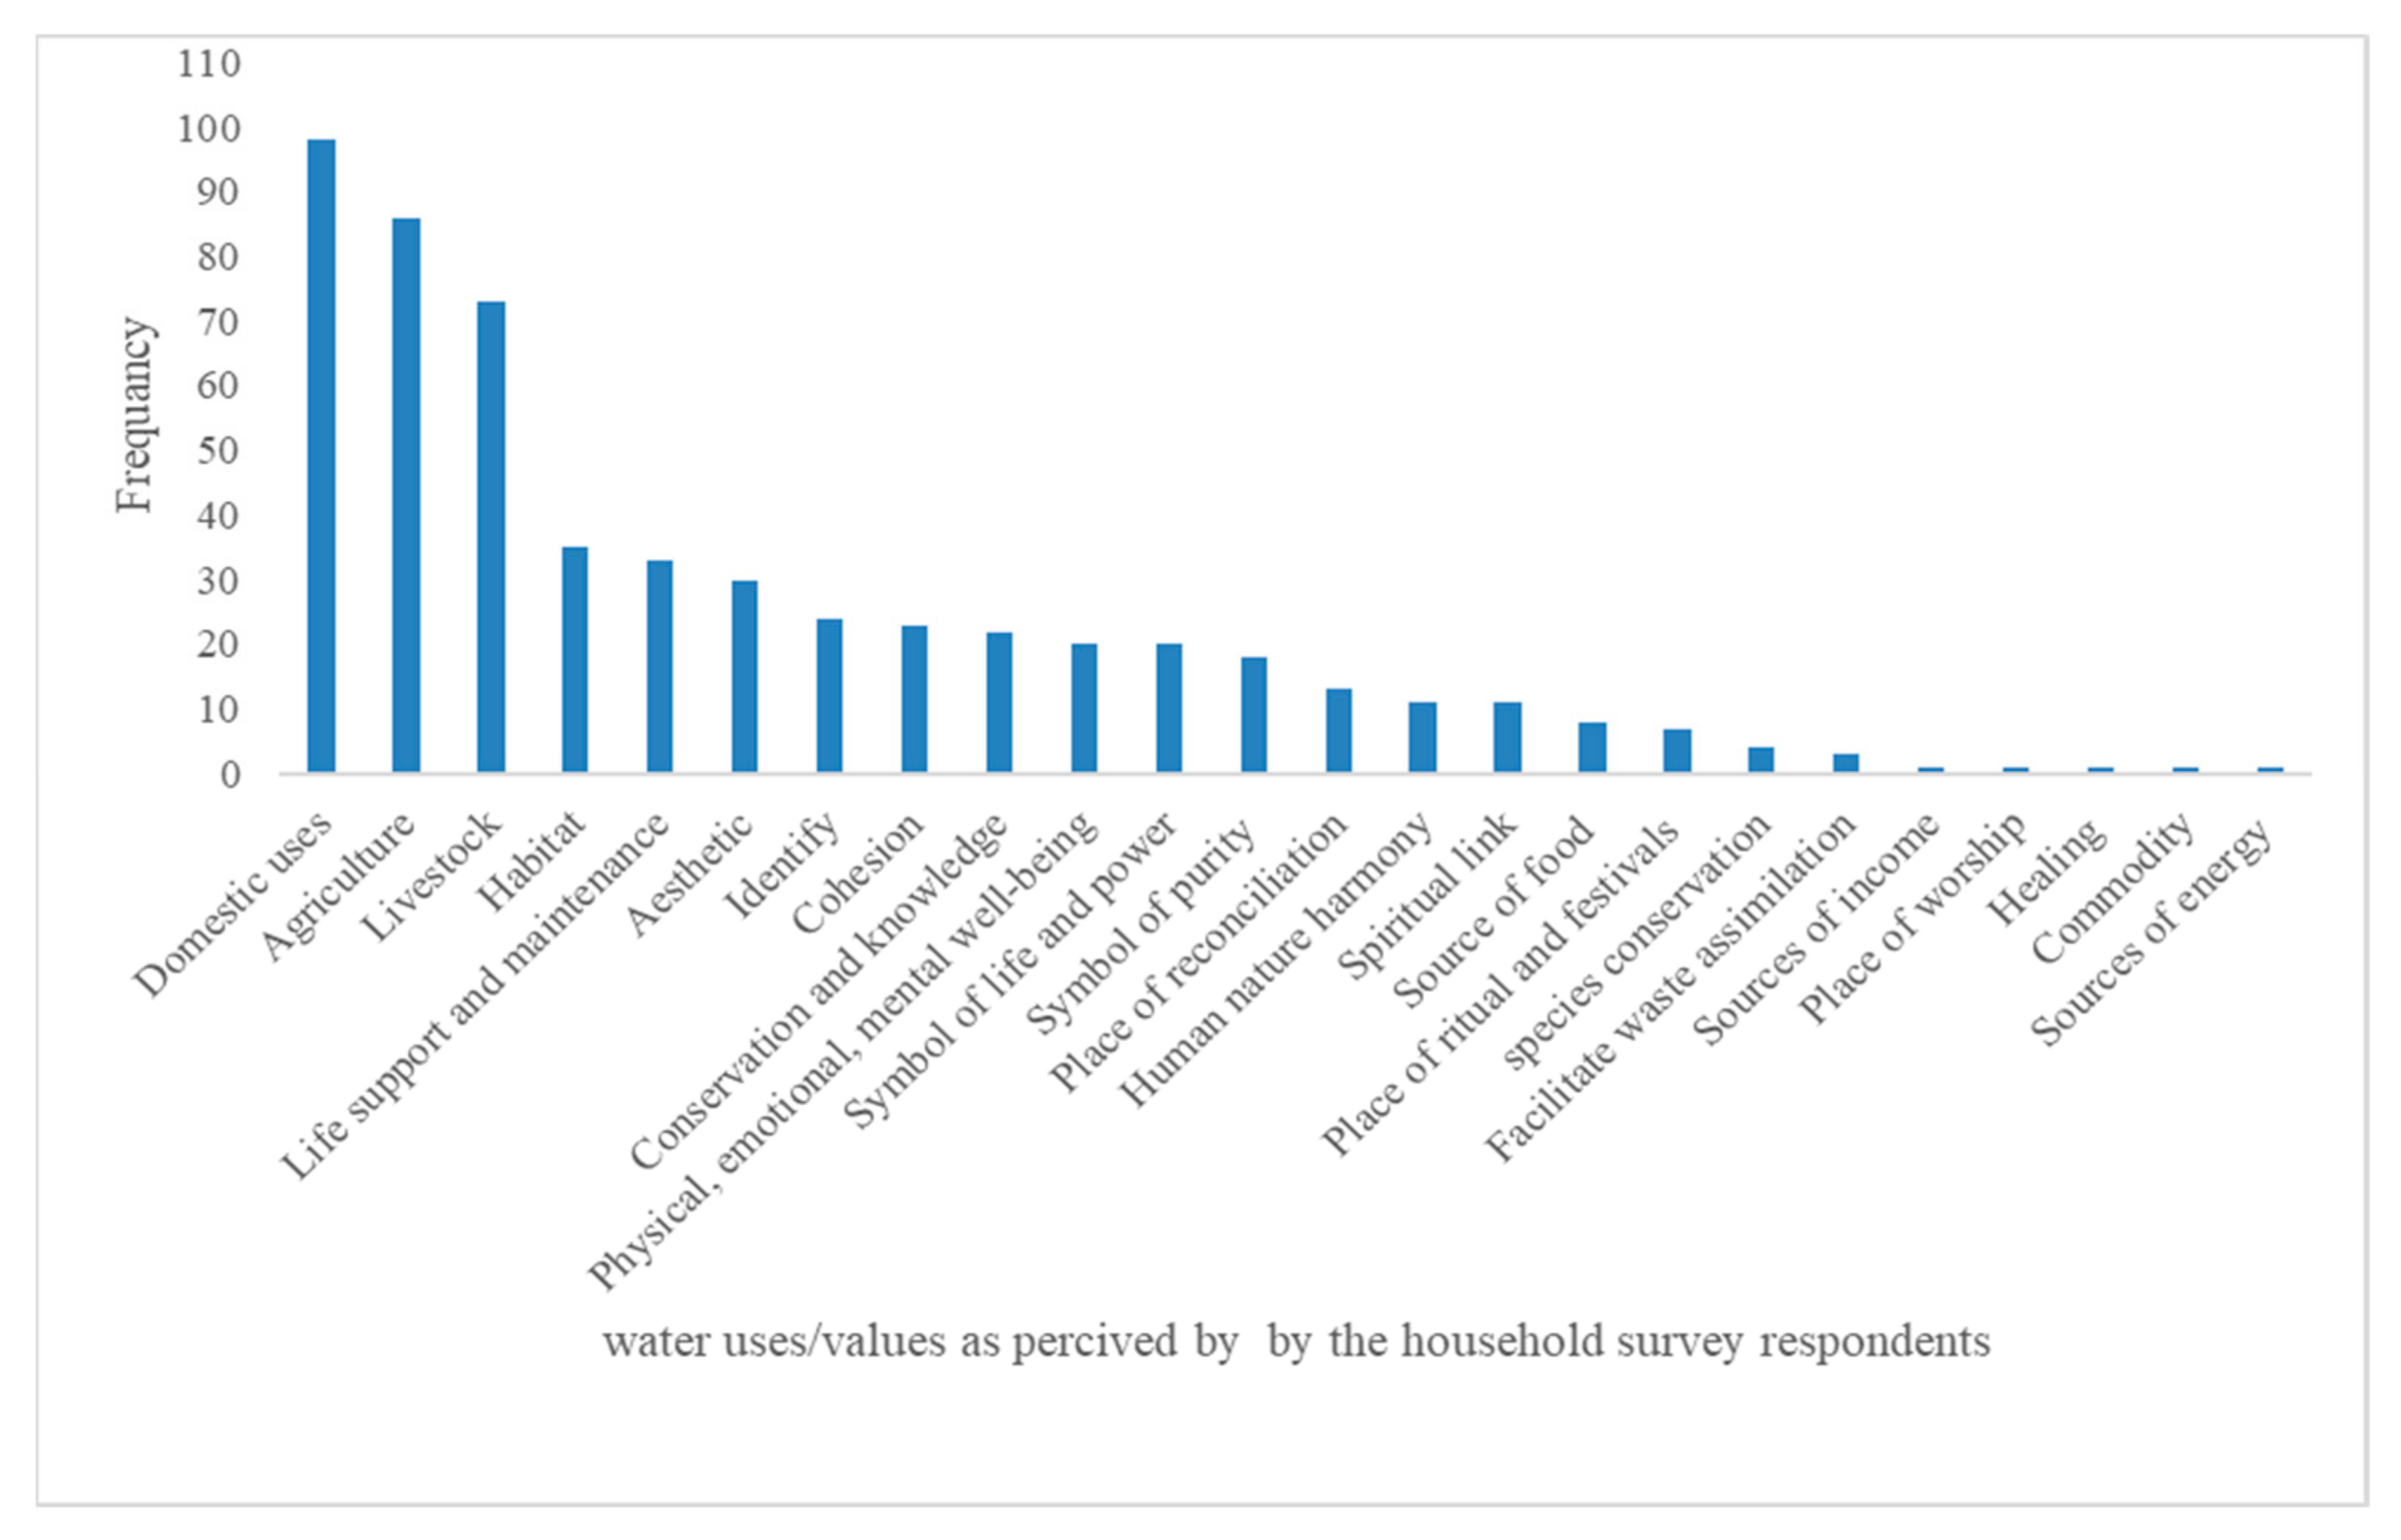


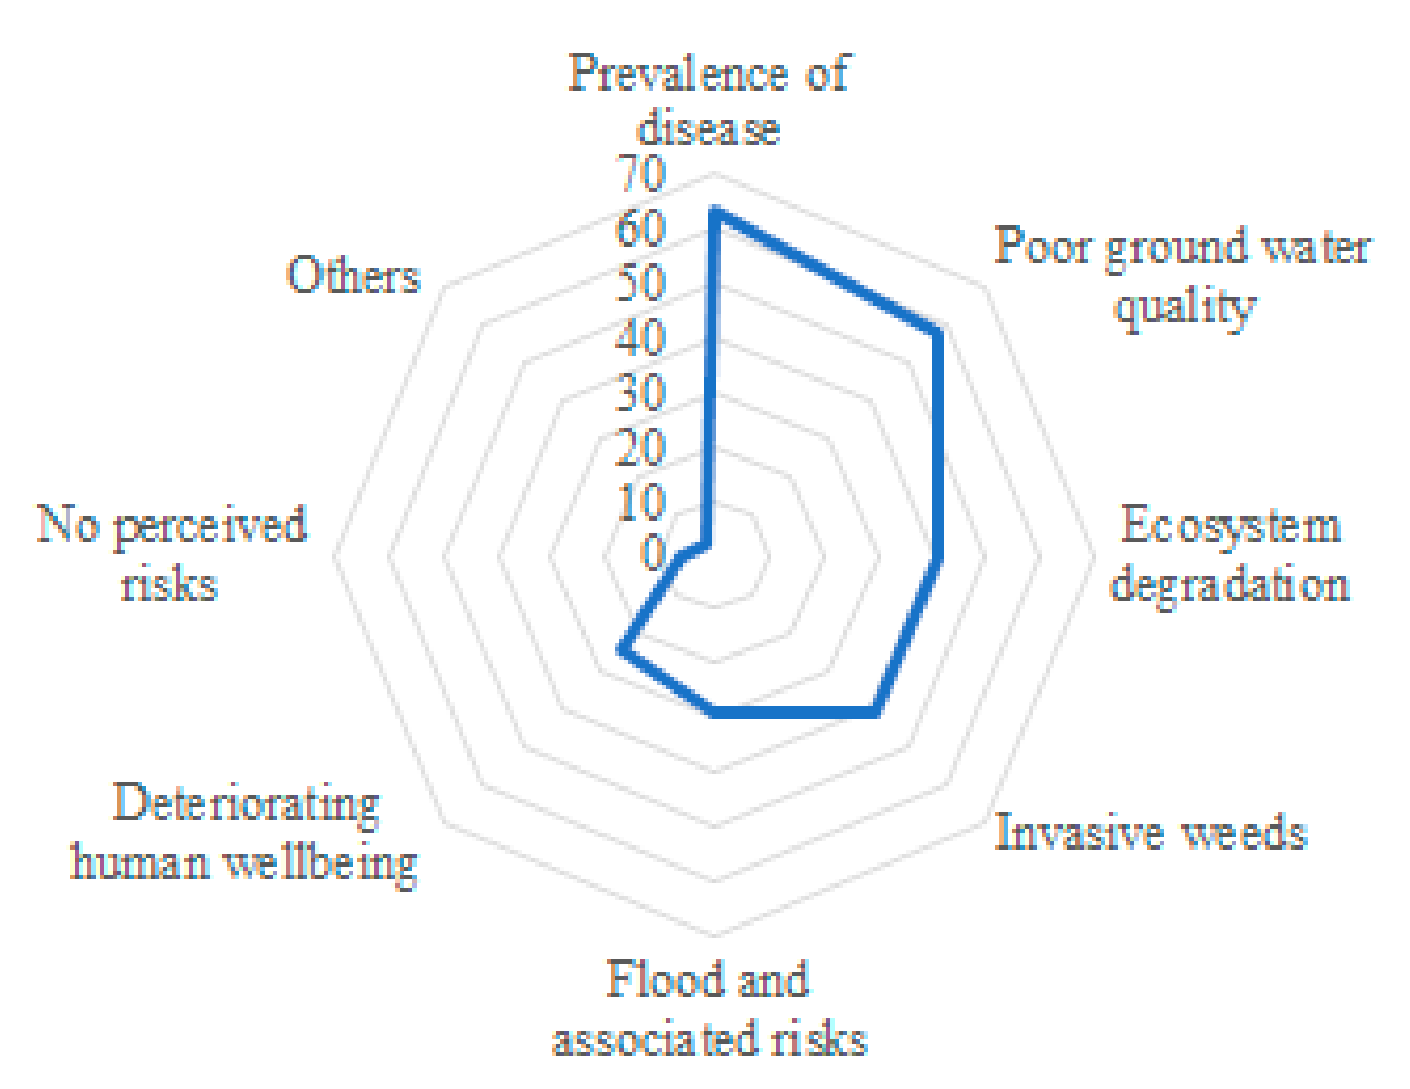
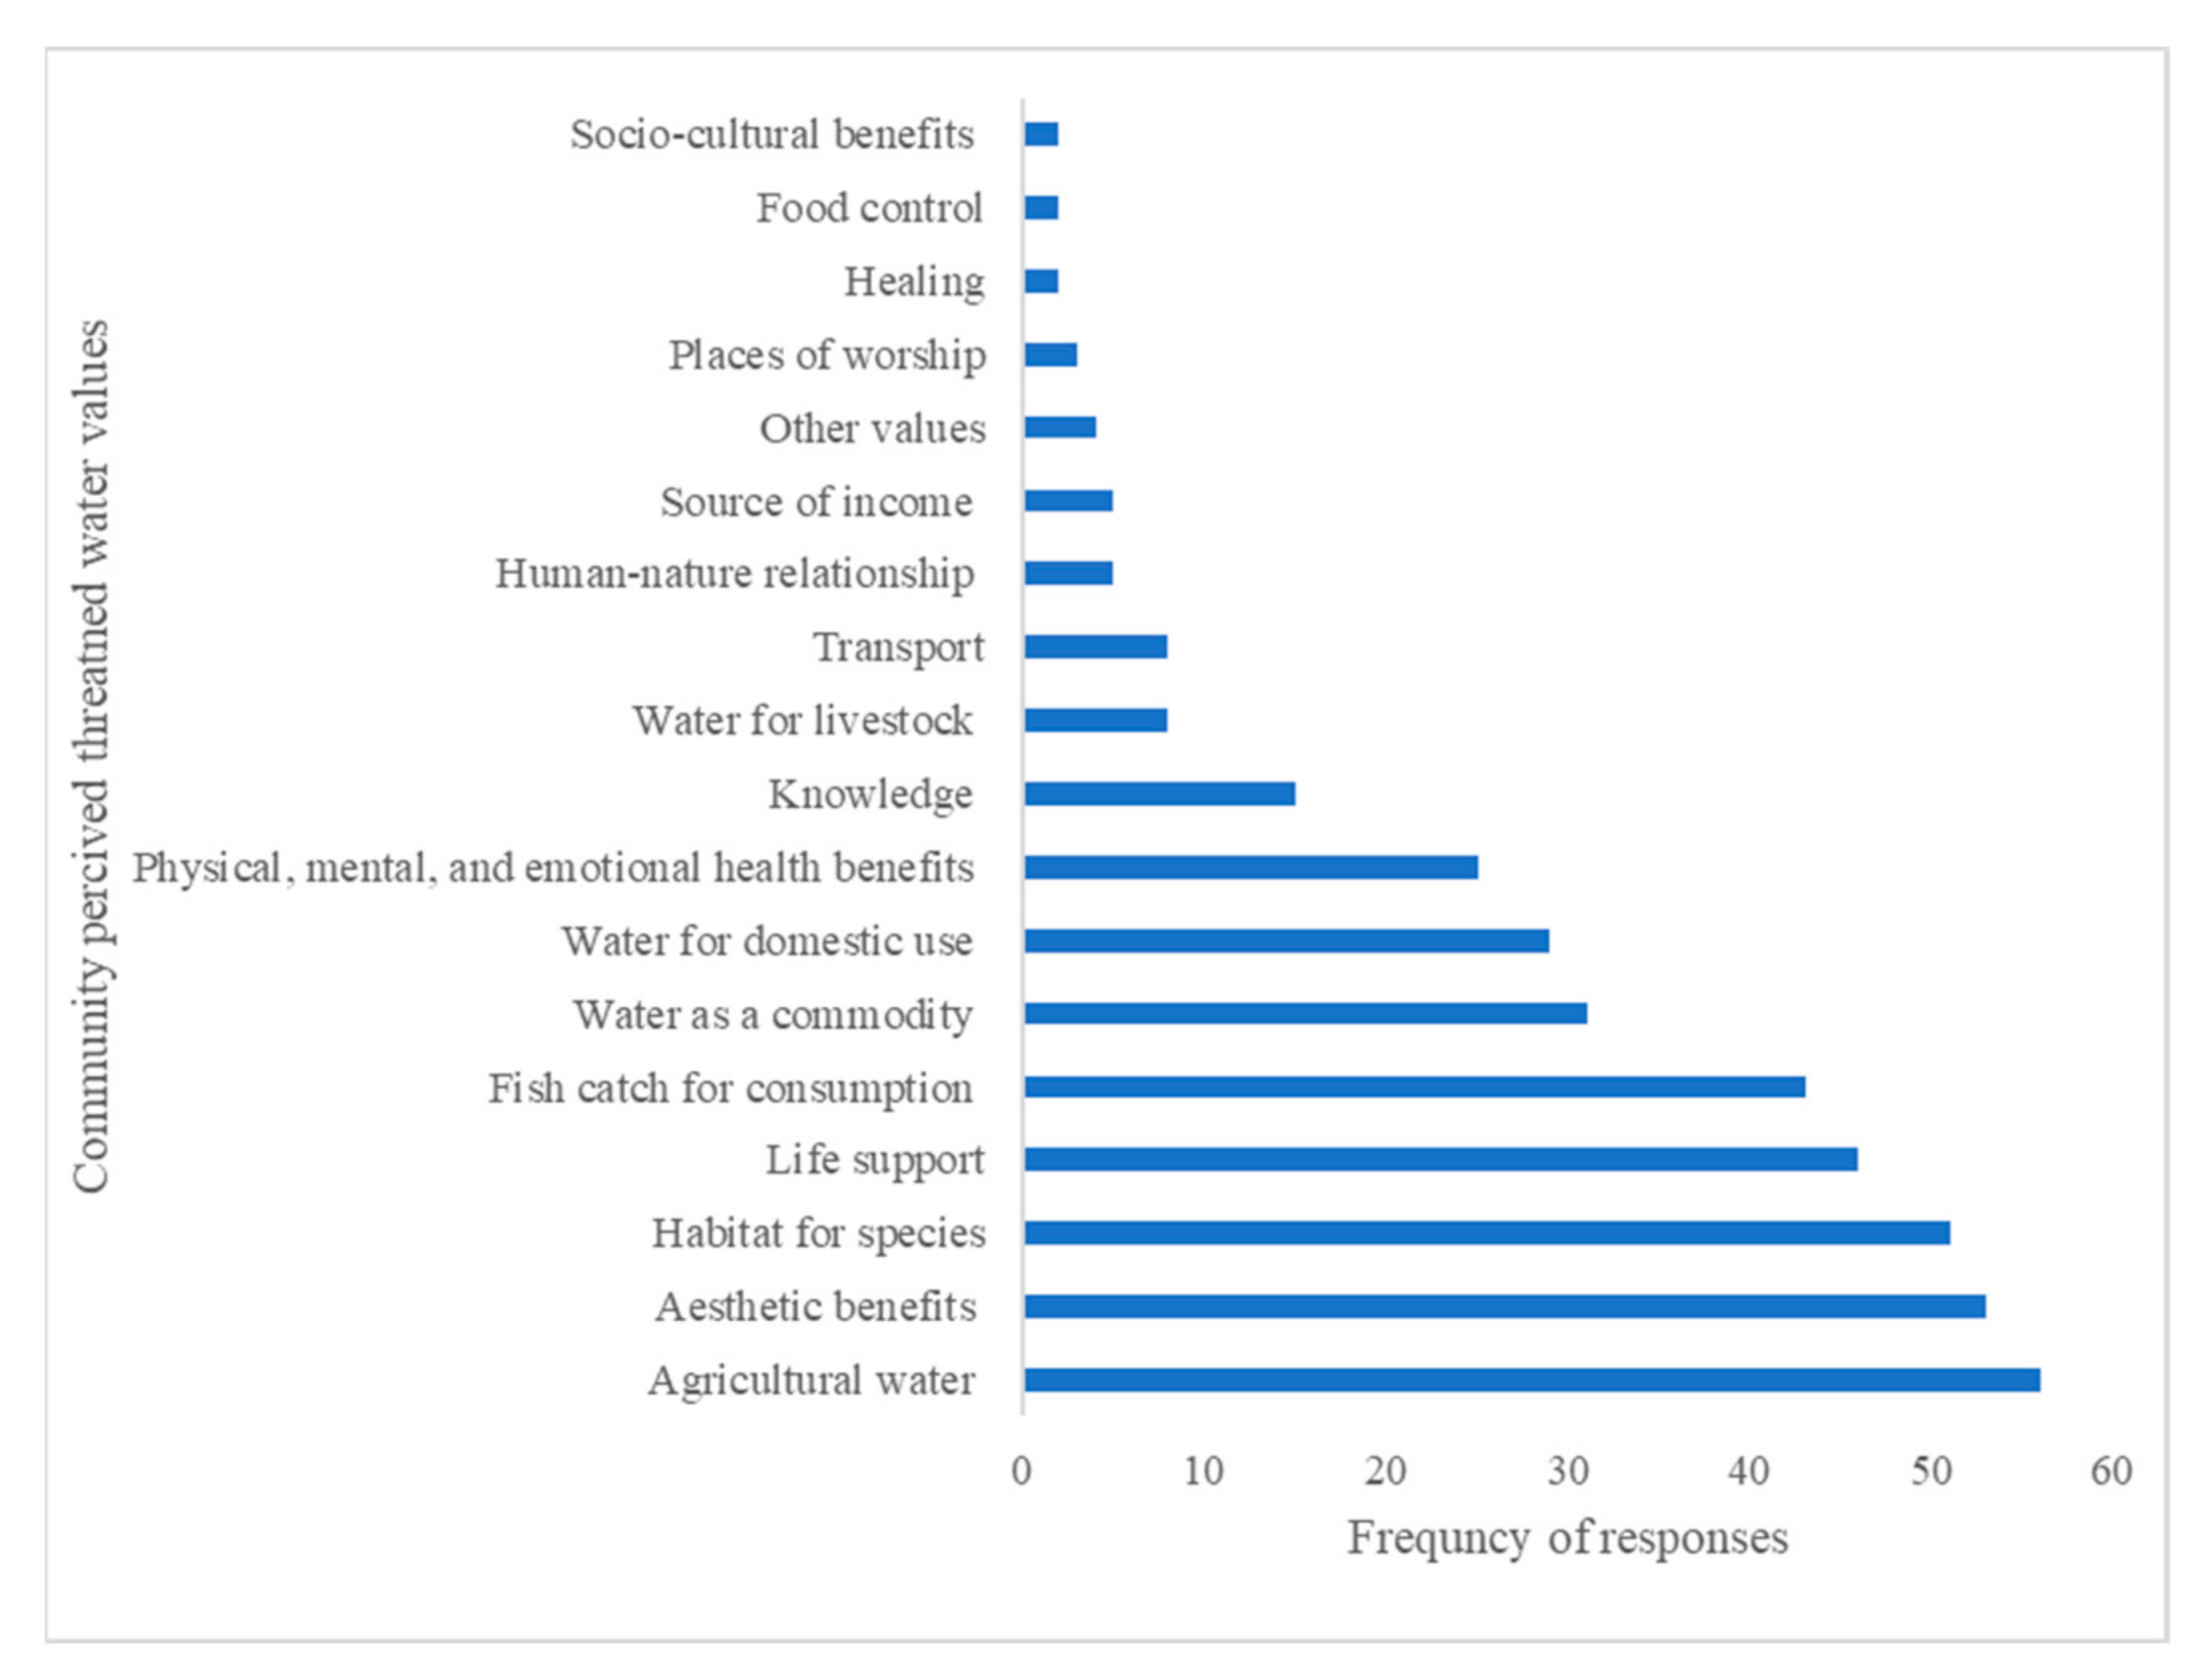
Disclaimer/Publisher’s Note: The statements, opinions and data contained in all publications are solely those of the individual author(s) and contributor(s) and not of MDPI and/or the editor(s). MDPI and/or the editor(s) disclaim responsibility for any injury to people or property resulting from any ideas, methods, instructions or products referred to in the content. |
© 2023 by the authors. Licensee MDPI, Basel, Switzerland. This article is an open access article distributed under the terms and conditions of the Creative Commons Attribution (CC BY) license (https://creativecommons.org/licenses/by/4.0/).