Article

Simulation of Hydrological Processes in the Jing River Basin Based on the WEP Model

1
Henan Yellow River Hydrological Survey and Design Institute, Zhengzhou 450001, China
2
College of Water Resources and Civil Engineering, Zhengzhou University, Zhengzhou 450001, China
*
Author to whom correspondence should be addressed.
Water 2023, 15(16), 2989; https://doi.org/10.3390/w15162989
Submission received: 29 June 2023 / Revised: 7 August 2023 / Accepted: 16 August 2023 / Published: 18 August 2023

Abstract

:
Inappropriate vegetation reconstruction in the Loess Plateau region has led to a significant increase in regional evapotranspiration and water consumption, further aggravating the shortage of soil water resources in the Loess Plateau region. The Jing River basin is a typical area for vegetation reconstruction in the Loess Plateau region. A thorough understanding of changes in hydrological processes in the Jing River basin is of significant scientific importance for efficient utilization of soil water resources and sustainable vegetation restoration in the region. In this study, the physically based Water and Energy Transfer Processes (WEP) distributed hydrological model was used to simulate key hydrological processes in the Jing River Basin during different periods before and after the implementation of cropland conversion to forest and grassland from 1980 to 2019. The results showed that after the implementation of cropland conversion to forest and grassland from 2000 to 2019, the average runoff volume in the Jing River Basin decreased by 20.91%. The most significant decrease in average runoff occurred in the central and northern parts of the basin, with a maximum reduction of 48.6%. The decrease in runoff in flood season is more obvious. The peak discharge decreased by 24.91%, and the most significant decrease occurred in the northern and central parts of the basin, ranging from 10.3% to 50.2%. The spatial distribution pattern of average soil moisture in the 0–0.8 m soil layer showed more moisture in the south and less in the north, with the minimum value occurring in certain areas in the eastern part of the basin. Overall, the implementation of cropland conversion to forest and grassland led to a certain degree of decrease in soil moisture in the basin. After the implementation of cropland conversion to forest and grassland, reference evapotranspiration fluctuated only in specific areas of the basin with no significant overall change.

1. Introduction

The vegetation restoration on the Loess Plateau has a significant impact on watershed hydrological processes, soil moisture balance, and regional water resource dynamics. [1,2]. In recent decades, ecological restoration and vegetation reconstruction in the Yellow River Basin have received considerable attention, and the government has initiated a series of major ecological construction projects [3,4]. Major research programs on ecological environmental protection have been carried out successively by the Ministry of Science and Technology, the Ministry of Water Resources, the Ministry of Environmental Protection, and the National Natural Science Foundation [5,6]. These projects and research programs have focused on vegetation restoration and reconstruction, aiming to promote the benign development of regional eco-hydrological processes [7,8]. However, large-scale vegetation reconstruction inevitably leads to a sharp increase in regional evapotranspiration and exacerbates the water scarcity situation, resulting in a sharp reduction in runoff in the Yellow River Basin. For example, at the Huayuankou section, the runoff volume decreased from 559 × 108 m3/year in the 1970s to 452 × 108 m3/year in the period of 2010–2015 [9]. On the other hand, in recent years, the average annual temperature in the Loess Plateau has shown a significant upward trend, with an average warming rate of 0.033 °C/year. In the past 40 years, the temperature has increased by approximately 1.32 °C, which is much higher than the global average (0.013 °C/year) and the Chinese average (0.022 °C/year), indicating a pronounced climate warming trend [10].
In the already water-scarce Yellow River Basin, implementing such large-scale vegetation restoration in the context of regional climate warming raises concerns about its sustainability. Indeed, the increase in forest and grassland cover could potentially alter hydrological processes in the basin and subsequently affect regional water resources [11,12]. In 2019, the journal Nature also raised concerns that China’s afforestation efforts could exacerbate water scarcity [13]. Finding ways to ensure the sustainable and healthy development of cropland conversion to forest and grassland projects depends on understanding the regulatory mechanisms between land cover changes and water resources. This is a key topic of interest in the field of eco-hydrology, both nationally and internationally [14,15].
The hydrological processes in a watershed refer to the transformation and movement of water in various forms within the watershed under the influence of solar radiation and gravitational forces. The hydrological processes in a watershed have a significant impact on both the socio-economic development and the ecological development of the watershed. In recent years, there have been profound changes in hydrological processes in watersheds due to the intensified influence of climate change and human activities. At present, the methods for studying hydrological processes in watersheds mainly include the experimental watershed comparison method, the lumped hydrological model method, and the distributed hydrological model method [16,17]. Among them, the use of watershed hydrological models to simulate hydrological processes is a widely applied and effective approach. Watershed hydrological models are classified into lumped hydrological models and distributed hydrological models based on whether they consider the spatial distribution of hydrological variables. Representative models of lumped hydrological models include the Xin’anjiang model [18,19,20] and the full storage-overflow-infiltration compatible model [21,22]. Distributed hydrologic models with physical mechanisms are suitable for different watershed scales and complex land surfaces. They can reflect the spatial distribution of hydrological variables and land surface characteristics within the watershed. Therefore, they are widely used in the study of the simulation of hydrological processes in watersheds, especially in the study of the spatial distribution characteristics of hydrological variables. Currently, representative physically-based distributed hydrologic models include the SWAT model and the WEP model. Both the SWAT model and the WEP model have good applicability in watersheds with complex hydrological conditions, such as the Yangtze River Basin and the Huai River Basin, and in watersheds with complex and variable land surfaces, such as the Yellow River Basin and the Loess Plateau region.
The WEP model is a physically based distributed hydrological model developed by the State Key Laboratory of Simulation and Regulation of Water Cycle in River Basins, China Institute of Water Resources and Hydropower Research [18,19,20]. Its development is based on the concept of a coupled natural-social water cycle, and it has been successfully applied in numerous watersheds. It shows strong applicability for simulating hydrological processes under changing conditions. Su et al. (2021) [21] used the WEP model to simulate the effects of land use/land cover changes and climate change on runoff processes in the Songhua River Basin, Heihe River Basin, Yellow River Basin, Yangtze River Basin, and Yarlung Zangbo River Basin. The results indicated successful applications of the WEP model in these basins, with climate change being the dominant factor influencing changes in runoff. Gan et al. (2023) [22] used the WEP model to simulate rainfall infiltration processes in the Heihe River Basin, a sub-basin of the Jing River Basin. The model showed good accuracy in simulating rainfall infiltration and soil moisture dynamics. Zhou et al. (2022) [23] used the WEP model to simulate the long-term river discharge in the Yellow River Basin from 1956 to 2016 and evaluated the evolution characteristics of the discharge in different sub-basins. The results showed a high level of simulation accuracy and highlighted that the indirect effects of increased regional evapotranspiration and vadose zone water retention due to human activities outweighed the direct effects of decreased precipitation and increased evapotranspiration caused by climate change.
The WEP model uses a nested isohyetal approach to construct a spatial model of subwatersheds that better accounts for the influence of terrain undulations. It uses different evapotranspiration calculation methods for different land cover types and can simulate both surface runoff and infiltration runoff based on rainfall patterns. It shows superior performance in the Loess Plateau region. Currently, research using the WEP model to simulate watershed hydrologic processes focuses primarily on the effects of land cover changes on runoff development, with less emphasis on soil moisture dynamics and evapotranspiration processes.
This study uses the physically based distributed hydrological model, namely the WEP model, to simulate the runoff processes of the typical Jing River watershed in the Loess Plateau during different periods before and after afforestation and grassland conversion from 1980 to 2019. It spatially distributes hydrological elements, including runoff, soil moisture, and reference evapotranspiration, across the watershed, which provides spatial distribution characteristics of hydrological elements. The study analyzes the impact of land cover change on key hydrological processes in the Jing River Basin.

2. Materials and Methods

2.1. Study Area

The Jing River Basin is located in the central part of the Loess Plateau (106°20’–108°20’ E, 34°24’–37°48’ N), with a basin area of 45,400 km2 (Figure 1). Precipitation and temperature in the Jing River Basin gradually increase from north to south. The average annual precipitation in the basin is 548.7 mm (1932–2019), most of which falls in the months of July, August, and September. The average precipitation from July to September is 275.6 mm, accounting for 52% of the annual precipitation. The average annual amount of sunshine is 2195.2 h. The terrain of the Jing River basin gradually rises from southeast to northwest, with elevations ranging from 515 to 2904 m. The geological structure influences the complex topography of the area. The soil texture is similar to that of the Loess Plateau in eastern Gansu, with deep Quaternary deposits on the surface and the basin located within the Wei River rift. The Jing River Basin is a typical watershed in the vegetation restoration area of the Loess Plateau, especially the sub-basin of the Wei River Basin. As a representative basin in the Loess Plateau vegetation restoration area, the Jing River Basin covers seven cities and 27 counties/districts in the provinces of Shaanxi, Gansu, and Ningxia. Most of the basin is located in the eastern part of the Gansu Loess Plateau. The dominant vegetation types in the Jing River Basin are grassland and cropland, followed by shrubland and forest. With the implementation of vegetation restoration measures, the vegetation cover in the basin has increased significantly. The growing season for vegetation in the basin is concentrated from April to September.

2.2. Datasets

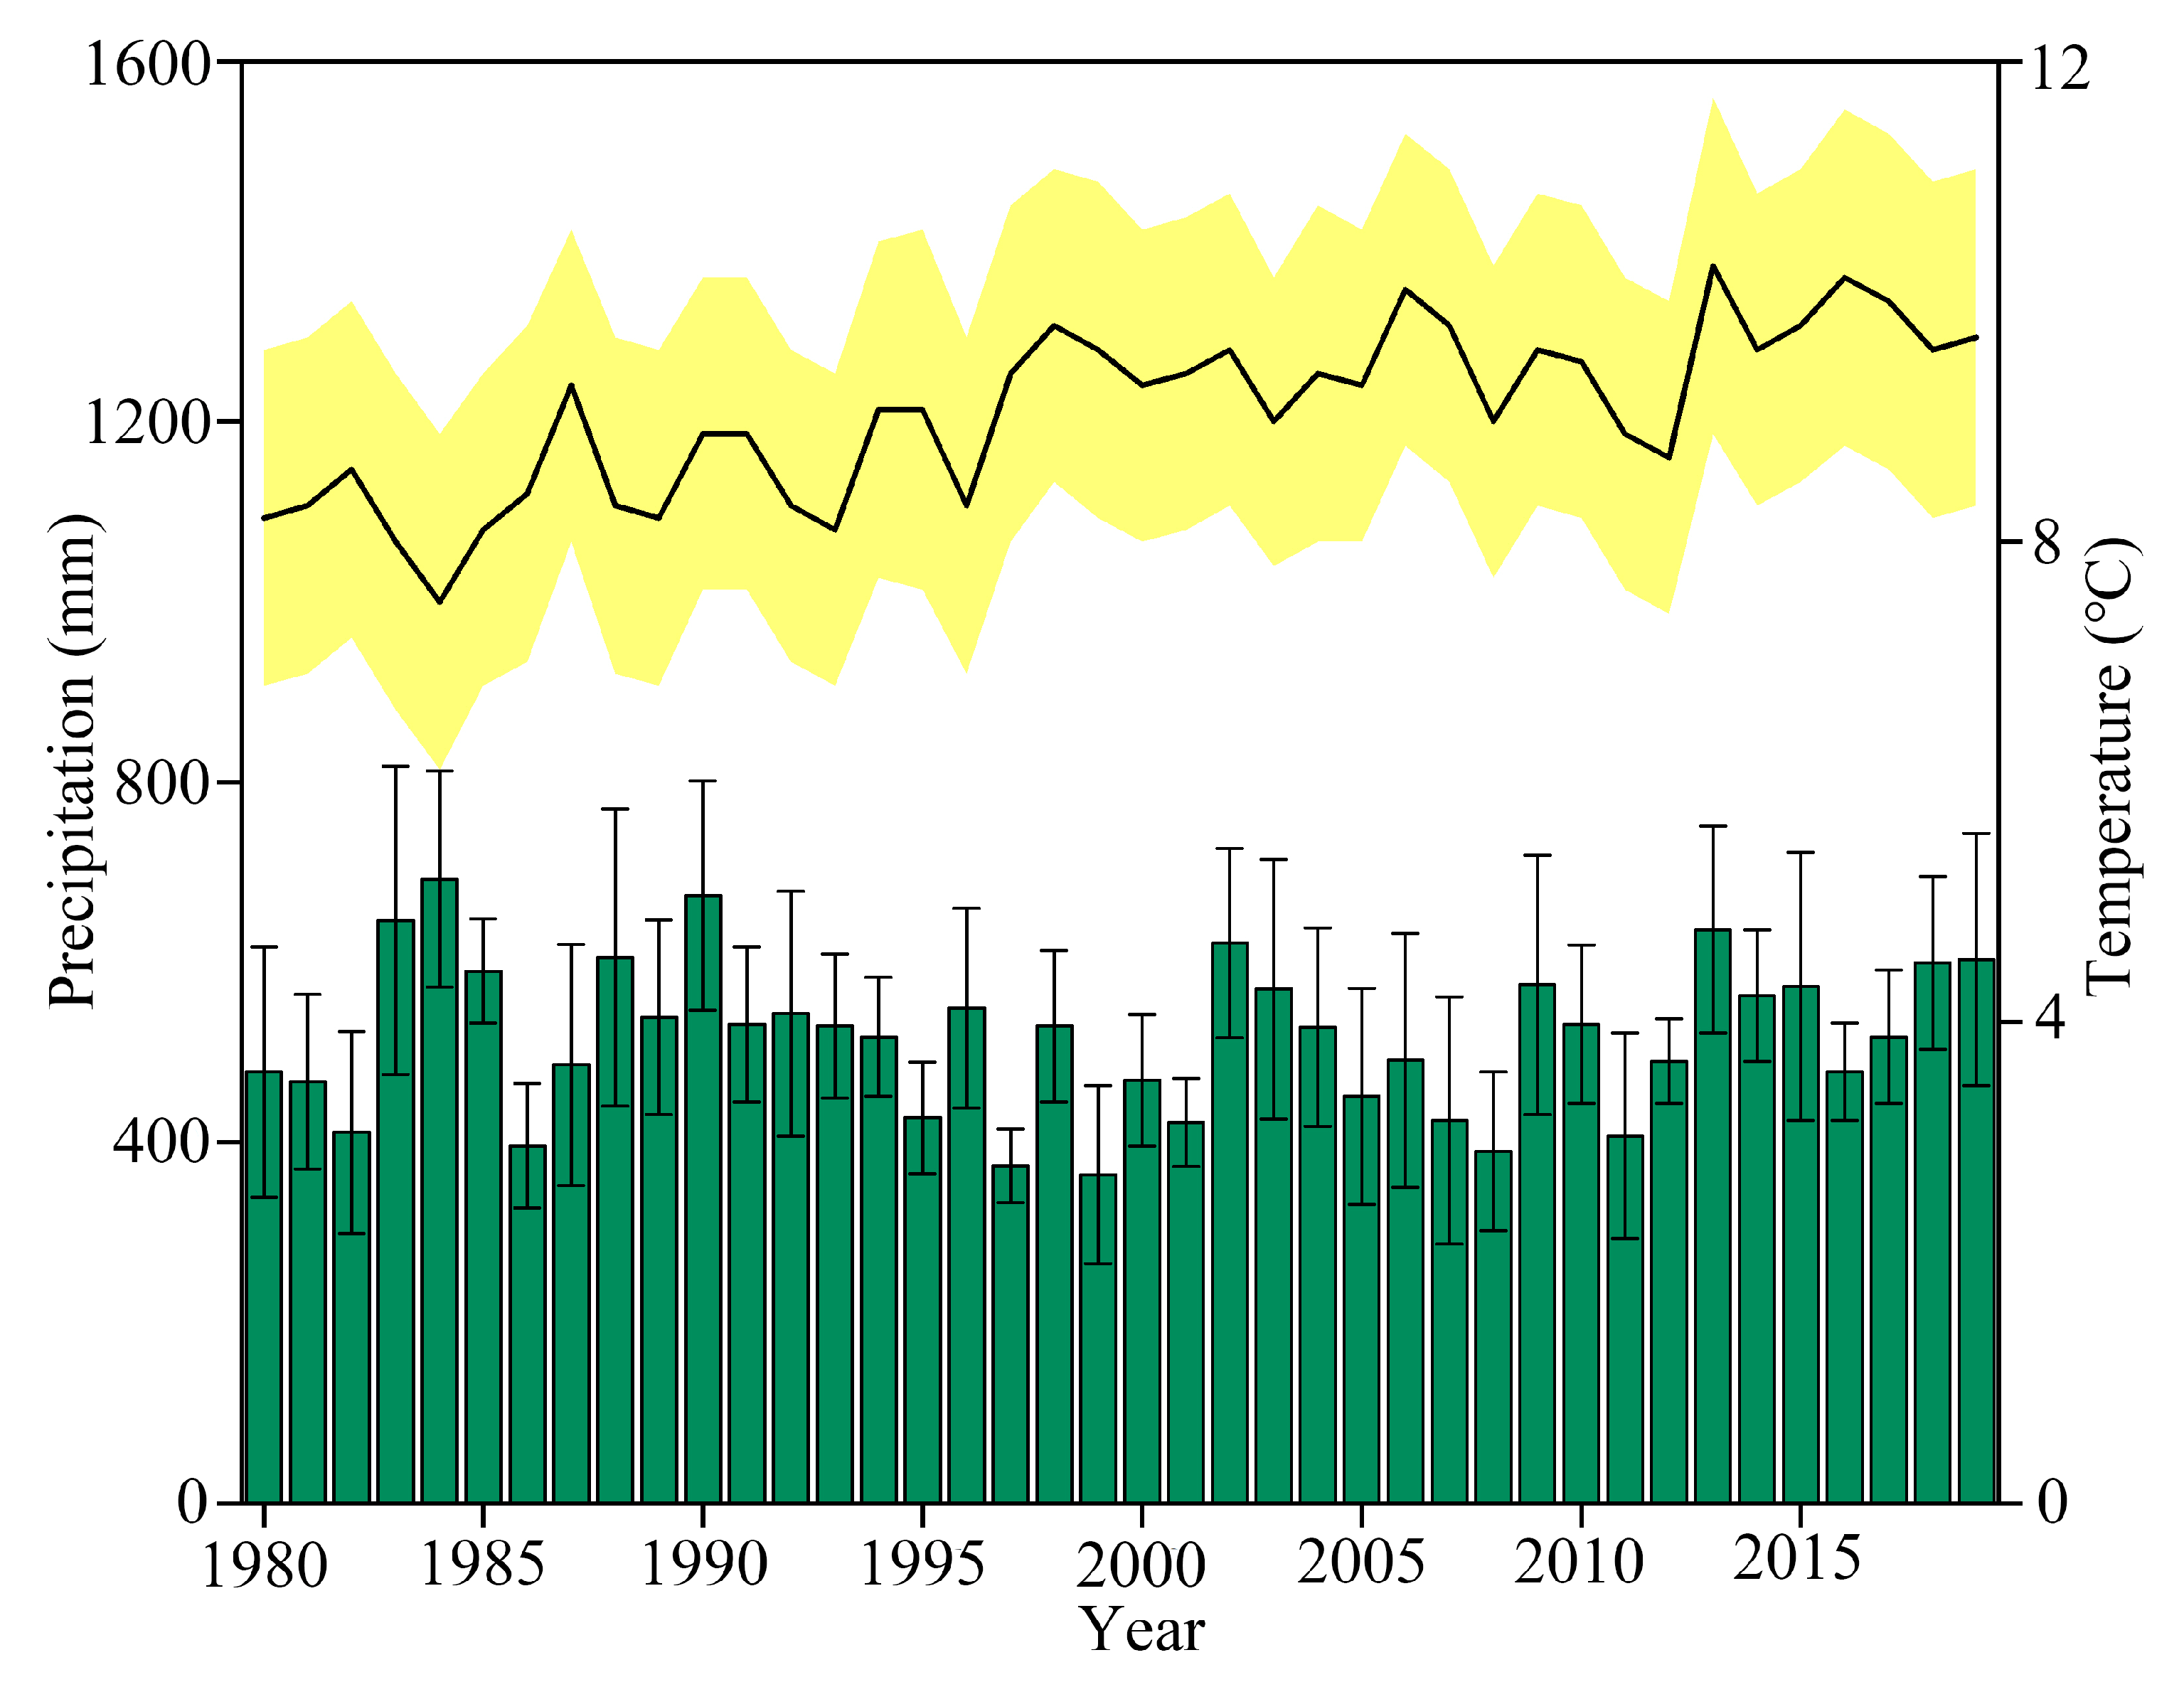
2.2.1. Meteorological Data

The meteorological data are taken from the Chinese Surface Climate Data Daily Dataset, which comes from the China Meteorological Data Sharing Service System (http://cdc.cma.gov.cn, accessed on 6 May 2021). The data are comprehensive and reliable. For the construction of the WEP model, the input meteorological data include daily precipitation, temperature, wind speed, humidity, and sunshine hours from a total of 17 meteorological stations in and near the Jing River basin for the period 1980–2019, covering 40 years (Figure 1). The analysis of the interannual trends of precipitation and temperature in the Jing River Basin from 1980 to 2019 is shown in Figure 2. As for the precipitation element, the interannual coefficient of variation for precipitation from 1980 to 1999 is 0.18, while it is 0.14 for the period from 2000 to 2019. As for the temperature element, the interannual coefficient of variation from 1980 to 1999 is 0.07, and it is 0.04 for the period from 2000 to 2019.

2.2.2. Hydrological Data

The stream network data were obtained from the National Glacier Permafrost Desert Scientific Data Center (www.ncdc.ac.cn (accessed on 16 June 2021)), specifically the Jing River Basin Basic Dataset (last updated in 2018), which was obtained from the National Geomatics Center of China.
The validation dataset for streamflow is on a monthly scale. From 1980 to 2016, the streamflow data for the Jing River Basin were obtained from the Zhangjiashan Hydrological Station in the Yellow River Basin Natural Monthly Streamflow Dataset, which is provided by the Yellow River Conservancy Commission (http://www.yrcc.gov.cn (accessed on 24 July 2021)). From 2016 to 2019, the streamflow data for the Jing River Basin are from the monthly hydrological reports of the Zhangjiashan Hydrological Station, available on the Shaanxi Hydrological and Water Resources Information Network (www.shxsw.com.cn (accessed on 7 July 2022)).
The soil moisture validation data are on a daily scale. The soil moisture validation data from 1980 to 1999 are obtained from the International Soil Moisture Network (ISMN) (https://ismn.earth/en/ (accessed on 8 May 2021)). Soil moisture validation data from 2000 to 2019 is partly from peer-reviewed literature using GetData data extraction software (Last update: 2021-11-17) and partly from published datasets (Table 1).

2.2.3. Other Data

The digital elevation data were obtained from the National Glacial Permafrost Desert Science Data Center (http://www.ncdc.ac.cn (accessed on 9 July 2021)). The original data is derived from NASA SRTM elevation data with a spatial resolution of 90 m. It has been cropped according to the boundaries of the Jing River Basin to ensure reliable data sources. The elevation within the Jing River Basin mainly ranges from 515 to 2904 m.
The soil data were obtained from the 1:1,000,000 Chinese Soil Database of the Institute of Soil Science, Chinese Academy of Sciences. Among the soil types, sandy soil accounts for 1.63%, loamy soil accounts for 93.19%, silt loam soil accounts for 2.52%, and clay soil accounts for 2.66%. Loamy soil covers most of the area in the Jing River basin.
The land use data in the Jing River Basin were obtained from the 30-m resolution remote sensing land use monitoring dataset of the Chinese Academy of Sciences. For this study, land use data from three periods, namely 1980, 2000, and 2018, were selected as model inputs to analyze land use changes in the Jing River Basin (Figure 3 and Table 2). Cultivated land and grassland are the major land use types in the basin, with grassland accounting for the largest proportion, increasing from 45.97% in 1980 to 48.43% in 2018. Cultivated land is the second largest, decreasing from 42.60% in 1980 to 38.43% in 2018. The combined proportion of cultivated land and grassland is close to 90%, followed by deciduous forest and shrubland, which together account for about 10%.
The land use conversion matrix was used to analyze the changes in land use types in the watershed during 1980, 2000, and 2018 (Table 3 and Table 4). The land use spatial data from different time periods was overlaid, with overlapping areas representing unchanged portions and non-overlapping areas representing converted portions.
During the period 1980–2000, there were minor changes in the areas of different land use types. Cultivated land decreased by 19.89 km2, deciduous forest decreased by 36.43 km2, shrubland decreased by 87.97 km2, grassland increased by 122.94 km2, water bodies decreased by 49.03 km2, and built-up land increased by 70.37 km2 (Table 3). From 2000 to 2018, the most significant changes occurred in cultivated land and grassland, followed by deciduous forest, shrubland, and built-up land. Cultivated land decreased by 1778.46 km2, deciduous forest increased by 243.66 km2, shrubland increased by 263.79 km2, grassland increased by 978.62 km2, water bodies increased by 1.72 km2, and built-up land increased by 290.67 km2. The major changes were from cropland to grassland and from grassland and cropland to hardwood forest and shrubland. Water bodies and urban built-up areas showed minimal changes (Table 4). Overall, the main land use changes from 1980 to 2018 were a decrease in cultivated land and an increase in grassland, deciduous forest, and shrubland. The main types of conversion were from cropland to forest and grassland, and from grassland to forest. These land use changes in the Jing River Basin are related to afforestation and grassland conversion, while urbanization has led to an increase in built-up area.

2.3. WEP Model

(1)
Model Features
The WEP model is a physically based distributed hydrological model developed by the China Institute of Water Resources and Hydropower Research. This model integrates GIS functionalities and Open MP parallel computing, allowing the simulation of hydrological elements at various time scales, including annual, monthly, and daily. It incorporates various runoff generation theories to reflect the influence of terrain changes on runoff. The model can simulate processes such as surface runoff, infiltration, and mixed flow and has been successfully applied in numerous water cycle simulations in the Yellow River Basin.
(2)
Model Principles
The WEP model uses sub-watersheds as the computational units, with elevation bands as the nested structure. Within each elevation band, land use types are categorized into ten classes, including irrigated cropland, non-irrigated cropland, sloping fields, terraces, forests, grasslands, impoundments, water bodies, impervious areas, and bare land. Water and heat fluxes are calculated for each land use class. At the horizontal scale, the convergence between sub-watersheds is determined by upstream and downstream relationships, and the calculations are traced from upstream to downstream to the outlet section of the river.
The WEP model simulates five major processes in the hydrologic cycle: the surface water cycle, the soil water cycle, groundwater migration, overland flow, and river channel flow. The surface water cycle includes processes such as vegetation interception, depression storage, and surface runoff. The soil water cycle includes processes such as bare soil evaporation, vegetation transpiration, soil water infiltration, and interflow. Reference evapotranspiration is calculated using the Penman equation, while bare soil evaporation is calculated using a modified Penman equation that accounts for soil moisture content. Vegetation transpiration is calculated using the Penman–Monteith equation. Soil water infiltration is calculated using the Green–Ampt model for storm periods and the Richards equation for non-storm periods. The surface runoff is determined by storm intensity using a saturation excess runoff model for storm periods and a water balance model for non-storm periods. Overland flow is calculated using the one-dimensional kinematic wave method, which traces flow from the upstream to the downstream elevation band. River channel flow is simulated using either the one-dimensional kinematic wave method or the dynamic wave method, tracing flow from upstream sub-basins to downstream sub-basins.
(3)
Model Parameters
Aquifer thickness correction coefficient: This parameter is used to correct for aquifer thickness. The aquifer thickness refers to the distance between the ground surface and the impermeable layer, which determines the water storage capacity of the watershed. The default value is 1 m.
Soil layer thickness: This parameter mainly affects the simulation of soil evaporation, vegetation transpiration, and runoff.
Stomatal Resistance Correction Coefficient: This parameter is used to correct the stomatal resistance of vegetation. Stomatal resistance refers to the resistance to water vapor diffusion from the atmosphere to the leaf interior and from the leaf interior to the atmosphere, which determines the transpiration capacity of vegetation.
Hydraulic conductivity correction coefficient: This coefficient is used to correct for the saturated hydraulic conductivity of the soil. Saturated hydraulic conductivity refers to the conductivity of the soil when it reaches saturation moisture content, which determines soil water movement and infiltration capacity. Default values are set based on different soil types: 0.0025 cm/s for sandy soil, 0.0007 cm/s for loamy soil, 0.0002 cm/s for silt loam, and 0.00003 cm/s for clay. The modified coefficient is multiplied by the default saturated hydraulic conductivity value to obtain the value used in the model.
Hydraulic conductivity correction coefficient for streambed material: This coefficient is used to correct for the hydraulic conductivity of the streambed material. The hydraulic conductivity of the streambed material determines the replenishment rate of stream water from the aquifer. The default value is 0.000005 m/s. The modified coefficient is multiplied by the default value to obtain the value used in the model.
Aquifer lateral hydraulic conductivity correction coefficient: This coefficient is used to correct for aquifer lateral hydraulic conductivity. Aquifer lateral hydraulic conductivity refers to the coefficient of lateral groundwater movement between elevation bands or sub-watersheds. The corrected coefficient is multiplied by the default value to obtain the value used in the model.
River Channel Manning’s Roughness Coefficient Correction Coefficient: This coefficient is used to correct Manning’s roughness coefficient of the river channel. The Manning’s roughness coefficient reflects the influence of bed roughness on the flow resistance in the river, which determines the velocity of the river channel flow. The default value is 0.05. The modified coefficient is multiplied by the default value to obtain the value used in the model.
Slope Manning’s Roughness Coefficient Correction coefficient: This coefficient is used to correct the slope of Manning’s roughness coefficient. The slope of Manning’s roughness coefficient reflects the influence of surface roughness on flow resistance. The default values are set based on different underlying surface types: 0.01 for water, 0.02 for impervious surfaces, 0.05 for bare land, 0.3 for forest, 0.1 for grassland, 0.15 for sloping fields, 0.2 for irrigated and non-irrigated cropland, and 0.3 for terraces. The modified coefficient is multiplied by the default value to obtain the value used in the model.
Depression Storage Depth: This refers to the storage capacity of depressions per unit area for different underlying surface types. This parameter mainly affects surface runoff (Table 5).

3. Results

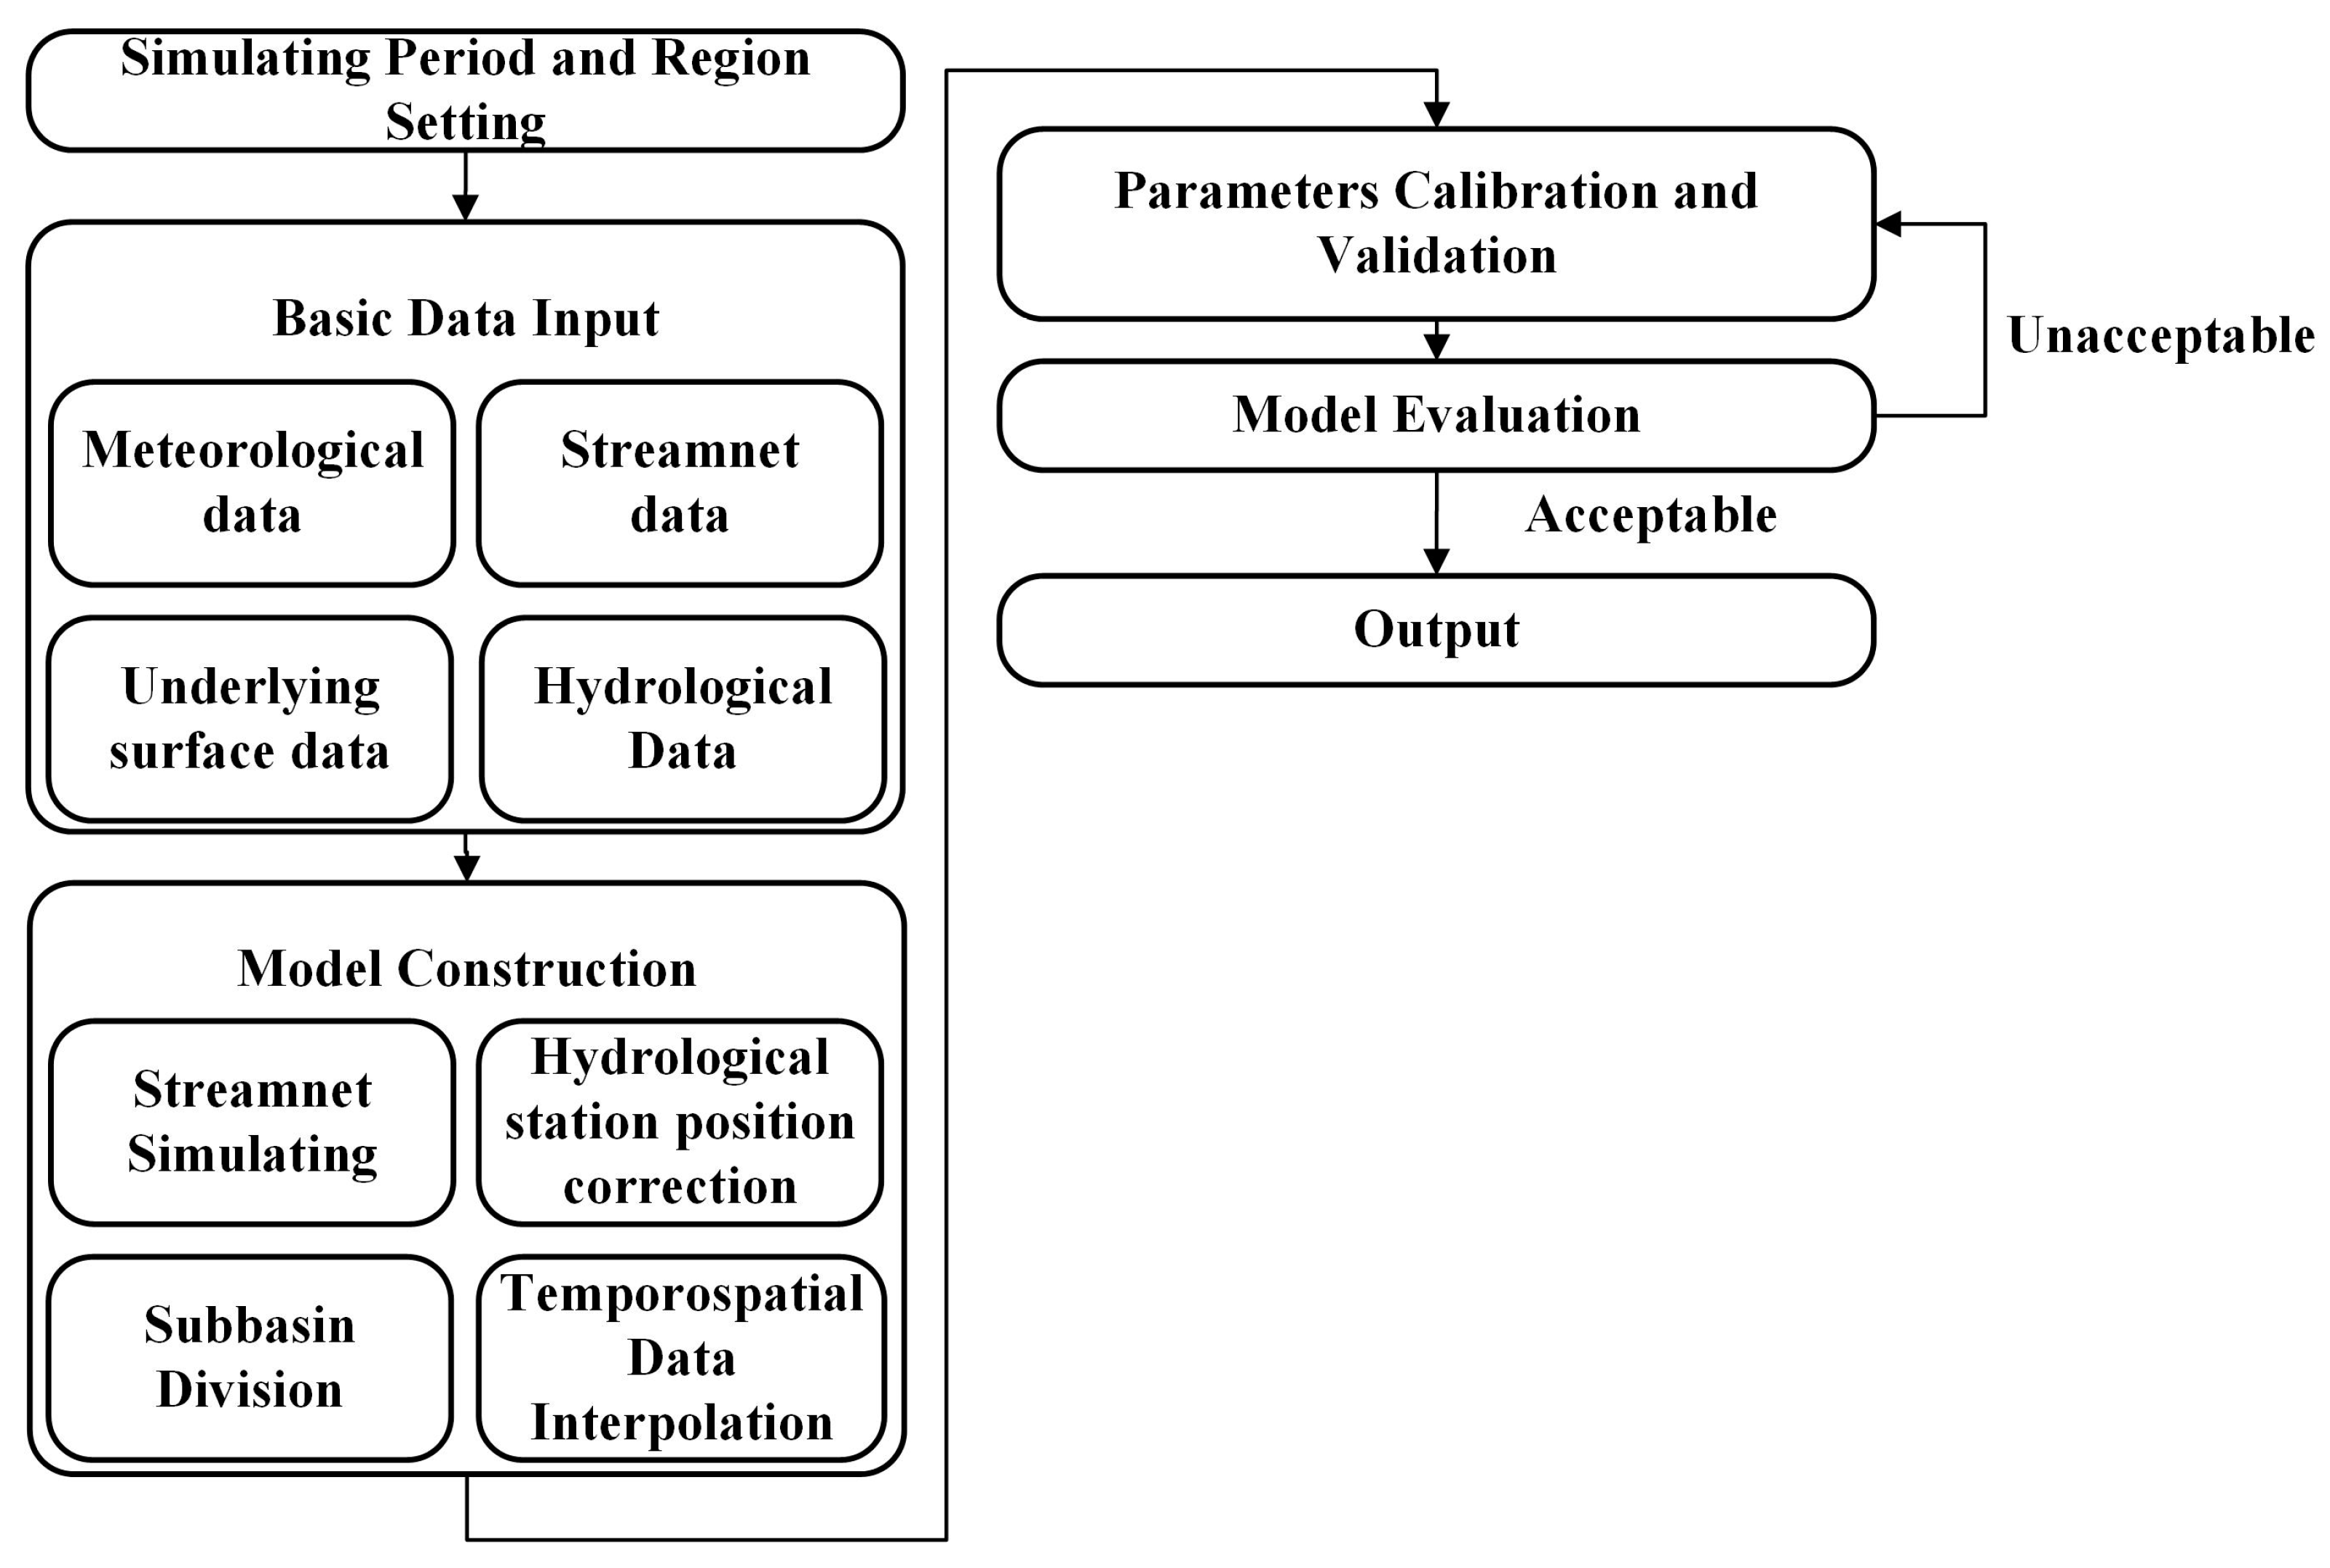
3.1. WEP Model Construction

The construction process of the WEP model in the Jing River Basin mainly consists of several steps: basic data input, model construction, parameter calibration, and simulation evaluation (Figure 4). First, the model simulation period is set from 1980 to 2019, and the simulation scope is set to the watershed area of the Jing River Basin. The input and configuration of the basic data mainly include the aforementioned terrain DEM data, basin river network vector data, land use data, soil type data, and other underlying surface data, as well as hydro-meteorological data such as precipitation, meteorology, and runoff. The simulation time scale is set to daily. Then, the model is constructed through several steps, including the generation of the simulated river network, the subdivision of the computational units, and the dissemination of information. Finally, the Jing River basin is divided into 5925 sub-basin units. In order to fulfill the requirements of vertical zone simulation analysis while avoiding excessive computational load, elevation zones are partitioned according to the elevation zone division rules of the WEP. Furthermore, the elevation segmentation is carried out, resulting in 6779 sub-basin units within the elevation zones, with an average sub-basin area of 7.2 km2 (Figure 5). All model functionalities are implemented in the WEP v1.0 model software.

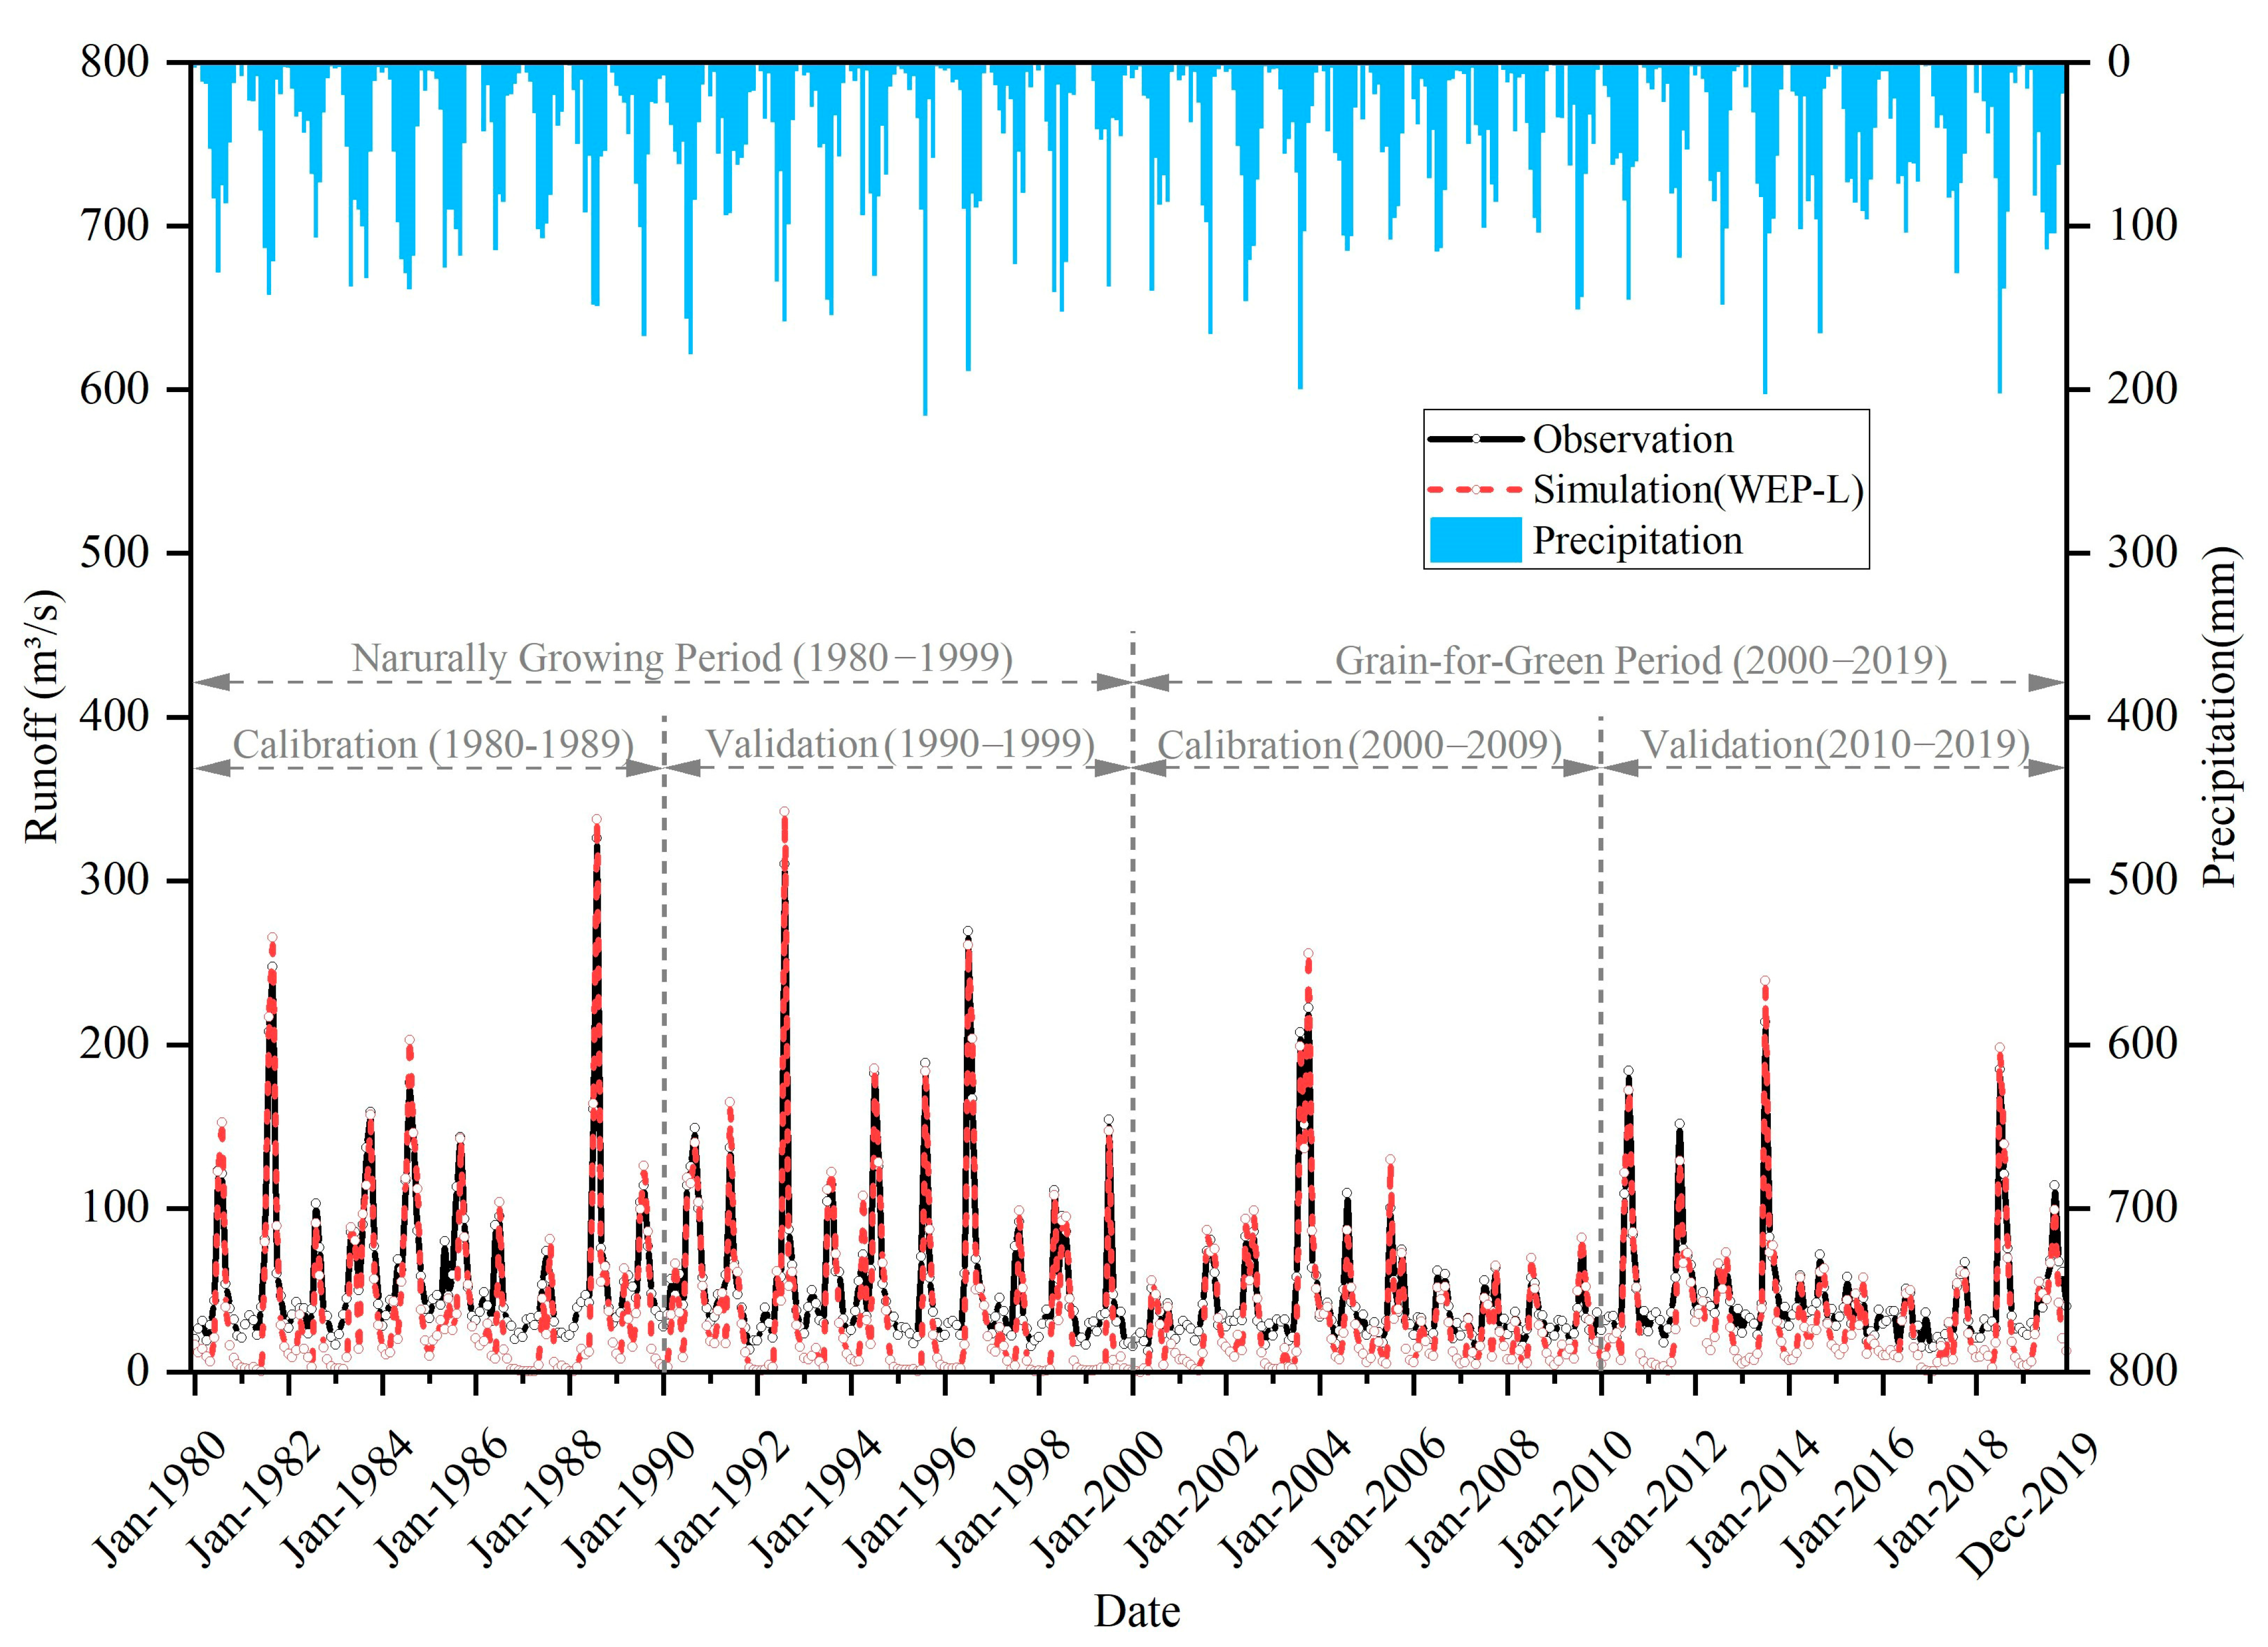
3.2. Parameter Calibration

In this study, the simulation period is divided into two periods based on the implementation of the Grain for Green Project (GFGP). The period from 1980 to 1999 is considered the pre-GFGP period, with 1980–1989 as the calibration period and 1990–1999 as the validation period for this simulation period. The period from 2000 to 2019 is considered the post-GFGP period, with 2000–2009 as the calibration period and 2010–2019 as the validation period for this simulation period. Parameter calibration is performed by manual parameter tuning within the recommended parameter ranges, resulting in calibrated parameters for each simulation period (Table 6). Regarding the soil water cycle process, the three soil layer thicknesses are set to 0.2 m, 0.6 m, and 1.2 m in this study.
The aquifer thickness correction coefficient, stomatal resistance correction coefficient, and soil saturated hydraulic conductivity correction coefficient are sensitive parameters of the model. Compared to the pre-GFGP period, the post-GFGP period shows an increase in the aquifer thickness correction coefficient and the soil saturated hydraulic conductivity correction coefficient, resulting in a decrease in peak and total runoff and an increase in infiltration. The stomatal resistance correction coefficient decreases, indicating an increase in vegetation transpiration.

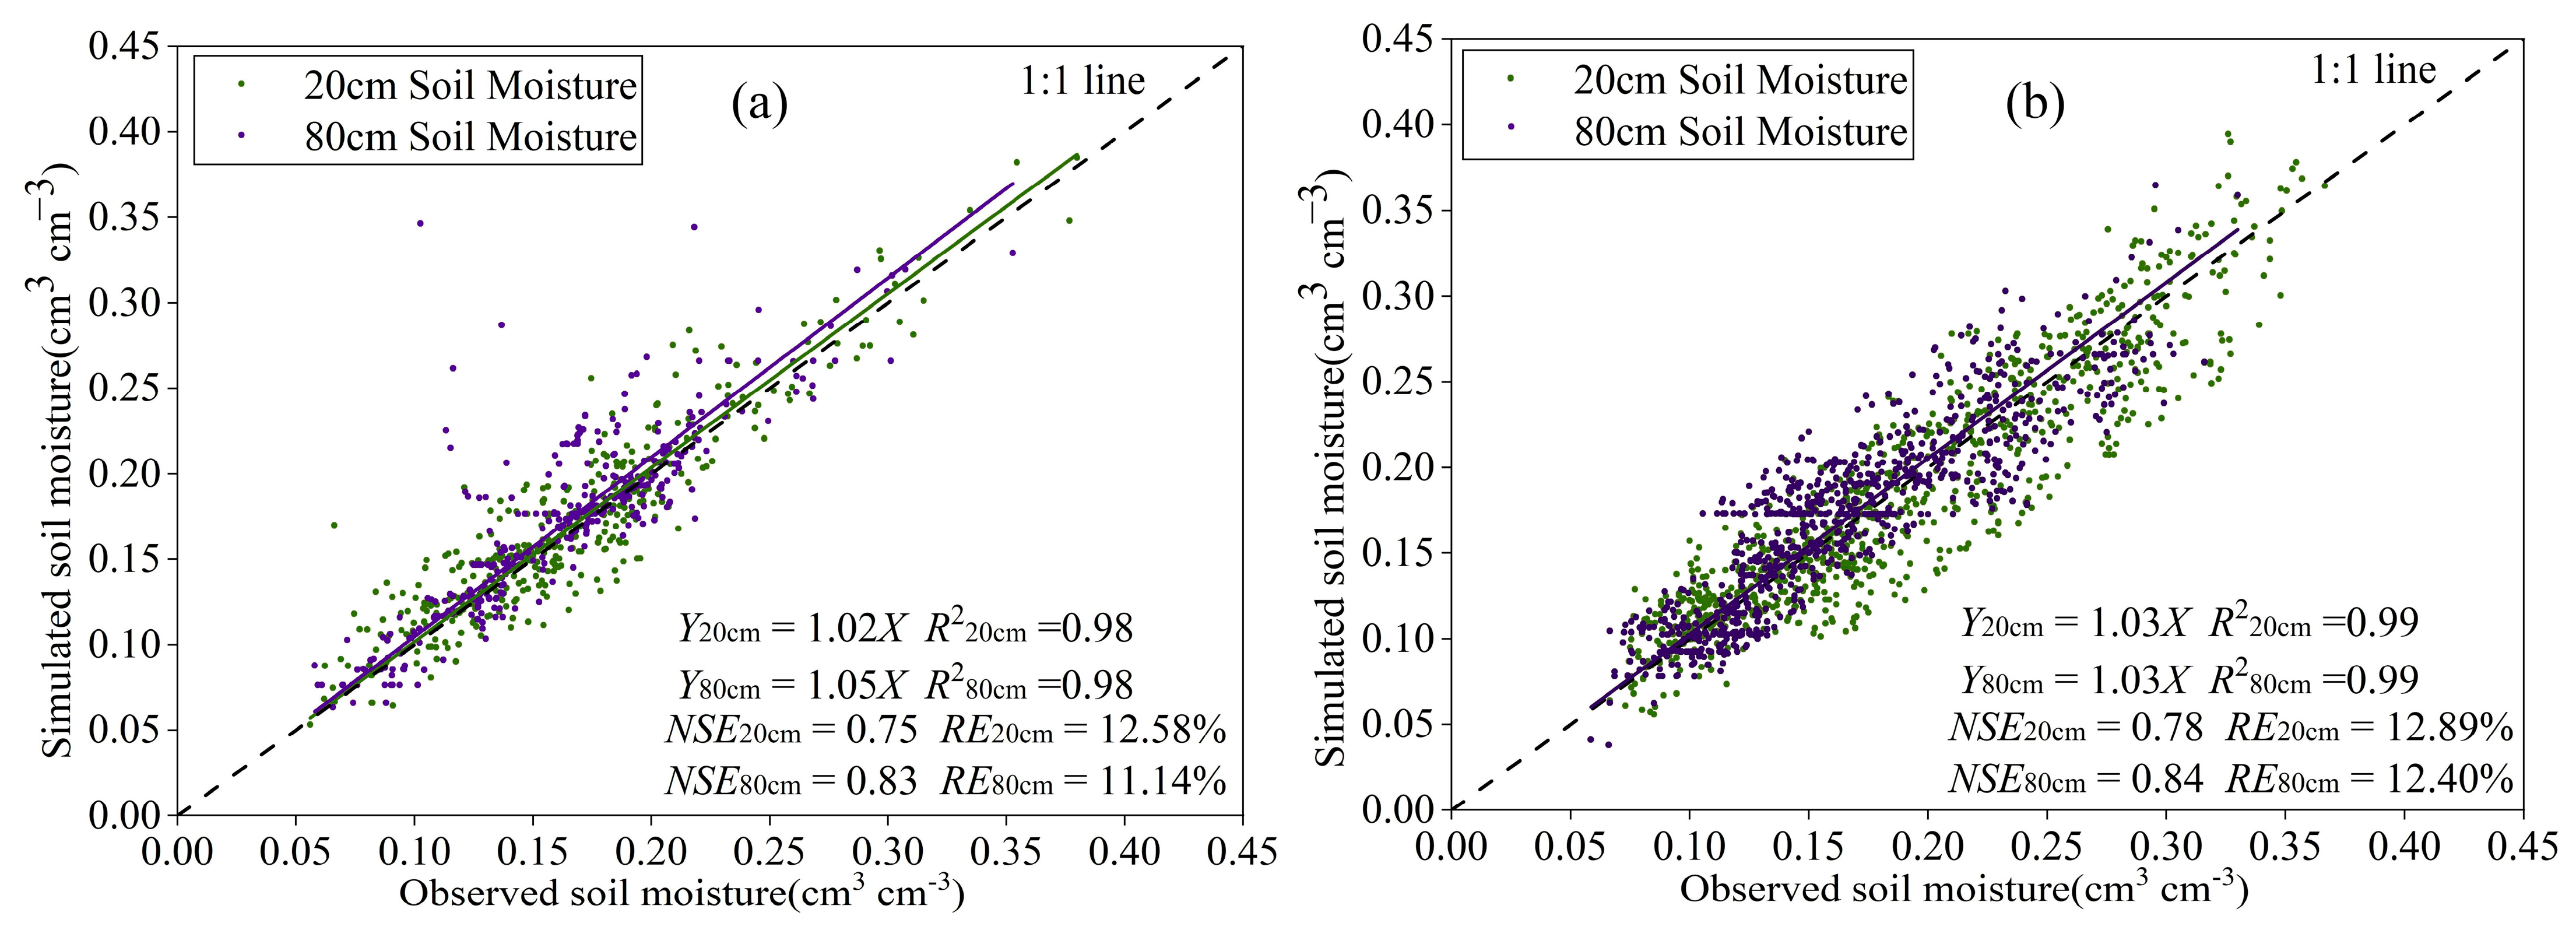
3.3. Model Simulation Results and Evaluation

The simulation is divided into two scenarios based on the pre- and post-Grain for Green Project (GFGP) periods for parameter calibration. Specifically, the pre-GFGP period from 1980 to 1999 consists of the calibration period from 1980 to 1989 and the validation period from 1990 to 1999. The post-GFGP period from 2000 to 2019 consists of the calibration period from 2000 to 2009 and the validation period from 2010 to 2019.
First, the daily runoff data obtained from the simulation are aggregated to obtain monthly runoff data. Then, the monthly runoff data simulated by the WEP model are validated against the measured monthly runoff data from the Zhangjiashan Hydrological Station (Figure 6). The Nash-Sutcliffe efficiency coefficient for the calibration and validation periods of the monthly runoff data in the pre- and post-GFGP periods of the Jing River basin obtained from the WEP model is above 0.7, the coefficient of determination is above 0.9, and the average relative error is within 20%, which meets the accuracy requirements (Table 7). The simulated values of the WEP model during the dry season are slightly lower than the measured values, while the peak flows are generally consistent with the measured values, indicating the ability to reflect the temporal evolution characteristics of the monthly runoff in the basin.
During the period from 1980 to 1999, the average discharge in the Jing River Basin was 40.47 m3/s, with a coefficient of variation (Cv) of 1.44. The flood season is concentrated from June to August, with an average discharge of 88.25 m3/s, while the dry season has an average discharge of 24.55 m3/s. From 2000 to 2019, the average discharge in the Jing River Basin was 31.61 m3/s with a Cv of 1.25. The flood season is concentrated from June to August, with an average discharge of 54.84 m3/s, while the dry season has an average discharge of 23.88 m3/s. Compared with the pre-GFGP period, the average runoff in the Jing River Basin has decreased by 20.91% in the post-GFGP period. The most significant decrease in average runoff occurred in the central and northern parts of the basin, with a maximum reduction of 48.6%.
The soil moisture simulated by the WEP model in the Jing River Basin is validated against the daily measured soil moisture values at different validation points (Figure 7). Soil moisture validation data obtained from published literature and publicly available databases are mostly distributed in the 0–1 m depth range, with few samples available for the 1–2 m depth range. Therefore, validation is performed only for the 20 cm and 80 cm soil depths. The average relative error between simulated and measured soil moisture values is within 20%, and the Nash–Sutcliffe efficiency coefficient is above 0.7. The simulated values at 80 cm depth tend to be higher than the measured values. Overall, the simulated soil moisture values obtained by the model meet the required simulation accuracy. Therefore, the simulated soil moisture data for each sub-basin can represent the spatial and temporal distribution of soil moisture in the Jing River Basin.
From 1980 to 1999, the soil moisture in the 20 cm soil depth of the entire Jing River basin was 0.19 cm3·cm−3, with a coefficient of variation (Cv) of 0.27. During the flood season, the soil moisture in the 20 cm soil depth was 0.20 cm3·cm−3, with a Cv of 0.27. The soil moisture in the 80 cm soil depth was 0.29 cm3·cm−3, with a Cv of 0.23. During the flood season, the average soil moisture in the 80 cm soil depth was 0.31 cm3·cm−3, with a Cv of 0.21. From 2000 to 2019, the soil moisture in the 20 cm soil depth of the entire Jing River basin was 0.20 cm3·cm−3, with a Cv of 0.25. During the flood season, the soil moisture in the 20 cm soil depth was 0.21 cm3·cm−3, with a Cv of 0.26. The soil moisture in the 80 cm soil depth was 0.27 cm3·cm−3, with a Cv of 0.22. During the flood season, the soil moisture in the 80 cm soil depth was 0.29 cm3·cm−3, with a Cv of 0.25. Overall, there is an approximately 5% decrease in average soil moisture at depths of 20 cm and 80 cm across the entire watershed after afforestation and reforestation compared to before.

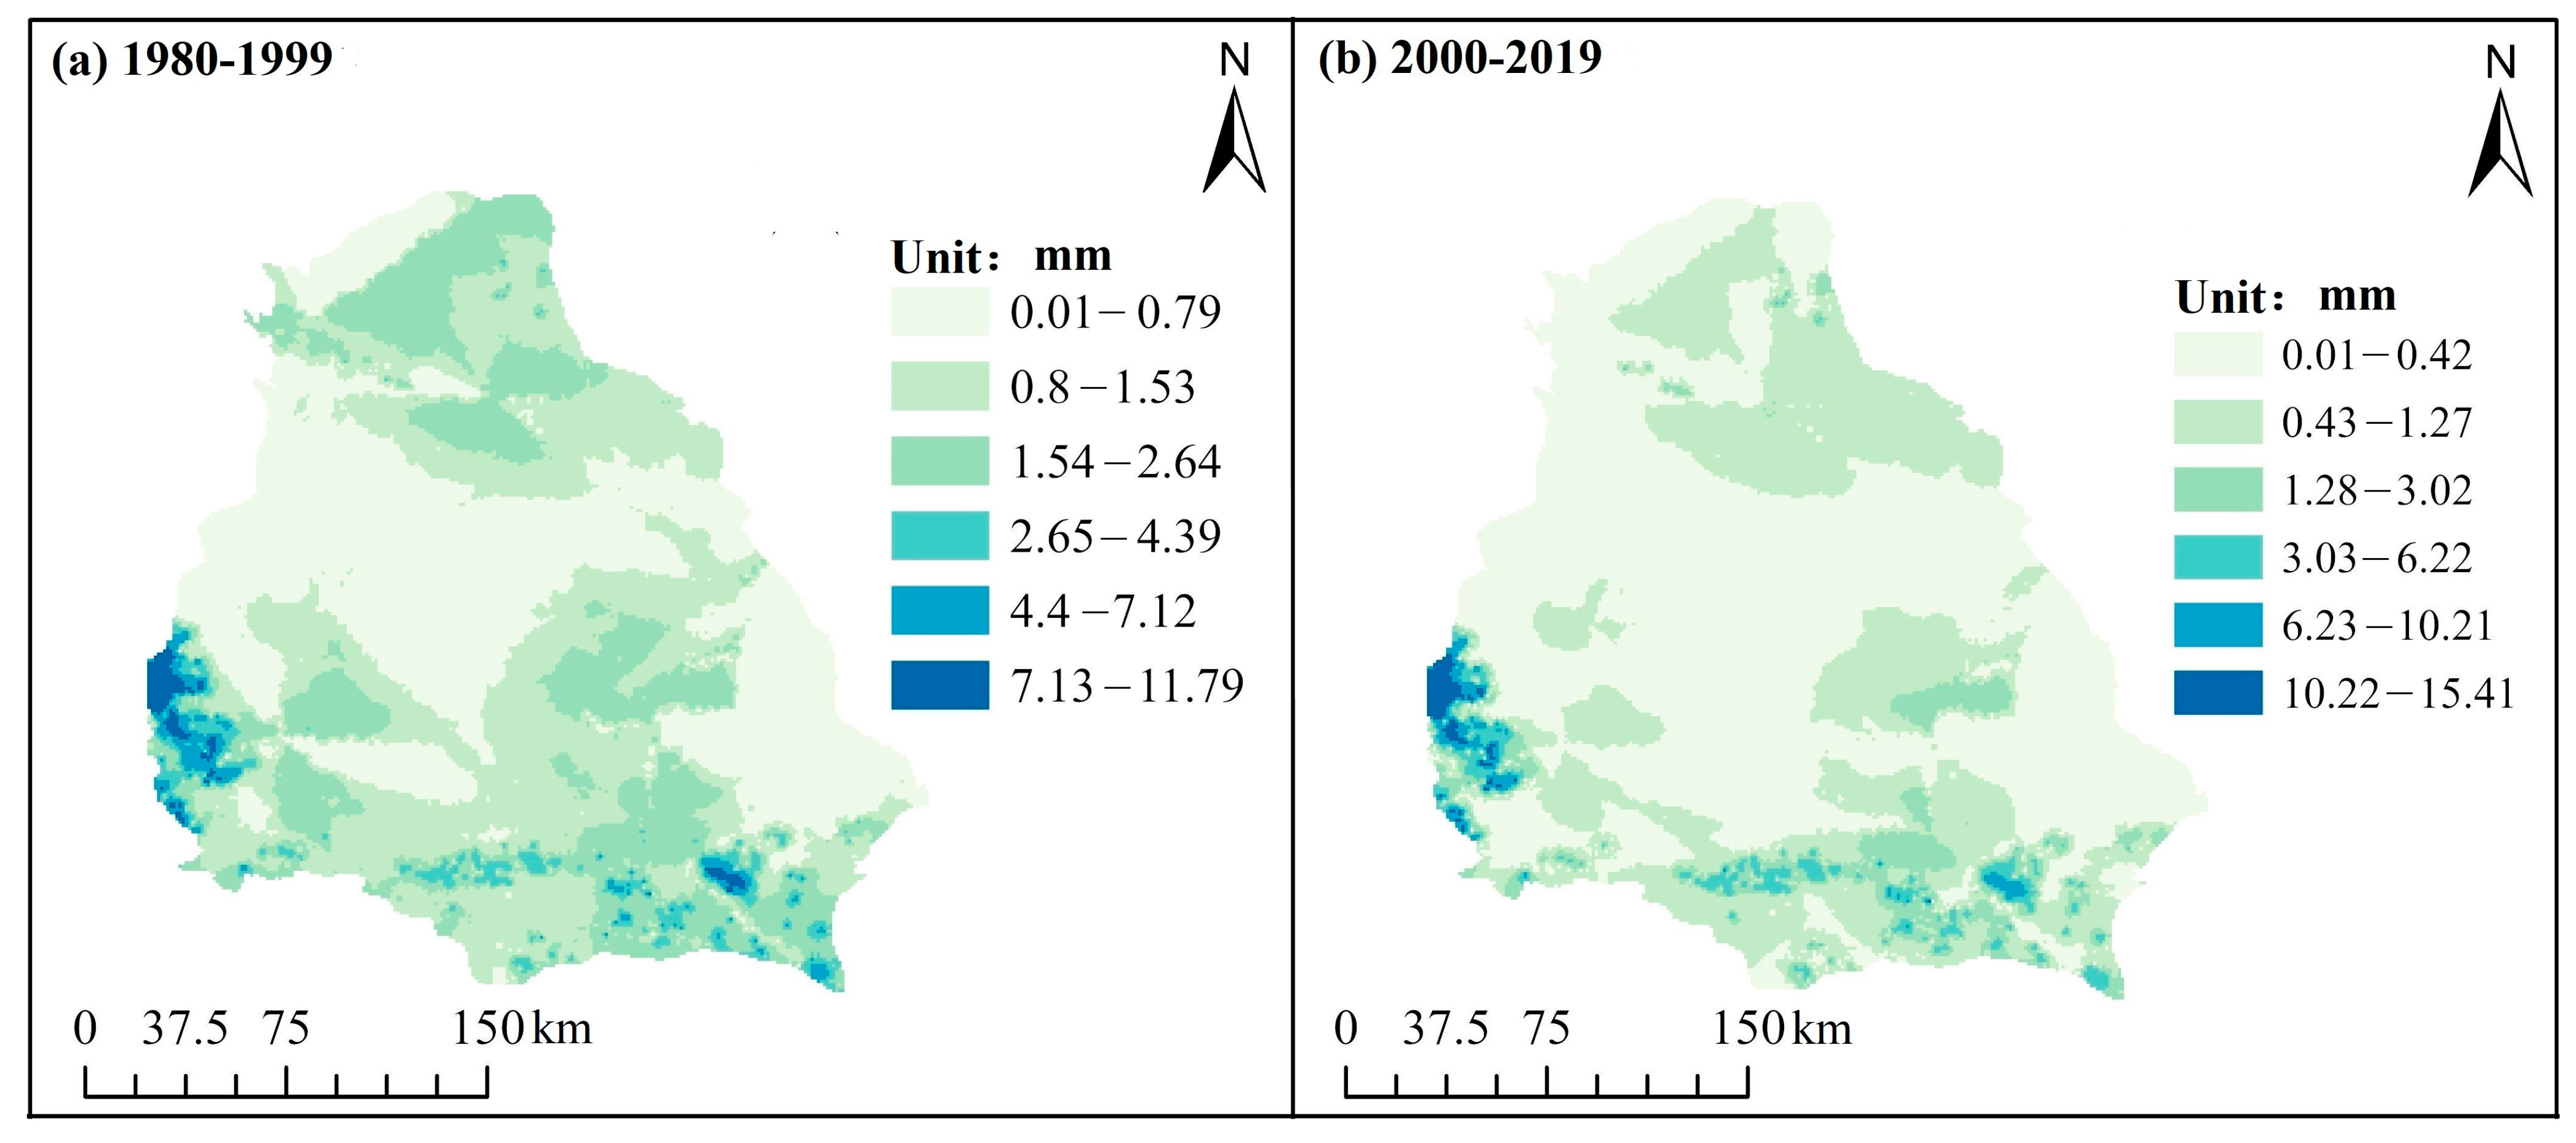
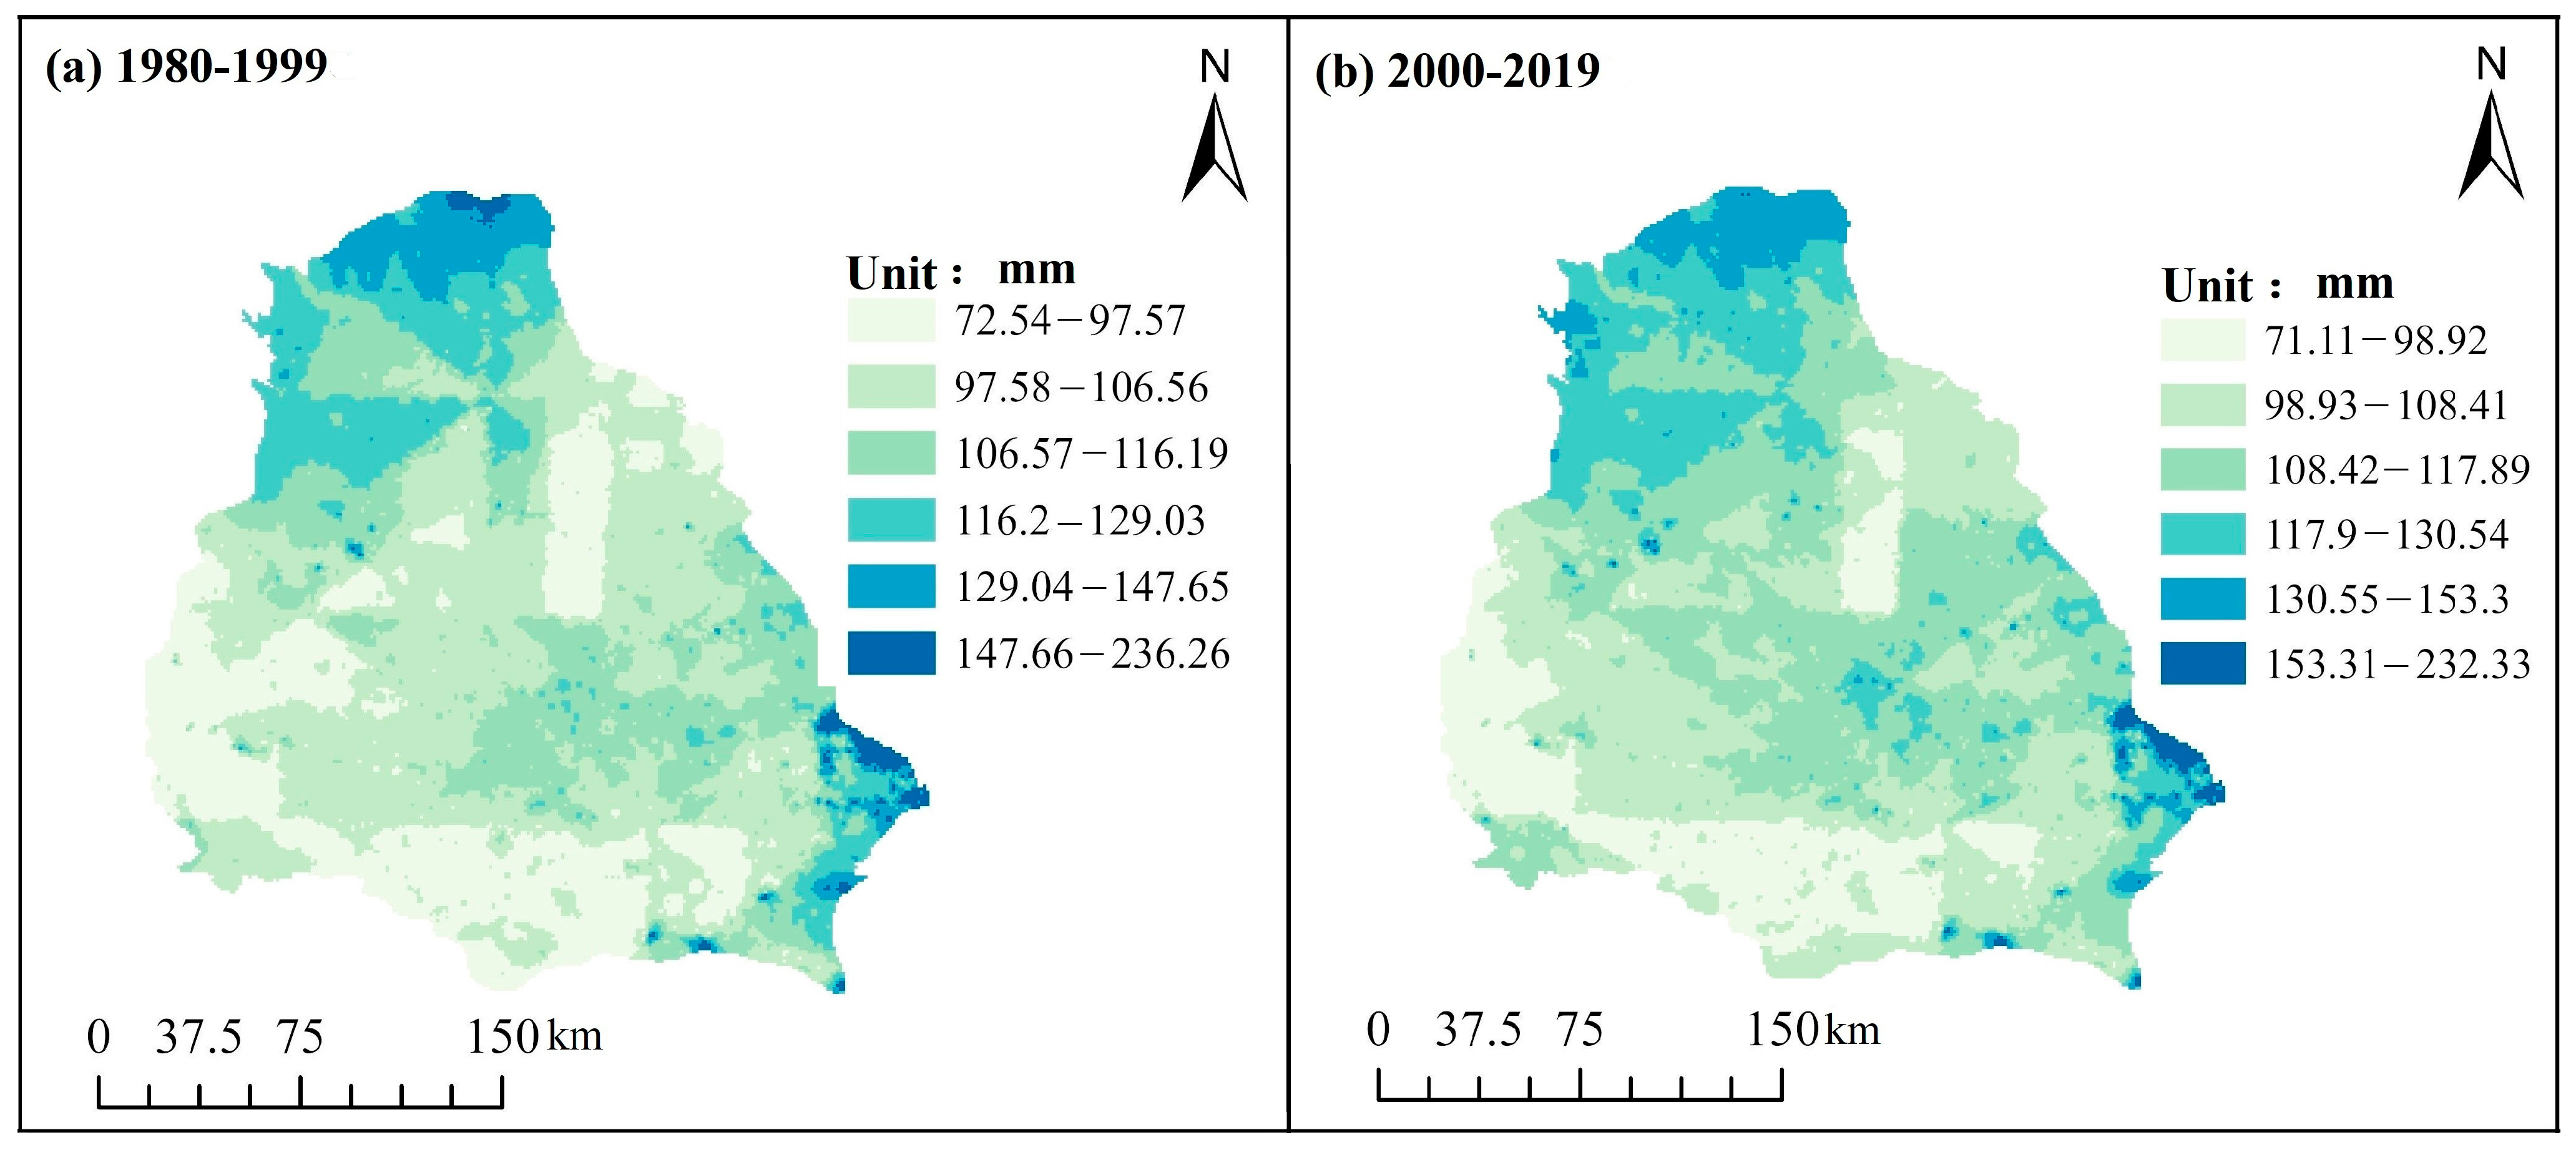
3.4. Spatial Distribution Characteristics of Key Hydrological Cycle Elements

The spatial distribution characteristics of the 1980–1999 and 2000–2019 periods, before and after the conversion of cropland to forest and grassland, were generally consistent. The maximum values were distributed along the western edge and southern parts of the basin, while the minimum values were mainly concentrated in the central region. During the pre-conversion period (1980–1999), the monthly mean discharge depth ranged from 0 to 14.09 mm, while during the post-conversion period (2000–2019), the range was from 0 to 10.58 mm. In terms of extreme values, the maximum discharge depth decreased by 24.91% after conversion. Spatially, there was a significant decrease in streamflow depth in the northern and some central regions of the basin, ranging from 10.3% to 50.2% (Figure 8).
As for the reference evapotranspiration, the values ranged from 71 to 232 mm during the pre-conversion period (1980–1999) and from 73 to 236 mm during the post-conversion period (2000–2019). The distribution of values between the two periods was similar, with only slight variations in some parts of the basin (Figure 9).
As for soil moisture, the average soil moisture in the 0–0.8 m soil layer showed a spatial pattern of decreasing from south to north, which was consistent with the spatial distribution of precipitation in the basin. The minimum values occurred in some eastern parts of the basin characterized by predominantly forest land use. During the pre-conversion period (1980–1999), the average soil moisture in the 0–0.8 m soil layer ranged from 0.12 to 0.36 cm3 cm-3, while during the post-conversion period (2000–2019), it ranged from 0.13 to 0.37 cm3 cm-3. After the conversion, soil moisture in the whole basin showed a partly decreasing trend (Figure 10).

4. Discussions

To improve computational efficiency, the WEP model uses more complex than simplified algorithms to simulate unsaturated soil water movement. This improves the simulation of plant ecophysiological water use and heat transport processes. Descriptions of various water and heat transport processes are mainly based on physical concepts. As a result, the simulation of hydrological processes under changing vegetation conditions is advantageous. A distributed water cycle simulation requires a significant amount of basic data. Although China’s hydro-meteorological observations, geological surveys, and data collection have been initiated early and are of high quality, there are still challenges in data collection and inadequacy. As a result, a significant number of model parameters require calibration, which is also a major source of modeling error.
The Jing River Basin is a typical basin in the Loess Plateau region. Analysis of land use changes in the Jing River Basin using the land use transfer matrix method shows that significant land use changes occurred after 2000. These changes are mainly characterized by a decrease in arable land and an increase in forest, shrub, and grassland areas. This trend is particularly evident in the central and eastern parts of the Jing River Basin and is mainly attributed to the effects of ecological restoration measures, such as afforestation and grassland restoration, implemented in the Loess Plateau region. The results are consistent with previous studies on land use in the Jing River Basin [24,25,26].
The simulation results of the Water and Energy Budget-based Peak-Flow (WEP) model indicate a significant decrease in monthly runoff in the Jing River Basin after 2000 compared to before 2000. The coefficient of variation of the discharge also decreased, indicating a more stable discharge process. While there was little change in average monthly runoff during the dry season before and after 2000, significant differences were observed during the flood season, with a decrease in peak flow during this period. This change is partly attributed to vegetation restoration efforts in the Jing River Basin, which effectively reduce runoff. The conversion of cropland to forests, shrubs, and grasslands helps to extend the generation time of surface runoff, especially when forest vegetation intercepts and attenuates runoff generated by heavy rainfall events. In addition, the model parameters suggest that conversion of land use types to forests, shrubs, and grasslands increases soil infiltration capacity, alters the runoff generation process, and reduces runoff by increasing soil infiltration. The trend of runoff changes in the Jing River Basin, as simulated by the WEP model in this study, is consistent with other basins in the Loess Plateau region with more significant land cover changes [4,5,6,27]. Liu et al. (2023) [28] indicate that runoff variations in the Jing River basin are most sensitive to underlying surface parameters during spring and winter, while runoff variations in the basin during summer and autumn are most sensitive to precipitation. Human activities are the primary cause of annual runoff reduction, with summer runoff changes dominating the annual runoff variability. This study corroborates the findings of our own research.
The simulation results show that the average soil moisture in the deep soil layer (80 cm) is higher than that in the surface layer (20 cm), and the moisture changes in the shallow soil layer are more stable. This pattern is consistent with existing knowledge and is mainly due to the control of atmospheric conditions on shallow soil moisture, which is more influenced by precipitation and meteorological factors [29]. In the post-2000 period, both shallow and deep soil moisture during the flood season showed a decrease compared to the pre-2000 period, indicating that the actual increase in evapotranspiration due to land cover changes may outweigh the replenishing effect of precipitation on soil moisture during the flood season.
In terms of spatial distribution, the degree of land cover change in the northern part of the Jing River Basin is relatively low compared to the southern part of the basin. The decrease in discharge depth in the northern part is mainly related to the decrease in precipitation. In contrast, land cover changes in the central and southeastern regions have made a more significant contribution to runoff reduction. In terms of soil moisture, the southern and eastern regions of the Jing River Basin, where land cover changes are most pronounced, exhibit the most significant variations in soil moisture. This suggests that the effects of ecological restoration measures, such as afforestation and grassland restoration, are most significant in these regions [12,14]. However, the effect of land cover change on the spatial variation of reference evapotranspiration is not significant, as it is primarily controlled by meteorological factors [30]. Sun (2022) [31] found that approximately 23.5% of the area within the Jing River basin exhibited soil moisture deficits. Additionally, from 1990 to 2019, there was a significant decrease in vegetation-soil moisture compatibility across the basin, and the increase in vegetation recovery led to a continuous rise in soil moisture depletion within the Jing River basin. In terms of spatial distribution, soil moisture overuse was observed in the southern part of the basin, while significant available space existed in the central and northern regions. Overall, the alignment between soil moisture and vegetation patterns across the entire basin was poor, which is consistent with the findings of our own research.
The vegetation changes resulting from farmland’s return to forest (grassland) and soil and water conservation measures have led to a significant decrease in shallow soil moisture. This is primarily due to the fact that during the early stages of vegetation restoration and establishment, significant soil moisture is consumed for plant growth. Because vegetation roots are primarily concentrated in the shallow soil layer, they cannot access the effective soil moisture in the deeper layers. Deeper vegetation roots imply better access to effective soil moisture for growth. Improving strategies for using effective soil moisture can also help the growth and development of the vegetation itself. During this period, the storage of effective soil moisture in the shallow soil layer decreases rapidly. Shrublands and grasslands consume more effective soil moisture than croplands and deciduous forests. Therefore, these two vegetation types experience the greatest decrease in effective soil moisture storage, and canopy interception in deciduous forests can also alter the water balance and distribution process to some extent. Canopy interception and vegetation transpiration play an important role in the recovery of effective water storage. Since shrublands, grasslands, and deciduous forests make up a significant proportion of the land use in the watershed, the average effective soil moisture in the entire watershed shows a decrease after the implementation of farmland return to forest (grassland) measures. In terms of spatial distribution, the distribution of soil moisture within the watershed closely follows the characteristics of precipitation. The reduction in soil moisture in certain areas of the northern and southeastern parts of the watershed is mainly attributed to the conversion of cultivated land to grasslands in the northern region and the transition of cultivated land to shrublands and deciduous forests in the eastern and southern regions [32].

5. Conclusions

This study used the Water and Energy Budget-based Peak-Flow (WEP) model to simulate the main hydrological processes in the Jing River Basin from 1980 to 2019 and analyze the spatiotemporal variations of the main elements of the hydrological cycle, including runoff, soil moisture, and reference evapotranspiration. The simulation period was divided into two periods: the pre-afforestation and grassland restoration period from 1980 to 1999, and the post-afforestation and grassland restoration period from 2000 to 2019. Model parameter calibration and validation of runoff and soil moisture simulation results were performed for each period. The simulation results showed satisfactory performance in simulating runoff, evapotranspiration, and soil moisture. After afforestation and grassland restoration, the runoff in the Jing River Basin decreased by 20.91%, mainly during the flood season, indicating the effectiveness of vegetation restoration measures in reducing runoff. Spatially, the peak runoff depth decreased by 24.91% after afforestation and grassland restoration, with the most significant decrease observed in the northern and central parts of the basin. The average soil moisture in the 0–0.8 m soil layer showed a south-to-north distribution pattern, indicating a general decrease in soil moisture in the watershed after afforestation and grassland restoration.
This study did not fully consider the impact of social water cycle processes and climate change. Although the study focused on the hydrological effects of vegetation changes resulting from afforestation and grassland restoration at the spatial scale, it is important to note that factors such as agricultural water use, agricultural irrigation, and soil conservation measures also significantly influence the hydrological processes in the Jing River Basin. Climate elements such as precipitation and temperature directly determine the precipitation source for land surface processes and soil moisture balance, exerting a significant influence on hydrological cycle processes. Therefore, it is necessary to consider more influencing factors in future research to achieve more accurate simulations. In addition, given the large scale of watersheds, the profound impact of human activities, and the complex and dynamic environmental conditions in our country, traditional lumped hydrological models based on parameter calibration cannot objectively depict runoff generation mechanisms or predict the impact of human activities. However, purely mathematical and physical equation-based simulations are constrained by computational limitations and scale issues. Therefore, the future direction lies in the development of distributed watershed hydrological models based on physical concepts and variable temporal and spatial resolutions.

Author Contributions

Conceptualization, G.Z.; methodology, Z.Z.; software, Y.C.; validation, X.Z.; formal analysis, Y.C.; investigation, Y.C.; resources, X.Z.; data curation, G.Z.; writing—original draft preparation, G.Z.; writing—review and editing, Z.Z.; supervision, X.Z.; project administration, G.Z.; funding acquisition, G.Z. All authors have read and agreed to the published version of the manuscript.

Funding

Huang Committee Outstanding Young Talents Science and Technology Project [HQK-202305]; Qian Kehe Zhicheng [2023] Yiban 206.

Conflicts of Interest

The authors declare no conflict of interest.

References

  1. Jiao, L.; Lu, N.; Fang, W.; Li, Z.; Wang, J.; Jin, Z. Determining the independent impact of soil water on forest transpiration: A case study of a black locust plantation in the Loess Plateau, China. J. Hydrol. 2019, 572, 671–681. [Google Scholar] [CrossRef]
  2. Jin, Z.; Guo, L.; Lin, H.; Wang, Y.; Yu, Y.; Chu, G.; Zhang, J. Soil moisture response to rainfall on the Chinese Loess Plateau after a long-term vegetation rehabilitation. Hydrol. Process. 2018, 32, 1738–1754. [Google Scholar] [CrossRef]
  3. Jian, S.; Wu, Z.; Hu, C.; Zhang, X. Sap flow in response to rainfall pulses for two shrub species in the semiarid Chinese Loess Plateau. J. Hydrol. Hydromechanics 2016, 64, 121–132. [Google Scholar] [CrossRef]
  4. Youssef, M.A.; Liu, Y.; Chescheir, G.M.; Skaggs, R.W.; Negm, L.M. DRAINMOD modeling framework for simulating controlled drainage effect on lateral seepage from artificially drained fields. Agric. Water Manag. 2021, 254, 106944. [Google Scholar] [CrossRef]
  5. Yu, Q.; Kang, S.; Hu, S.; Zhang, L.; Zhang, X. Modeling soil water-salt dynamics and crop response under severely saline condition using WAVES: Searching for a target irrigation volume for saline water irrigation. Agric. Water Manag. 2021, 256, 107100. [Google Scholar] [CrossRef]
  6. Tian, F.; Feng, X.; Zhang, L.; Fu, B.; Wang, S.; Lv, Y.; Wang, P. Effects of revegetation on soil moisture under different precipitation gradients in the Loess Plateau, China. Hydrol. Res. 2017, 48, 1378–1390. [Google Scholar] [CrossRef]
  7. Simunek, J.; Van Genuchten, M.T.; Sejna, M. Recent Developments and Applications of the HYDRUS Computer Software Pack-ages. Vadose Zone J. 2016, 15, vzj2016.04.0033. [Google Scholar] [CrossRef]
  8. Bai, X.; Jia, X.; Jia, Y.; Hu, W. Modeling long-term soil water dynamics in response to land-use change in a semi-arid area. J. Hydrol. 2020, 585, 124824. [Google Scholar] [CrossRef]
  9. Richards La, W.C. Soil water and plant growth. Soil Phys. Cond. Plant Growth 1952, 2, 74–253. [Google Scholar]
  10. Zhang, C.; Wang, Y.; Jia, X.; An, Z. Variations in capacity and storage of plant-available water in deep profiles along a re-vegetation and precipitation gradient. J. Hydrol. 2020, 581, 124401. [Google Scholar] [CrossRef]
  11. Laio, F.; Porporato, A.; Ridolfi, L.; Rodriguez-Iturbe, I. Plants in water-controlled ecosystems: Active role in hydrologic processes and response to water stress-II. Probabilistic soil moisture dynamics. Adv. Water Resour. 2001, 24, 707–723. [Google Scholar] [CrossRef]
  12. Li, X.; Shao, M.; Jia, X.; Wei, X. Profile distribution of soil–water content and its temporal stability along a 1340-m long transect on the Loess Plateau, China. Catena 2016, 137, 77–86. [Google Scholar] [CrossRef]
  13. Zastrow, M. China’s tree-planting could falter in a warming world. Nature 2019, 573, 474–475. [Google Scholar] [CrossRef] [PubMed]
  14. Seyfried, M.S.; Schwinning, S.U.; Walvoord, M.A.; Pockman, W.T.; Newman, B.D.; Jackson, R.B.; Phillips, F.M. Ecohydrological control of deep drainage in arid and semiarid regions. Ecology 2005, 86, 277–287. [Google Scholar] [CrossRef]
  15. Li, H.; Si, B.; Li, M. Rooting depth controls potential groundwater recharge on hillslopes. J. Hydrol. 2018, 564, 164–174. [Google Scholar] [CrossRef]
  16. Hu, W.; Biswas, A.; Si, B.C. Scale-specific control of soil water storage using multivariate empirical mode decomposition. In Proceedings of the 5th Global Workshop on Digital Soil Mapping, Sydney, Australia, 10–13 April 2012; pp. 139–144. [Google Scholar]
  17. Jia, X.; Shao, M.A.; Zhang, C.; Zhao, C. Regional temporal persistence of dried soil layer along south-north transect of the Loess Plateau, China. J. Hydrol. 2015, 528, 152–160. [Google Scholar] [CrossRef]
  18. Western, A.W.; Grayson, R.B.; Blöschl, G. Scaling of Soil Moisture: A Hydrologic Perspective. Annu. Rev. Earth Planet. Sci. 2002, 30, 149–180. [Google Scholar] [CrossRef]
  19. Wang, T.; Liu, Q.; Franz, T.E.; Li, R.; Lang, Y.; Fiebrich, C.A. Spatial patterns of soil moisture from two regional monitoring networks in the United States. J. Hydrol. 2017, 552, 578–585. [Google Scholar] [CrossRef]
  20. Jia, X.; Zhu, Y.; Luo, Y. Soil moisture decline due to afforestation across the Loess Plateau, China. J. Hydrol. 2017, 546, 113–122. [Google Scholar] [CrossRef]
  21. Su, H.; Jia, Y.; Liu, H.; Li, Y.; Du, J.; Niu, C. Runoff evolution simulation and attribution analysis in cold region basin based on WEP-L model. J. Glaciol. Geocryol. 2021, 43, 1523–1530, (In Chinese with English abstract). [Google Scholar]
  22. Gan, Y.; Zhao, S.; Zheng, L. A distributed hydrological model considering the influence of two flow regions and its application. China Rural. Water Hydropower 2023, 3, 8–20, (In Chinese with English abstract). [Google Scholar]
  23. Zhou, Z.; Liu, J.; Yan, Z.; Wang, H.; Jia, Y. Attribution analysis of natural river runoff evolution in Yellow River Basin. Adv. Water Sci. 2022, 33, 27–37, (In Chinese with English abstract). [Google Scholar]
  24. Fan, Y.; Miguez-Macho, G.; Jobbágy, E.G.; Jackson, R.B.; Otero-Casal, C. Hydrologic regulation of plant rooting depth. Proc. Natl. Acad. Sci. USA 2017, 114, 10572–10577. [Google Scholar] [CrossRef]
  25. Guillod, B.P.; Orlowsky, B.; Miralles, D.G.; Teuling, A.J.; Seneviratne, S.I. Reconciling spatial and temporal soil moisture effects on afternoon rainfall. Nat. Commun. 2015, 6, 6443. [Google Scholar] [CrossRef] [PubMed]
  26. Rewald, B.; Meinen, C.; Trockenbrodt, M.; Ephrath, J.E.; Rachmilevitch, S. Root taxa identification in plant mixtures – current techniques and future challenges. Plant Soil 2012, 359, 165–182. [Google Scholar] [CrossRef]
  27. Askar, M.H.; A Youssef, M.; Chescheir, G.M.; Negm, L.M.; King, K.W.; Hesterberg, D.L.; Amoozegar, A.; Skaggs, R.W. DRAINMOD Simulation of macropore flow at subsurface drained agricultural fields: Model modification and field testing. Agric. Water Manag. 2020, 242, 106401. [Google Scholar] [CrossRef]
  28. Liu, Y.; Gu, Y.; Liu, Y.; Ma, X. Hydrometeorological evolution and its change attribution in Jinghe. Water Resources and Hydro-power Engineering 2023, 6, 6, (In Chinese with English abstract). [Google Scholar]
  29. Chen, W.; Hou, Z.; Wu, L.; Liang, Y.; Wei, C. Evaluating salinity distribution in soil irrigated with saline water in arid regions of northwest China. Agric. Water Manag. 2010, 97, 2001–2008. [Google Scholar] [CrossRef]
  30. Khan, M.D.; Shakya, S.; Vu, H.H.T.; Ahn, J.W.; Nam, G. Water Environment Policy and Climate Change: A Comparative Study of India and South Korea. Sustainability 2019, 11, 3284. [Google Scholar] [CrossRef]
  31. Sun, M. Evaluation of Ecohydrological Effect and Optimization and Regulation of Vegetation Suitability Pattern in Jinghe River Basin, Loess Plateau. Ph.D. Thesis, Northwest A&F University, Xianyang, China, 2022. [Google Scholar]
  32. Mao, Z.W. Study on Plant Available Soil Water Storage and Carrying Capacity of Vegetation in Jinghe River Basin. Master’s Thesis, Zhengzhou University, Zhengzhou, China, 2023. [Google Scholar]
Figure 1. Study area.
Water 15 02989 g001
Figure 2. Time series of interannual precipitation and temperature in the Jinghe River Basin from 1980 to 2019.
Water 15 02989 g002
Figure 3. Land use distribution map of the Jing River Basin from 1980 to 2018.
Water 15 02989 g003
Figure 4. WEP model building flowchart.
Water 15 02989 g004
Figure 5. Subbasin unit diagram of the WEP model in the Jinghe River Basin.
Water 15 02989 g005
Figure 6. Comparison of monthly runoff flow processes between the WEP model and measured monthly runoff flow processes in the Jing River Basin from 1980 to 2019.
Water 15 02989 g006
Figure 7. Results of soil moisture verification in 20 cm and 80 cm soil layers in the Jinghe River Basin from 1980 to 2019. (a) Validation of soil moisture in the WEP model from 1980 to 1999; (b) Validation of soil moisture in the WEP model from 2000 to 2019. NSE, Nash efficiency coefficient; RE, average relative error.
Water 15 02989 g007
Figure 8. Spatial distribution of simulated monthly mean runoff yield and discharge in the Jinghe River Basin from 1980 to 2019.
Water 15 02989 g008
Figure 9. Spatial distribution of simulated monthly reference evapotranspiration values in the Jinghe River Basin from 1980 to 2019.
Water 15 02989 g009
Figure 10. Spatial distribution of simulated monthly mean soil water values of 0–0.8 m from 1980 to 2019 in the Jinghe River Basin.
Water 15 02989 g010
Table 1. Sources of soil moisture data.
PositionPeriodSourceQuantitySoil DepthMeasurement Method
Xifeng1981–1999International soil moisture network9620–1 mSoil moisture sensor
Huanxian1981–1999International soil moisture network7550–2 mSoil moisture sensor
Nanxiaohegou basin2005–2006
2016–2018
Published literature4040–2 mTDR
Wangdonggou
basin in Changwu
2010–2015Published literature550–2 mTDR
Zhifanggou basin2017–2019Published dataset1560–2 mTDR
Zhonggou basin2017–2019Published dataset1220–2 mTDR
Table 2. Proportion of land use types in the Jing River Basin from 1980 to 2018.
LUFarmland/%Arbor/%Shrub/%Grass/%Water/%Urban/%
Year
198042.604.575.0545.970.501.18
200042.554.494.9746.250.401.34
201838.435.045.5648.430.402.00
Note: LU—land use.
Table 3. Land use transfer matrix in the Jing River Basin from 1980 to 2000.
1980Farmlaznd/km2Arbor/km2Shrub
/km2
Grass
/km2
Water
/km2
Urban
/km2
Total
/km2
2000
Farmland/km218,494.403.393.4185.3241.083.0318,630.64
Arbor/km230.261914.032.1617.552.280.141966.42
Shrub/km23.591.882156.8012.630.400.012175.32
Grass/km246.3082.83100.4920,006.8012.970.4420,249.83
Water/km27.150.050.001.64161.780.02170.63
Urban/km268.830.670.432.931.15513.26587.26
Total/km218,650.532002.852263.2820,126.89219.66516.8943,780.10
Table 4. Land use transfer matrix in the Jing River Basin from 2000 to 2018.
2000Farmland/km2Arbor/km2Shrub
/km2
Grass
/km2
Water
/km2
Urban
/km2
Total
/km2
2018
Farmland/km212,851.00165.30183.323437.0036.12153.0616,825.80
Arbor/km2279.481452.2865.18398.592.588.552206.66
Shrub/km2223.9955.451615.96537.780.851.492435.52
Grass/km24790.00274.11303.8615,741.0027.1161.7421,197.82
Water/km246.933.100.7021.8994.151.81168.57
Urban/km2412.8612.762.7082.946.05360.20877.51
Total/km218,604.261963.002171.7320,219.20166.85586.8443,780.10
Table 5. WEP model parameter range.
ParametersSuggestive ValuesDefaultParametersSuggestive ValuesDefault
Aquifer thickness correction factor0.1–201Reserve depth of woodland depression (mm)20–8060
Layer 1 soil thickness (m)0.1–0.80.2Reserve depth of grassland depression (mm)10–5030
Layer 2 soil thickness (m) (m)0.2–20.6Open depression depth (mm)2–2010
Layer 3 Soil thickness (m) (m)0.3–21.2Reserve depth of slope farmland depression (mm)5–3015
Stomatal impedance correction factor0.01–1001Reservoir depth of paddy depression (mm)80–200120
Correction coefficient of river roughness0.2–21Storage depth of irrigated farmland depression (mm)50–12080
Correction coefficient of slope roughness0.2–21Reserve depth of non-irrigated farmland depression (mm)40–10080
Correction coefficient of soil saturated water conductivity0.01–1001Reserve depth of basin depression (mm)80–300110
Aquifer side guide water coefficient correction coefficient0.1–63Terraced depression storage depth (mm)60–20080
Correction coefficient of river bed floor material drainage conductivity correction0.01–1001
Table 6. Results of parameter calibration.
Parameters1980–19992000–2019Parameters1980–19992000–2019
Correction coefficient of aquifer thickness11.3Maximum depression storage depth of forest(mm)6060
The thickness of the first soil layer (m)0.20.2Maximum depression storage depth of grass (mm)3030
The thickness of the second soil layer (m)0.60.6Maximum depression storage depth of bare soil (mm)1010
The thickness of the third soil layer (m)1.21.2Maximum depression storage depth of cultivated hillslope (mm)1515
Correction coefficient of stomatal resistance10.3Maximum depression storage depth of paddy field (mm)120120
Correction coefficient of Manning roughness in river channel11Maximum depression storage
depth of irrigated farmland (mm)
8080
Correction coefficient of Manning roughness in slope11Maximum depression storage
depth of non-irrigated farmland (mm)
8080
Correction coefficient of saturated hydraulic conductivity0.81.3Maximum depression storage
depth of check dam (mm)
110110
Correction coefficient of lateral hydraulic conductivity of aquifer33Maximum depression storage
depth of Terraced field (mm)
8080
Correction coefficient of conductivity of river bed materials11
Table 7. Evaluation of the simulation results of the monthly runoff gauge with the WEP model in the Jinghe River Basin.
PeriodModel Performance CriteriaRate PeriodVerification Period
1980–1999Nash–Sutcliffe efficiency coefficient0.720.75
Coefficient of determination (R2)0.950.98
Relative error (Re)15.89%13.25%
2000–2019Nash–Sutcliffe efficiency coefficient0.730.70
Coefficient of determination (R2)0.950.91
Relative error (Re)15.81%17.91%
Note: The Nash–Sutcliffe efficiency coefficient is used to assess the predictive performance of a model, primarily focusing on the accuracy and fitness of the model. A coefficient of determination is utilized to describe the degree of association between variables, regardless of whether a causal relationship exists.
Disclaimer/Publisher’s Note: The statements, opinions and data contained in all publications are solely those of the individual author(s) and contributor(s) and not of MDPI and/or the editor(s). MDPI and/or the editor(s) disclaim responsibility for any injury to people or property resulting from any ideas, methods, instructions or products referred to in the content.

