Article

Extreme Runoff Estimation for Ungauged Watersheds Using a New Multisite Multivariate Stochastic Model MASVC

by
Joel Hernández-Bedolla
,
Liliana García-Romero
,
Chrystopher Daly Franco-Navarro
,
Sonia Tatiana Sánchez-Quispe
* and
Constantino Domínguez-Sánchez
*
Faculty of Civil Engineering, Universidad Michoacana de San Nicolás de Hidalgo, Morelia 58030, Mexico
*
Authors to whom correspondence should be addressed.
Water 2023, 15(16), 2994; https://doi.org/10.3390/w15162994
Submission received: 29 May 2023 / Revised: 31 July 2023 / Accepted: 8 August 2023 / Published: 19 August 2023

Abstract

:
Precipitation is influential in determining runoff at different scales of analysis, whether in minutes, hours, or days. This paper proposes the use of a multisite multivariate model of precipitation at a daily scale. Stochastic models allow the generation of maximum precipitation and its association with different return periods. The modeling is carried out in three phases. The first is the estimation of precipitation occurrence by using a two-state multivariate Markov model to calculate the non-rainfall periods. Once the rainfall periods of various storms have been identified, the amount of precipitation is estimated through a process of normalization, standardization of the series, acquisition of multivariate parameters, and generation of synthetic series. In comparison, the analysis applies probability density functions that require fewer data and, consequently, represent greater certainty. The maximum values of surface runoff show consistency for different observed return periods, therefore, a more reliable estimation of maximum surface runoff. Our approach enhances the use of stochastic models for generating synthetic series that preserve spatial and temporal variability at daily, monthly, annual, and extreme values. Moreover, the number of parameters reduces in comparison to other stochastic weather generators.

1. Introduction

The frequency analysis of extreme hydrological events to estimate the probability of occurrence is required to design control and management systems [1]. Extreme hydrological events have negative economic and social impacts on human populations. Protection of these populations requires an optimal design of hydraulic structures in terms of a hypothetical extreme event known as design flow or precipitation associated with a particular return period [2].
Often, the return period associated with the design event of a hydraulic structure exceeds the observation periods, and extrapolations must be assumed from the recorded values. Frequency analysis, which relates the magnitude of extreme events to the probability of occurrence using probability distribution functions, is often used to estimate this event [3,4,5].
A relevant problem in frequency analysis is the selection of the appropriate probability distribution to describe the behavior of the observed data. There are several probability distribution functions for frequency analysis, but none is universally accepted as the best for analyzing hydro-climatological variables [6,7,8]. Some of the most used distributions in hydrology are normal, log-normal, Gumbel, Weibull, General Extreme Value (GEV), Pearson, and log-Pearson type III [6,7,8,9]. In Mexico and Latin America, the Gumbel distribution function has been widely applied as a distribution for evaluating extreme events [10,11,12].
The estimated values using probability distributions differ from each other. Therefore, it is necessary to select which best fits the time series under analysis. Such a selection is generally based on goodness-of-fit tests which represent the agreement between the empirical distribution of frequencies and theoretical distribution [13].
Traditionally, these studies to estimate maximum flows have been carried out based on the design storm. However, it is known that this approach is uncertain since peak discharges and hydrographs are strongly dependent on the initial conditions of the basin and on the spatiotemporal distribution of the precipitation [14].
Recently, stochastic weather generators have been proposed to produce synthetic rainfall series [1]. The most common stochastic model is the first-order Markov model with two states, introduced by Gabriel and Newman [15]. The stochastic weather generator MASVC [16] is a multisite multivariate stochastic model, which reproduces the main statistics using normalization and standardization. The multisite standardized series are calibrated by multivariate autoregressive parameters of the stochastic model [17]. Other stochastic generators include: Weather GENerator (WGEN) [18], CLIMA [19], CLIMate GENerator CLIMGEN [20], Long Ashton Research Station-Weather Generator (LARS-WG) [21], École de Technologie Supériuere Weather Generator (WeaGETS) [22], Multi-site Rainfall Simulator (MRS) [23], CLImate GENerator (CLIGEN) [24], among others.
The objective of applying the multisite multivariate model is to analyze the surface runoff for different return periods [25]. The traditional process for estimating runoff for ungauged watersheds is by using annual maximum rainfall. Subsequently, the best-fit distribution functions are identified, as well as the temporal disaggregation of precipitation. Finally, the maximum runoff is obtained. The present research focuses on acquiring various runoffs through a multisite multivariate stochastic model. The purpose is to use daily scale information and generate synthetic series that allow obtaining return periods associated with the results of the stochastic model. In addition, the SCS-CN method determines the runoffs and the runoff number for the study zones.

2. Materials and Methods

This paper proposes a continuous multisite multivariate model of daily precipitation. Stochastic models allow the generation of maximum precipitation and its association to different return periods. The modeling is carried out in three phases. The first is the estimation of precipitation occurrence by using a two-state multivariate Markov model to calculate the non-rainfall periods. Once the rainfall periods of several storms have been identified, the precipitation amounts are estimated through a process of normalization, standardization of the series, acquisition of multivariate parameters, and generation of synthetic series [16]. The maximum values show consistency for different return periods, therefore, a more reliable estimation of the maximum discharge [25]. Figure 1 displays the proposed methodology.

2.1. Multisite Multivariate Stochastic Model MASVC

Stochastic modeling of precipitation has been investigated mainly at a daily scale, which can be simulated by a short memory model for both past and future cases [26], and is used for runoff determination [27]. Precipitation data are necessary to determine short-term hydrological variability [28], while temporal analysis of minutes to hours is commonly applied [29,30]. On a daily scale, stochastic models have been developed for rainfall analysis [31,32].
In essence, the stochastic modeling of different scales represents a general problem-solving process. However, each stochastic model has its particularities, which will depend on the analysis scale [33]. The general objective of the current investigation is to use the multisite multivariate stochastic model MASVC [16]. This model simulates rainfall with daily time dependence and analyzes rainfall in two phases, divided into occurrence and amount. MASVC estimates rainfall occurrence, and the amount of rainfall model is a first-order continuous autoregressive model, although it has been used to generate rainfall and temperatures [16].
The purpose of utilizing the MASVC 1.0 software is to generate 1000 series of equal lengths to obtain different return periods. Although it is common for stochastic models to present uncertainty in the extreme quartile [10], in this case, the stochastic model is consistent with daily maximum precipitation data.
MASVC applies a Wilks approach for the occurrence process [34] based on conditional and critical normal probabilities, which depend on the previous day. The multivariate occurrence process uses a spatially correlated normal matrix. A wet day is the normal vector for a day greater than a critical probability. This transition matrix varies daily.
MASVC uses the random spatially correlated normal matrix n = M N to produce synthetic occurrence series. M is the lower triangular matrix, and N is the random normal matrix. This matrix was used to generate multivariate precipitation occurrences.
The multivariate autoregressive coefficient’s matrix was calibrated for rainfall generation, resulting in the residual series ( ε τ = ϕ 0 1 ( z τ ϕ 1 z τ 1 ). Where ε τ is the residual series, ϕ 0 1 is the inverse lag-0 autoregressive coefficient matrix, ϕ 1 is the lag-1 autoregressive coefficient matrix, z τ is the standardized vectors for day τ , and z τ 1 is the standardized vectors for the previous day τ 1 . All the units for the vectors and matrices are non-dimensional. The residual series satisfied the mean, correlation, standard deviation, and skewness coefficient of the entire series within the confidence limits according to 95% of normal distribution [35,36,37]. Next, a random number with a normal distribution ( ε ) obtains the standardized series ( z t ) and inverse normalization ( y τ 1 ).

2.2. Probability Density Functions (PDF)

Traditional methods to obtain extrapolations for a return period use distribution functions. However, they have a disadvantage in that they apply few precipitation records [38]; one per year. Therefore, they have higher uncertainty [1,39], and fitting PDFs’ distribution suffers from numerical stability [40]. The most common distribution functions are normal, log-normal, gamma, log-Pearson type III, Gumbel, and log-Gumbel [2,38,41,42,43,44,45,46].
Normal PDF. The expression that determines a normal distribution is given as follows by Equation (1):
F x = 1 σ y 2 π e 1 2 x μ y σ y 2            
where μ y is the location parameter and σ y is the scale parameter.
2-Parameter Log-Normal PDF. The mathematical expression that determines this function is given by Equation (2):
F x = 0 x 1 x σ y 2 π e 1 2 I n   x μ y σ y                
where μ y is the location parameter and σ y is the scale parameter.
3-Parameter Log-Normal PDF. The mathematical expression corresponding to this distribution is Equation (3):
F x = 0 x 1 ( x x 0 ) σ y 2 π e 1 2 I n   ( x x 0 ) μ y σ y                
where x 0 is the location parameter, μ y is the scale parameter, and σ y is the shape parameter.
2-Parameter Gamma PDF. The 2-parameter gamma function is given by Equation (4):
F x = 0 x x β 1 e x α α β Γ ( β ) d x                
where α is the scale parameter, β is the shape parameter, and Γ ( β ) is the complete gamma function.
3-Parameter Gamma PDF. For the 3-parameter gamma function (also known as Pearson) Equation (5) is considered:
F x = 0 x 1 α Γ ( β ) x x 0 α β 1 e x x 0 α d x                    
where α is the scale parameter, β is the shape parameter, Γ(β) is the gamma function, and x 0 is the location parameter.
Log-Pearson III PDF. For this PDF the same expression that describes the 3-parameter gamma function is used except that the base-10 logarithmic transformation of the series is performed.
Gumbel PDF. This model is defined by Equation (6):
F x = e x p e x p x μ α                      
where μ is the location parameter and α is the scale parameter.
Log Gumbel PDF. The PDF log-Gumbel is defined by Equation (7):
F x = 1 α x e x p e x p ln x μ α ln x μ α                
where μ is the location parameter and α is the scale parameter.
For the PDF performance, the HidroEsta 2.0 software was used through the Kolmogorov–Smirnov test, which compares the maximum absolute value of the difference between the observed and the estimated probability density function [47,48,49,50].
D = max | F O x m F x m |            
This value is compared with the significance level, so it needs to be less than the latter to accept the null hypothesis.

2.3. Curves IDT

The curves’ intensity–duration–return period (IDT) was elaborated based on the results of the stochastic multisite multivariate model and the PDFs. The hyetograms of construction design were carried out using the method proposed by Kuichling [51]. This method consists of the maximum daily precipitation associated with various return periods. It associates the maximum intensity curves for different durations in which values such as intensity (Id), maximum precipitation (Pd), and a constant to determine the duration of a known rainfall (K) are estimated. The expressions that define the model are the Equations (8)–(10):
I d = K ( 1 e ) d e              
P d = K d 1 e 1 e                          
K = P ( 1 e ) 24 1 e              
where I d is the intensity associated with a specific duration, P d is the precipitation associated with a specific duration, K is the parameter associated with concentration time and maximum rainfall, e is the coefficient defined as a function of concentration time, and d is the interval of hours as a function of concentration time.
The Kirpich method can be applied in IDT analysis to estimate the rainfall intensity for a given duration and return period. The Kirpich method estimates the concentration time (Tc), which is the time it takes for the entire contributing area to generate runoff to a specific point. In this study, Tc is considered equal to the rainfall duration. Furthermore, it is an essential parameter in hydrological calculations to determine peak flow rates, design stormwater management systems, and analyze flood potential.

2.4. Soil Conservation Service Curve Number Method (SCS-CN)

The Soil Conservation Service Curve Number (SCS-CN) method is applied to estimate runoff from small-to-medium-sized watersheds. The SCS-CN method was established in 1954 by the USDA SCS and since then has been widely used [52,53,54,55,56,57,58,59] in GIS [60] for tropical catchment [61]. This method is presented in Equations (11)–(14):
P e = ( P I a ) 2 P I a + S
where P e is the accumulated precipitation excess, P is the accumulated rainfall, and S is the potential maximum retention. From the experimental catchments analysis of results, the SCS developed an empirical relation between I a and S . This relation is the following Equation (12):
I a = 0.2 S
Therefore, the cumulative excess is considered as Equation (13):
P e = ( P 0.2 S ) 2 ( P 0.8 S )
The S is the potential maximum retention and is given by Equation (14):
S = 25400 254 C N C N
where C N is the curve number, which varies from 25 for permeable soils with high infiltration to 100 for bodies of water.

2.5. Case Study

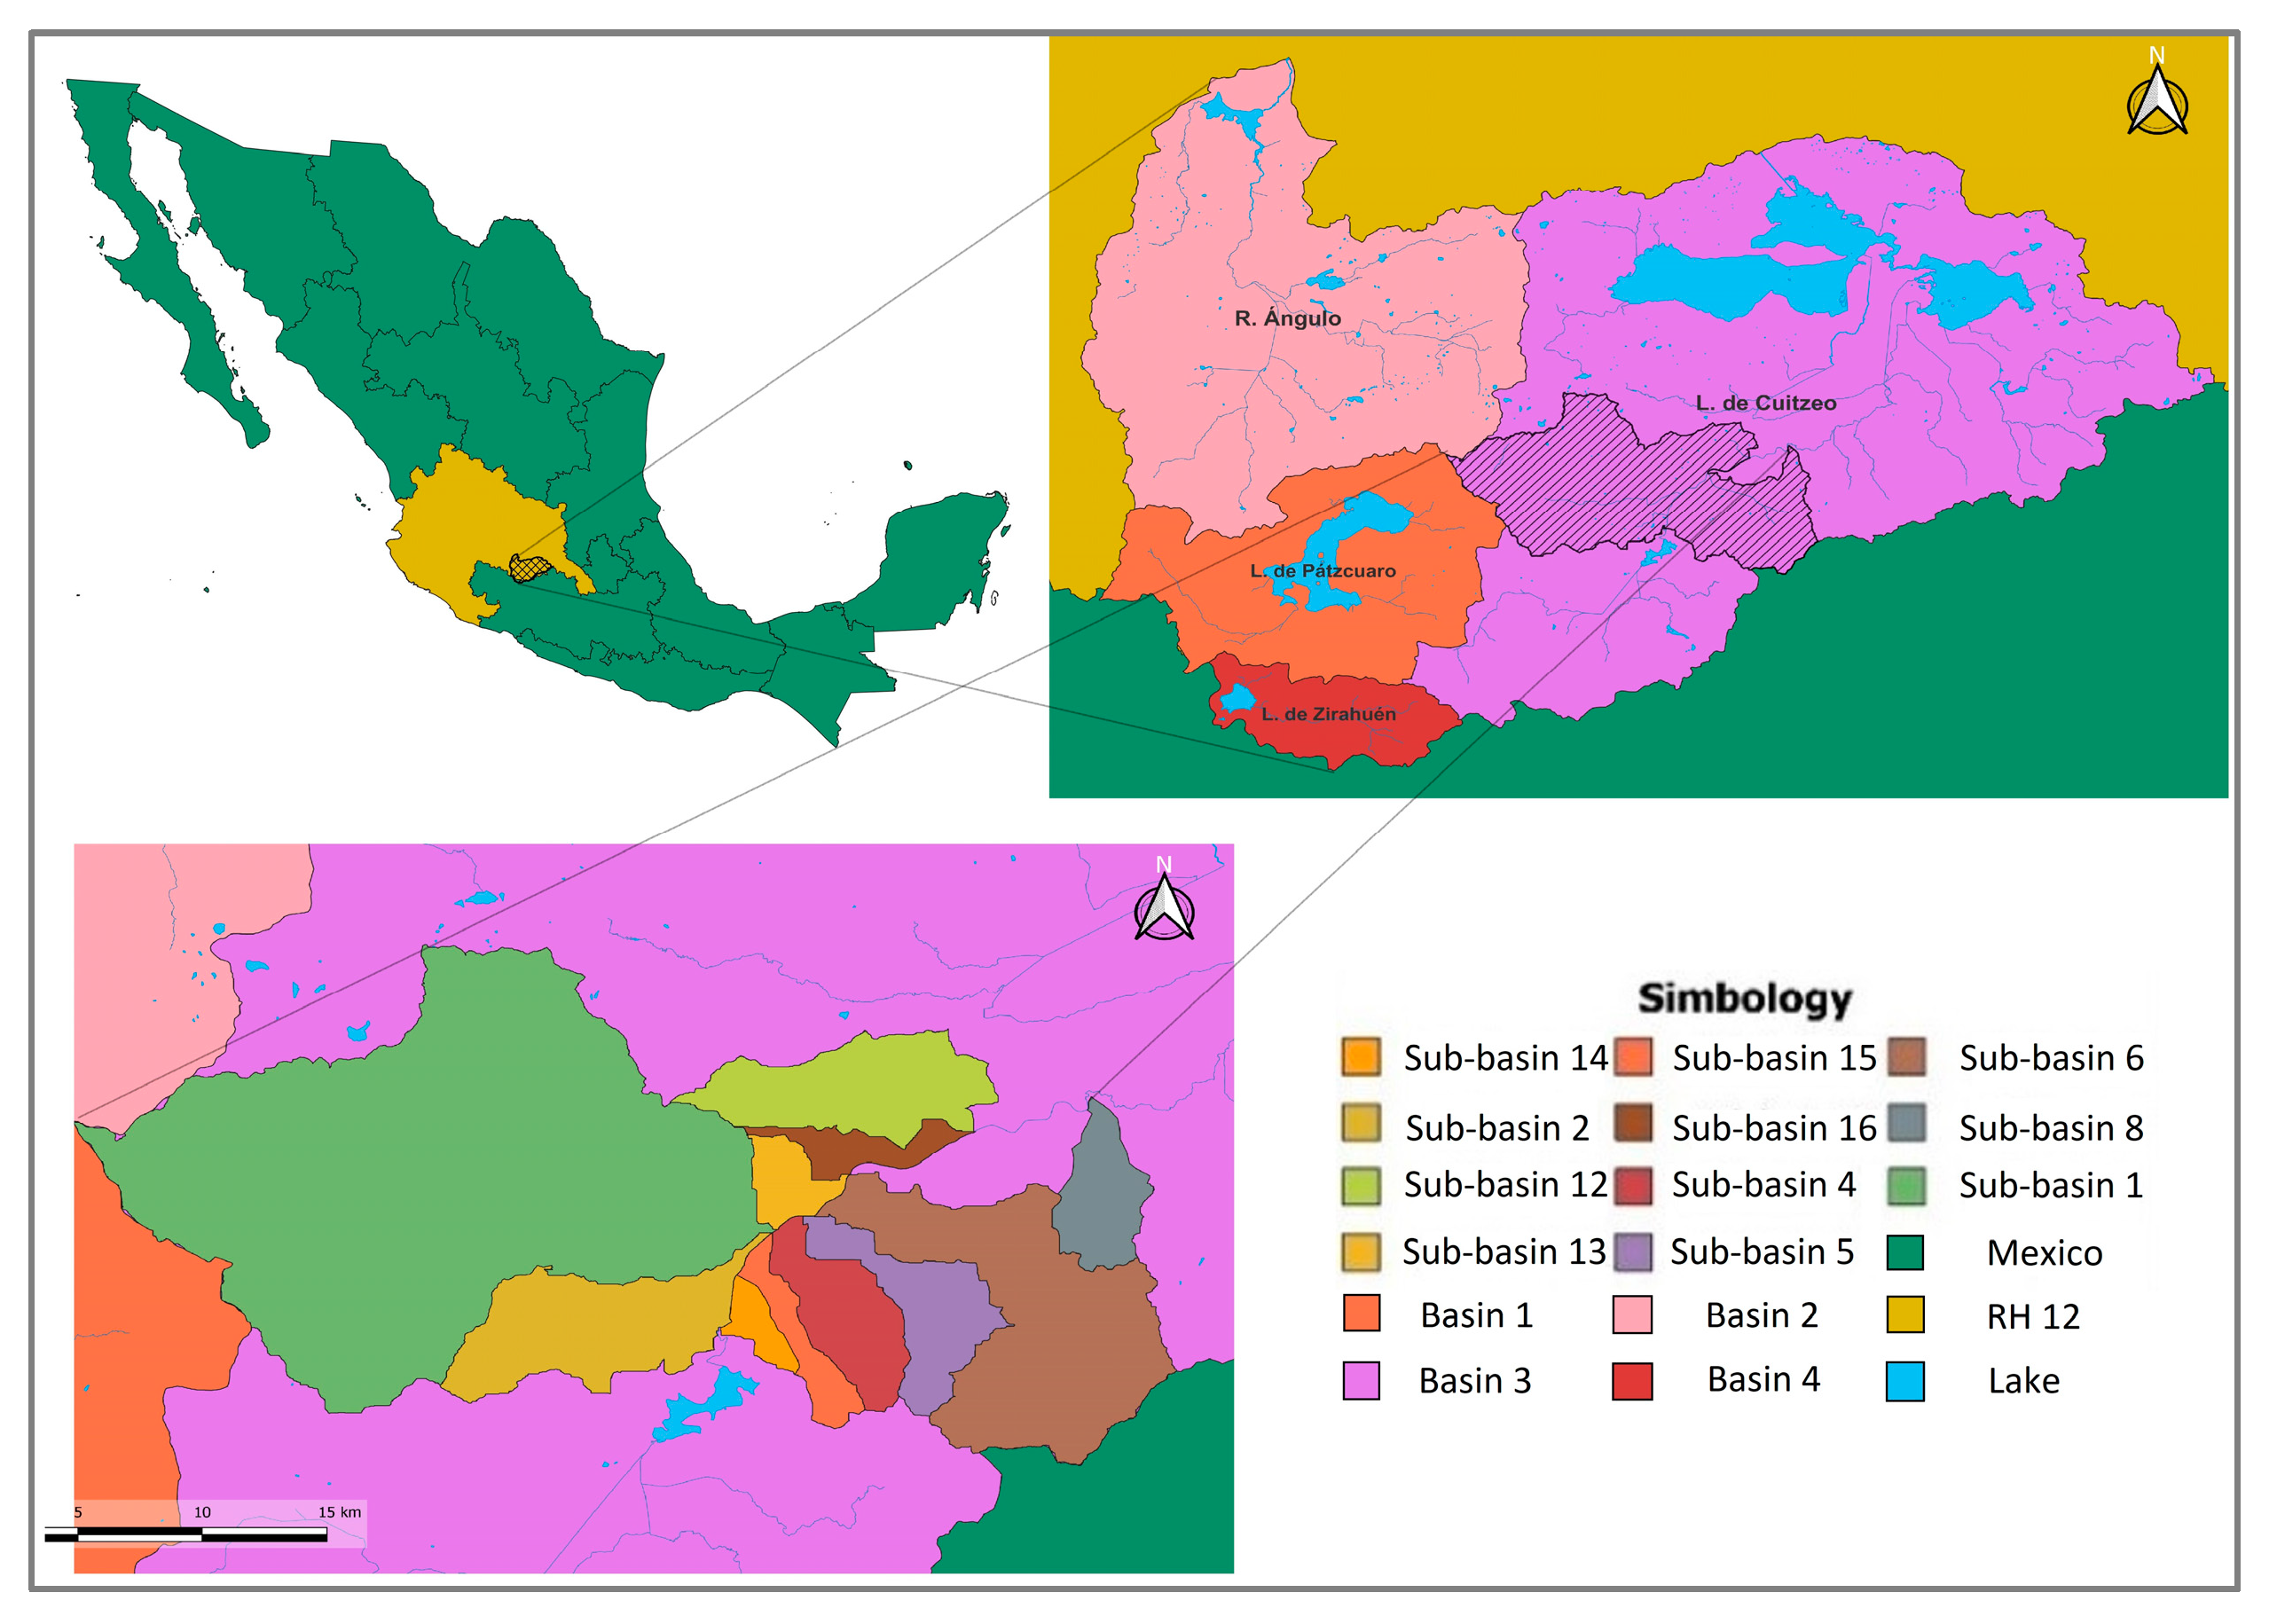
The Rio Grande de Morelia watershed is located in the north-central portion of the state of Michoacan in Mexico. The area belongs to the endorheic basin of Lake Cuitzeo in the Lerma-Santiago Hydrological Administrative Region 12 (Figure 2). The basin has an approximate area of 1565 km2. The region’s predominant climate is subhumid, with an average annual rainfall of 815 mm. The main stream of the Rio Grande de Morelia and its main tributaries (1 Itzicuaros, 2 Alberca, 4 Barajas, 5 Arroyo de Tierras, 6 Rio Chiquito, 8 Atapaneo, 12 Quinceo, 13 Mora Tovar, 14 Calabocito, 15 Calabozo, and 16 Carlos Salazar) will be considered for the subbasins. The weather stations were obtained from the national meteorological service belonging to the National Water Commission (CONAGUA), which are available at https://smn.conagua.gob.mx (accessed on 20 January 2023). Four weather stations with influence in the study area were identified: 16022, 16247, 16055, and 16081. The available data for these stations are from 1980 to 2009 (Table 1).

3. Results

To estimate the main statistics for the case study, first, a minimum wet threshold was assumed which can be the reading of the climate stations (0.1 mm). This limit was considered for the wet and dry days. The maximum 24 h rainfall for the Rio Grande of Morelia basin is between 21 and 97 mm. The average annual precipitation is between 700.7 and 1092.25 mm for the various subbasins. The number of days with precipitation occurrence is between 95 and 127 days per year with rainfall. The maximum 24 h precipitation for the four stations is between 11 and 97 mm, while the average annual precipitation is between 700 and 1090 mm for the different subbasins.

3.1. Multisite Multivariate Stochastic Results

The transition probabilities for all stations are shown in Figure 3. This probability indicates that the occurrence process is most likely on a wet day between 0.5 and 0.68. On the other hand, for a wet day following a dry day, the probability decreases to 0.1 to 0.12. The results indicate two consecutive wet days in wet seasonality are most common (June to October). The dry seasonality is between November to May.
Wet days series are known to skew to the right. To remove the skew, a log-gamma normalization was applied and the confidence limits of 95% were verified (Figure 4). The daily skewness coefficient of the historical rainfall is between 0.55 to 1.02 for all stations. After normalization, the skewness coefficient was ±0.059. These results can be considered the log-gamma transformation, which removes the skew of historical rainfall.
Standardization was performed using the normalized mean and standard deviation. MASVC uses the Fourier series to reduce the number of parameters. After standardization, multisite multivariate autoregressive coefficients were calculated by Cholesky decomposition to generate synthetic series.
The main statistics of the residual series were calculated. The mean, standard deviation, skewness coefficient, and lag-one autocorrelation are presented in Table 2. Moreover, the normal function was calculated and the results of the residual series were evaluated (Figure 5). The residual series has a mean near zero, the maximum standard deviation error is 0.0895, the skewness coefficient is between −0.1212 and 0.5622, and the lag-one autocorrelation is around −0.0581 and 0.0461. The mean, standard deviation, and lag-one autocorrelation are within the confidence limit of 95%. The skewness coefficient is within the confidence limit of 99%.
Finally, the synthetic series were generated. A total of 1000 synthetic series were made considering the same length as the sample (30 years). The statistical sum and mean were estimated for both synthetic and historical series. The sum of the number of rainy days in 30 years was calculated for the historical series. The results offer a good correlation between the observed and simulated values.
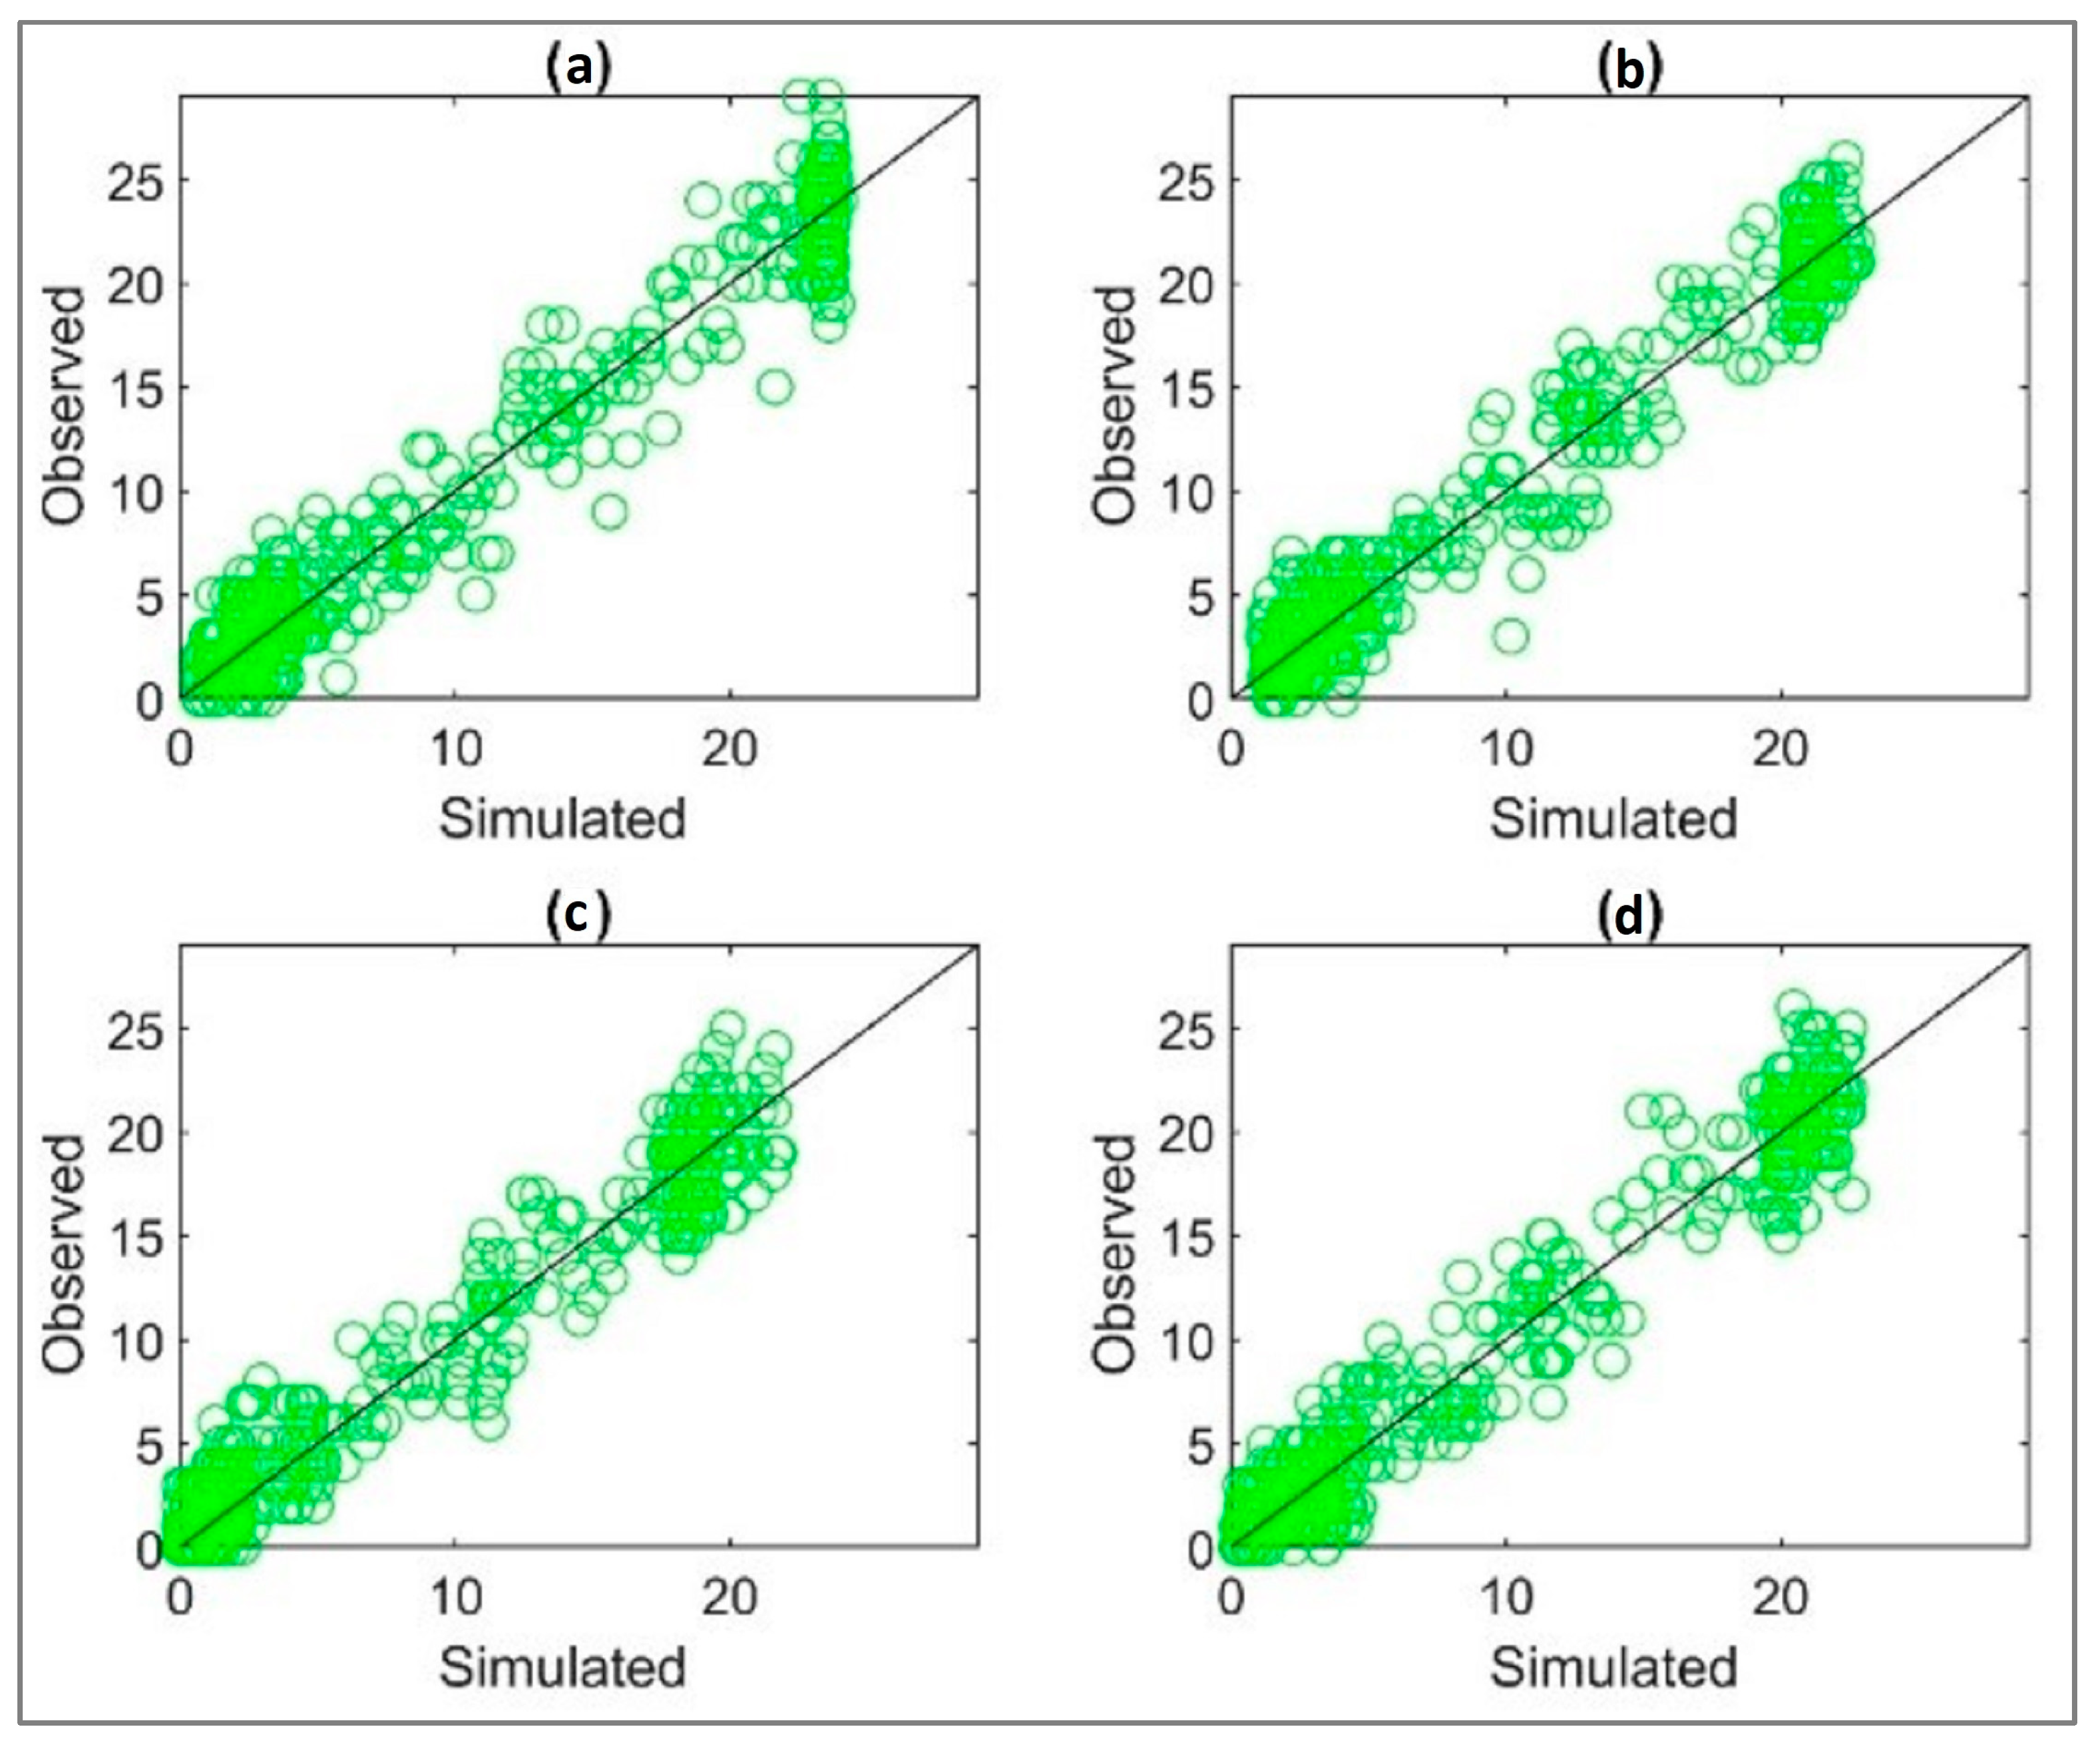
The occurrence of multisite multivariate synthetic series for the four weather stations were obtained. Figure 6 represents the sum of wet days in 30 years. For the simulated series, the mean of the sum of wet days were calculated. Afterward, the K–S test was performed to verify that the results came from the same distribution considering 95% confidence. For all analyzed stations, daily occurrences vary from the 1:1 line ±5 days (Figure 6). The variation of precipitation occurrence with regard to the number of rainy days presents a variability due to the number of parameters used in the transition matrices p01 and p11 (4).
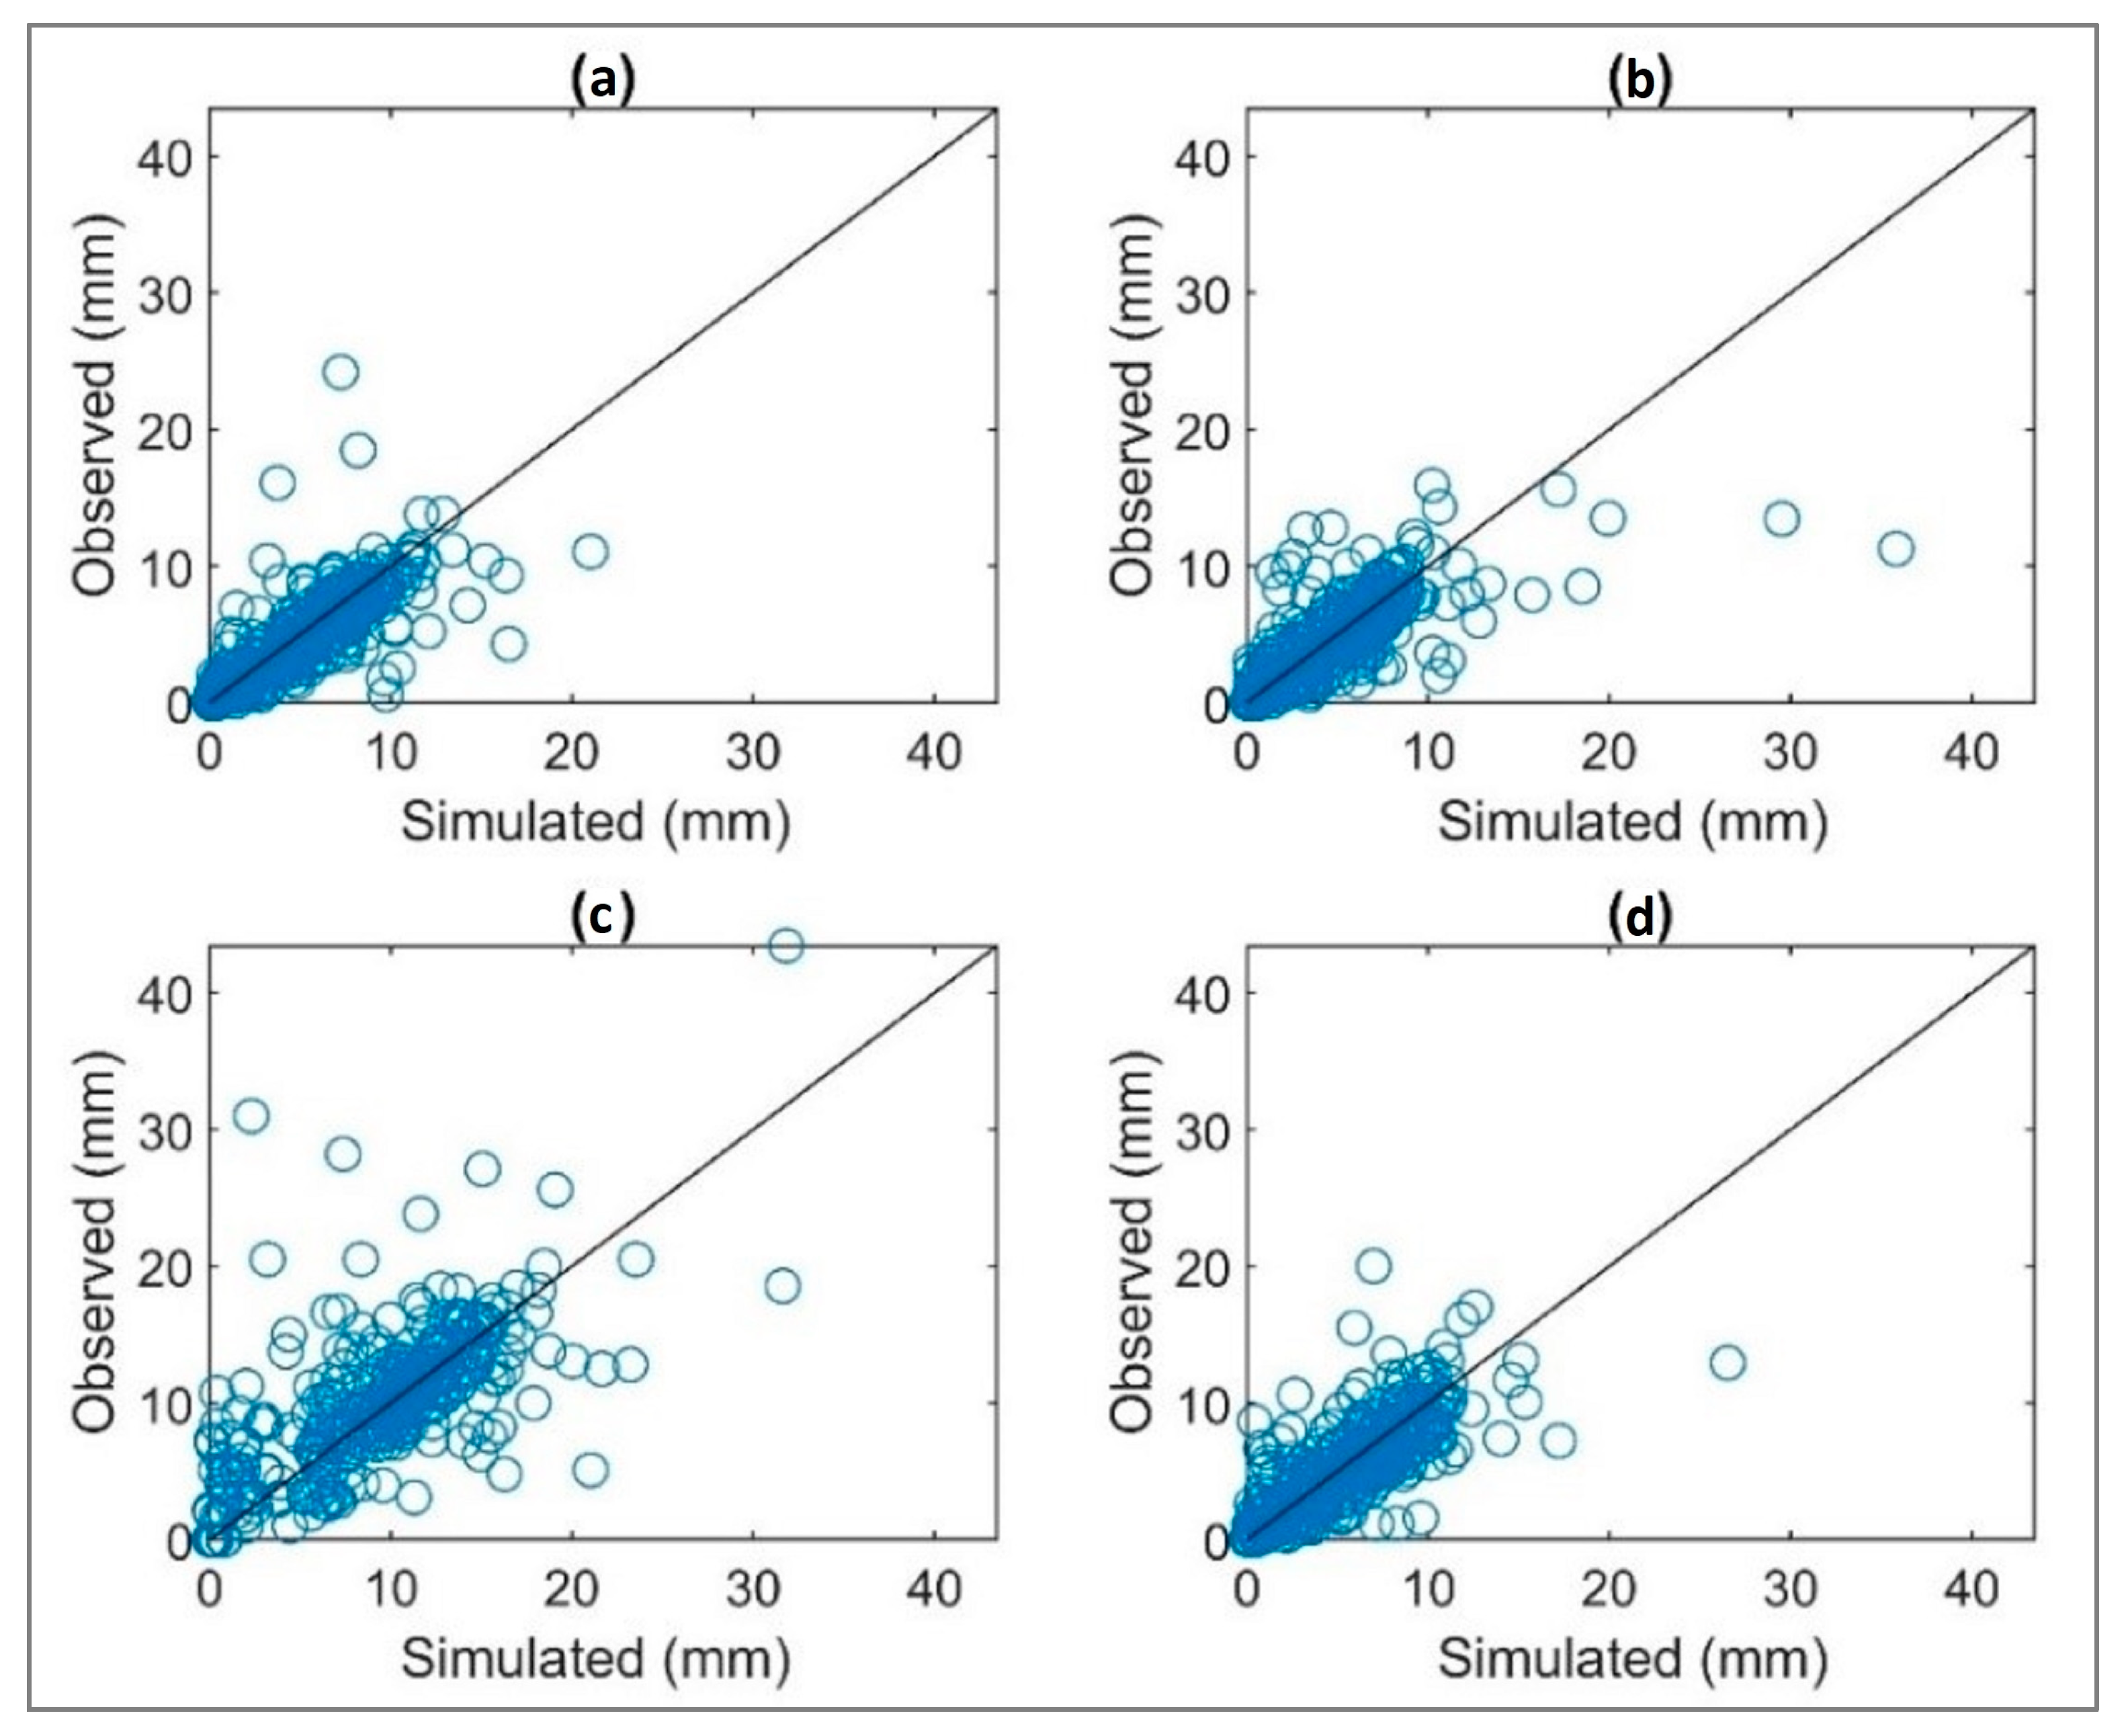
The precipitation for the four stations was generated by the log-gamma transformation, which produced the best results (Figure 7). For the daily precipitation amount (without zeros), the mean and standard deviation of 1000 synthetic series were calculated. The observed precipitation is in the range of confidence limits at 95%.
The multisite multivariate stochastic model for mean daily precipitation has a deviation of ±10 mm. The observed and generated series are not significantly different according to the K–S test, which indicates that they came from the same distribution. In addition, they have the same average according to the t-test and the same median according to the Wilcoxon test.
The maximum precipitation of each year was extracted from 30 data and assigned with their respective return period to obtain the maximum historical series. In the case of the generated synthetic series, the maximum of each year was extracted for 1000 series, and the average was obtained as being equal to 30 years. The results of the multisite multivariate stochastic model are shown in Figure 8. The different graphs were constructed for the four stations: 16022, 16247, 16055, and 16081. The results indicate that for station 16022, there are underestimates for a Tr less than 8 years (10 mm), and for the rest of the period, there is an adequate adjustment. For station 16247, there is a suitable adjustment for return periods between 1 and 15. Subsequently, it tends to overestimate the maximum precipitation by 11 mm. Station 16055 presents an acceptable trend for the different return periods but nevertheless overestimates return periods between 10 and 20. Station 16081 displays underestimates for return periods less than 10 and presents a proper adjustment for return periods up to 30.

3.2. PDFs

Different distribution functions evaluated for the maximum annual rainfall were estimated using the Smirnov–Kolmogorov test for each of the PDFs. These results indicated that for station 16055, the best fitting function was log-Gumbel p = 0.0871. For station 16081, the most acceptable was Gumbel p = 0.045. For station 16022, it was log-normal of 3 parameters (p = 0.0696), and for station 16247, log-normal of 2 parameters. The results for the different stations are presented in Table 3. The basin is affected by extreme rainfall events such as heavy rainfall, storms, and tropical cyclones. These events often exhibit high variability in their occurrence and intensity, leading to localized flooding, landslides, and other hydrological hazards (Appendix A). This is the main reason why different distribution functions are adjusted (Table 4).

3.3. SCS-CN

The contribution subbasins of each of the streams under study were delimited by applying ArcGIS 10.5. For this purpose, a digital elevation model (DEM) that covers the entire study area was used. In this process, the DEM provided by INEGI, with a resolution of 15 m extracted from the Mexican Elevation Continuum, was utilized as input. Once the DEM was obtained and the exit points of each subwatershed were defined using geographic information systems (GIS), the subbasins were delineated (Figure 9. Afterward, their geomorphological characteristics were determined, as well as the area (km2), height difference (m), length of the main channel (m), slope (%), and concentration time (h).
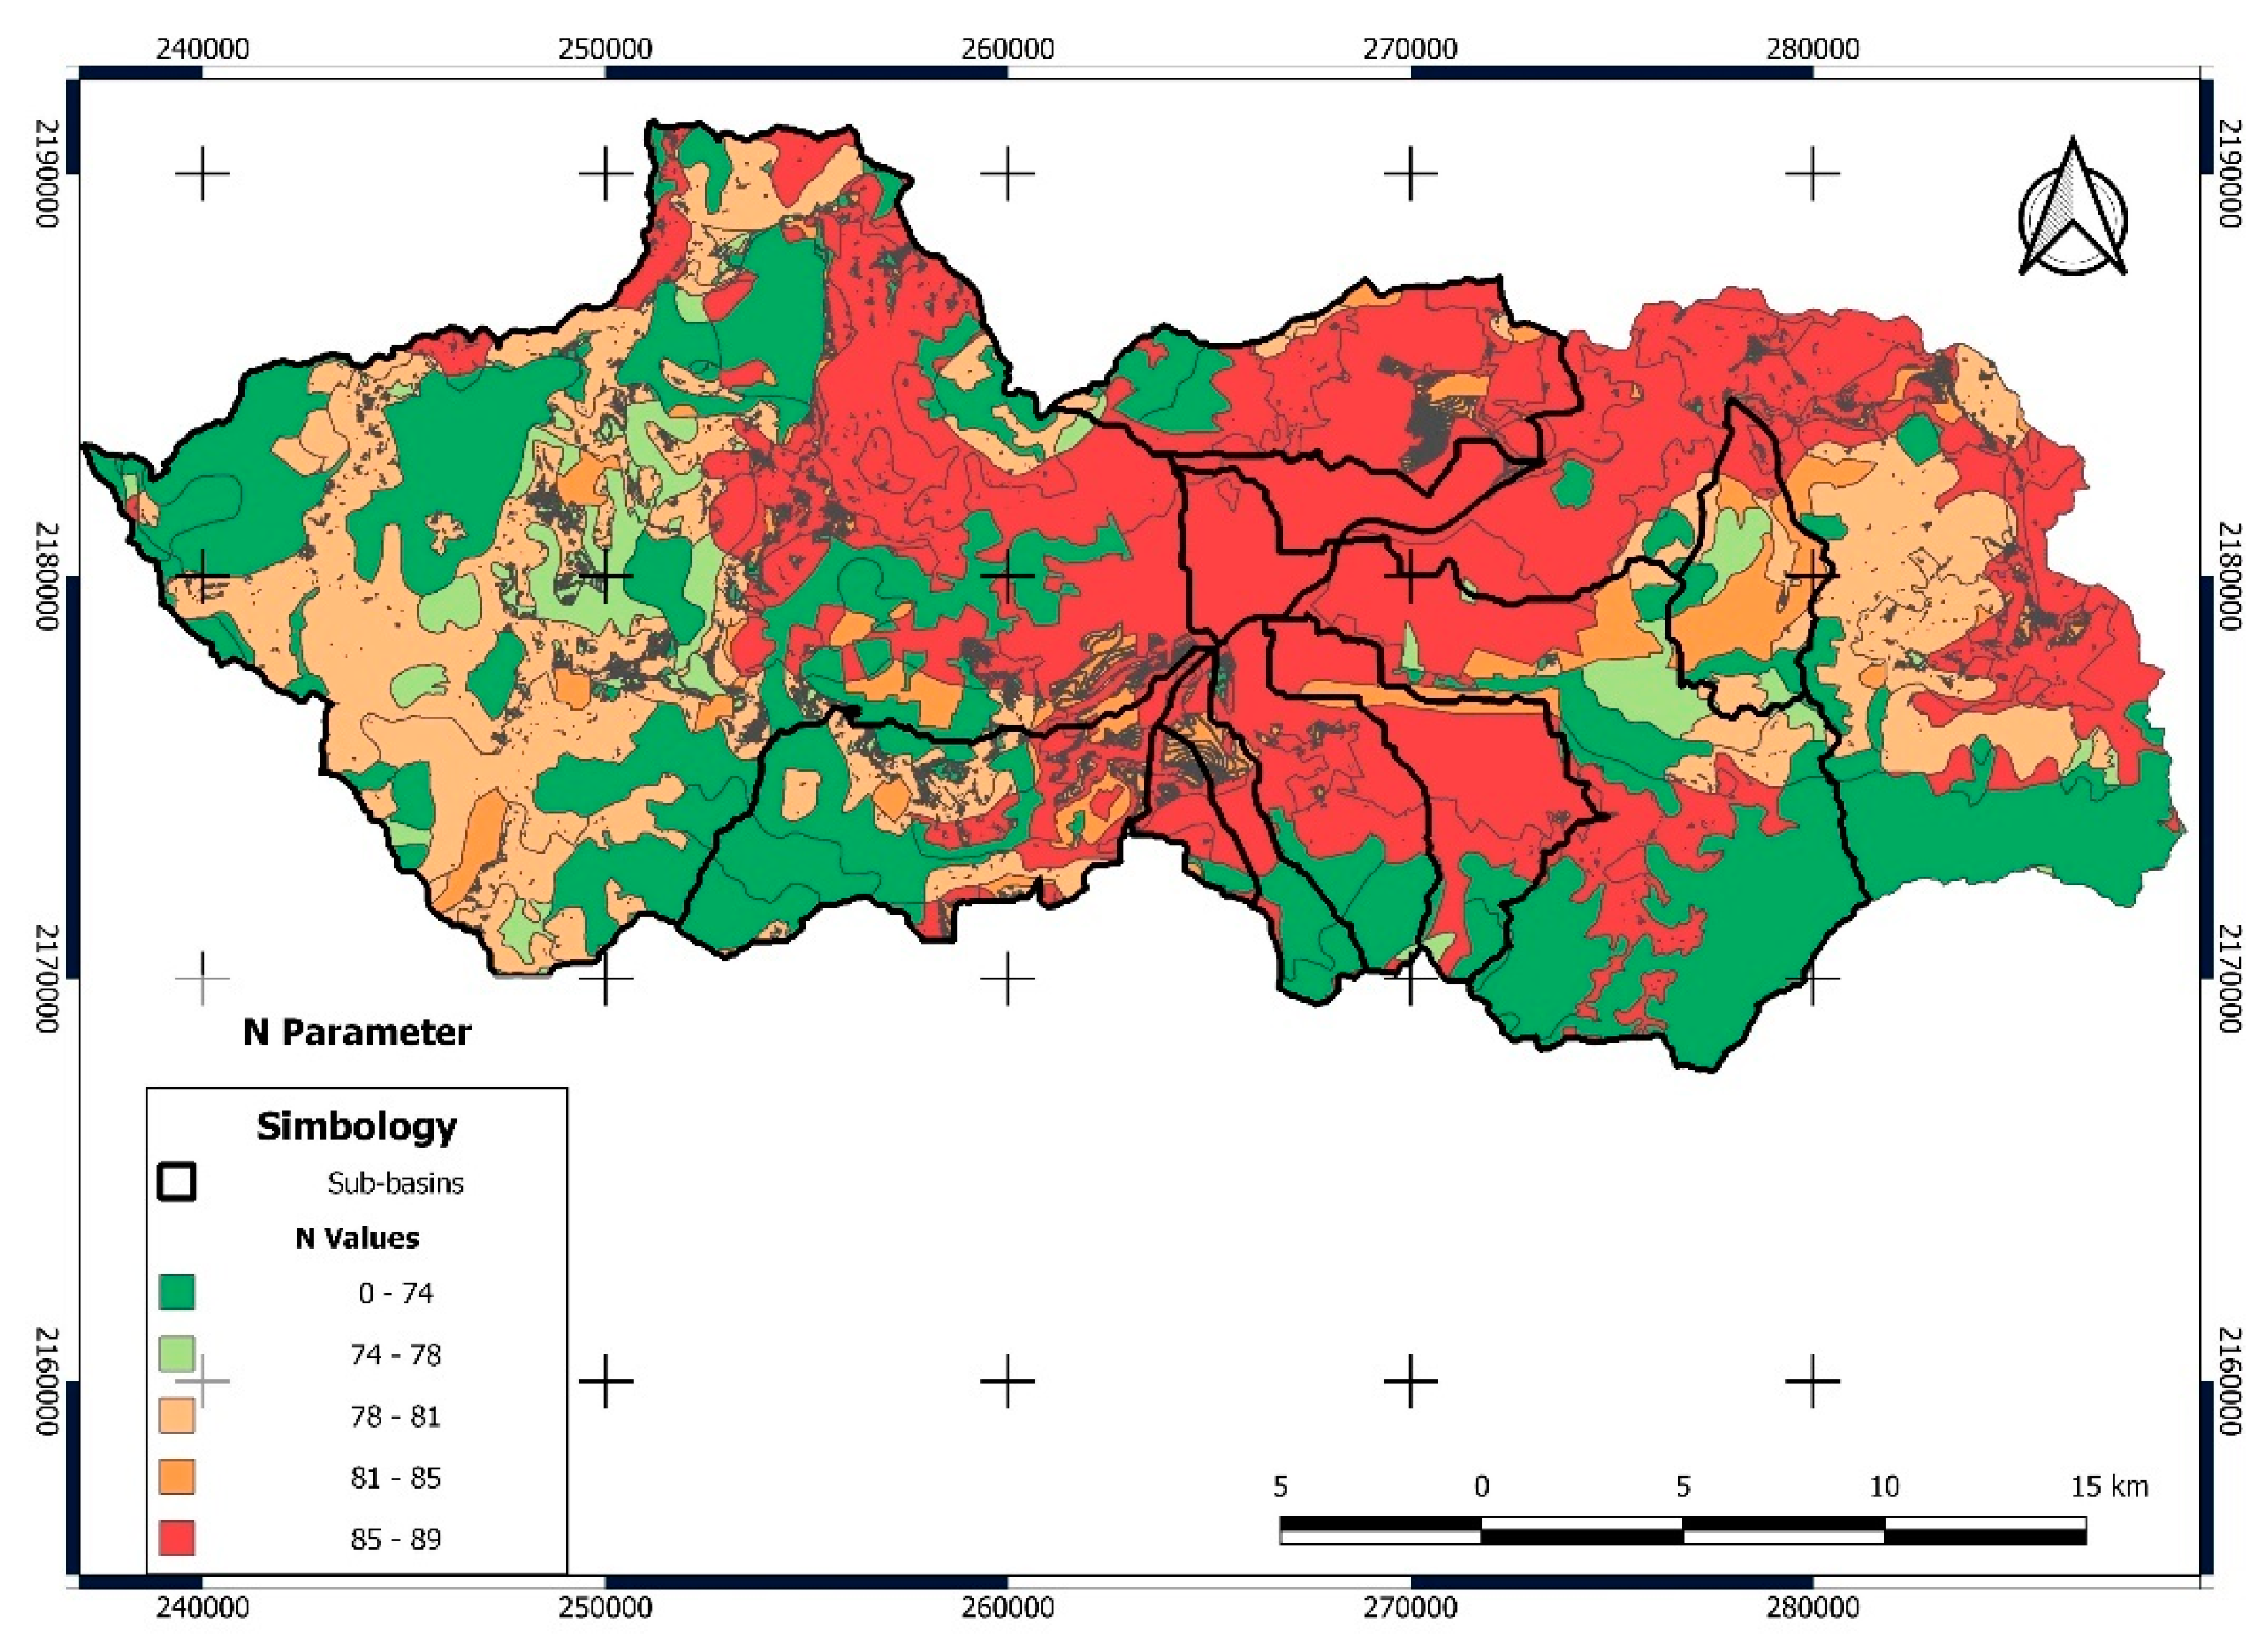
To determine the runoff number, information from the INEGI Soil Use and Vegetation chart scale 1:250,000 (E14-1) was used to identify the different land uses. In addition, the Edaphological chart scale 1:250,000 (E14-1) was applied, from which different soil textures were extracted. Using ArcGIS 10.5, the maps were reclassified, and runoff numbers were assigned. For the watershed study, there are curve number (CN) values between 44 and 87. The lowest values are located in infiltration zones, very permeable soils, and thick forests. The high CN values are found in the urban area of Morelia, where the soil characteristics are fine with little infiltration capacity. The mean CN for all subbasins is 83.03, which indicates an urban basin. Figure 10 shows all the reclassifications for the subbasin under study, and Table 5 shows the values for each subbasin. Urban subwatersheds tend to have CN values greater than 80, contrary to headwater micro-watersheds which include larger non-urbanized areas and greater infiltration capacity due to soil and vegetation.
Once the model parameters were obtained, the design hyetograms corresponding to the analyzed periods for each subbasin were estimated with MASVC 1.0 software and Hidroesta 2.0 software. Finally, the surface runoff was calculated.

3.4. Determination of Surface Runoff for All Subbasins

After the design hyetograms were obtained, hydrographs were calculated using the curve model formulated by the U.S. Soil Conservation Service (SCS-CN), which determines runoff thresholds as a function of runoff curve number. Table 6 displays different return periods and the maximum surface runoff for each subbasin. The main results indicate the surface runoff is lower for return periods 2, 5, and 10 for MASVC-SCS-CN. For return periods of 20 to 100, the MASVC-SCS-CN surface runoff is higher than PDF-SCS-CN, a consequence of the subestimation of 24 h precipitation for return periods less than 20.

4. Discussion

Temporal and spatial variability studies of extreme precipitation are challenging for risk assessment [62]. Probability density functions (PDFs) and stochastic weather generators are two approaches used in hydrology to model and simulate maximum rainfall events. PDFs represent the statistical distribution of maximum rainfall events based on observed data, which does not provide doubtful information [63]. Furthermore, PDFs overestimate precipitation events [64,65]. However, PDFs alone do not provide a temporal sequence of rainfall events, nor do they capture the temporal correlation and patterns of rainfall occurrence [1,62].
Stochastic weather generators reduce the uncertainty of the calculated floods [1]. Moreover, stochastic weather generators reproduce long series of extreme precipitation [66]. MASVC simulates continuous synthetic rainfall sequences based on statistical properties of observed weather data. This generator captures the temporal correlation and patterns of weather variables, as well as rainfall. MASVC uses a combination of statistical parametrization to represent the characteristics of weather variables and their interrelationships. MASVC incorporates multiple statistical parameters, including mean, variances, autocorrelation, and other higher-order moments. By simulating synthetic rainfall sequences, MASVC can generate long-term, time-series rainfall data that captures the statistical properties of historically extreme rainfall events. They are applicable for hydrological modeling, flood forecasting, and water resources management, as they provide realistic representations of rainfall patterns and capture rainfall variability over time [67,68,69]. MASVC was applied to semiarid and humid regions with good performance [70]. The limitations of MASVC are that it requires 30 years of historic rainfall and does not consider snow in the stochastic model.
The stochastic rainfall generator MASVC can simulate temporal and spatial characteristics of rainfall, capturing the variability and patterns in real-world rainfall data [71,72,73]. It considers the timing, duration, intensity, and occurrence of rainfall events, allowing for the generation of realistic rainfall sequences that provide the behavior of observed data. In contrast, PDFs offer information about the statistical distribution of rainfall but do not inherently capture temporal and spatial variability [74].
This approach significantly simplifies the process of generating precipitation data, which implies a relevant advantage and versatility concerning other stochastic generators and PDFs. The reduction of parameters is an essential factor addressed in this approach to determine the maximum rainfall amounts, in addition to considering the continuous modeling for all days, months, and years of simulation. Furthermore, the SCS-CN method is widely used for hydrologic studies in an ungauged basin for the National Water Commission (CONAGUA) [75,76,77,78,79,80,81,82,83,84,85,86,87,88].

5. Conclusions

This article presents a multisite multivariate stochastic model for generating daily rainfall consistent to mean and maximum precipitation. MASVC is a two-step model that first produces the multivariate occurrence process. Afterward, a nonzero amount of rainfall is generated using a continuous nonparametric multisite multivariate stochastic autoregressive first-order model. This model can reproduce daily maximum, monthly, and total annual precipitations. The approach is an efficient algorithm for the entire range of precipitation. Moreover, MASVC is a continuous semiparametric model that can reduce the number of parameters compared to other generators and is capable of reproducing maximum and minimum precipitation.
Finally, the surface runoff using the proposed methodology MASVC-SCS-CN is determined and compared with the PDF-SCS-CN. The main difference between the MASVC and PDFs is the scale analysis. MASVC uses the daily series for the entire historical period and generates multiple equiprobable synthetic series that can occur in the study area. The greater the number of synthetic series, the longer the return periods can be extended. On the other hand, PDFs use a limited number of data, only one per year.
This approach significantly improves the process of generating surface runoff with greater occurrence confidence, which implies an overall advantage and versatility concerning PDF-SCS-CN.

Author Contributions

Conceptualization, J.H.-B. and S.T.S.-Q.; methodology, J.H.-B. and L.G.-R.; software, C.D.F.-N. and J.H.-B.; validation, S.T.S.-Q., C.D.-S., and J.H.-B.; formal analysis, C.D.F.-N. and J.H.-B.; investigation, J.H.-B. and L.G.-R.; resources, C.D.-S.; data curation, C.D.F.-N.; writing–original draft preparation, L.G.-R. and J.H.-B.; writing–review and editing, C.D.-S. and S.T.S.-Q.; visualization, L.G.-R.; supervision, S.T.S.-Q.; project administration, C.D.-S.; funding acquisition, C.D.-S. and S.T.S.-Q. All authors have read and agreed to the published version of the manuscript.

Funding

The authors acknowledge the support from the Institute of Science, Technology and Innovation (ICTI) for its financial support through the project “PICIR-069 Sistema de mitigación del riesgo contra inundaciones de la Ciudad de Morelia”.

Data Availability Statement

Not applicable.

Acknowledgments

The authors wish to thank the Universidad Michoacana de San Nicolás de Hidalgo. The second and third authors wish to thank the National Council of Humanities, Science and Technology of Mexico (CONAHCyT) for the financial support of their postgraduate studies. Additionally, the authors acknowledge the support from the Institute of Science, Technology and Innovation (ICTI) for its financial support through the project “PICIR-069”. Finally, we also value the anonymous reviewers and the editor for their constructive comments on the manuscript.

Conflicts of Interest

The authors declare no conflict of interest.

Appendix A

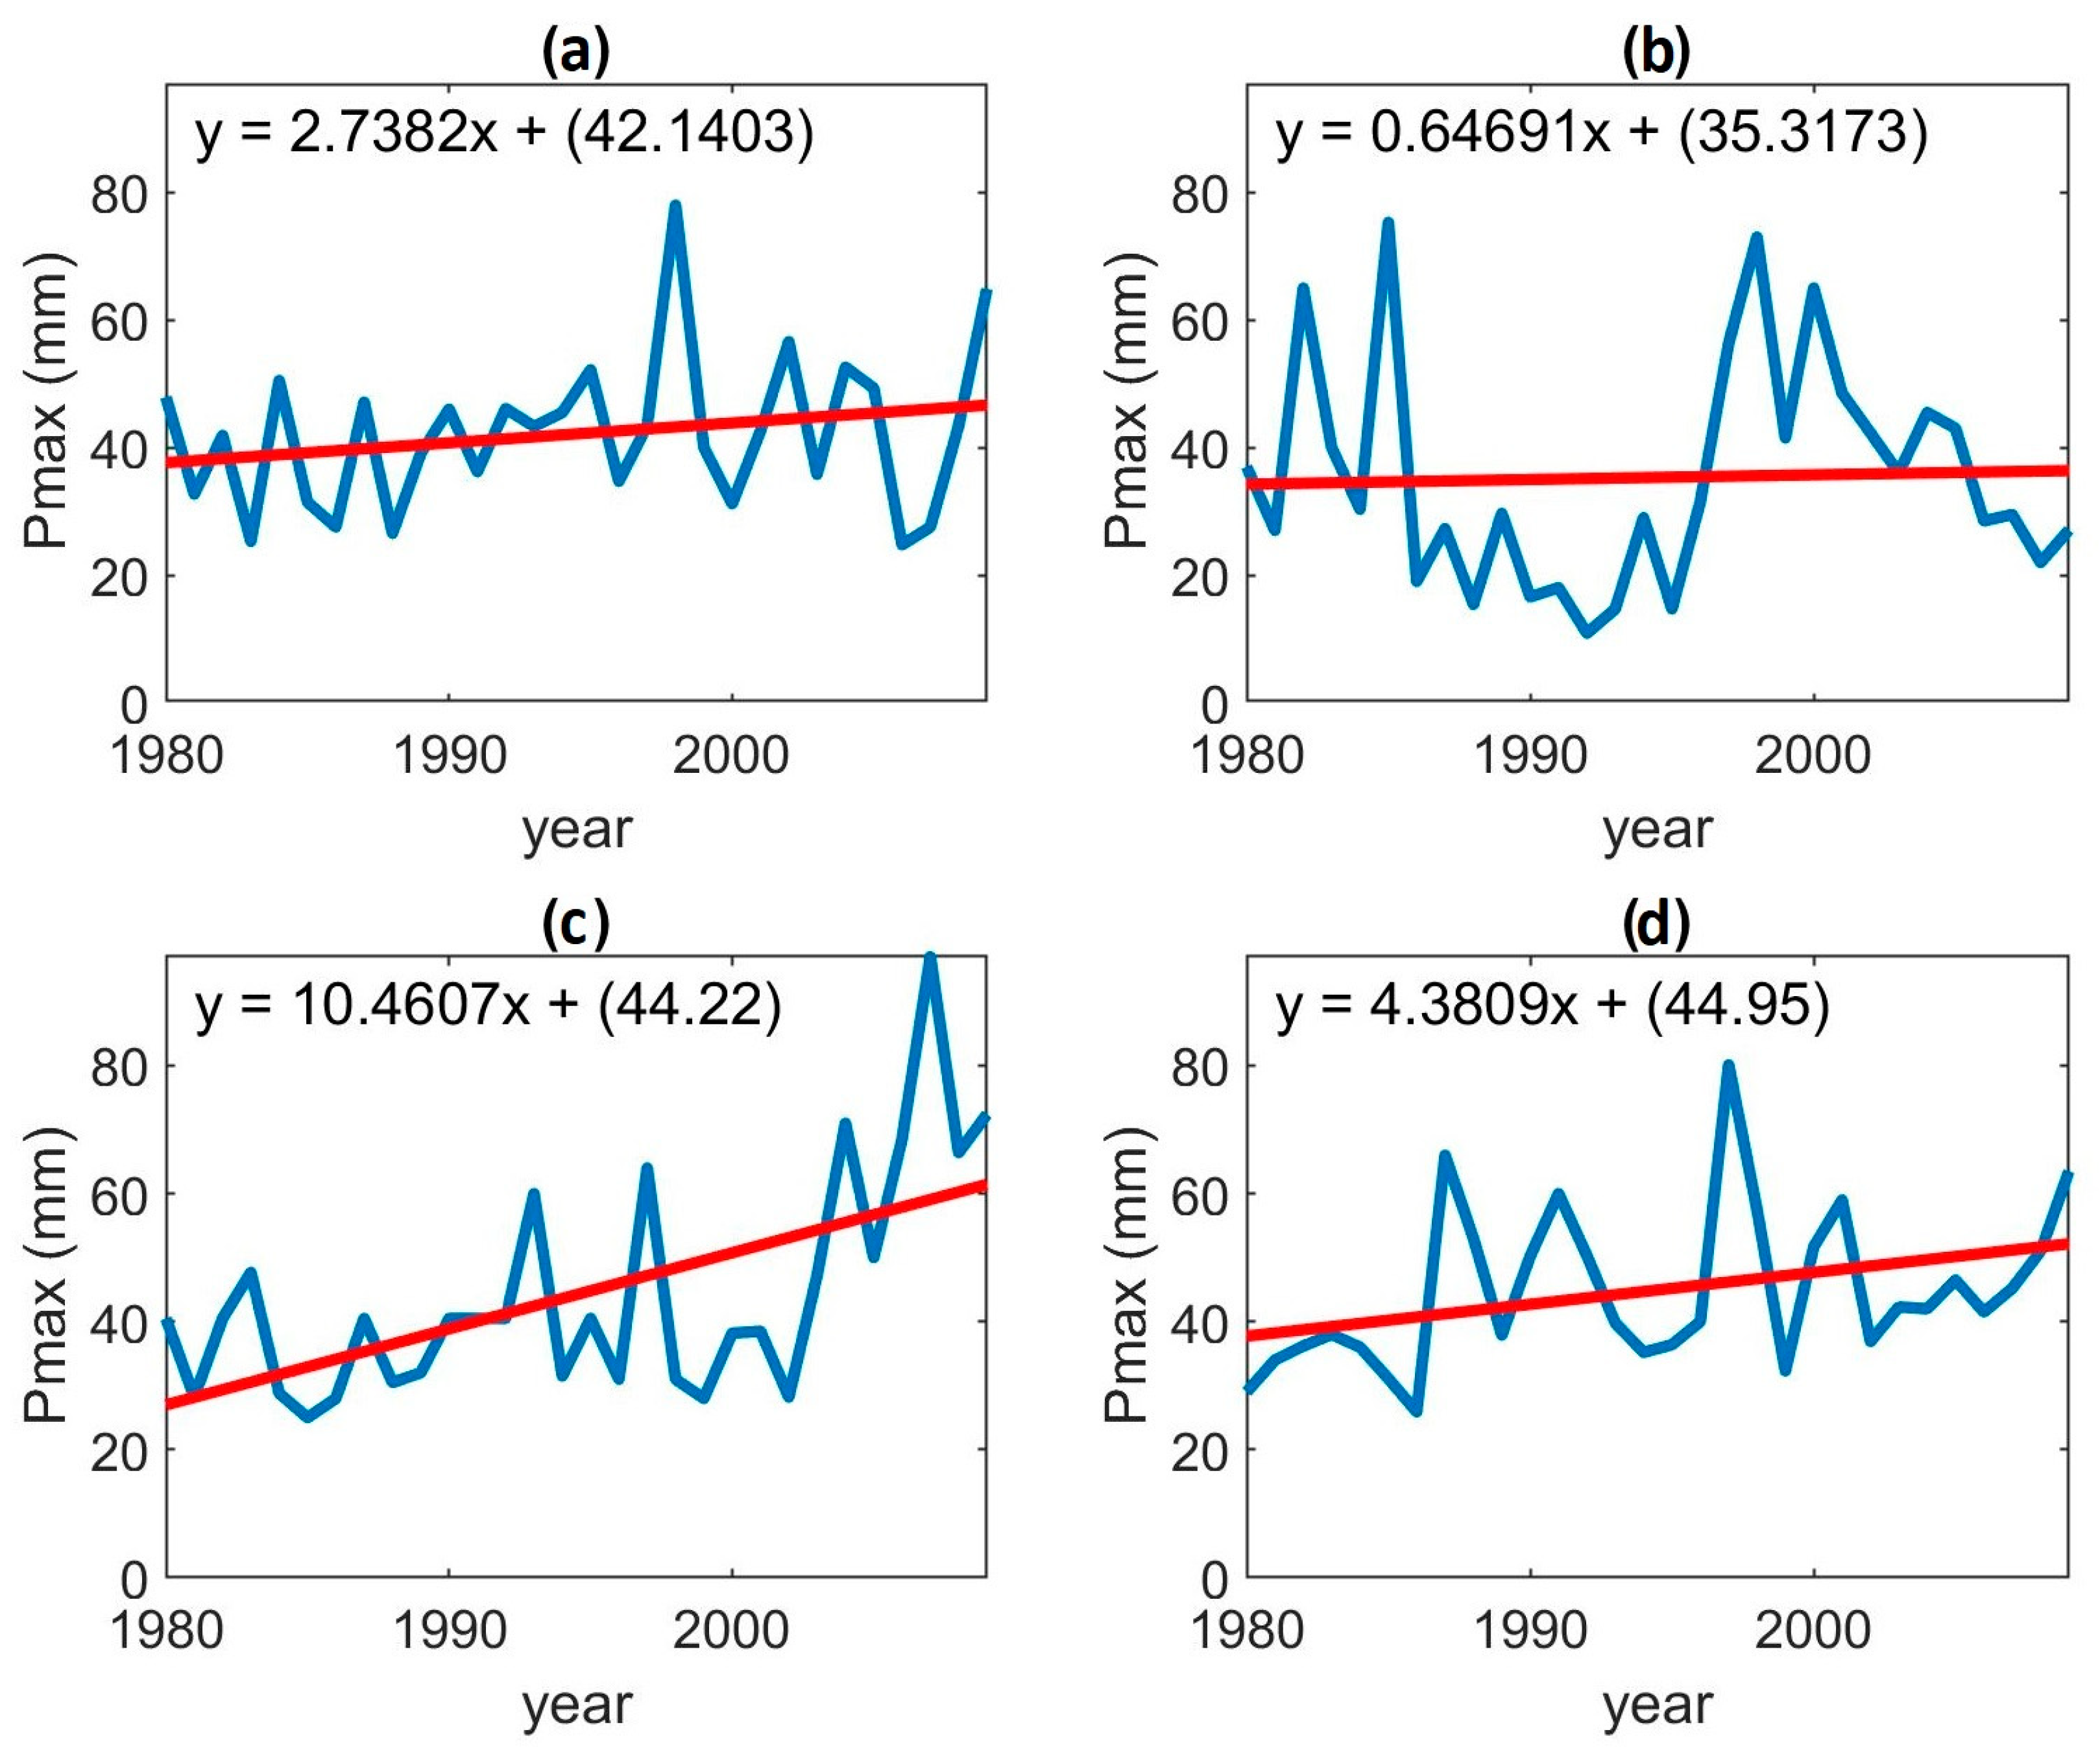
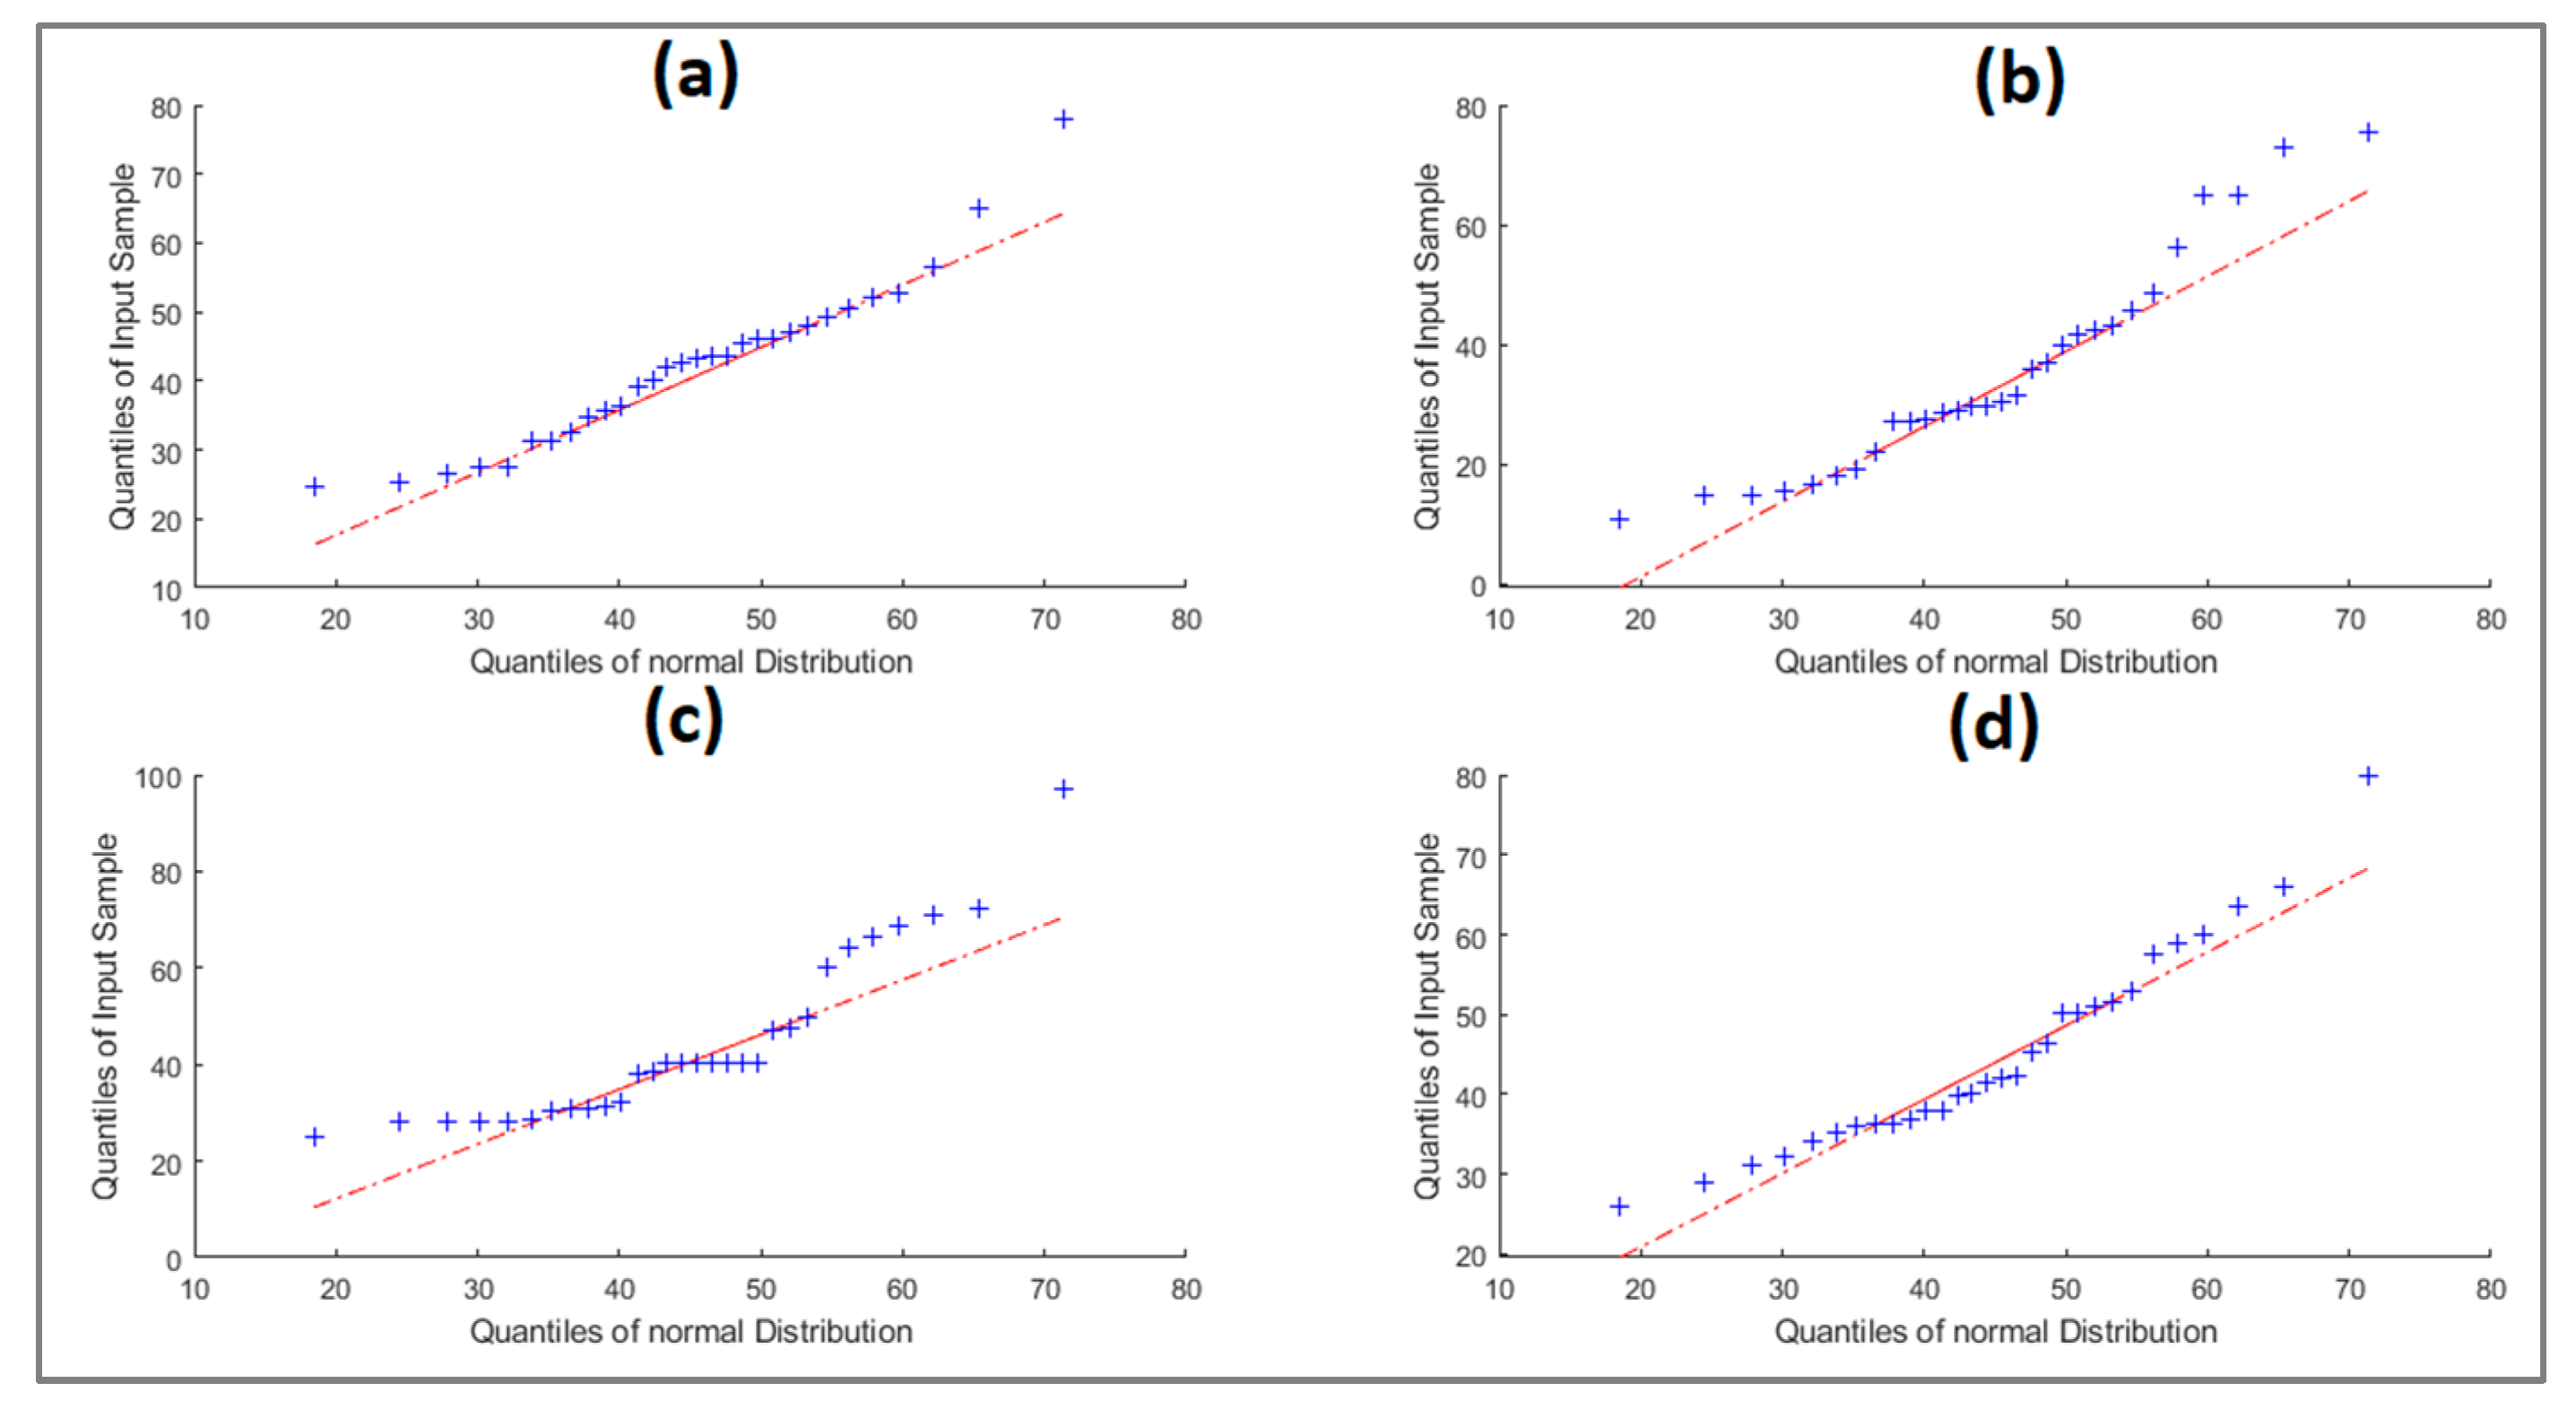
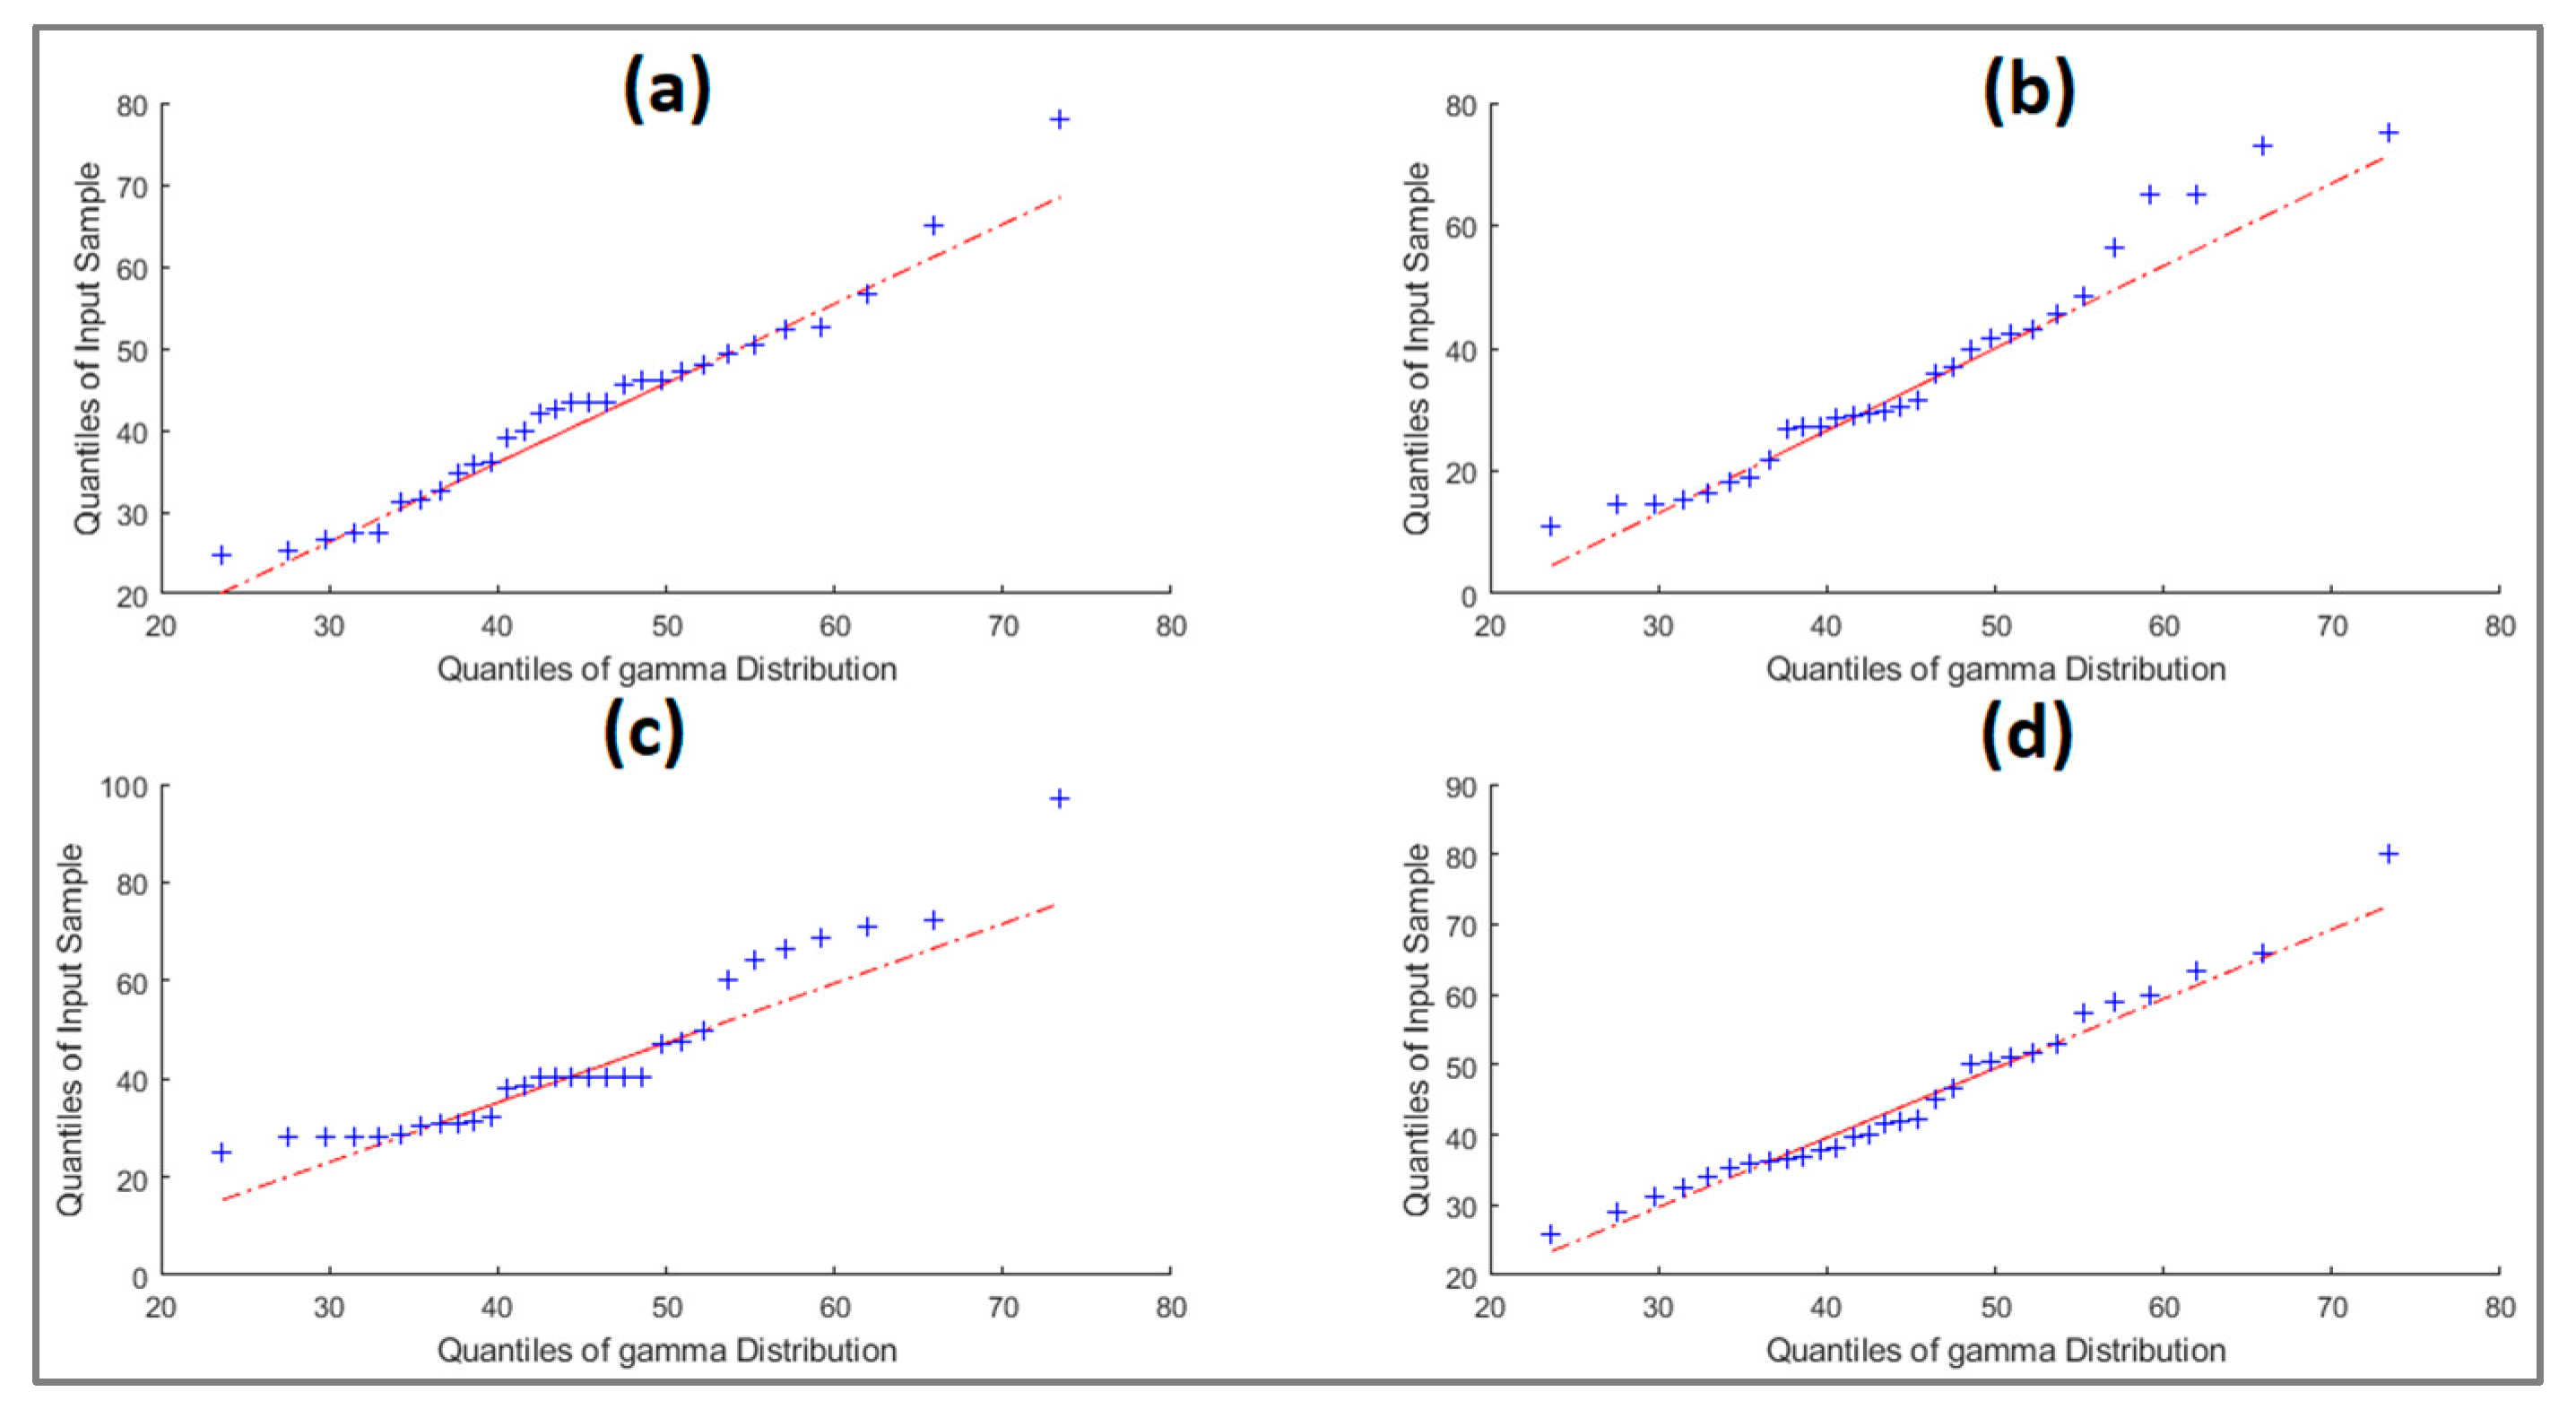
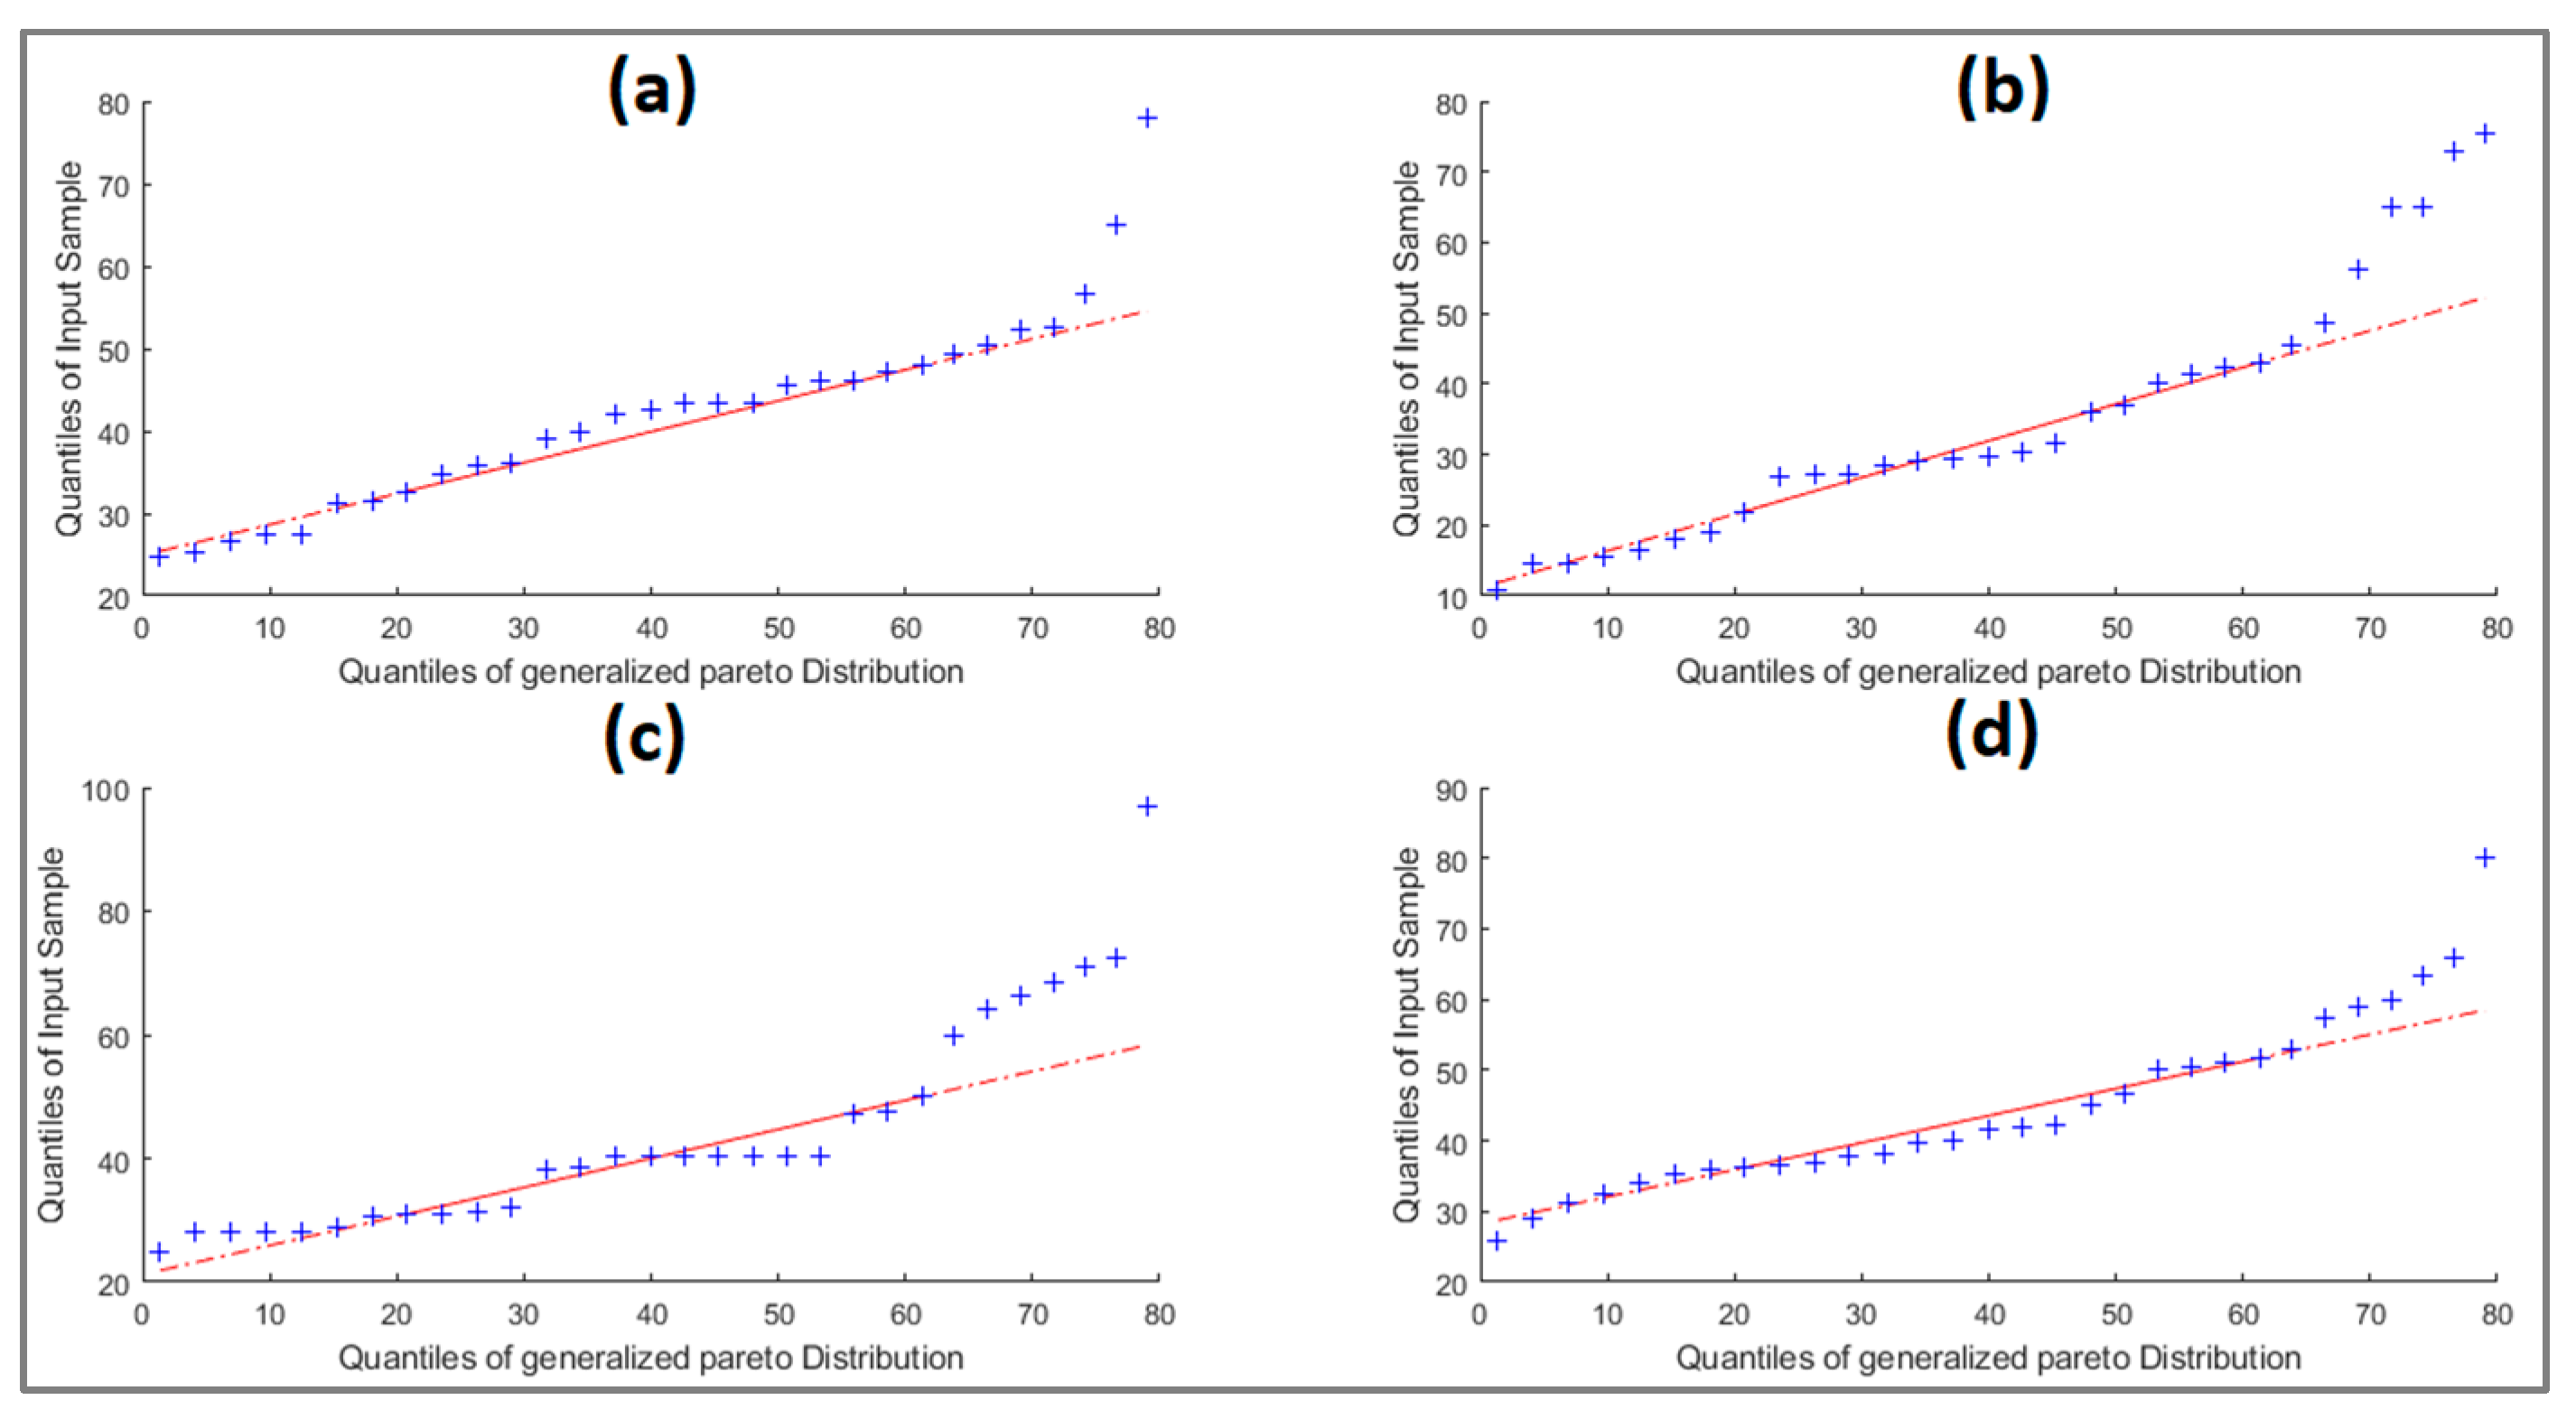
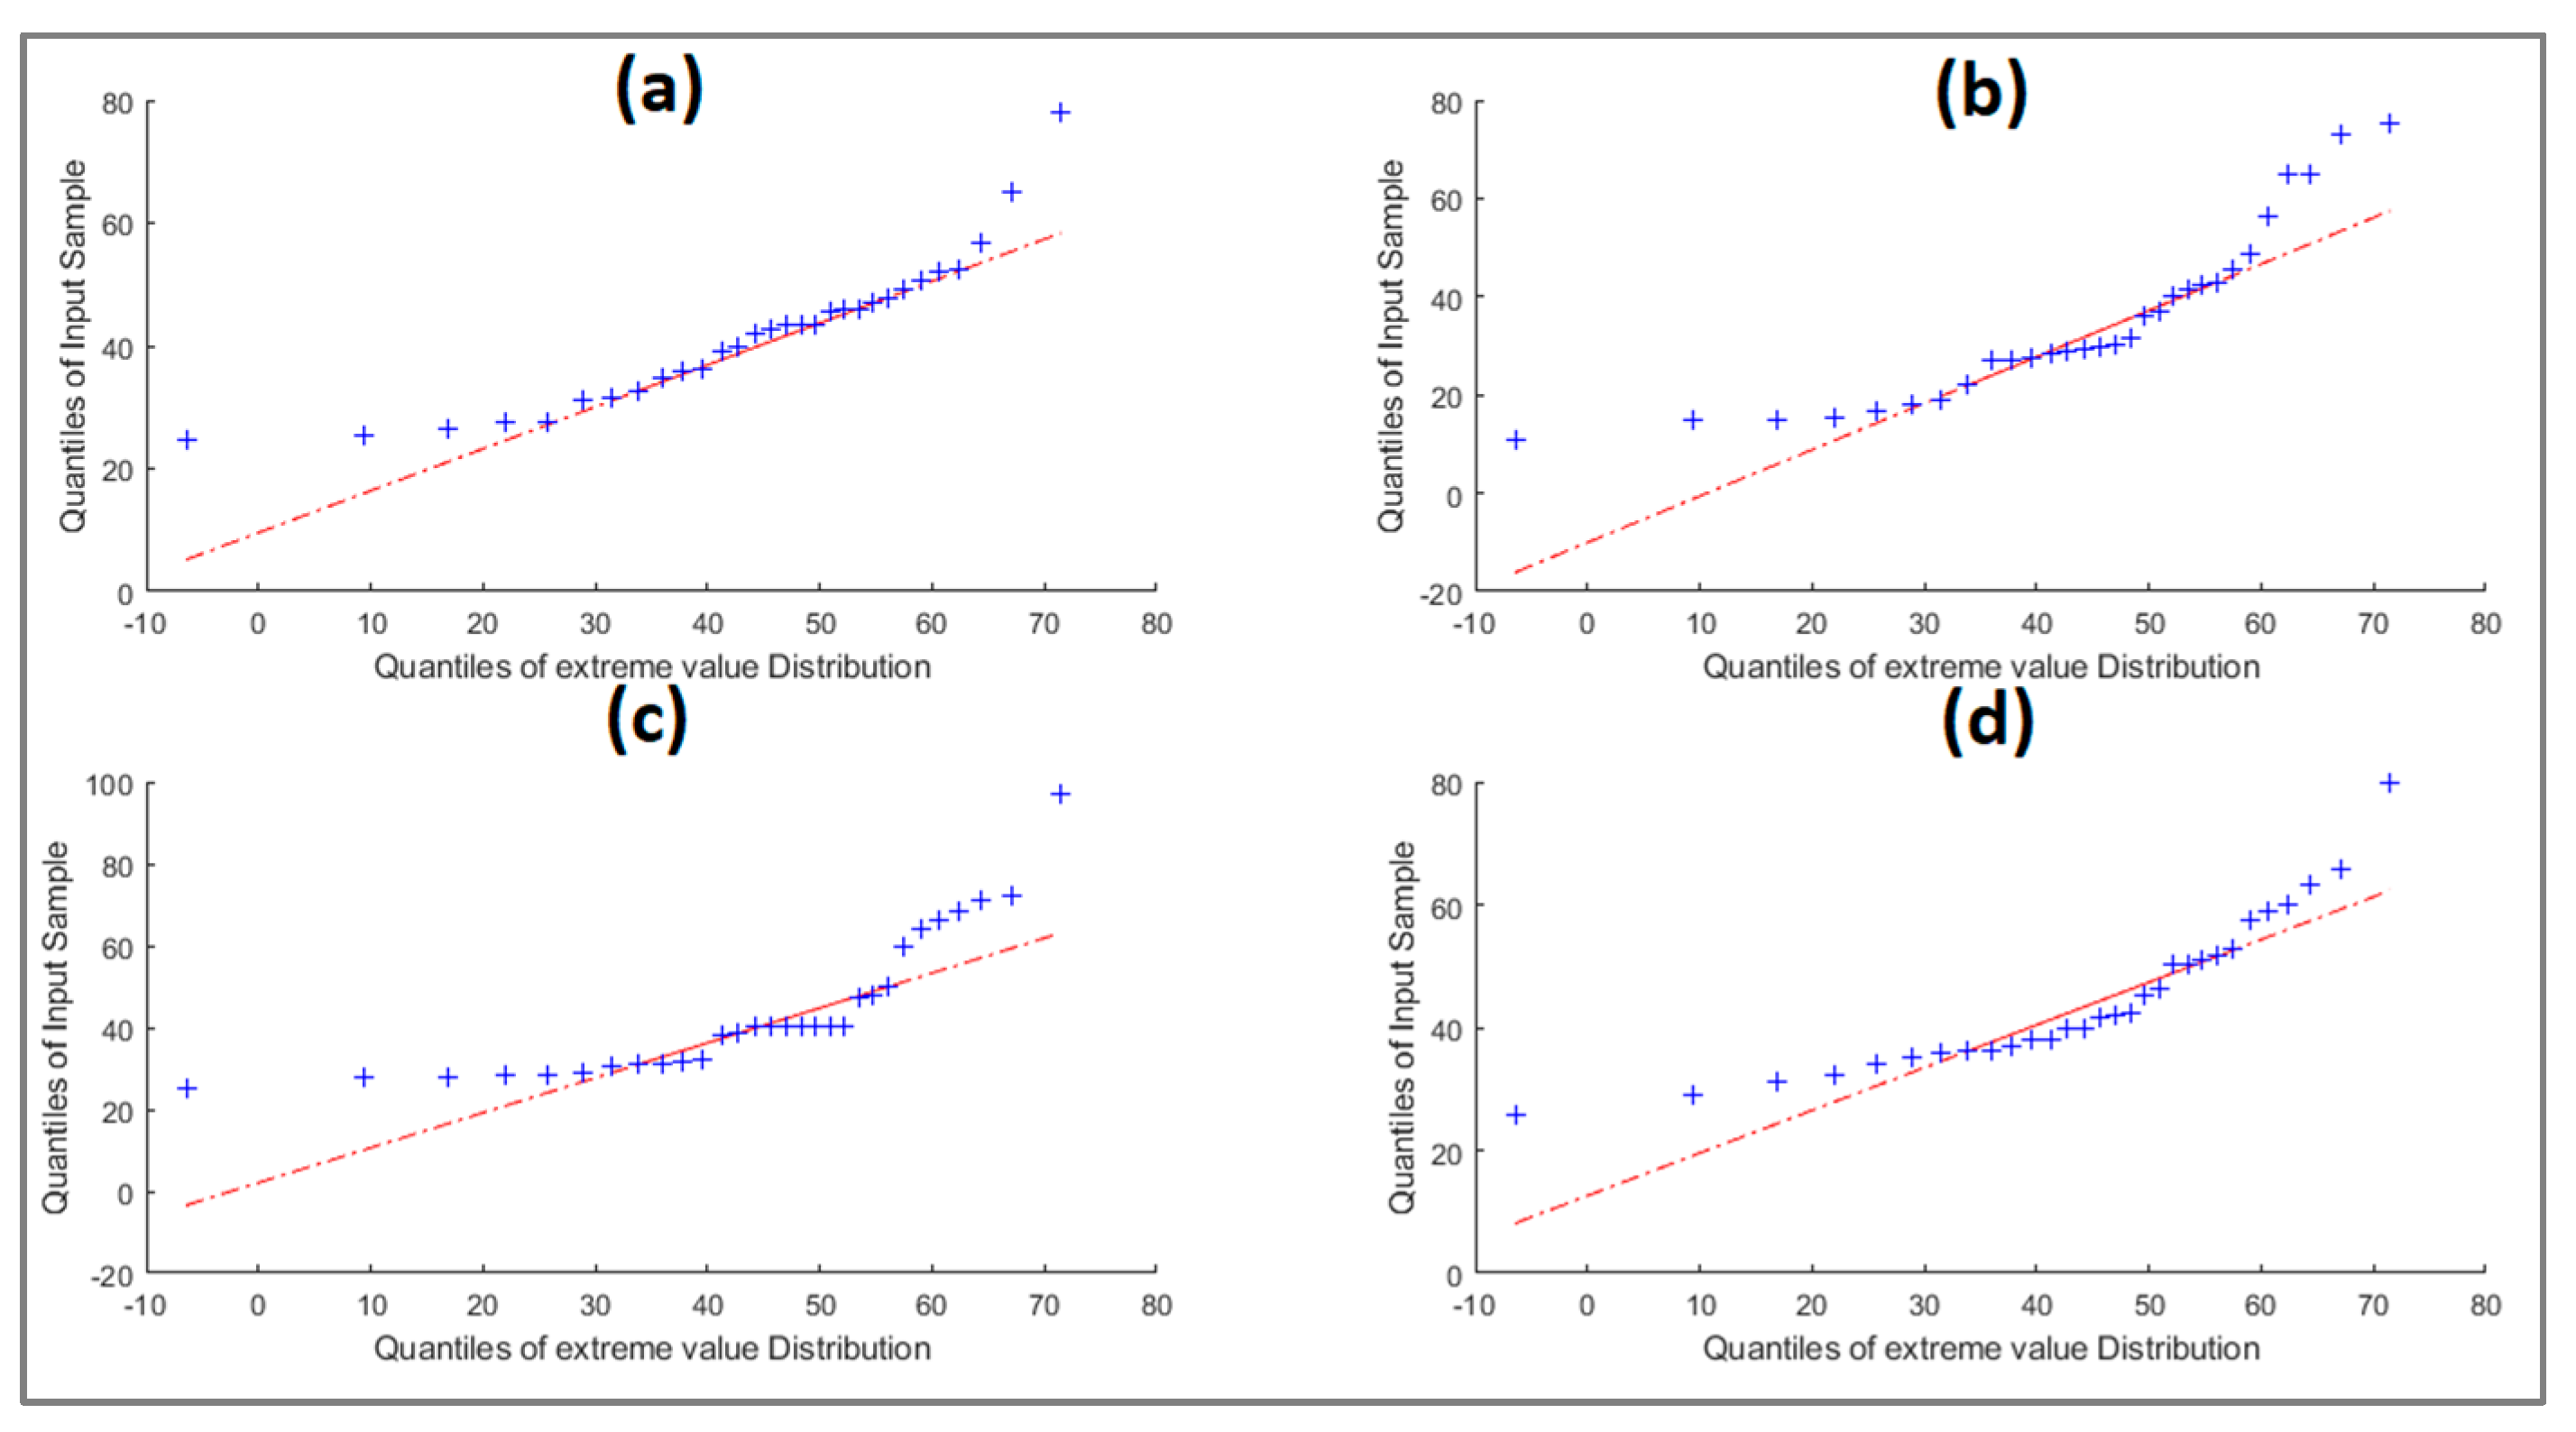
Regional analysis of the maximum precipitation in the Rio Grande Basin are presented in Figure A1. This shows different patterns of maximum rainfall and regional changes for the subbasins. The grid interpolation uses inverse distance weight interpolation (IDW). QQ plot of PDFs is shown is Figure A2, Figure A3, Figure A4, Figure A5 and Figure A6.
Figure A1. Temporal variation of maximum precipitation for the four stations; (a) 16022, (b) 16247, (c) 16055, and (d) 16081, blue line is the maxima precipitation (1980 to 2009) and red line is the linear regression.
Water 15 02994 g0a1
Figure A2. QQ plots normal distribution for the four stations; (a) 16022, (b) 16247, (c) 16055, and (d) 16081. Blue plus sings are the normal adjusted precipitation and dotted lines theorical normal quartiles.
Water 15 02994 g0a2
Figure A3. QQ plots gamma distribution for the four stations; (a) 16022, (b) 16247, (c) 16055 and (d) 16081. Blue plus sings are the gamma adjusted precipitation and dotted lines theorical gamma quartiles.
Water 15 02994 g0a3
Figure A4. QQ plots generalized pareto distribution for the four stations; (a) 16022, (b) 16247, (c) 16055, and (d) 16081. Blue plus sings are the generalized pareto adjusted precipitation and dotted lines theorical generalized pareto quartiles.
Water 15 02994 g0a4
Figure A5. QQ plots Gumbel distribution for the four stations; (a) 16022, (b) 16247, (c) 16055, and (d) 16081. Blue plus sings are the gumbel adjusted precipitation and dotted lines theorical gumbel quartiles.
Water 15 02994 g0a5
Figure A6. QQ plots log-normal distribution for the four stations; (a) 16022, (b) 16247, (c) 16055, and (d) 16081. Blue plus sings are the log-normal adjusted precipitation and dotted lines theorical log-normal quartiles.
Water 15 02994 g0a6

References

  1. Beneyto, C.; Aranda, J.Á.; Benito, G.; Francés, F. New Approach to Estimate Extreme Flooding Using Continuous Synthetic Simulation Supported by Regional Precipitation and Non-Systematic Flood Data. Water 2020, 12, 3174. [Google Scholar] [CrossRef]
  2. Abreu, M.C.; Cecílio, R.A.; Pruski, F.F.; dos Santos, G.R.; de Almeida, L.T.; Zanetti, S.S. Criteria for Choosing Probability Distributions in Studies of Extreme Precipitation Events. Rev. Bras. Meteorol. 2018, 33, 601–613. [Google Scholar] [CrossRef]
  3. Segura-Beltrán, F.; Sanchis-Ibor, C.; Morales-Hernández, M.; González-Sanchis, M.; Bussi, G.; Ortiz, E. Using Post-Flood Surveys and Geomorphologic Mapping to Evaluate Hydrological and Hydraulic Models: The Flash Flood of the Girona River (Spain) in 2007. J. Hydrol. 2016, 541, 310–329. [Google Scholar] [CrossRef]
  4. Kastridis, A.; Theodosiou, G.; Fotiadis, G. Investigation of Flood Management and Mitigation Measures in Ungauged Natura Protected Watersheds. Hydrology 2021, 8, 170. [Google Scholar] [CrossRef]
  5. Coronado-Hernández, Ó.E.; Merlano-Sabalza, E.; Díaz-Vergara, Z.; Coronado-Hernández, J.R. Selection of Hydrological Probability Distributions for Extreme Rainfall Events in the Regions of Colombia. Water 2020, 12, 1397. [Google Scholar] [CrossRef]
  6. Flowers-Cano, R.S.; Ortiz-Gómez, R. Comparison of Four Methods to Select the Best Probability Distribution for Frequency Analysis of Annual Maximum Precipitation Using Monte Carlo Simulations. Theor. Appl. Climatol. 2021, 145, 1177–1192. [Google Scholar] [CrossRef]
  7. Moon, Y.-I.; Lall, U. Kernel Quantite Function Estimator for Flood Frequency Analysis. Water Resour. Res. 1994, 30, 3095–3103. [Google Scholar] [CrossRef]
  8. Petroselli, A.; De Luca, D.L.; Młyński, D.; Wałęga, A. Modelling Annual Maximum Daily Rainfall with the STORAGE (STOchastic RAinfall GEnerator) Model. Hydrol. Res. 2022, 53, 547–561. [Google Scholar] [CrossRef]
  9. Ciupak, M.; Ozga-Zieliński, B.; Tokarczyk, T.; Adamowski, J. A Probabilistic Model for Maximum Rainfall Frequency Analysis. Water 2021, 13, 2688. [Google Scholar] [CrossRef]
  10. Tarpanelli, A.; Franchini, M.; Brocca, L.; Camici, S.; Melone, F.; Moramarco, T. A Simple Approach for Stochastic Generation of Spatial Rainfall Patterns. J. Hydrol. 2012, 472–473, 63–76. [Google Scholar] [CrossRef]
  11. Alodah, A.; Seidou, O. Assessment of Climate Change Impacts on Extreme High and Low Flows: An Improved Bottom-Up Approach. Water 2019, 11, 1236. [Google Scholar] [CrossRef]
  12. Lele, S.; Keim, J.L. Weighted Distributions and Estimation of Resource Selection Probability Functions. Ecology 2006, 87, 3021–3028. [Google Scholar] [CrossRef] [PubMed]
  13. Venkata Rao, G.; Venkata Reddy, K.; Srinivasan, R.; Sridhar, V.; Umamahesh, N.V.; Pratap, D. Spatio-Temporal Analysis of Rainfall Extremes in the Flood-Prone Nagavali and Vamsadhara Basins in Eastern India. Weather Clim. Extrem. 2020, 29, 100265. [Google Scholar] [CrossRef]
  14. Dasallas, L.; An, H.; Lee, S. Developing an Integrated Multiscale Rainfall-Runoff and Inundation Model: Application to an Extreme Rainfall Event in Marikina-Pasig River Basin, Philippines. J. Hydrol. Reg. Stud. 2022, 39, 100995. [Google Scholar] [CrossRef]
  15. Gabriel, K.R.; Neumann, J. A Markov Chain Model for Daily Rainfall Occurrence at Tel Aviv. Q. J. R. Meteorol. Soc. 1962, 88, 90–95. [Google Scholar] [CrossRef]
  16. Hernández-Bedolla, J.; Solera, A.; Paredes-Arquiola, J.; Sanchez-Quispe, S.T.; Domínguez-Sánchez, C. A Continuous Multisite Multivariate Generator for Daily Temperature Conditioned by Precipitation Occurrence. Water 2022, 14, 3494. [Google Scholar] [CrossRef]
  17. Hayhoe, H.N. Improvements of Stochastic Weather Data Generators for Diverse Climates. Clim. Res. 2000, 14, 75–87. [Google Scholar] [CrossRef]
  18. Richardson, C.W.; Wright, D.A.; Nofziger, D.L.; Hornsby, A.G. WGEN: A Model for Generating Daily Weather Variables; U.S. Department of Agriculture: Washington, DC, USA, 1984.
  19. Marcello, D.; Gianni, B.; Ephrem, H.; Simone, B.; Roberto, C.; Bettina, B. CLIMA: A Weather Generator Framework. In Proceedings of the 18th World IMACS/MODSIM Congress, Cairns, Australia, 13–17 July 2009. [Google Scholar]
  20. Stöckle, C.O.; Nelson, R.; Donatelli, M.; Castellvì, F. ClimGen: A Flexible Weather Generation Program. In Proceedings of the 2nd International Symposium Modelling Cropping Systems, Florence, Italy, 16–18 July 2001; pp. 16–18. [Google Scholar]
  21. Semenov, M.A.; Barrow, E.M. User´s guide: LARS-WG A Stochastic Weather Generator for Use in Climate Impact Studies LARS-WG: Stochastic Weather Generator Contents; Rothamsted: Harpended, Hertfordshire, UK, 2002. [Google Scholar]
  22. Chen, J.; Brissette, F.P.; Leconte, R. WeaGETS—A Matlab-Based Daily Scale Weather Generator for Generating Precipitation and Temperature. Procedia Environ. Sci. 2012, 13, 2222–2235. [Google Scholar] [CrossRef]
  23. Mehrotra, R.; Li, J.; Westra, S.; Sharma, A. A Programming Tool to Generate Multi-Site Daily Rainfall Using a Two-Stage Semi Parametric Model. Environ. Model. Softw. 2015, 63, 230–239. [Google Scholar] [CrossRef]
  24. Carter, T.; Posch, M.; Tuomenvirta, H. SILMUSCEN and CLIGEN User’s Guide: Guidelines for the Construction of Climatic Scenarios and Use of a Stochastic Weather Generator in the Finnish; Academy of Finland: Helsinki, Finland, 1995. [Google Scholar]
  25. Richardson, C.W. Stochastic Simulation of Daily Precipitation, Temperature, and Solar Radiation. Water Resour. Res. 1981, 17, 182–190. [Google Scholar] [CrossRef]
  26. Rayner, D.; Achberger, C.; Chen, D. A Multi-State Weather Generator for Daily Precipitation for the Torne River Basin, Northern Sweden/Western Finland. Adv. Clim. Change Res. 2016, 7, 70–81. [Google Scholar] [CrossRef]
  27. Humphrey, G.B.; Gibbs, M.S.; Dandy, G.C.; Maier, H.R. A Hybrid Approach to Monthly Streamflow Forecasting: Integrating Hydrological Model Outputs into a Bayesian Artificial Neural Network. J. Hydrol. 2016, 540, 623–640. [Google Scholar] [CrossRef]
  28. Portoghese, I.; Bruno, E.; Guyennon, N.; Iacobellis, V. Stochastic Bias-Correction of Daily Rainfall Scenarios for Hydrological Applications. Nat. Hazards Earth Syst. Sci. 2011, 11, 2497–2509. [Google Scholar] [CrossRef]
  29. Wang, L.; Onof, C. Analysis of sub-daily rainfall sequences based upon a semi-deterministic multiplicative cascade method. In Proceedings of the International Workshop on Advances in Statistical Hydrology, Taormina, Italy, 23–25 May 2010; pp. 1–9. [Google Scholar]
  30. Vandenberghe, S.; Verhoest, N.E.C.; Buyse, E.; De Baets, B. A Stochastic Design Rainfall Generator Based on Copulas and Mass Curves. Hydrol. Earth Syst. Sci. 2010, 14, 2429–2442. [Google Scholar] [CrossRef]
  31. Katz, R.W.; Parlange, M.B. Generalizations of Chain-Dependent Processes: Application to Hourly Precipitation. Water Resour. Res. 1995, 31, 1331–1341. [Google Scholar] [CrossRef]
  32. Koch, E.; Naveau, P. A Frailty-Contagion Model for Multi-Site Hourly Precipitation Driven by Atmospheric Covariates. Adv. Water Resour. 2015, 78, 145–154. [Google Scholar] [CrossRef]
  33. Ailliot, P.; Allard, D.; Monbet, V.; Naveau, P. Stochastic Weather Generators: An Overview of Weather Type Models. J. Société Française Stat. Rev. Stat. Appliquée 2015, 156, 101–113. [Google Scholar]
  34. Wilks, D.S. Multisite Generalization of a Daily Stochastic Precipitation Generation Model. J. Hydrol. 1998, 210, 178–191. [Google Scholar] [CrossRef]
  35. Anderson, R.L. Distribution of the Serial Correlation Coefficient. Ann. Math. Stat. 1942, 13, 1–13. [Google Scholar] [CrossRef]
  36. Moors, D.S.; Stubblebine, J.B. Chi-Square Tests for multivariate normality with application to common stock prices. Commun. Stat.-Theory Methods 1981, 10, 713–738. [Google Scholar]
  37. Hu, S. Akaike Information Criterion Statistics. Math. Comput. Simul. 1987, 29, 452. [Google Scholar] [CrossRef]
  38. Lima, A.O.; Lyra, G.B.; Abreu, M.C.; Oliveira-Júnior, J.F.; Zeri, M.; Cunha-Zeri, G. Extreme Rainfall Events over Rio de Janeiro State, Brazil: Characterization Using Probability Distribution Functions and Clustering Analysis. Atmos. Res. 2021, 247, 105221. [Google Scholar] [CrossRef]
  39. Simolo, C.; Brunetti, M.; Maugeri, M.; Nanni, T. Improving Estimation of Missing Values in Daily Precipitation Series by a Probability Density Function-Preserving Approach. Int. J. Climatol. 2010, 30. [Google Scholar] [CrossRef]
  40. Li, C.; Singh, V.P.; Mishra, A.K. Simulation of the Entire Range of Daily Precipitation Using a Hybrid Probability Distribution. Water Resour. Res. 2012, 48, 3521. [Google Scholar] [CrossRef]
  41. Shin, Y.; Park, J.S. Modeling Climate Extremes Using the Four-Parameter Kappa Distribution for r-Largest Order Statistics. Weather Clim. Extrem. 2023, 39, 100533. [Google Scholar] [CrossRef]
  42. Alahmadi, F.S.; Rahman, N.A. Climate Change Impacts on Extreme Rainfall Frequency Prediction. J. Water Clim. Change 2020, 11, 935–943. [Google Scholar] [CrossRef]
  43. Nwaogazie, I.L.; Sam, M.G.; Enciso, R.Z.; Gonsalves, E. Probability and Non-Probability Rainfall Intensity-Duration-Frequency Modeling for Port-Harcourt Metropolis, Nigeria. Int. J. Hydrol. 2019, 3, 66–75. [Google Scholar] [CrossRef]
  44. Bajirao, T.S. Comparative Performance of Different Probability Distribution Functions for Maximum Rainfall Estimation at Different Time Scales. Arab. J. Geosci. 2021, 14, 2138. [Google Scholar] [CrossRef]
  45. Devkota, S.; Shakya, N.M.; Sudmeier-Rieux, K.; Jaboyedoff, M.; Van Westen, C.J.; Mcadoo, B.G.; Adhikari, A. Development of Monsoonal Rainfall Intensity-Duration-Frequency (IDF) Relationship and Empirical Model for Data-Scarce Situations: The Case of the Central-Western Hills (Panchase Region) of Nepal. Hydrology 2018, 5, 27. [Google Scholar] [CrossRef]
  46. Pizarro, R.; Valdés, R.; García-Chevesich, P.; Vallejos, C.; Sangüesa, C.; Morales, C.; Balocchi, F.; Abarza, A.; Fuentes, R. Latitudinal Analysis of Rainfall Intensity and Mean Annual Precipitation in Chile. Chil. J. Agric. Res. 2012, 72, 252–261. [Google Scholar] [CrossRef]
  47. Villón-Béjar, M. HidroEsta, Software for Hydrological Calculations. Rev. Tecnol. En Marcha 2016, 29, 95–108. [Google Scholar] [CrossRef]
  48. Villón Béjar, M. HidroEsta, Software Para Cálculos Hidrológicos. Tecnol. En Marcha 2005, 18, 67. [Google Scholar]
  49. Villón Béjar, M. HidroEsta, Software Para Cálculos Hidrológicos y Estadísticos Aplicados a La Hidrología. Rev. Digit. Matemática Educ. E Internet 2014, 12, 1–8. [Google Scholar] [CrossRef]
  50. García Castro, E.G. Estimación de caudales máximos en el rio Chira, utilizando métodos estadisticos de Gumbel y de Pearson tipo III; Universidad Nacional de Piura: Castilla, Piura, Peru, 2023. [Google Scholar]
  51. Mendoza, R.; Zavala, J.; Villa, S. Revisión de Gastos de Diseño de La Presa Huites Mediante Relaciones Lluvia-Escurrimiento. Ing. Hidráulica Y Ambient. 2014, XXXV, 77–89. [Google Scholar]
  52. Yu, B. Theoretical Justification of SCS Method for Runoff Estimation. J. Irrig. Drain. Eng. 1998, 124, 306–310. [Google Scholar] [CrossRef]
  53. Hawkins, R.H.; Hjelmfelt, A.T.; Zevenbergen, A.W. Runoff Probability, Storm Depth, and Curve Numbers. J. Irrig. Drain. Eng. 1985, 111, 330–340. [Google Scholar] [CrossRef]
  54. Yu, B. Validation of SCS Method for Runoff Estimation. J. Hydrol. Eng. 2012, 17, 1158–1163. [Google Scholar] [CrossRef]
  55. Boughton, W.C. A Review of the USDA SCS Curve Number Method. Aust. J. Soil Res. 1989, 27, 511–523. [Google Scholar] [CrossRef]
  56. Hooshyar, M.; Wang, D. An Analytical Solution of Richards’ Equation Providing the Physical Basis of SCS Curve Number Method and Its Proportionality Relationship. Water Resour. Res. 2016, 52, 6611–6620. [Google Scholar] [CrossRef]
  57. Kirkby, M.; Cerdà, A. Following the Curve? Reviewing the Physical Basis of the SCS Curve Number Method for Estimating Storm Runoff. Hydrol. Process. 2021, 35, e14404. [Google Scholar] [CrossRef]
  58. Stathi, E.; Kastridis, A.; Myronidis, D. Analysis of Hydrometeorological Characteristics and Water Demand in Semi-Arid Mediterranean Catchments under Water Deficit Conditions. Climate 2023, 11, 137. [Google Scholar] [CrossRef]
  59. Verma, S.; Verma, R.K.; Mishra, S.K.; Singh, A.; Jayaraj, G.K. A Revisit of NRCS-CN Inspired Models Coupled with RS and GIS for Runoff Estimation. Hydrol. Sci. J. 2017, 62, 1891–1930. [Google Scholar] [CrossRef]
  60. Satheeshkumar, S.; Venkateswaran, S.; Kannan, R. Rainfall–Runoff Estimation Using SCS–CN and GIS Approach in the Pappiredipatti Watershed of the Vaniyar Sub Basin, South India. Model. Earth Syst. Environ. 2017, 3, 24. [Google Scholar] [CrossRef]
  61. Halwatura, D.; Najim, M.M.M. Application of the HEC-HMS Model for Runoff Simulation in a Tropical Catchment. Environ. Model. Softw. 2013, 46, 155–162. [Google Scholar] [CrossRef]
  62. Gimeno, L.; Sorí, R.; Vázquez, M.; Stojanovic, M.; Algarra, I.; Eiras-Barca, J.; Gimeno-Sotelo, L.; Nieto, R. Extreme Precipitation Events. Wiley Interdiscip. Rev. Water 2022, 9, e1611. [Google Scholar] [CrossRef]
  63. Chen, X.; Hossain, F. Understanding Future Safety of DAMs in a Changing Climate. Bull. Am. Meteorol. Soc. 2019, 100, 1395–1404. [Google Scholar] [CrossRef]
  64. Yin, C.; Wang, J.; Yu, X.; Li, Y.; Yan, D.; Jian, S. Definition of Extreme Rainfall Events and Design of Rainfall Based on the Copula Function. Water Resour. Manag. 2022, 36, 3759–3778. [Google Scholar] [CrossRef]
  65. Zhu, B.; Chen, J.; Chen, H. Performance of Multiple Probability Distributions in Generating Daily Precipitation for the Simulation of Hydrological Extremes. Stoch. Environ. Res. Risk Assess. 2019, 33, 1581–1592. [Google Scholar] [CrossRef]
  66. Chen, J.; Brissette, F.P.; Zielinski, P.A. Constraining Frequency Distributions with the Probable Maximum Precipitation for the Stochastic Generation of Realistic Extreme Events. J. Extrem. Events 2015, 2, 1550009. [Google Scholar] [CrossRef]
  67. Chen, J.; Brissette, F.P.; Chaumont, D.; Braun, M. Performance and Uncertainty Evaluation of Empirical Downscaling Methods in Quantifying the Climate Change Impacts on Hydrology over Two North American River Basins. J. Hydrol. 2013, 479, 200–214. [Google Scholar] [CrossRef]
  68. Chen, J.; Brissette, F.P.; Zhang, X.J. Hydrological Modeling Using a Multisite Stochastic Weather Generator. J. Hydrol. Eng. 2016, 21, 04015060. [Google Scholar] [CrossRef]
  69. Chen, J.; Brissette, F.P.; Leconte, R. Downscaling of Weather Generator Parameters to Quantify Hydrological Impacts of Climate Change. Clim. Res. 2012, 51, 185–200. [Google Scholar] [CrossRef]
  70. Hernández-Bedolla, J. Análisis de Datos Climáticos Como Predictor Para La Gestión Anticipada de Sequias. Ph.D. Thesis, Universidad Politecnica de Valencia, Valence, Spain, 2022. [Google Scholar]
  71. Sparks, N.J.; Hardwick, S.R.; Schmid, M.; Toumi, R. IMAGE: A Multivariate Multi-Site Stochastic Weather Generator for European Weather and Climate. Stoch. Environ. Res. Risk Assess. 2018, 32, 771–784. [Google Scholar] [CrossRef]
  72. Chen, J.; Brissette, F.P.; Leconte, R. A Daily Stochastic Weather Generator for Preserving Low-Frequency of Climate Variability. J. Hydrol. 2010, 388, 480–490. [Google Scholar] [CrossRef]
  73. Gu, L.; Chen, J.; Xu, C.; Kim, J.; Chen, H.; Xia, J.; Zhang, L. The Contribution of Internal Climate Variability to Climate Change Impacts on Droughts. Sci. Total Environ. 2019, 684, 229–246. [Google Scholar] [CrossRef]
  74. Li, Z.; Brissette, F.; Chen, J. Finding the Most Appropriate Precipitation Probability Distribution for Stochastic Weather Generation and Hydrological Modelling in Nordic Watersheds. Hydrol. Process. 2013, 27, 3718–3729. [Google Scholar] [CrossRef]
  75. Rawat, K.S.; Singh, S.K. Estimation of Surface Runoff from Semi-Arid Ungauged Agricultural Watershed Using SCS-CN Method and Earth Observation Data Sets. Water Conserv. Sci. Eng. 2017, 1, 233–247. [Google Scholar] [CrossRef]
  76. Ouaba, M.; Saidi, M.E.; Alam, M.J. Bin Flood Modeling through Remote Sensing Datasets Such as LPRM Soil Moisture and GPM-IMERG Precipitation: A Case Study of Ungauged Basins across Morocco. Earth Sci. Inform. 2023, 16, 653–674. [Google Scholar] [CrossRef]
  77. Meresa, H. Modelling of River Flow in Ungauged Catchment Using Remote Sensing Data: Application of the Empirical (SCS-CN), Artificial Neural Network (ANN) and Hydrological Model (HEC-HMS). Model Earth Syst. Environ. 2019, 5, 257–273. [Google Scholar] [CrossRef]
  78. Topçuoğlu, M.E.; Karagüzel, R.; Doğan, A. Comparison of the SCS-CN and Hydrograph Separation Method for Runoff Estimation in an Ungauged Basin: The Izmit Basin, Turke. Int. J. Econ. Environ. Geol. 2022, 12, 22–31. [Google Scholar] [CrossRef]
  79. Ningaraju, H.J.; Kumar, S.B.G.; Surendra, H.J. Estimation of Runoff Using SCS-CN and GIS Method in Ungauged Watershed: A Case Study of Kharadya Mill Watershed, India. Int. J. Adv. Eng. Res. Sci. 2016, 3, 36–42. [Google Scholar]
  80. Hashim, H.Q.; Sayl, K.N. Incorporating GIS Technique and SCS-CN Approach for Runoff Estimation in the Ungauged Watershed: A Case Study West Desert of Iraq. Iraqi J. Civ. Eng. 2022, 14, 1–6. [Google Scholar] [CrossRef]
  81. Nageswara Rao, K. Analysis of Surface Runoff Potential in Ungauged Basin Using Basin Parameters and SCS-CN Method. Appl. Water Sci. 2020, 10, 47. [Google Scholar] [CrossRef]
  82. Jeon, J.H.; Lim, K.J.; Engel, B.A. Regional Calibration of SCS-CN L-THIA Model: Application for Ungauged Basins. Water 2014, 6, 1339–1359. [Google Scholar] [CrossRef]
  83. Moid Mohammed, A.; Lakshmi Thatiparthi, V.; Rao Pyla, K.; Maryada, A. Estimation of Surface Runoff in an Ungauged Basin Using SCS-CN Method, A Case Study of Manair River Basin in Telangana, India. Appl. Ecol. Environ. Sci. 2020, 8, 340–350. [Google Scholar] [CrossRef]
  84. Faouzi, E.; Arioua, A.; Hssaisoune, M.; Boudhar, A.; Elaloui, A.; Karaoui, I. Sensitivity Analysis of CN Using SCS-CN Approach, Rain Gauges and TRMM Satellite Data Assessment into HEC-HMS Hydrological Model in the Upper Basin of Oum Er Rbia, Morocco. Model Earth Syst. Environ. 2022, 8, 4707–4729. [Google Scholar] [CrossRef]
  85. Juma, B.; Olang, L.O.; Hassan, M.A.; Mulligan, J.; Shiundu, P.M. Simulation of Flood Peak Discharges and Volumes for Flood Risk Management in the Ungauged Urban Informal Settlement of Kibera, Kenya. Phys. Chem. Earth 2022, 128, 103236. [Google Scholar] [CrossRef]
  86. Bharali, B.; Misra, U.K. Numerical Approach for Channel Flood Routing in an Ungauged Basin: A Case Study in Kulsi River Basin, India. Water Conserv. Sci. Eng. 2022, 7, 389–404. [Google Scholar] [CrossRef]
  87. Ouaba, M.; El Khalki, E.M.; Saidi, M.E.; Alam, M.J. Bin Estimation of Flood Discharge in Ungauged Basin Using GPM-IMERG Satellite-Based Precipitation Dataset in a Moroccan Arid Zone. Earth Syst. Environ. 2022, 6, 541–556. [Google Scholar] [CrossRef]
  88. Forootan, E. GIS-Based Slope-Adjusted Curve Number Methods for Runoff Estimation. Environ. Monit. Assess. 2023, 195, 489. [Google Scholar] [CrossRef]
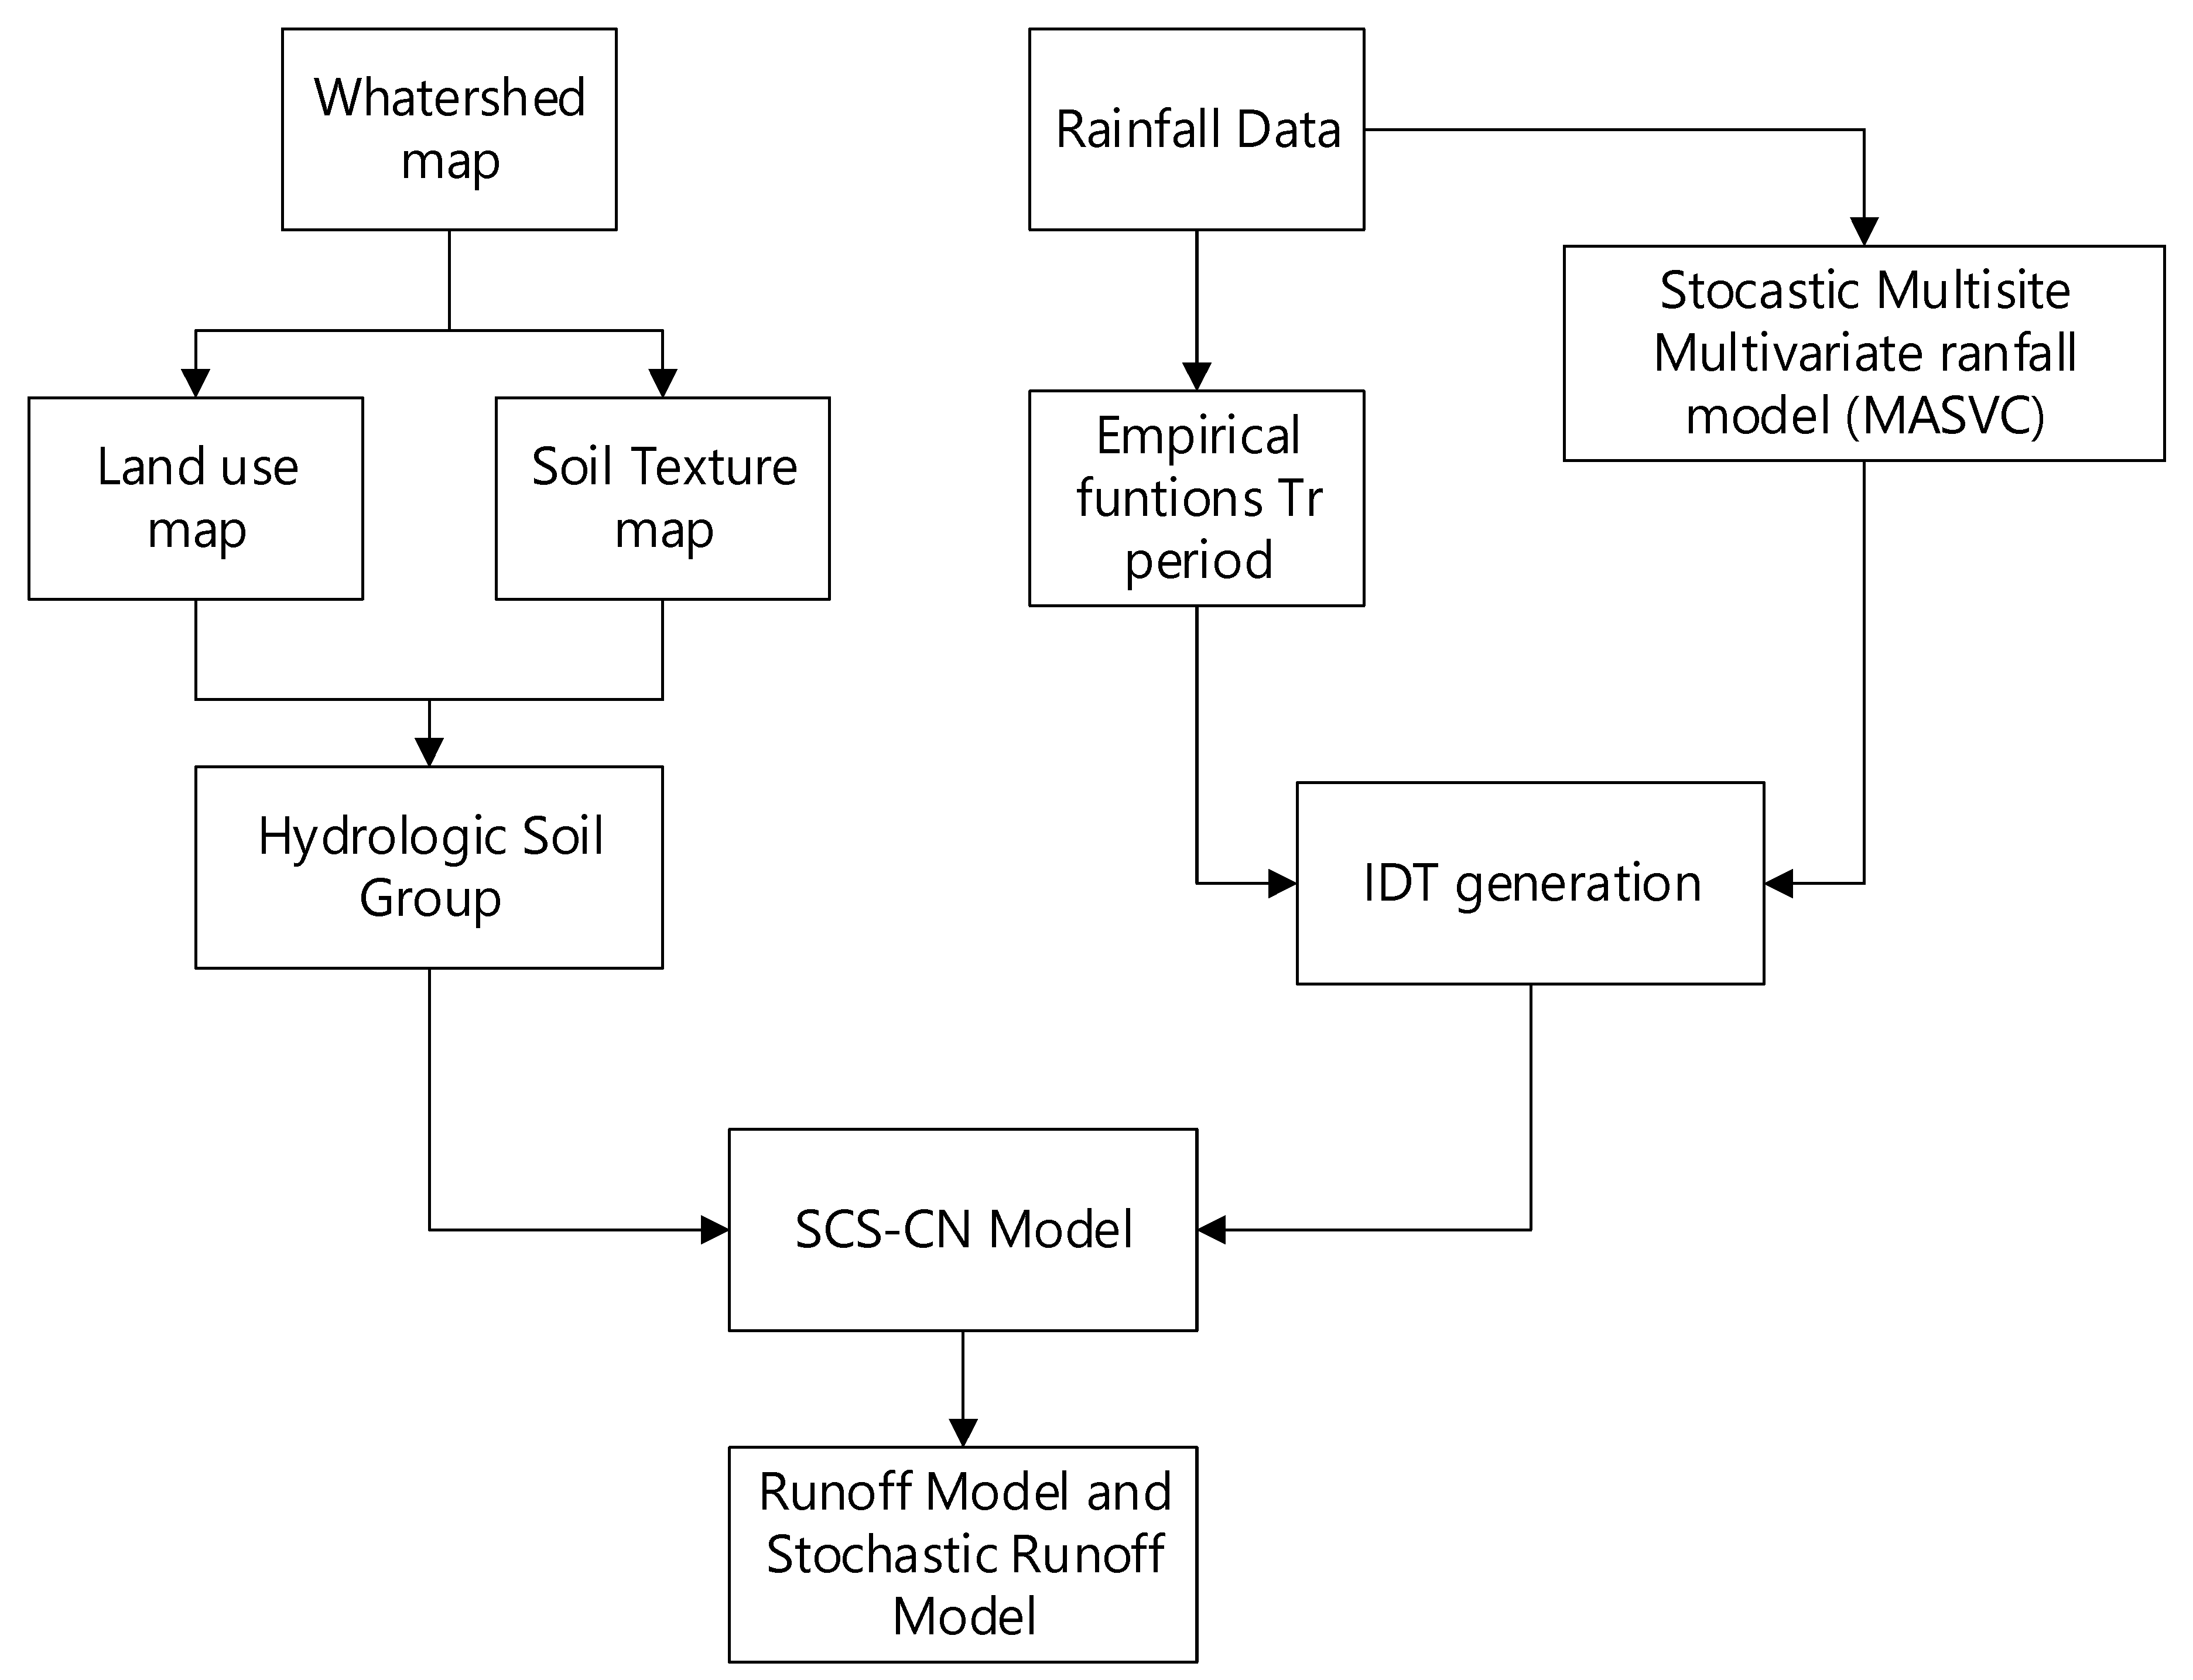
Figure 1. Proposed methodology.
Water 15 02994 g001
Figure 2. Location of the subbasins in Morelia. 1 Itzicuaros, 2 Alberca, 4 Barajas, 5 Arroyo de Tierras, 6 Rio Chiquito, 8 Atapaneo, 12 Quinceo, 13 Mora Tovar, 14 Calabocito, 15 Calabozo, and 16 Carlos Salazar. Patzcuaro basin 1, Angulo basin 2, Cuitzeo basin 3, Zirahuen basin, Hydrologic Región 12.
Water 15 02994 g002
Figure 3. Transition probabilities for all stations (a) p 01 and (b) p 11 , (+) extreme data points considered outliers.
Water 15 02994 g003
Figure 4. Daily average of skewness coefficient (1980−2009) with confidence Anderson limits: (a) historic rainfall and (b) normalized rainfall.
Water 15 02994 g004
Figure 5. Residual series for all subbasins: (a) autocorrelation lag−10 and (b) normal standard distribution (blue) and residual (bars).
Water 15 02994 g005
Figure 6. Scatter plots for rainfall occurrence (mean of 30 observed years and 1000 simulated series) for the four stations: (a) 16022, (b) 16247, (c) 16055, and (d) 16081.
Water 15 02994 g006
Figure 7. Scatter plots for observed mean versus daily simulated rainfall (mean of 30 observed years and 1000 simulated series) for stations: (a) 16022, (b) 16247, (c) 16055, and (d) 16081.
Water 15 02994 g007
Figure 8. Observed and simulated maximum daily rainfall for 30 years (mean of 30 observed years and 1000 simulated series) for the four stations: (a) 16022, (b) 16247, (c) 16055, and (d) 16081.
Water 15 02994 g008
Figure 9. Urban subbasins in Morelia. 1 Itzicuaros, 2 Alberca, 4 Barajas, 5 Arroyo de Tierras, 6 Rio Chiquito, 8 Atapaneo, 12 Quinceo, 13 Mora Tovar, 14 Calabocito, 15 Calabozo, and 16 Carlos Salazar.
Water 15 02994 g009
Figure 10. Curve number for all subbasins.
Water 15 02994 g010
Table 1. Stations considered in this study.
StationLatitude (°)Longitude (°)Elevation (msnm)YearsTotal Annual Precipitation (mm/year)Pmax * (mm/year)
1602219.625−101.28120961980−2009811.878
1624719.675101.39220971980−2009700.775.3
1605519.652−101.15121801980−20091092.2597
1608116.289−101.17619131980−2009772.2180.1
Note: * Maximum precipitation per year.
Table 2. Normality analysis for residual series for both M1 and M2 (wet threshold 0.001).
Statistical/Station16055160811602216247
Mean−0.0084−0.00350.080−0.078
Standard deviation1.04311.08431.33151.0895
Skewness coefficient−0.12120.32460.5622−0.0939
Lag-one autocorrelation 0.02390.04200.0461−0.0581
AIC−2145−1995−4733−2652
Table 3. Smirnov–Kolmogorov test for each of the PDFs fitted to the maximum 24 h precipitation series for each station.
Function/Station16055160811602216247
Normal0.19770.11380.19320.1193
Log-Normal 3P0.10640.05920.0696 *0.1044
Log-Normal 2P0.11870.06180.11640.0907 *
Gamma 2P0.14270.07980.14330.1025
Gamma 3PN/A0.05595N/A0.09575
Log Pearson III0.097610.0511N/AN/A
Gumbel0.13470.045 *0.14780.0994
Log Gumbel0.0871 *0.05960.0790.0924
Note: * Best fit.
Table 4. Comparison of MASVC versus PDFs for all stations.
ModelTR16022162471605516081
MASVC234.9940.0547.7331.65
543.7850.4759.4947.45
1058.2664.3371.8759.36
2069.5879.3184.4172.07
5087.3399.25101.3491.33
100102.25112.2116.51105.23
PDF240.6641.0131.2742.7
552.6156.243.6153.75
1061.6366.2754.3561.07
2071.0375.9367.1368.09
5084.2788.4988.2377.18
10095.0298108.2883.99
Table 5. Geomorphological characteristics and curve number of the subbasins study.
Subbasin *Area (km2)Height Difference (m)Length of the Main Channel (m)Slope (%)Concentration Time (h)CN
1308.3289830,833.012.413.6276.35
247.62113216,106.465.721.5678.36
424.345911,451.815.321.4984.47
526.6756112,862.884.581.5883.14
686.7941621,086.861.133.1377.03
818.852309394.32.461.5584.16
1240.1979214,307.834.771.5685.09
1310.012584614.525.140.6586.87
146.112204114.463.950.6186.02
1511.36719878.713.671.0884.67
1610.711.93453.540.430.2987.21
Note: * 1 Itzicuaros, 2 Alberca, 4 Barajas, 5 Arroyo de Tierras, 6 Rio Chiquito, 8 Atapaneo, 12 Quinceo, 13 Mora Tovar, 14 Calabocito, 15 Calabozo, and 16 Carlos Salazar.
Table 6. Surface runoff for all subbasins MASVC-SCS-CN and PDF-SCS-CN.
Model* Subbasin/Tr25102050100
MASVC-SCS-CN19.6835.0188.48166.82298.97394.90
20.321.499.8620.7244.1168.85
40.111.455.3911.9325.7338.10
51.456.1113.0822.2636.6253.63
64.3813.7628.2547.0878.03110.21
80.111.1725.3030.7238.9344.85
120.932.519.0819.8942.5062.65
130.050.472.867.3917.7227.20
140.020.101.754.2910.1216.44
150.010.121.934.6410.7817.52
160.230.942.956.0912.4317.95
PDF-SCS-CN110.5652.59104.17142.81217.25280.62
20.987.0616.7925.4244.1562.26
40.914.245.087.6417.9223.30
50.331.115.8111.4728.0048.51
62.213.0613.7325.4859.66101.38
80.673.163.795.6813.3917.45
121.406.677.9912.0228.3336.87
130.111.732.153.7210.5314.29
140.100.902.744.708.9813.24
150.061.343.746.0111.0516.06
160.602.292.613.918.6511.06
Note: * 1 Itzicuaros, 2 Alberca, 4 Barajas, 5 Arroyo de Tierras, 6 Rio Chiquito, 8 Atapaneo, 12 Quinceo, 13 Mora Tovar, 14 Calabocito, 15 Calabozo, and 16 Carlos Salazar.
Disclaimer/Publisher’s Note: The statements, opinions and data contained in all publications are solely those of the individual author(s) and contributor(s) and not of MDPI and/or the editor(s). MDPI and/or the editor(s) disclaim responsibility for any injury to people or property resulting from any ideas, methods, instructions or products referred to in the content.