
Monitoring Analysis of a Deep Foundation Pit with Water Supported by Cast-in-Place Pile and Internal Bracing in a Soft Soil Area of Fuzhou

Abstract
:1. Introduction
2. Project Overview
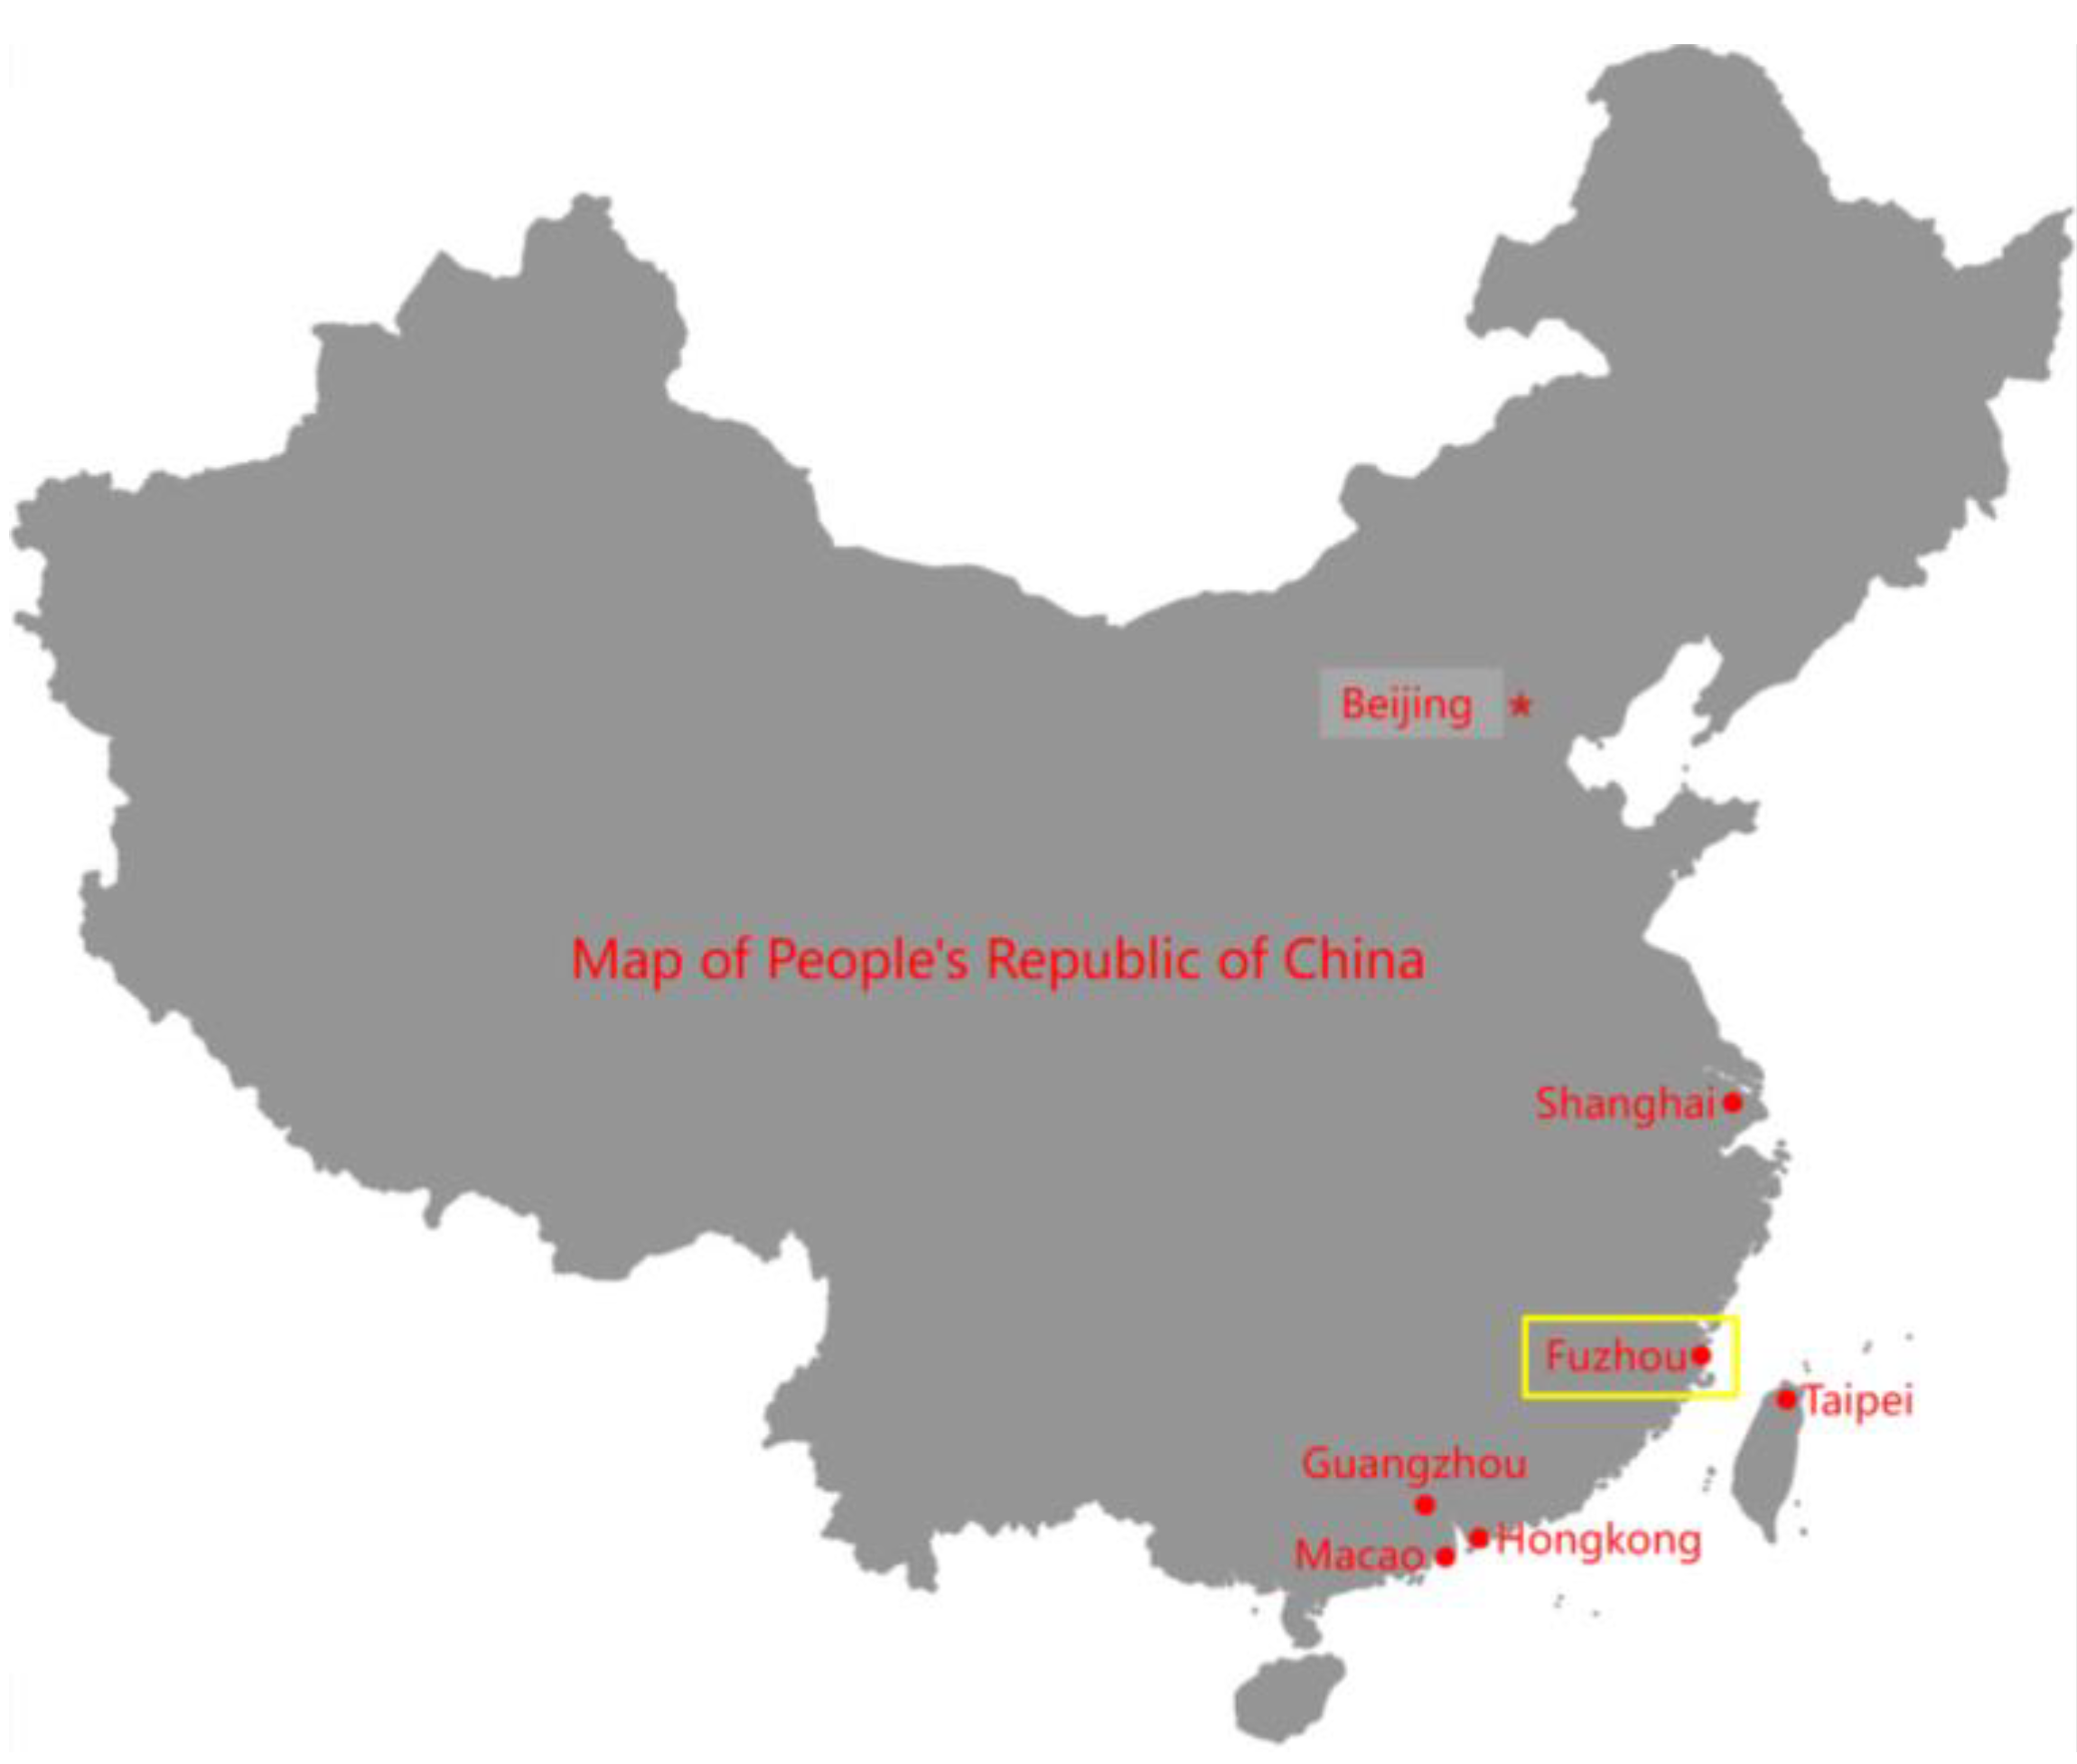
2.1. Site Overview
2.2. Geotechnical Conditions
2.3. Hydrogeological Conditions
3. Design Scheme of Foundation Pit Support and Construction Stage of Foundation Pit
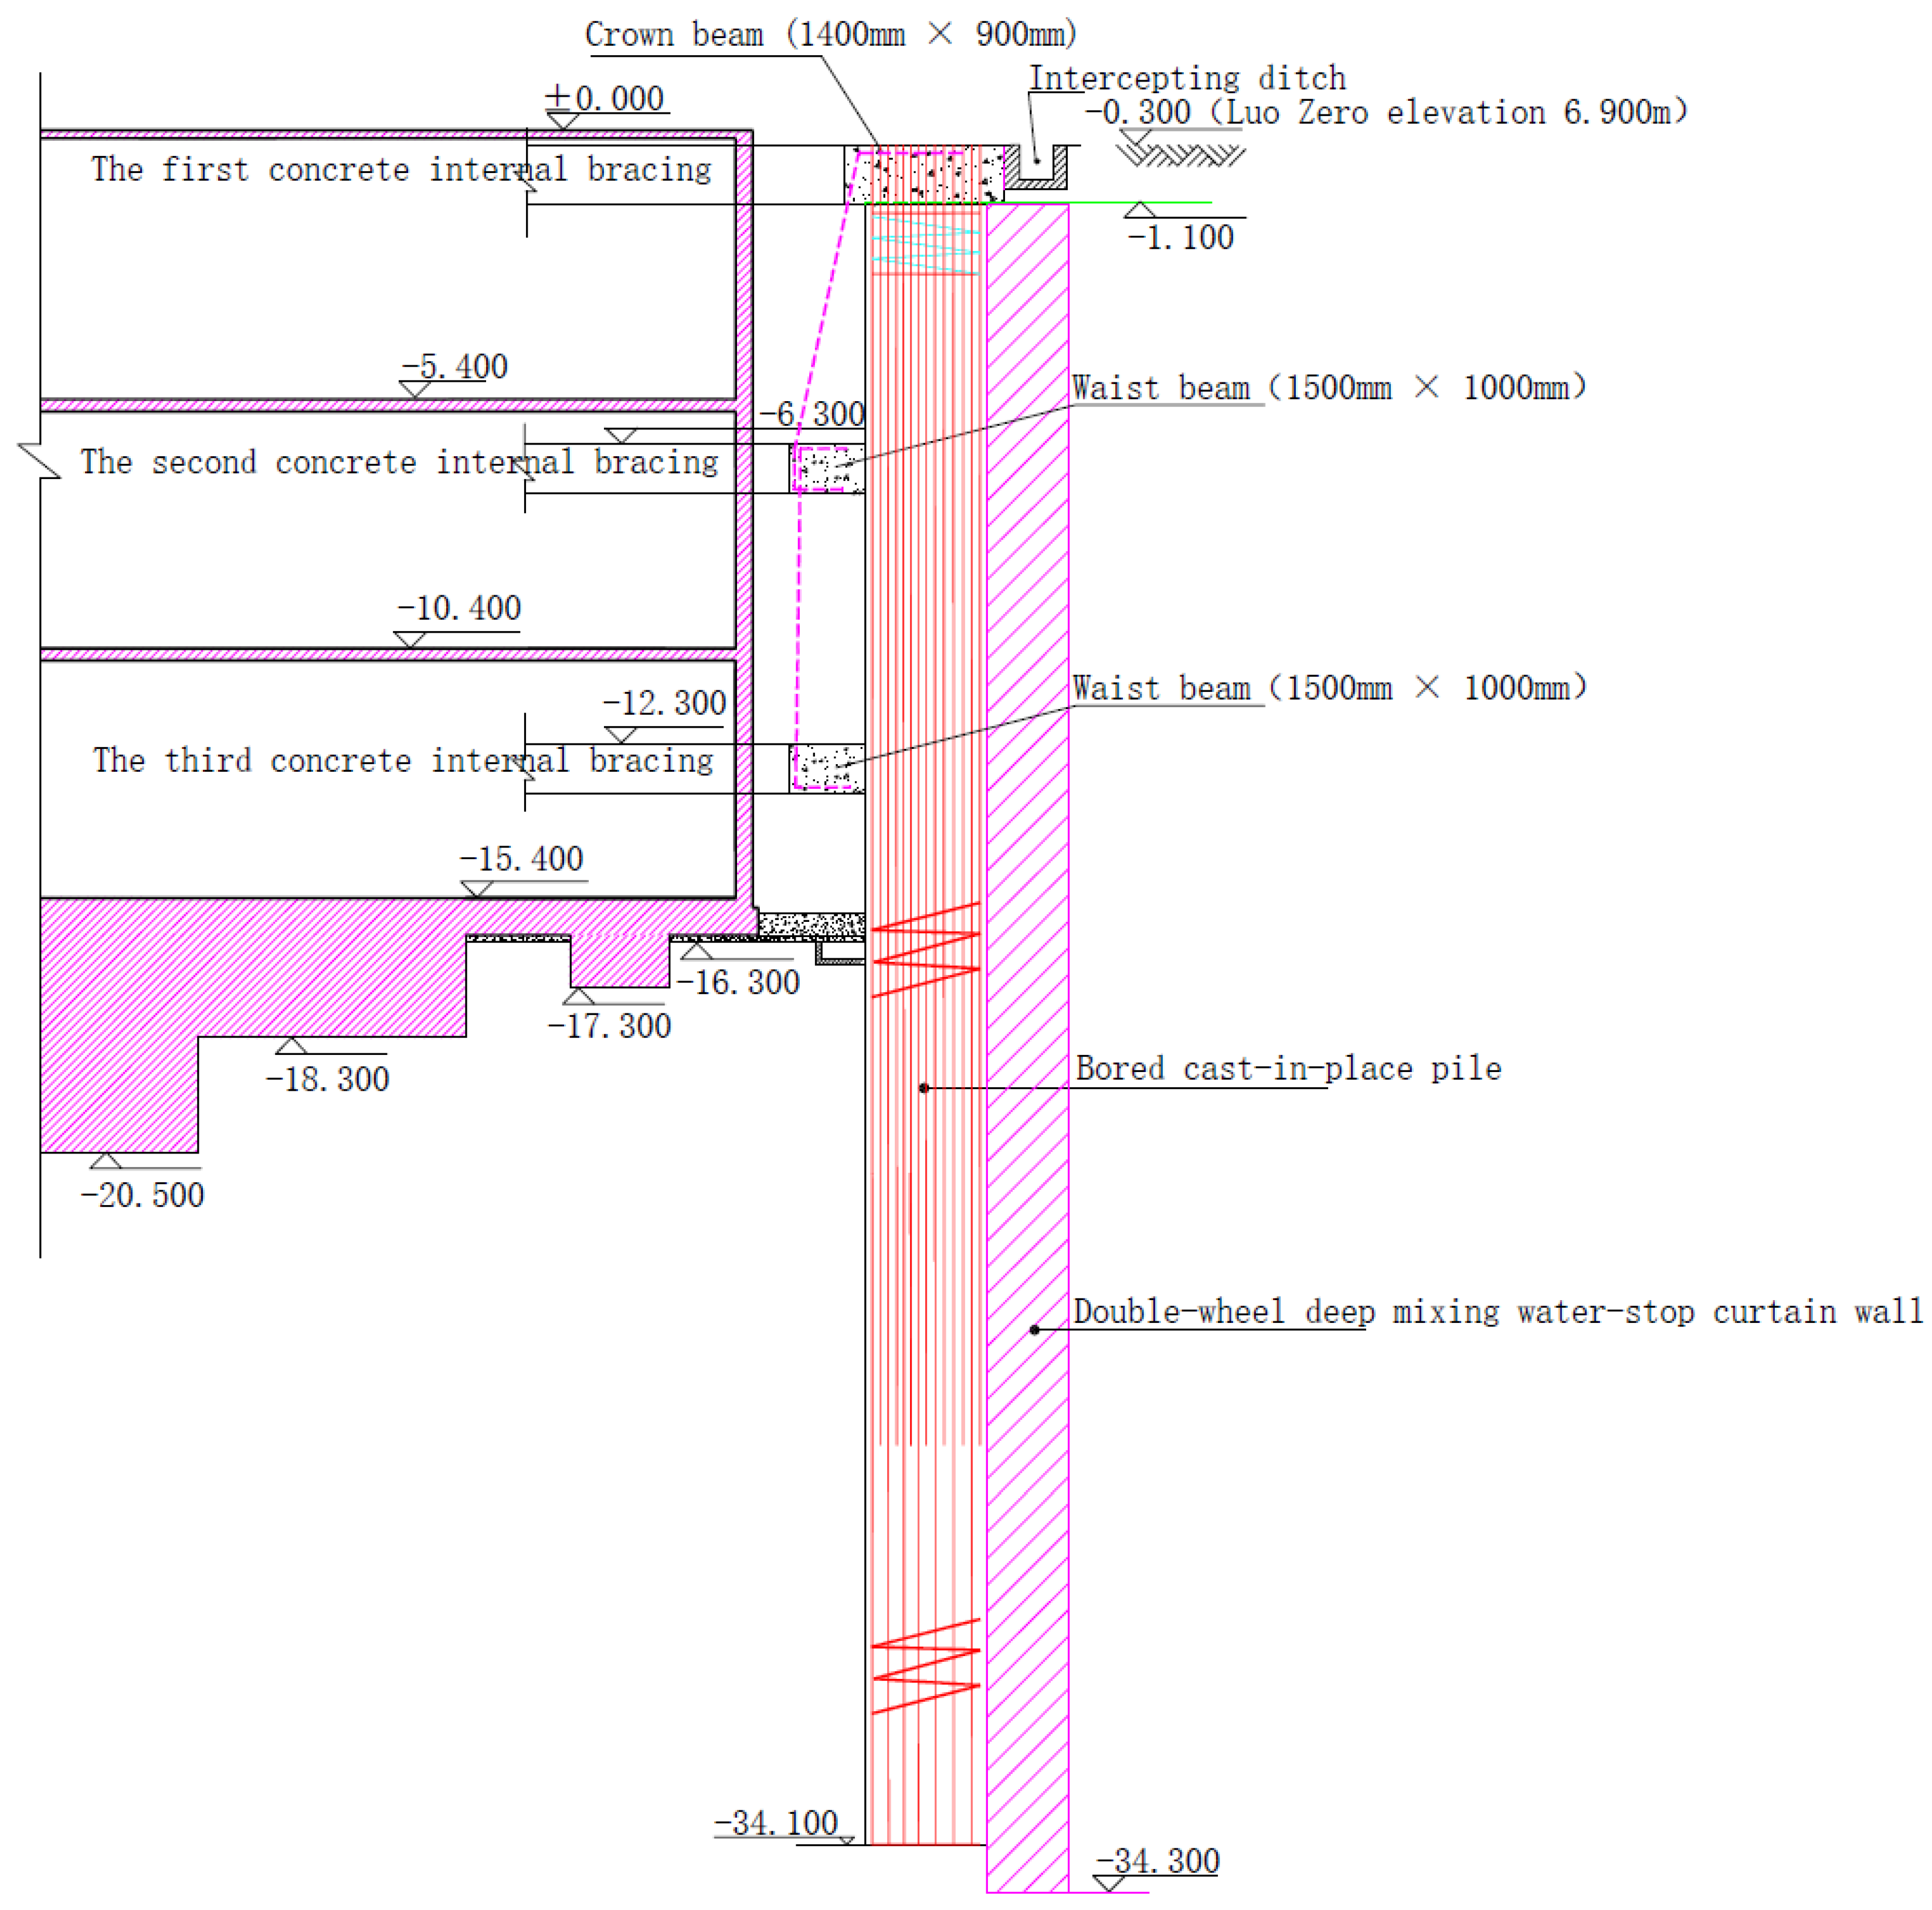
3.1. Form of Enclosure Structure
3.2. Foundation Pit Precipitation and Drainage
3.3. Construction Stage of Foundation Pit
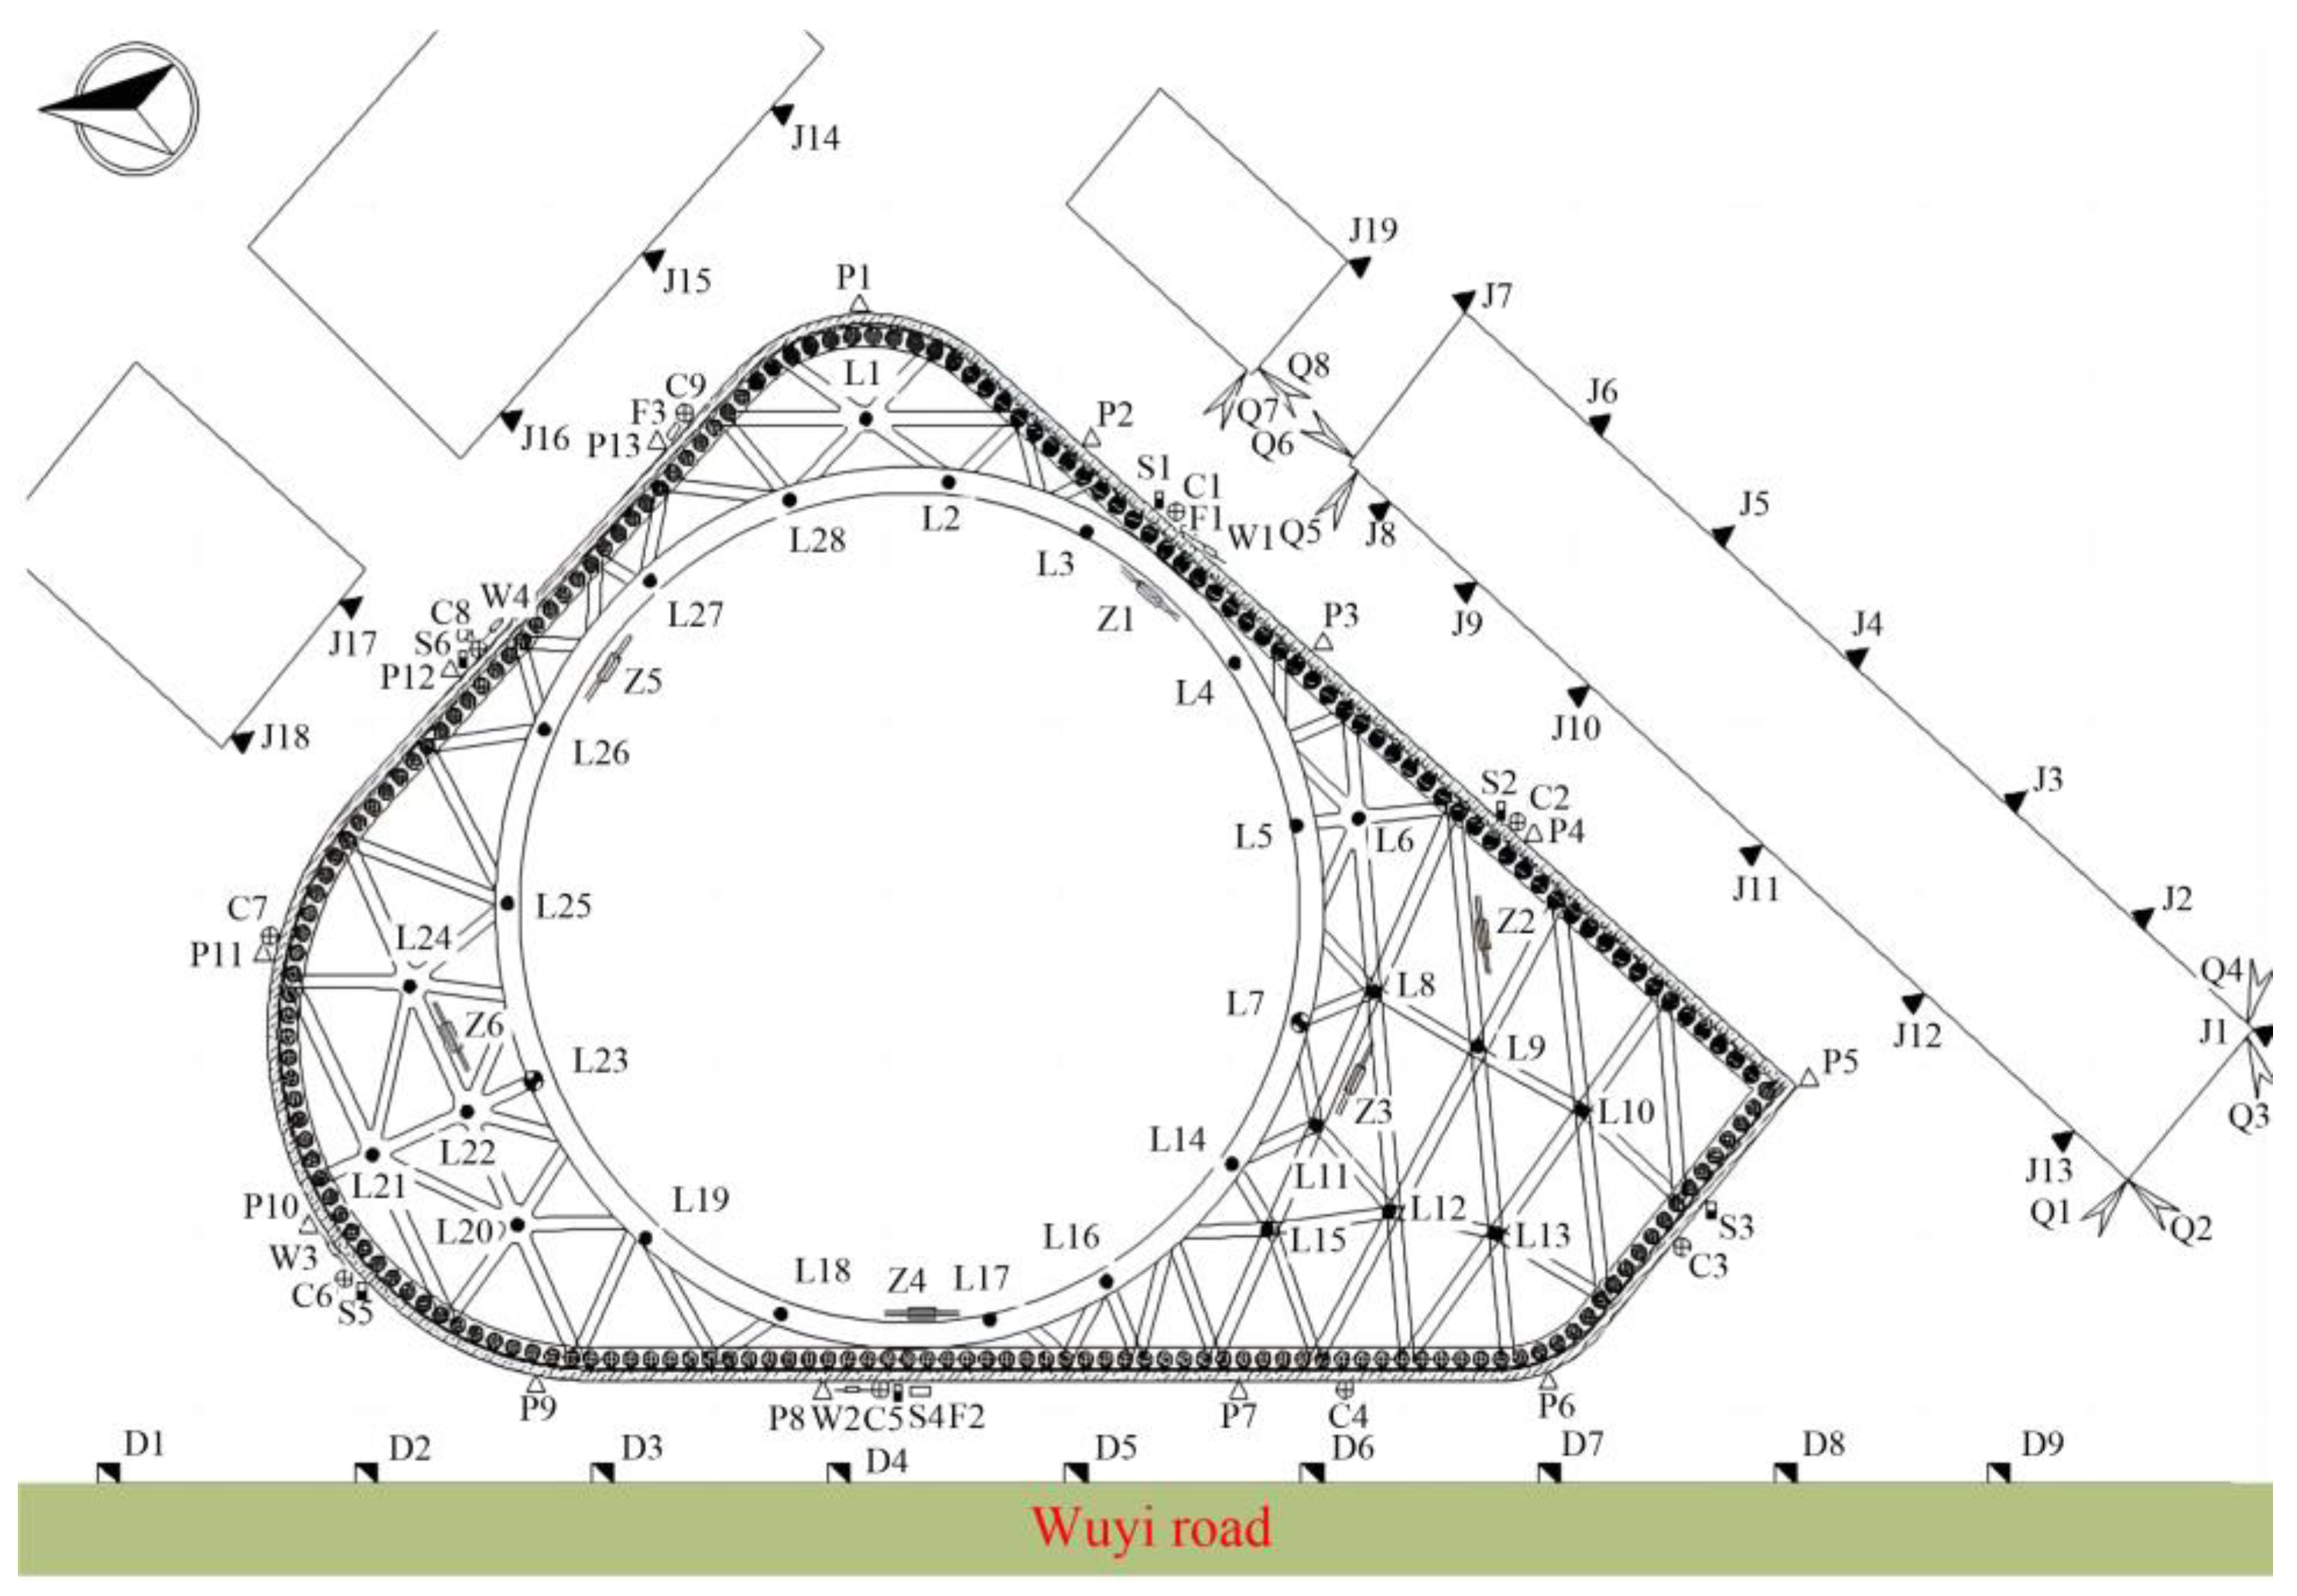
4. Analysis of Site Monitoring Data
4.1. Monitoring of the Deep Horizontal Displacement of the Enclosure Pile
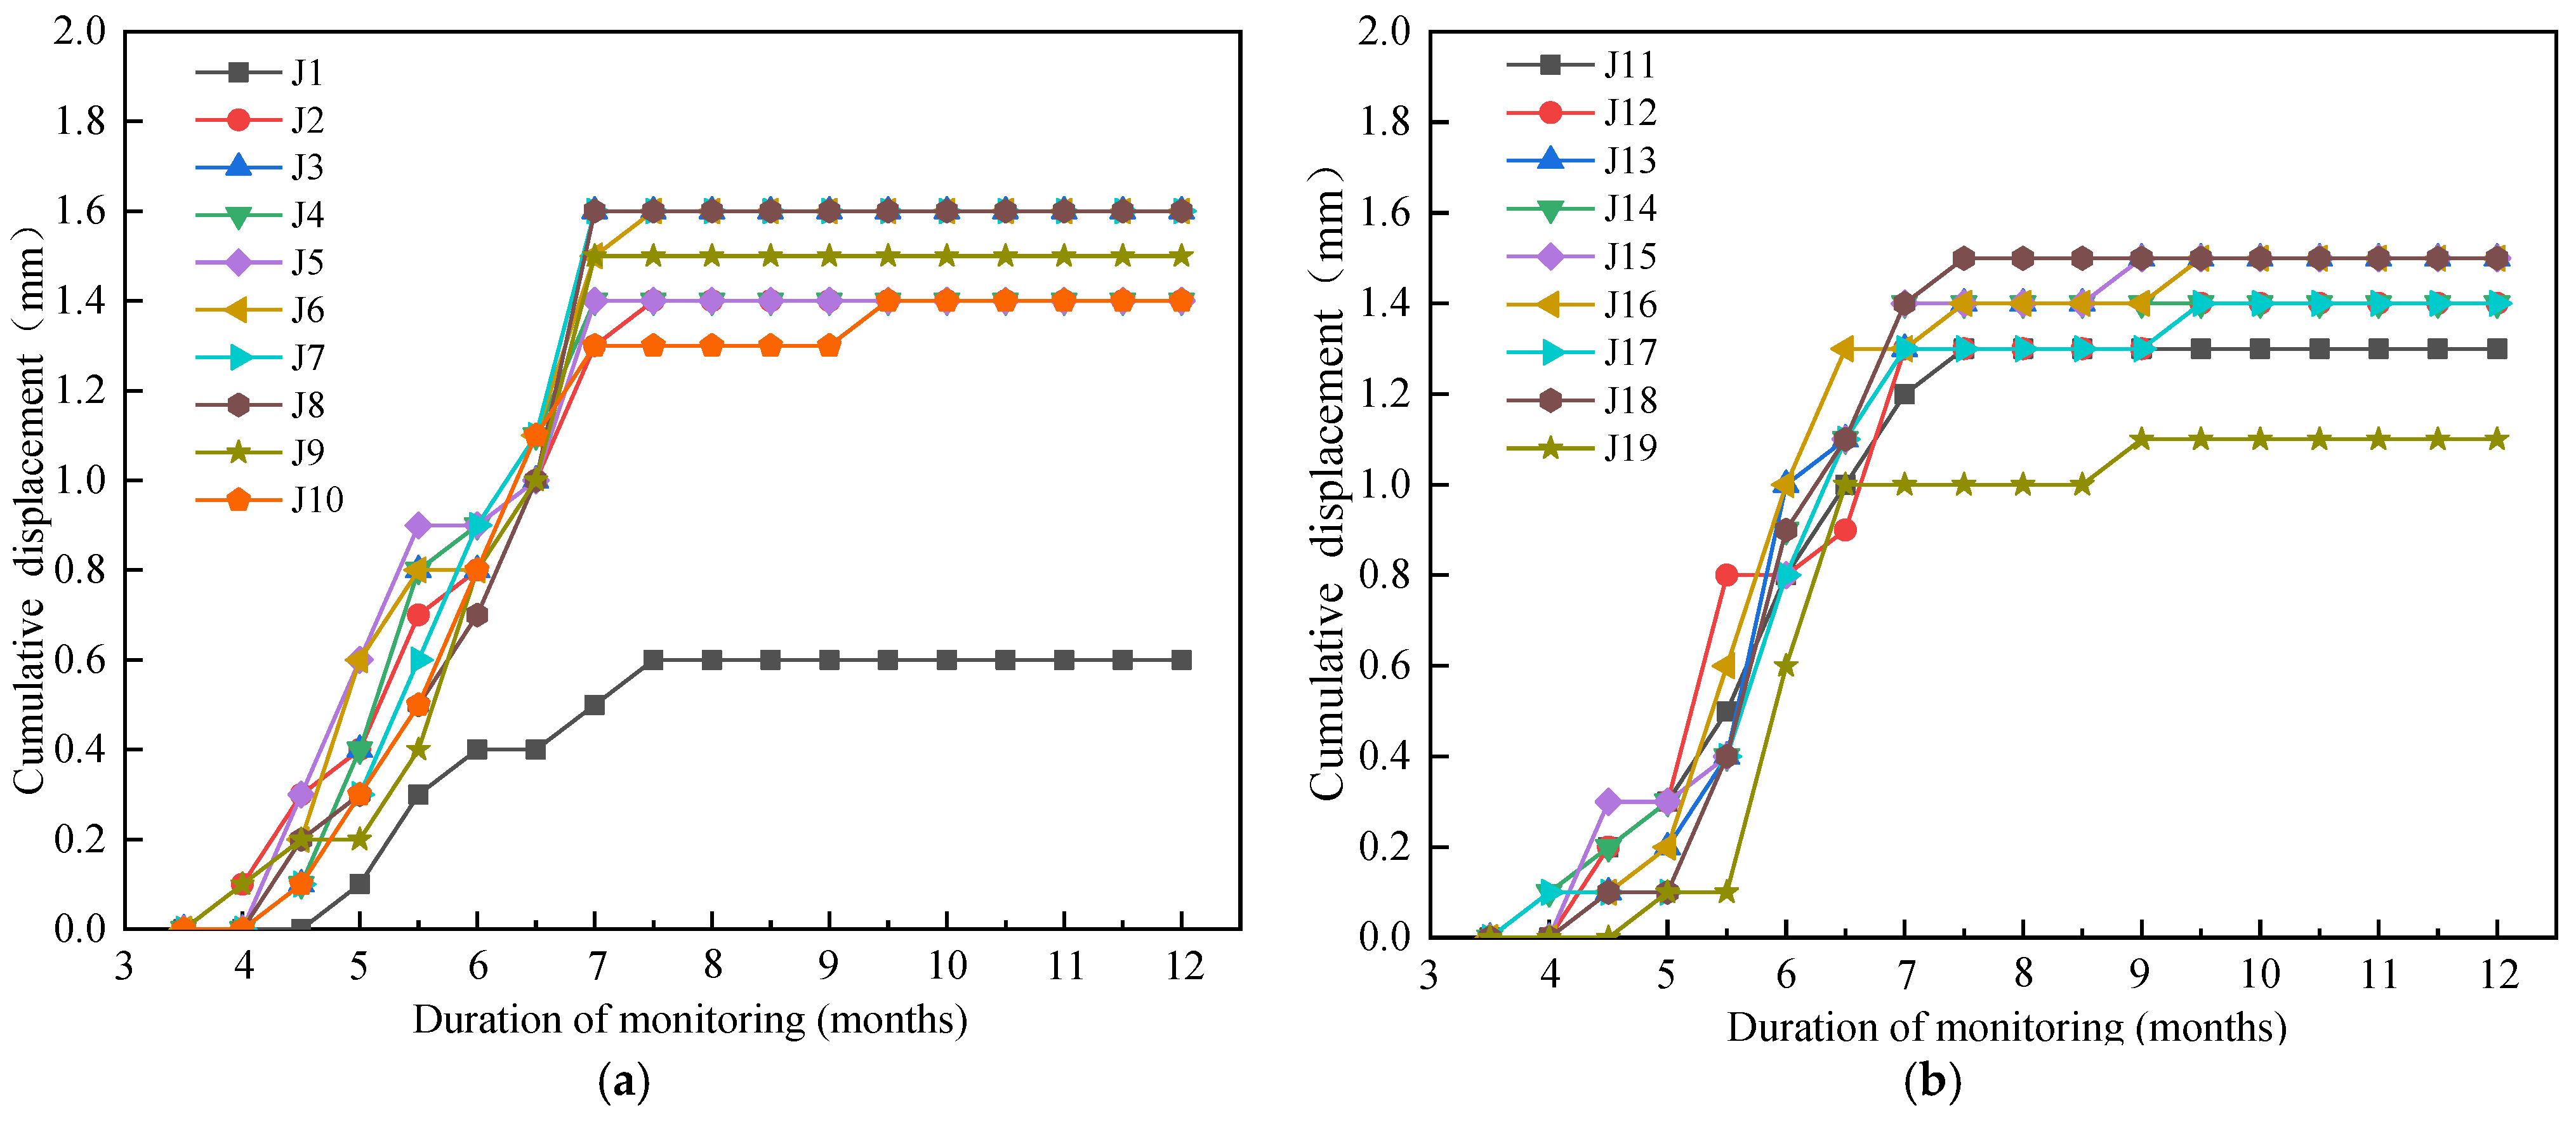
4.2. Monitoring of the Horizontal Displacement at the Top of the Foundation Pit
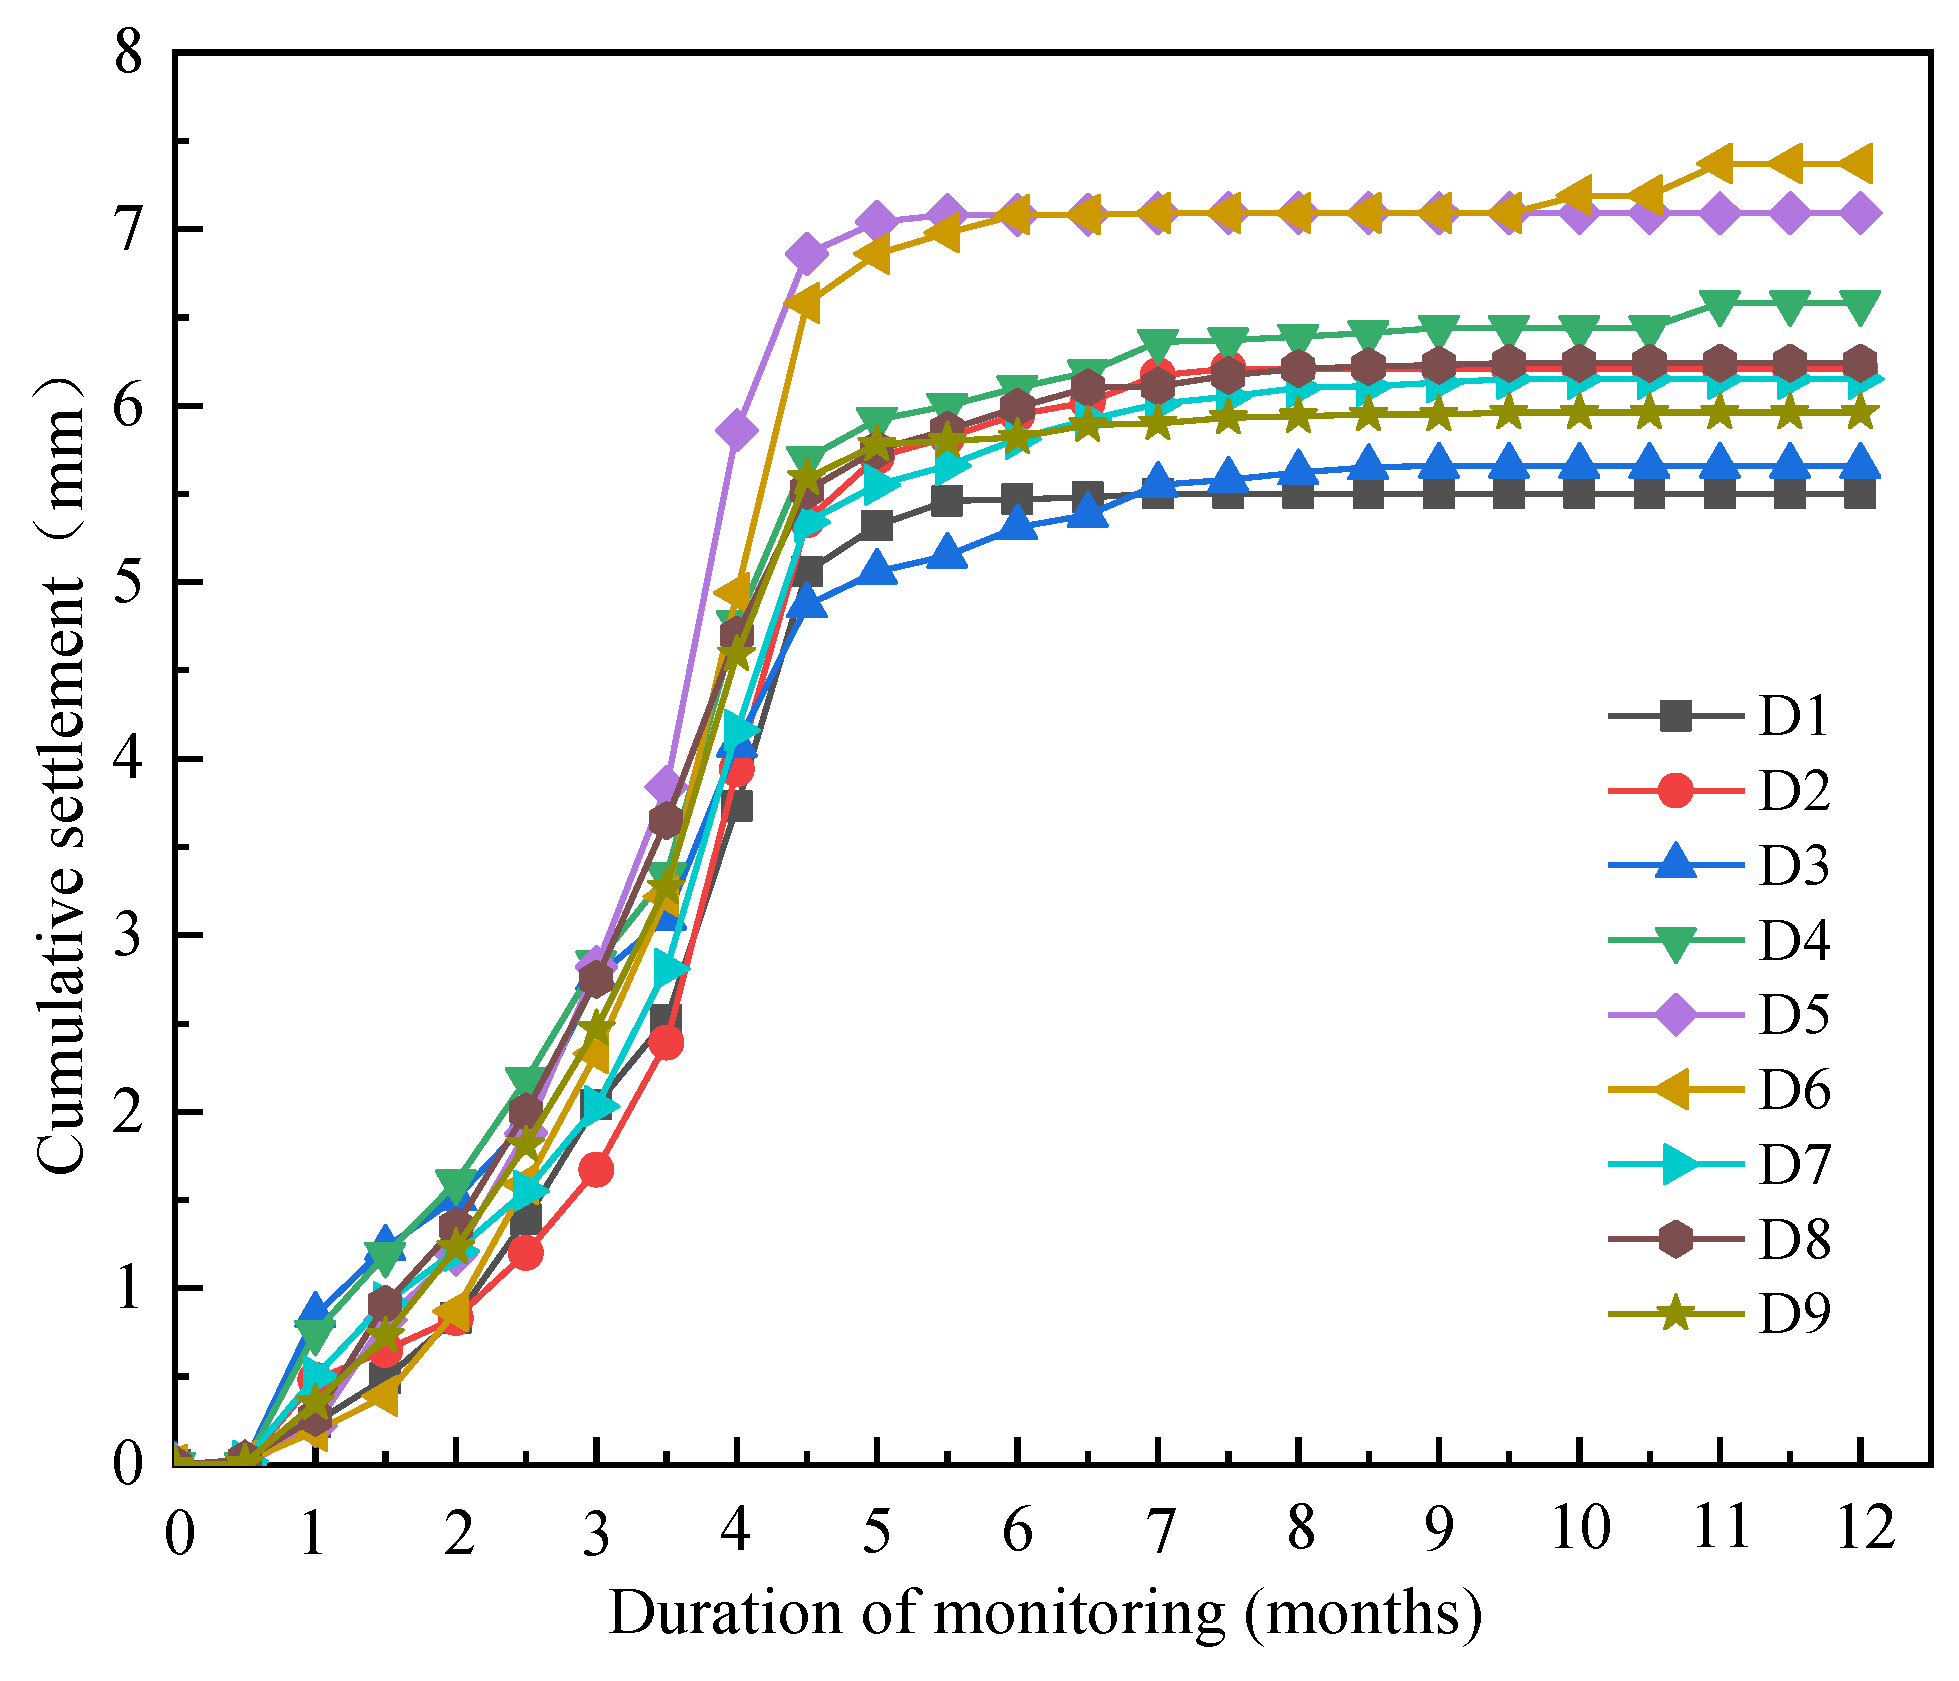
4.3. Monitoring of the Settlement at the Top of the Foundation Pit
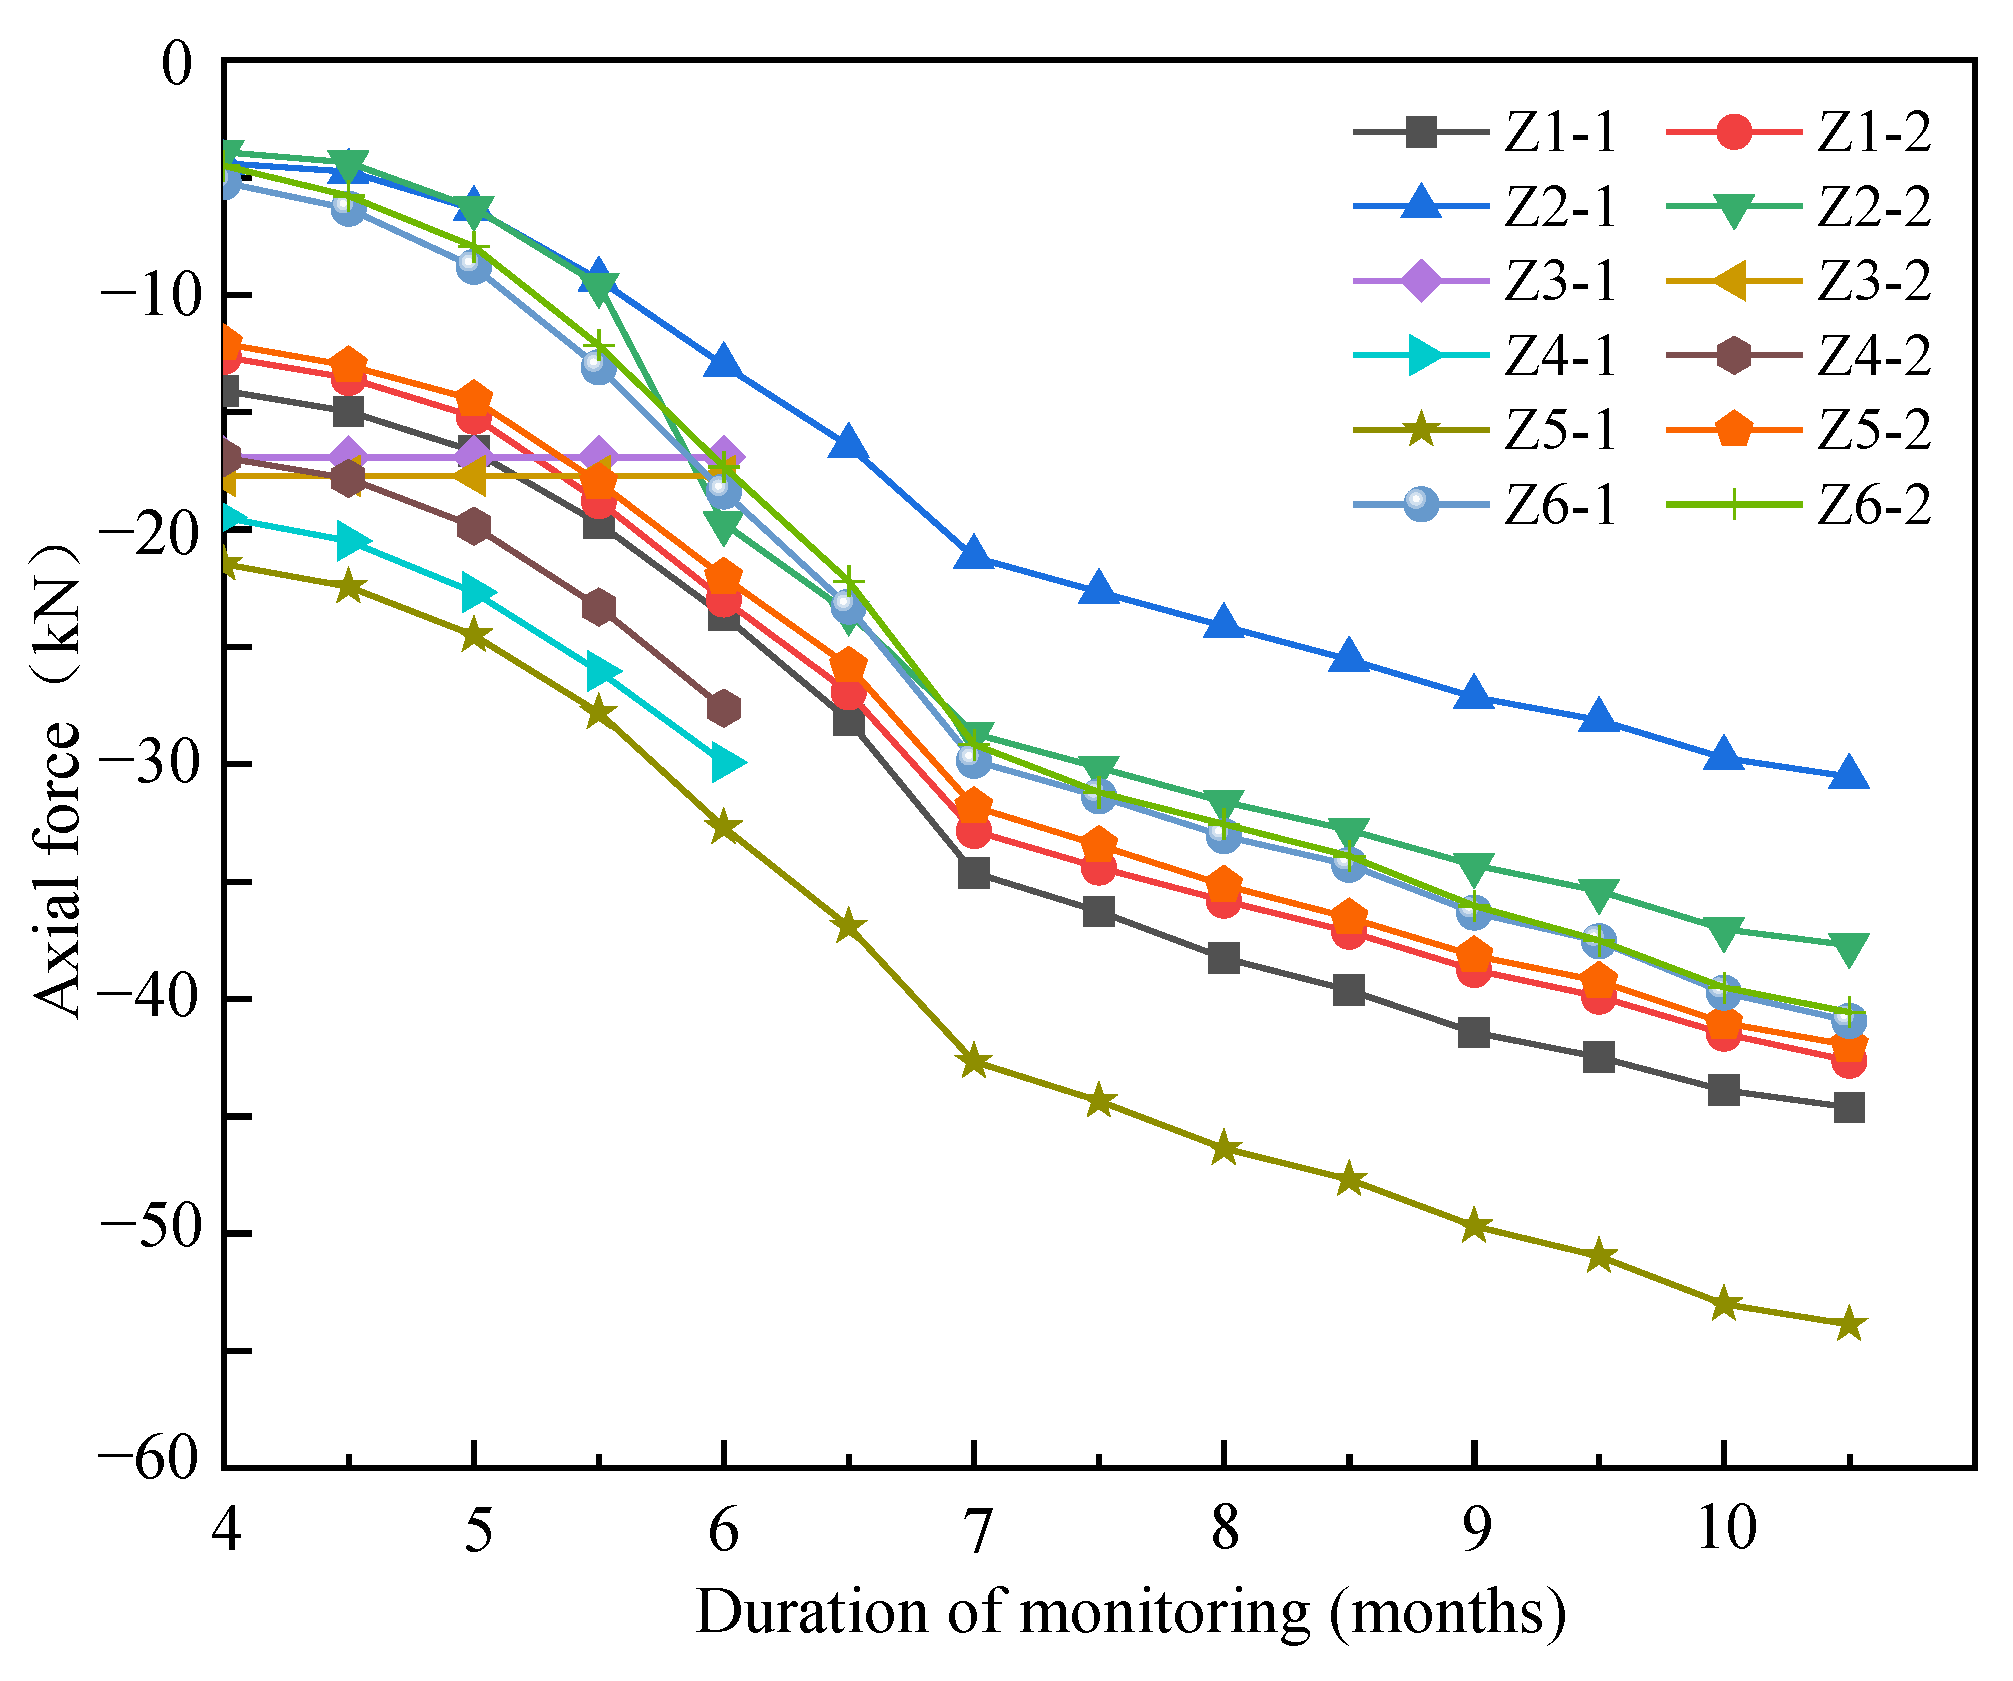
4.4. Monitoring of the Axial Force of the Internal Bracing
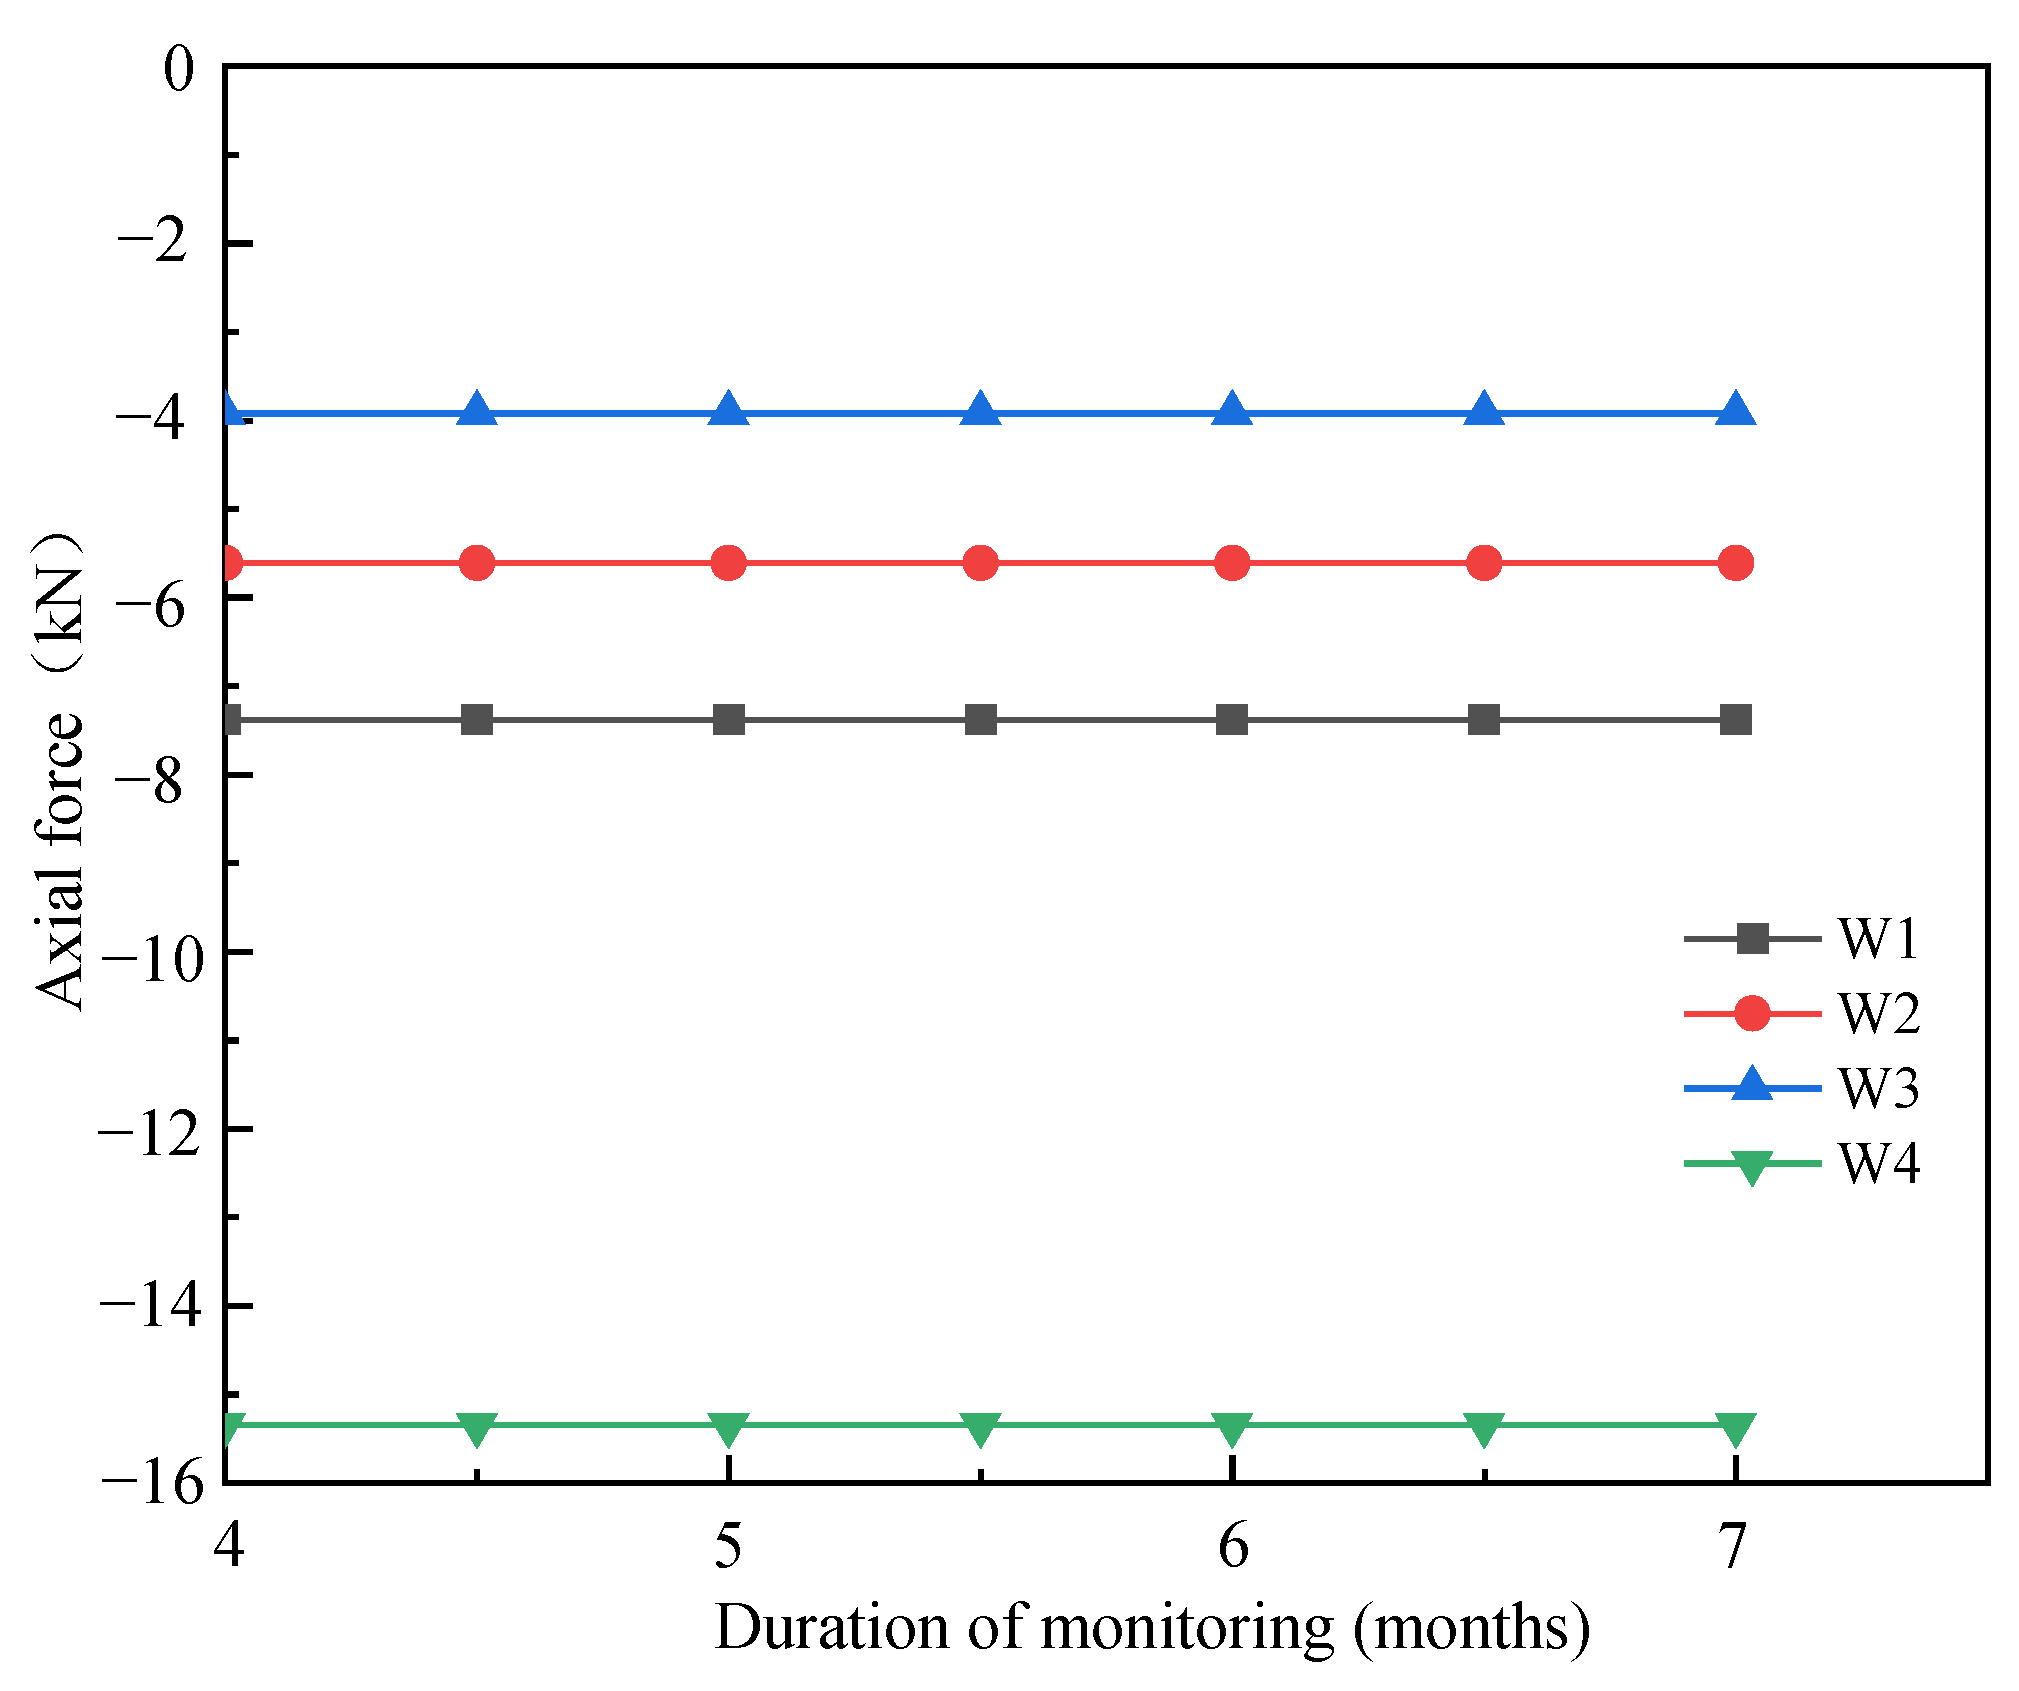
4.5. Monitoring of the Axial Force of the Enclosure Pile
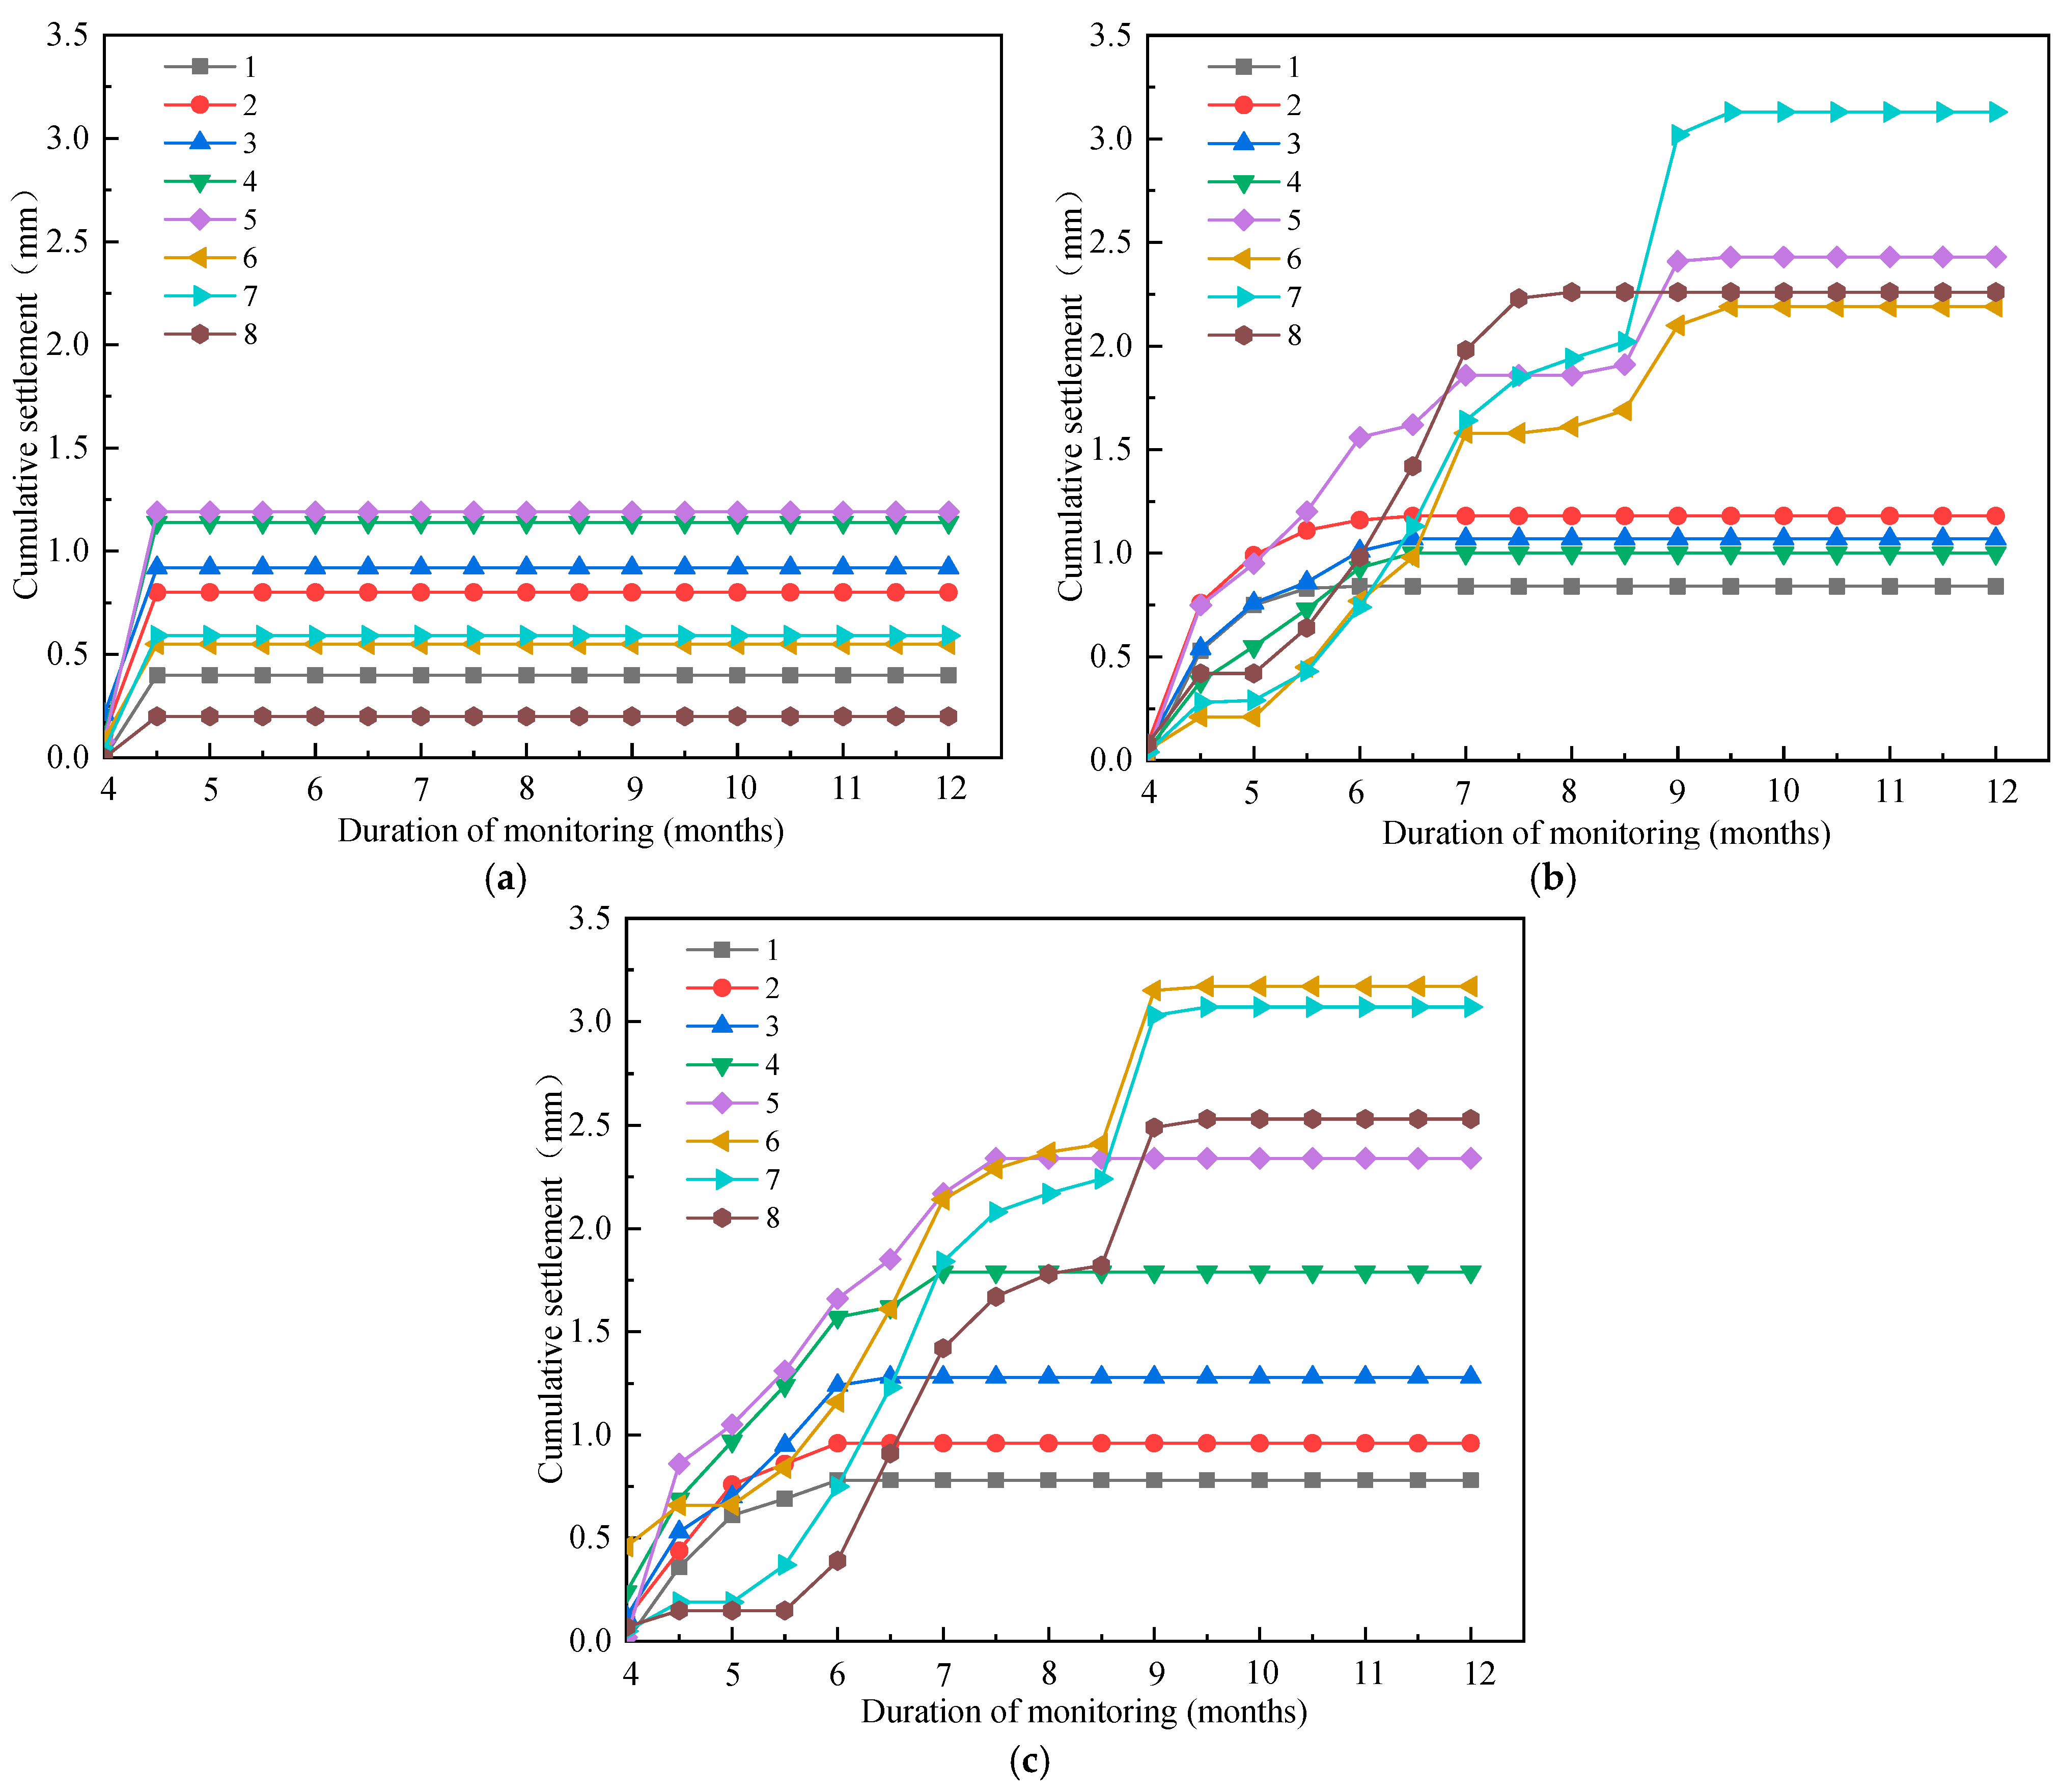
4.6. Monitoring of the Settlement of the Column
4.7. Monitoring of the Groundwater Level
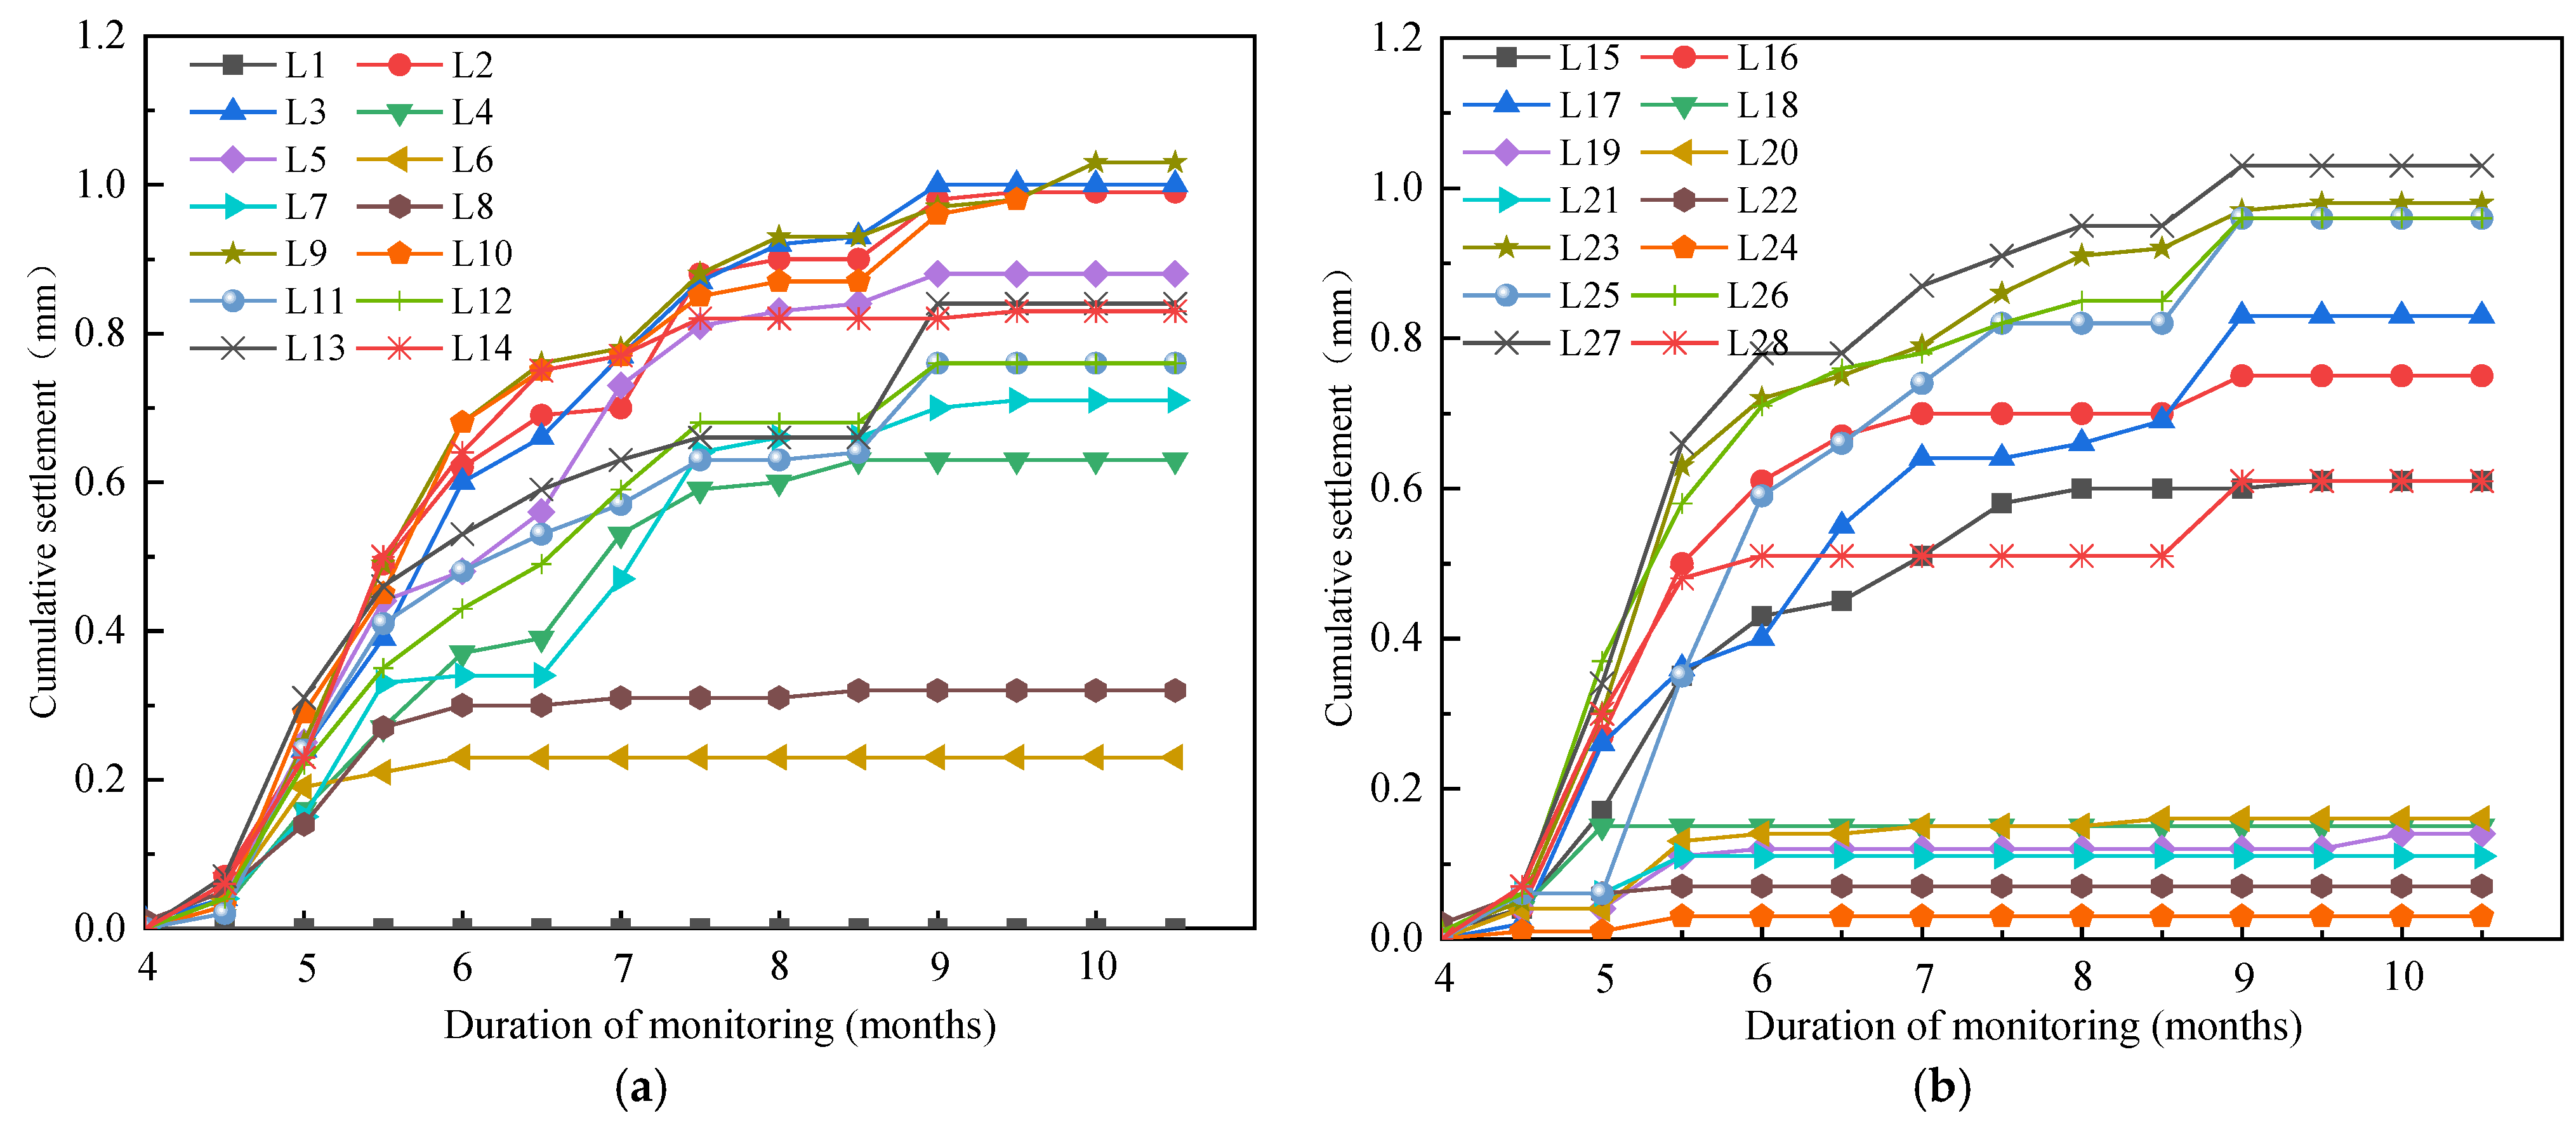
4.8. Monitoring of the Layered Settlement of the Soil
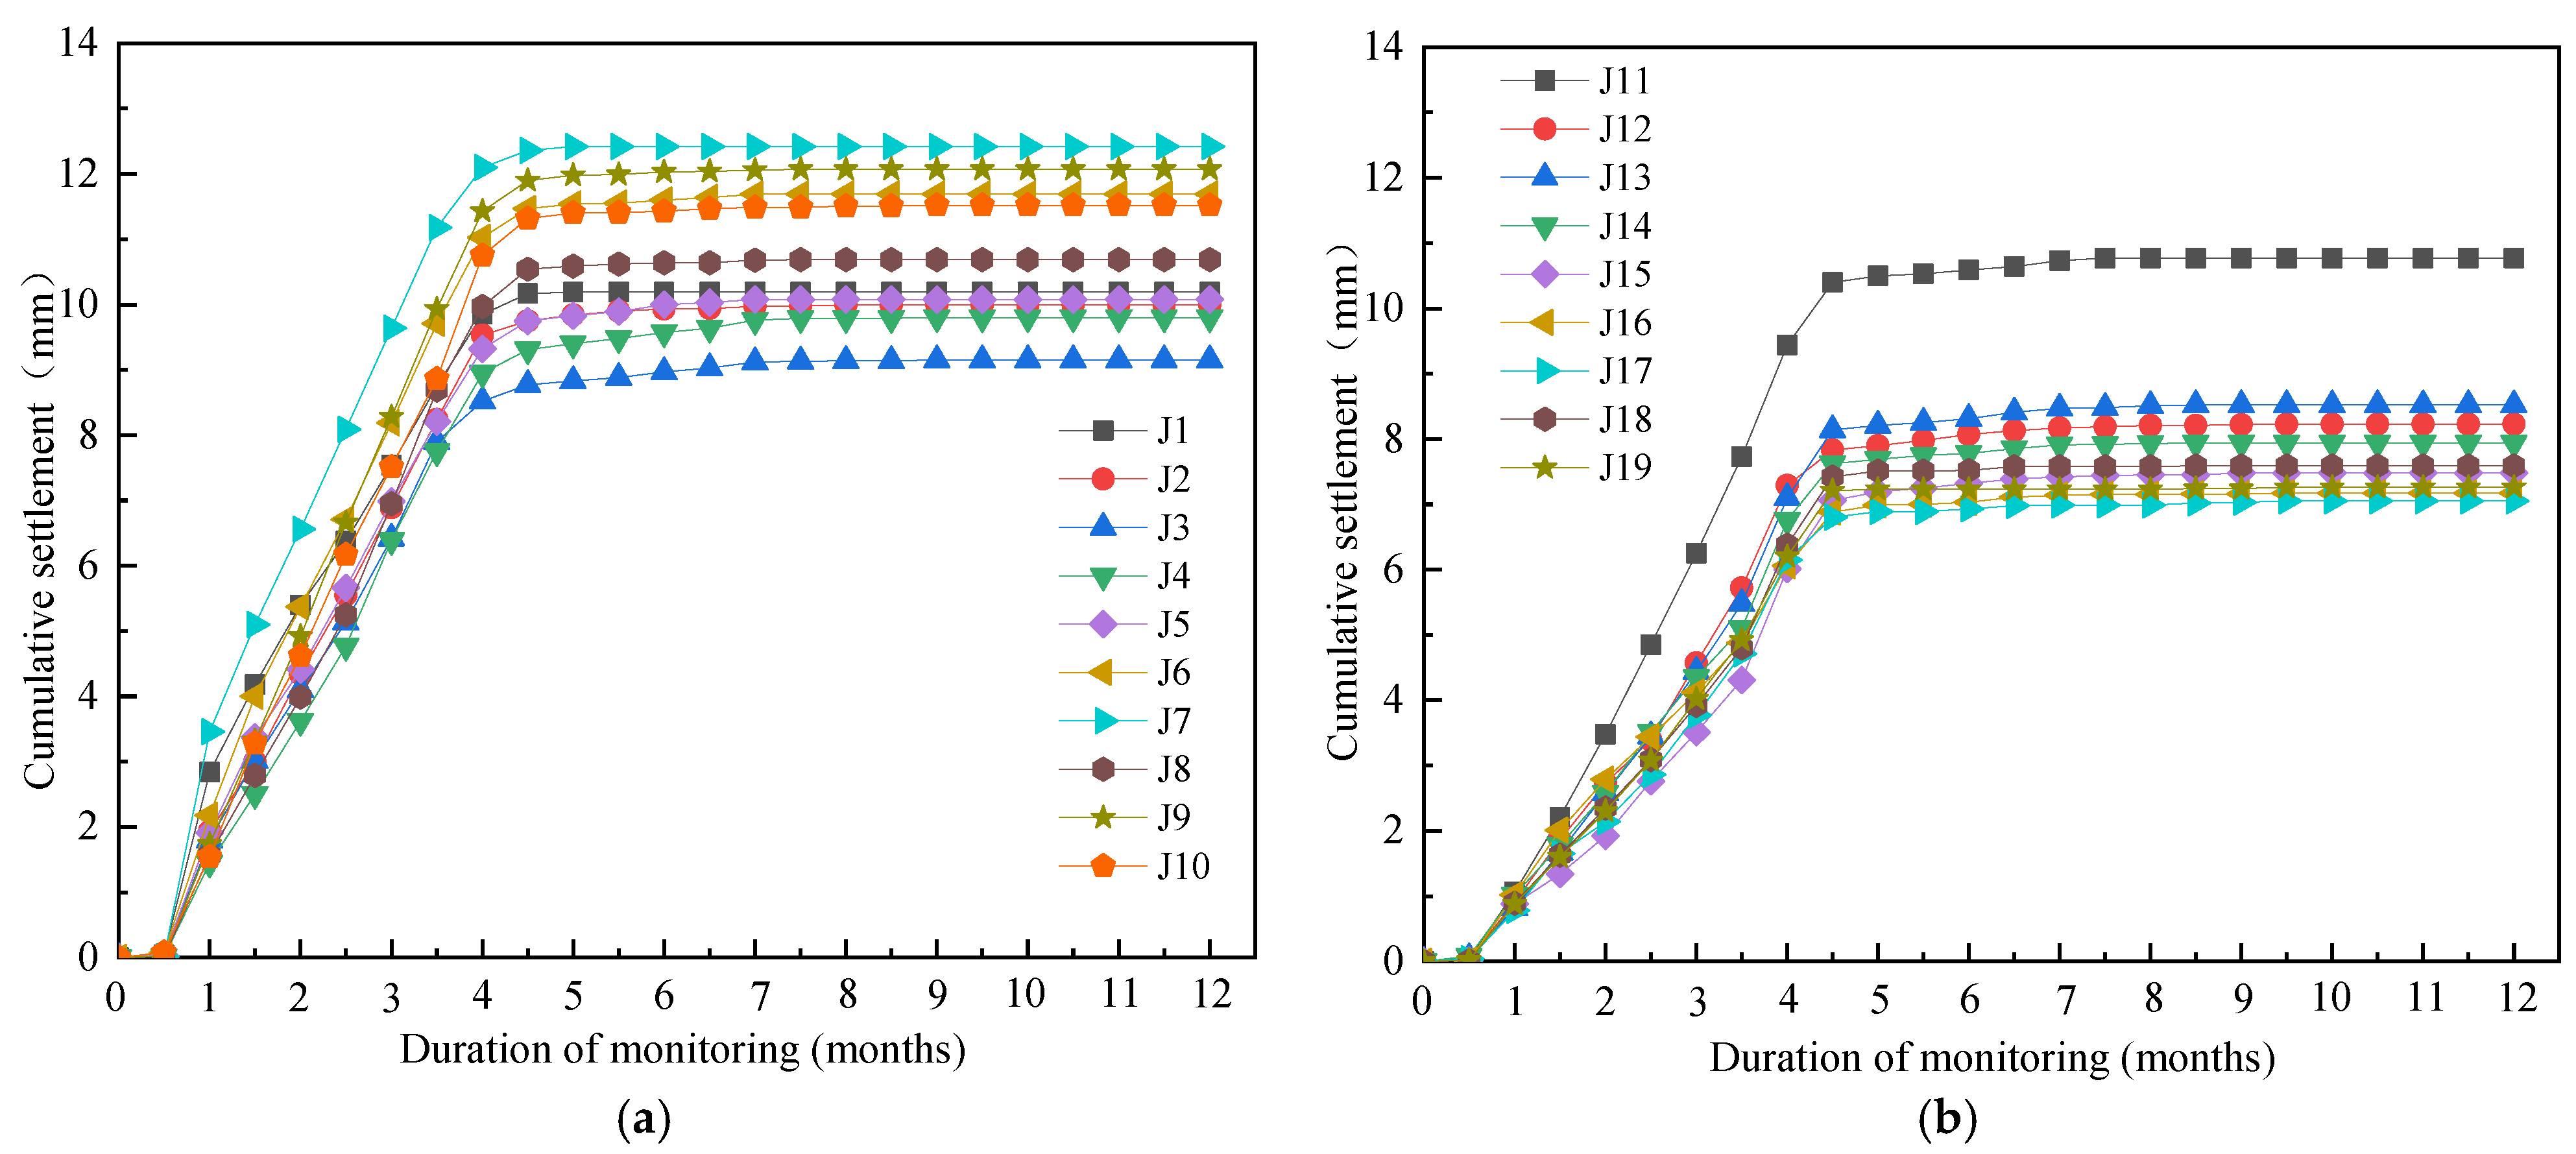
4.9. Monitoring of the Settlement of the Surrounding Buildings
4.10. Monitoring of the Horizontal Displacement of the Surrounding Buildings
4.11. Monitoring of Tilt of the Surrounding Buildings
4.12. Monitoring of Settlement of the Surrounding Surface and Underground Pipelines
5. Conclusions
Author Contributions
Funding
Data Availability Statement
Conflicts of Interest
References
- Rodriguez, J.A. Deep excavations for buildings in the Sabana Formation Bogota. In Proceedings of the 10th International Symposium on Geotechnical Aspects of Underground Construction in Soft Ground (IS-Cambridge), Cambridge, UK, 27–29 June 2022; pp. 145–152. [Google Scholar]
- Fan, N.; Nian, T.K.; Guo, X.S.; Jiao, H.B. Piecewise strength model for three types of ultra-soft fine-grained soils. Soils Found. 2020, 60, 778–790. [Google Scholar] [CrossRef]
- Gotman, A.L.; Gotman, Y.A. Numerical Analysis of the Shorings of Deep Foundation Pits with Regard for the Soil Solid-ification. Soil Mech. Found. Eng. 2019, 56, 225–231. [Google Scholar] [CrossRef]
- Hettler, A.; Becker, P.; Borchert, K.M.; Kinzler, S. Report of the working group for recommendations on excavations: Outlook 6th edition EAB—Underpinnings, excavations in soft soils, head deformations of non-supported walls. Bautechnik 2019, 96, 785–792. [Google Scholar] [CrossRef]
- Jun, S.H.; Kwon, H.J. Constitutive Relationship Proposition of Marine Soft Soil in Korea Using Finite Strain Consolidation Theory. J. Mar. Sci. Eng. 2020, 8, 429. [Google Scholar] [CrossRef]
- Sun, Q.Q.; Dias, D.; Sousa, L.R.E. Soft soil layer-tunnel interaction under seismic loading. Tunn. Undergr. Space Technol. 2020, 98, 103329. [Google Scholar] [CrossRef]
- Qiao, F.; Bo, J.S.; Wang, L.; Chang, C.Y.; Zhang, Z.P.; Qi, W.H. Survey of China’s soft soil and its dynamic characteristics. World Earthq. Eng. 2019, 35, 150–161. [Google Scholar]
- Ye, S.H.; Zhao, Z.F.; Wang, D.Q. Deformation analysis and safety assessment of existing metro tunnels affected by excavation of a foundation pit. Undergr. Space 2021, 6, 421–431. [Google Scholar] [CrossRef]
- Takada, N.; Simono, K.; Oka, F.; Kimoto, S.; Higo, Y.A. Numerical evaluation of the deformation of earth retaining wall reinforced by soil buttress method during the excavation in soft soil. In Proceedings of the Computer Methods and Recent Advances in Geomechanics, Kyoto, Japan, 22–25 September 2014; pp. 1037–1042. [Google Scholar]
- Zheng, G. Method and application of deformation control of excavations in soft ground. Chin. J. Geotech. Eng. 2022, 44, 1–36. [Google Scholar]
- Song, X.G.; Wang, Z.Y.; Bai, W.W.; Wang, Z.; Xie, S.M.; Xia, K.Z. Study on engineering characteristics of large-scale deep soft soil in the central area of western Zhuhai. Chin. J. Rock Mech. Eng. 2019, 38, 1434–1451. [Google Scholar]
- Zhang, Y.C.; Yang, G.H.; Hu, H.Y.; Chen, F.Q.; Huang, Z.X.; Chen, W.C. Some problems about retaining structures for shallow pits in deep and soft soil areas of Pearl River Delta. Chin. J. Geotech. Eng. 2014, 36, 1–11. [Google Scholar]
- Ye, S.H.; Zhou, J. Study on stress and deformation of shield tunnel plate under unloading of foundation pit excavation. Arab. J. Geosci. 2021, 14, 2490. [Google Scholar] [CrossRef]
- Yuan, C.F.; Hu, Z.H.; Zhu, Z.; Yuan, Z.J.; Fan, Y.X.; Guan, H.; Li, L. Numerical Simulation of Seepage and Deformation in Excavation of a Deep Foundation Pit under Water-Rich Fractured Intrusive Rock. Geofluids 2021, 2021, 6628882. [Google Scholar] [CrossRef]
- Harahap, S.E.; Ou, C.Y. Finite element analysis of time-dependent behavior in deep excavations. Comput. Geotech. 2020, 119, 103300. [Google Scholar] [CrossRef]
- Bal, A.R.L.; Dang, T.S.; Meschke, G. A 3D particle finite element model for the simulation of soft soil excavation using hypoplasticity. Comput. Part. Mech. 2020, 7, 151–172. [Google Scholar] [CrossRef]
- Uribe-Henao, A.F.; Arboleda-Monsalve, L.G.; Mackie, K. Soil-Structure Interaction on Excavation-Induced Response of Mo-ment-Resisting Frame Buildings. In Proceedings of the 2nd Geo Congress—Deep Foundations, Earth Retention, and Under-ground Construction, Charlotte, NC, USA, 20–23 March 2022; pp. 341–350. [Google Scholar]
- Sun, F.X.; Liu, M.Q.; Zhu, Y.H.; Li, X.C.; Ge, G. Research on Numerical Simulation of Top-Down Construction Effect of Diaphragm Wall of Deep and Large under Different Working Conditions in Complex Stratum. Adv. Civ. Eng. 2022, 2022, 2576122. [Google Scholar] [CrossRef]
- Wu, J.; Ye, S.H.; Wang, Z.Q.; Yang, D. Application and automatic monitoring and analysis of hybrid support structure in ultra-deep foundation pit engineering in the Lanzhou area under complex environmental conditions. Water 2023, 15, 1335. [Google Scholar] [CrossRef]
- Dmochowski, G.; Szolomicki, J. Technical and Structural Problems Related to the Interaction between a Deep Excavation and Adjacent Existing Buildings. Appl. Sci. 2021, 11, 481. [Google Scholar] [CrossRef]
- Chen, S.R.; Cui, J.F.; Liang, F.Y. Case Study on the Deformation Coupling Effect of a Deep Foundation Pit Group in a Coastal Soft Soil Area. Appl. Sci. 2022, 12, 6205. [Google Scholar] [CrossRef]
- Rybak, J.; Ivannikov, A.; Kulikova, E.; Zyrek, T. Deep excavation in urban areas—Defects of surrounding buildings at various stages of construction. In Proceedings of the 9th International Scientific Conference on Building Defects (Building Defects 2017), Ceske Budejovice, Czech Republic, 23–24 November 2017; p. 02012. [Google Scholar]
- Yang, T.; Liu, S.L.; Wang, X.Y.; Zhao, H.; Liu, Y.; Li, Y.W. Analysis of the Deformation Law of Deep and Large Foundation Pits in Soft Soil Areas. Front. Earth Sci. 2022, 10, 828354. [Google Scholar] [CrossRef]
- Sun, L.; Mao, K.; Wang, Z.Z.; Ye, S.H.; Su, T.T.; Dai, G.L.; Xu, G.X.; Sun, J.L. Design and Field Monitoring of a Pile-Anchor-Brace Supporting System in a Soft Soil Area. Water 2022, 14, 3949. [Google Scholar] [CrossRef]
- Chen, J.S.; Lin, C.; Liu, S.Z.; Mo, H.H. Study on Supporting Structure Performance of Deep Soft Soil Foundation Pit near Sea under Waves, Tides, Vibration, and Unbalanced Loads. Adv. Civ. Eng. 2020, 2020, 8830199. [Google Scholar] [CrossRef]
- Czajewska, M.M. A study of displacements of structures in the vicinity of deep excavation. Arch. Civ. Mech. Eng. 2019, 19, 547–556. [Google Scholar] [CrossRef]
- Feng, Z.Y.; Xu, Q.; Xu, X.Y.; Tang, Q.; Li, X.D.; Liao, X. Deformation Characteristics of Soil Layers and Diaphragm Walls during Deep Foundation Pit Excavation: Simulation Verification and Parameter Analysis. Symmetry 2022, 14, 254. [Google Scholar] [CrossRef]
- Panchal, J.P.; McNamara, A.M.; Stallebrass, S.E. A new approach to modelling excavations in soft soils. In Proceedings of the 9th International Conference on Physical Modelling in Geotechnics (ICPMG), London, UK, 17–20 July 2018; pp. 1445–1450. [Google Scholar]
- Kiet, H.N.; Phien-wej, N. Advanced soil parameters determination for Ho Chi Minh city soft clay to predict ground movements in deep excavations and tunneling. In Proceedings of the 4th International Conference on Geotechnics for Sustainable Infrastructure Development (GEOTEC HANOI), Hanoi, Vietnam, 28–29 November 2019; pp. 497–504. [Google Scholar]
- Nguyen, B.P.; Ngo, C.P.; Tran, T.D.; Bui, X.C.; Doan, N.P. Finite Element Analysis of Deformation Behavior of Deep Excavation Retained by Diagram Wall in Ho Chi Minh City. Indian Geotech. J. 2022, 52, 989–999. [Google Scholar] [CrossRef]


| Soil Layer | Name of Soil Layer | Status | Thickness (m) | Natural Heavy γ/(kN/m3) | Cohesion c/(kPa) | Internal Friction Angle φ/(°) |
|---|---|---|---|---|---|---|
| 1-1 | Miscellaneous fill | Slightly denser | 1.50 to 8.30 | 18.0 | 8.0 | 14.0 |
| 1-2 | Mucky fill | Flow plastic | 1.20 to 5.30 | 17.0 | 10.5 | 11.0 |
| 2 | Silt sand mixed with muck | Slightly denser to medium density | 3.90 to 11.0 | 18.0 | 3.0 | 21.0 |
| 3 | Muck mixed with sand | Flow plastic | 1.60 to 8.20 | 16.2 | 8.9 | 10.5 |
| 4 | Silt sand mixed with muck | Medium density | 2.70 to 11.3 | 18.2 | 5.0 | 23.0 |
| 5 | Muck mixed with sand | Flow plastic | 1.80 to 9.0 | 16.6 | 11.0 | 11.0 |
| 6 | Silt sand mixed with muck | Medium density to dense | 5.90 to 9.85 | 18.4 | 5.0 | 26.0 |
| 7 | Mucky soil mixed with sand | Flow plastic | 1.52 to 3.87 | 16.9 | 12.0 | 13.0 |
| 8 | Silty sand | Medium density to dense | 2.60 to 10.0 | 18.6 | 3.0 | 30.0 |
| 9 | Silty sand | dense | 0.50 to 9.80 | 18.7 | 3.0 | 33.0 |
| 10 | Pebble | Medium density | 4.29 to 5.80 | 21.0 | 0 | 38.0 |
| Time (Months) | Construction Stage |
|---|---|
| 0–2.5 | Cast-in-place pile construction |
| 2.5–3 | The first internal bracing construction |
| 3–4 | Earthwork excavation |
| 4–4.5 | The second internal bracing construction |
| 4.5–5 | Earthwork excavation |
| 5–5.5 | The third internal bracing construction |
| 5.5–6 | Earthwork excavation |
| 6–6.5 | Platform construction |
| 6.5–7 | Bottom plate construction |
| 7–12 | Shear wall construction |
| Monitoring Content | Monitoring Methods | Instrument Name | Number of Monitoring Points |
|---|---|---|---|
| Deep horizontal displacement of enclosure pile | Level survey (2nd class) | Su Yiguang DSZ2 automatic leveling level and FS1 micrometer | 9 |
| Horizontal displacement at the top of the foundation pit | Small angle method (Theodolite) | Su Yiguang DT302L electronic theodolite | 13 |
| Settlement at the top of the foundation pit | Inclinometer | American SINCO digital sliding inclinometer | 13 |
| The axial force of internal bracing | Rebar stress gauges | Jinyuan civil engineering CTY-202 frequency meter | 6 |
| The axial force of the enclosure pile | Rebar stress gauges | Jinyuan civil engineering CTY-202 frequency meter | 4 |
| Settlement of the column | Level survey (2nd class) | Su Yiguang DSZ2 automatic leveling level and FS1 micrometer | 28 |
| Groundwater level | Water level meter | Jinyuan civil engineering SJ-92 water level gauge | 6 |
| Layered settlement of soil | Level survey (2nd class) | Su Yiguang DSZ2 automatic leveling level and FS1 micrometer | 3 |
| Settlement of surrounding buildings | Small angle method (Theodolite) | Su Yiguang DT302L electronic theodolite | 19 |
| Horizontal displacement of surrounding buildings | Point Casting Method (Theodolite) | Su Yiguang DT302L electronic theodolite | 19 |
| The tilt of surrounding buildings | Level survey (2nd class) | Su Yiguang DSZ2 automatic leveling level and FS1 micrometer | 8 |
| Settlement of surrounding surface and underground pipelines | Level survey (2nd class) and Stratified sedimentation meter | Su Yiguang DSZ2 automatic leveling level, FS1 micrometer, and Wuhan foundation deep stratified sedimentation meter | 9 |
| Monitoring Point | C1 | C2 | C3 | C4 | C5 | C6 | C7 | C8 | C9 |
|---|---|---|---|---|---|---|---|---|---|
| Maximum horizontal displacement (mm) | 13.36 | 6.78 | 40.96 | 41.40 | 37.70 | 44.22 | 46.52 | 52.60 | 36.22 |
Disclaimer/Publisher’s Note: The statements, opinions and data contained in all publications are solely those of the individual author(s) and contributor(s) and not of MDPI and/or the editor(s). MDPI and/or the editor(s) disclaim responsibility for any injury to people or property resulting from any ideas, methods, instructions or products referred to in the content. |
© 2023 by the authors. Licensee MDPI, Basel, Switzerland. This article is an open access article distributed under the terms and conditions of the Creative Commons Attribution (CC BY) license (https://creativecommons.org/licenses/by/4.0/).
Share and Cite
Tu, B.; Zheng, J.; Shen, M.; Ni, W. Monitoring Analysis of a Deep Foundation Pit with Water Supported by Cast-in-Place Pile and Internal Bracing in a Soft Soil Area of Fuzhou. Water 2023, 15, 3008. https://doi.org/10.3390/w15163008
Tu B, Zheng J, Shen M, Ni W. Monitoring Analysis of a Deep Foundation Pit with Water Supported by Cast-in-Place Pile and Internal Bracing in a Soft Soil Area of Fuzhou. Water. 2023; 15(16):3008. https://doi.org/10.3390/w15163008
Chicago/Turabian StyleTu, Bingxiong, Jinhuo Zheng, Minglong Shen, and Weilong Ni. 2023. "Monitoring Analysis of a Deep Foundation Pit with Water Supported by Cast-in-Place Pile and Internal Bracing in a Soft Soil Area of Fuzhou" Water 15, no. 16: 3008. https://doi.org/10.3390/w15163008
APA StyleTu, B., Zheng, J., Shen, M., & Ni, W. (2023). Monitoring Analysis of a Deep Foundation Pit with Water Supported by Cast-in-Place Pile and Internal Bracing in a Soft Soil Area of Fuzhou. Water, 15(16), 3008. https://doi.org/10.3390/w15163008