1. Introduction
Aquifer diffusivity is a basic physical parameter used in hydrogeological calculations [
1,
2] and is important for the evaluation and rational utilization of water resources, pollution prevention, and wetland protection. In analogy to confined aquifers, the diffusivity of an unconfined aquifer is theoretically equal to the ratio of the product of the saturated aquifer thickness and the hydraulic conductivity to the specific yield [
3,
4,
5,
6,
7].
Aquifer tests are a conventional method used to determine aquifer diffusivity [
2,
3,
8]. By analyzing groundwater hydraulic head variations stressed by pumping, aquifer tests can produce hydraulic conductivity and a specific yield according to specific analytical solutions and subsequently calculate the diffusivity of an unconfined aquifer [
3,
9]. Numerical model inversion is another method commonly used to evaluate unconfined aquifer diffusivity [
10]. By establishing a finite-difference or finite-element numerical model, this method generally uses the least squares of the difference between the observed and simulated hydraulic head as the objective function. By searching for the best-fit parameters, the objective function is optimized so as to realize the inversion of the aquifer diffusivity. Moreover, previous studies have provided analytical solutions for the response of the hydraulic head within an unconfined aquifer, which could provide a prediction of the hydraulic head for any given time and location [
1]. These analytical solutions have been adopted to estimate aquifer diffusivity and are widely used in various field investigation practices.
Amplitude and phase are two key physical variables that influence the signal characteristics [
11]. The variation in the amplitude of the components with frequency or period is referred to as the amplitude spectrum. The phase spectrum refers to the phase variation with frequency or period. When applying signal analysis to the hydraulic head of the groundwater system, phase can be understood as a measure of the change in hydraulic head observed at different locations over time, i.e., the delay in the groundwater movement [
4,
12,
13]. Therefore, the phase spectrum shows the hydraulic characteristics in terms of frequency or period and is of great importance for estimating aquifer parameters.
Power spectrum methods have been widely proposed in the literature [
5,
6,
7]. By calculating the power spectrum of a river stage and the hydraulic head at different distances perpendicular to the riverbed over a frequency or period, it can successfully estimate the hydrogeological parameters of riverbed sediments and aquifers. Using the power spectrum method, it is plausible to derive the analytical solution of the phase spectrum of an unconfined aquifer system and estimate the aquifer diffusivity.
In this study, with the assumptions of aquifer isotropy, i.e., no vertical flow and constant saturated aquifer thickness, a 1D analytical solution of the phase spectrum for an unconfined aquifer system was derived. The aquifer diffusivity was estimated by using the phase spectrum within significant periods. To test the efficacy, a groundwater monitoring profile of the Hutuo River in North China was introduced as the field case study. The estimated aquifer diffusivity was compared to the results by using a power spectral analysis, transient pumping tests, and inverse numerical models. The results of this study can provide key hydraulic parameters for surface water–groundwater interactions, rational water resource development and utilization, and protection of the ecological environment in river–aquifer systems.
2. Mathematical Development
2.1. Governing Equation
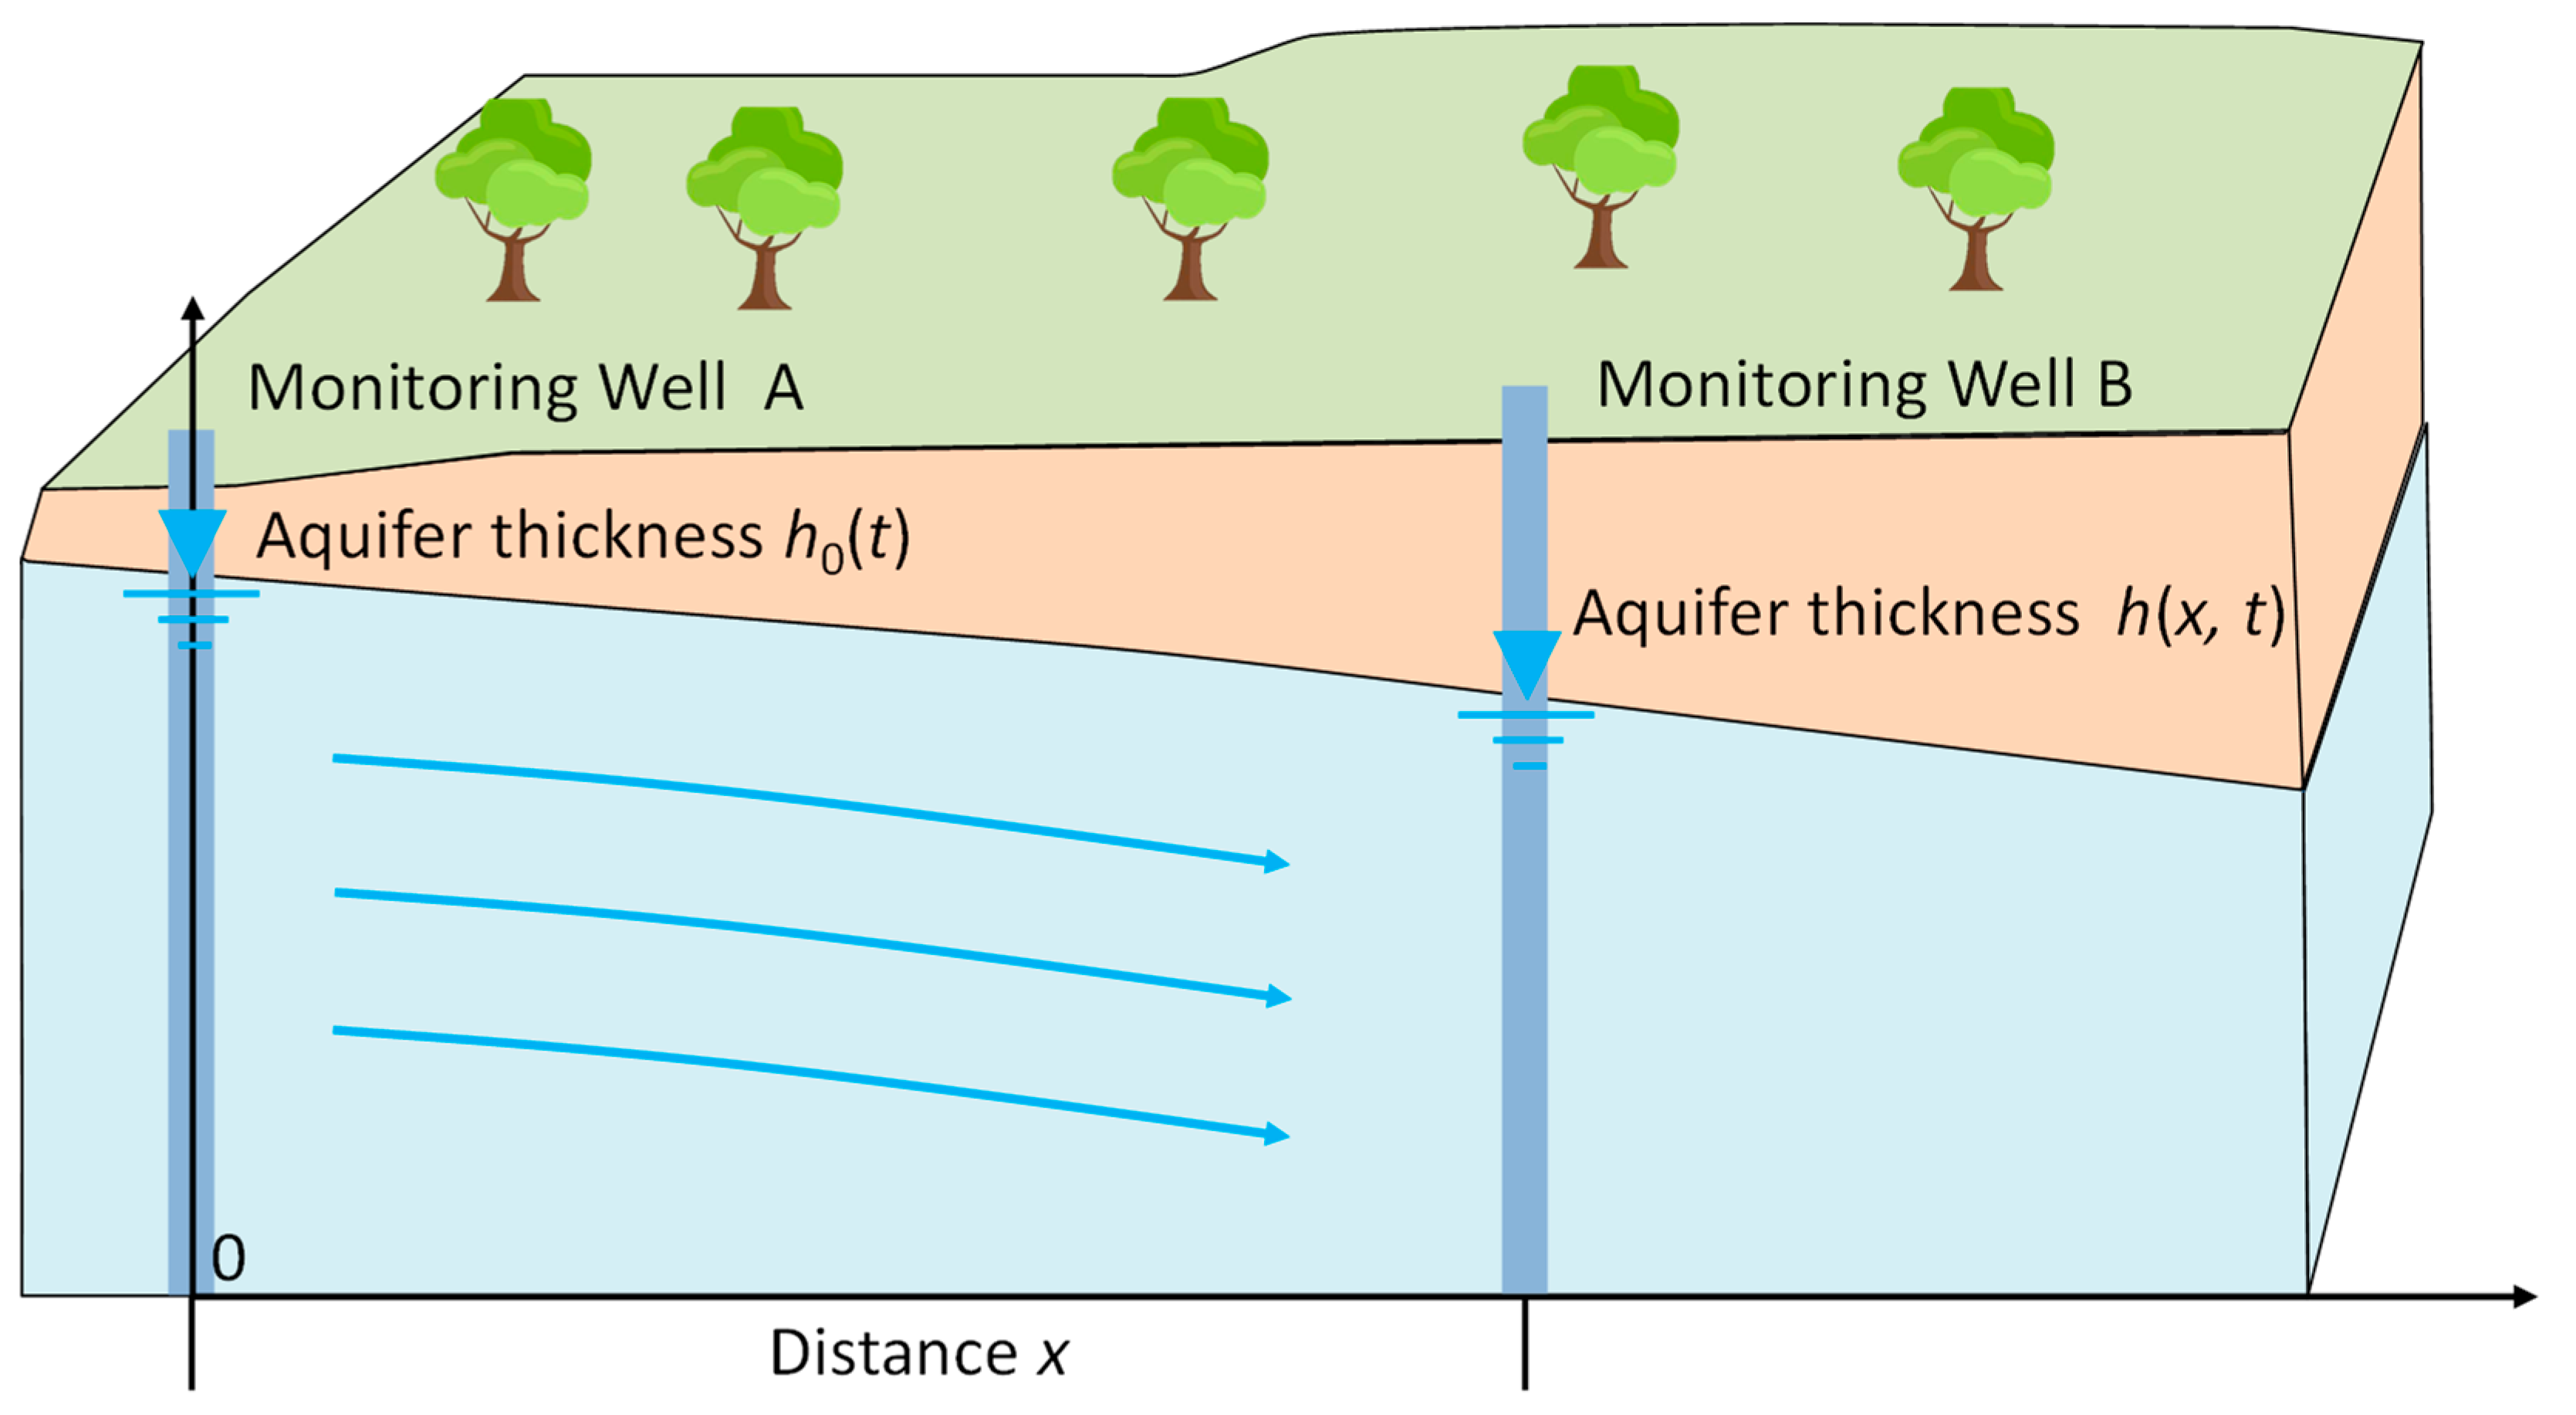
As shown in
Figure 1, in an homogeneous unconfined aquifer with the assumptions of aquifer isotropy, i.e., no vertical flow, constant saturated aquifer thickness, and a unit transversal length, the governing equation of 1D groundwater movement can be expressed as follows [
1]:
where
x is distance [L],
t is time [T],
K is the hydraulic conductivity [L/T],
h is the saturated thickness if the datum is placed on the aquifer base [JN
−1] or [L], and
is the specific yield [-]. When the hydraulic head,
h, is considerably greater than the variation in hydraulic head, it can be approximately substituted by the saturated aquifer thickness,
. Thus, Equation (1) can be modified as follows:
where
[L
2/T] is the unconfined aquifer diffusivity.
2.2. Unit Response Function
Because Equation (2) conforms to the characteristic of being linearly time-invariant, the convolution theorem can be used to calculate the hydraulic head at any location and time. Specifically, the hydraulic head at any location in the unconfined aquifer can be expressed as the convolution of the input signal of the upgradient hydraulic head and the unit response function [
7]:
where
h(
x,
t) is the hydraulic head at any localtion [L],
h0(
t) is the upgradient hydraulic head [L],
is the unit response function of the unconfined aquifer [-], and * denotes the convolution integral.
Taking the Fourier transform, Equation (3) transforms into:
where
[-],
λ is the period [T], and
F[…] denotes the Fourier transform.
For the conceptual model shown in
Figure 1, the transient groundwater flow stressed by the boundary condition of a unit impulse can be expressed using the following mathematic model:
where
δ(t) is the Dirac delta function, representing the impulse change of the hydraulic head.
Applying the Fourier transform to Equation (5) yields the following:
The solution to Equation (6) is given by:
2.3. Phase Spectrum
The cross-spectrum of the hydraulic head,
h(
x,
t), at any location and the upgradient hydraulic head,
h0(
t), can be expressed as:
where
is the cross-spectrum and
is the complex conjugate of
.
Therefore, the phase spectrum, Φ, is calculated as:
where Im and Re represent the imaginary and real parts of the cross-spectrum, respectively.
Substituting Equations (4) and (7) into Equation (8) yields the following:
After simplification, Equation (10) can be written as:
Therefore, the phase spectrum of aquifer diffusivity is as follows:
Equation (12) shows that, for a given frequency,
, the aquifer diffusivity can be estimated when the phase spectrum of the hydraulic head is known. Moreover, when the saturated thickness of the aquifer,
, and the specific yield,
, are known, the hydraulic conductivity can be estimated by:
Note that, in this study, to facilitate calculation, we used the mathematical software MATLAB (2016) to compile the code for the spectral analysis.
3. Field Case Study
3.1. Study Area and Monitoring Data
The study site, which is administratively affiliated with Shijiazhuang City, Hebei Province, is located between the Taihang Mountains in the west and the North China Plain in the east (
Figure 2a). It has a typical continental monsoon climate. The mean annual rainfall is approximately 550 mm, mostly concentrated in spring and summer; the mean annual potential evaporation is 3–4-times higher, ranging from 1600 to 2100 mm. The study site is an erosion and accumulation landform, composed of the alluvial–proluvial fans of the Hutuo River [
14,
15]. As the largest river in the study site, the Hutuo River flows through the study site from the northwest.
Shijiazhuang is the political, economic, and cultural center of Hebei Province. It is one of the cities in China that uses groundwater as its main water source. With urban expansion and the vigorous development of the social economy, the amount of groundwater extracted increases year by year, which leads to long-term groundwater over-exploitation. In 1965, a cone of groundwater depression was formed in Shijiazhuang City and then continued to expand. In recent years, the government of Shijiazhuang City has adopted the strictest water resource management system, and gradually restored local groundwater resources by closing groundwater exploitation wells, vigorously promoting water-saving measures, and mainly using water from the South–North Water Division Project. The groundwater hydraulic head shows a rising trend year by year, and the water’s ecological environment continues to improve.
Based on the spatial and vertical distribution of lithologies, previous studies have divided the Hutuo River alluvial–proluvial fan into four hydrostratigraphic units. The typical hydrogeological profiles can be found in the literature [
16,
17,
18]. Units I and II are unconfined aquifers, and units III and IV mainly comprise confined aquifers. The hydraulic connections are close for units I and II due to the lack of a continuous aquitard between them. Therefore, they are typically treated as one thick unconfined aquifer. A thick aquiclude exists between units I and II and underlies units III and IV. Units I and II consist of sand and gravel, some of which are pebbles, and gradually become finer from west to east. The bottom elevation of units I and II is approximately 20 m in the western piedmont and gradually deepens to the east, exceeding 100 m. The groundwater contained within units I and II was the focus of this study.
To understand the hydraulc connections within the riverside unconfined aquifers, a groundwater monitoring profile (PM01) of three long-term monitoring wells (HTH01, HTH02, and HTH03) was set up in a typical section of the middle reach, perpendicular to the direction of the river, within 1 km south of the river (
Figure 2b). A TD-Diver, which is a submersible datalogger produced by Van Essen Instruments for long-term real-time water level monitoring, was used as the automatic monitoring instrument for groundwater hydraulic head recording. Baro-Divers were used to observe and record the air pressure for compensation.
The Hutuo River was perennial in the 1960s. Due to rapid urban societal and economic development, the local groundwater level has continued to decline in the past few decades, and the river has basically dried up. After the river comes out of mountains, it rapidly infiltrates and flows downstream in the form of groundwater and discharges on both sides [
19,
20]. The riverbed is briefly flooded only after releasing water from the upstream reservoir. As the monitoring well HTH01 was located approximately 50 m away from the river channel, using the hydraulic head of the monitoring well HTH01 to characterize the upgradient hydraulic head,
h0(
t), was considered acceptable.
According to a regional hydrogeological investigation, the thickness of units I and II at the study site is approximately 70 m [
17,
18]. As shown in
Table 1, the depth of the groundwater monitoring wells is approximately 55 m; therefore, the aquifer bottom is not intercepted. Moreover, as the water table depth is approximately 20 m, the saturated thickness of the unconfined aquifer is approximately 50 m.
The groundwater hydraulic head was measured hourly at each well from 12:00 on 20 November 2019 to 11:00 on 1 June 2022 for a total duration of 924 days (
Figure 3a). The groundwater hydraulic head fluctuations of each monitoring well in the PM01 profile had similar variations, showing a gradual upward trend over the 924 days (
Figure 3a). As the raw data were simultaneously affected by local climate and human activities, irregularity and randomness were evident. To eliminate interference that may have been linear or systemic, raw data were preprocessed by detrending. The basis of detrending is subtracting an optimal (least square) fitting line from the raw data so that the mean value after detrending is zero. By removing the linear trend, the analysis can be focused on the water level fluctuations, and the periodicity can be better highlighted.
Figure 3b shows the results after detrending, in which it is evident that a more significant periodic undulation existed. Therefore, we used the detrended data in the spectral analysis.
3.2. Results
In general, the aquifer diffusivity phase spectra of monitoring wells HTH02 and HTH03 were relatively consistent (
Figure 4a,b). In short periods, the aquifer diffusivity fluctuated strongly and had great uncertainty, which was influenced by short-term fluctuations caused by meteorological and human activities. After the period was gradually increased, the aquifer diffusivity gradually became stable at around 104 m
2/d, which was the comprehensive response to the long-term groundwater hydraulic head fluctuations.
Equation (12) is a function of frequency or period. Selecting an appropriate frequency or significant period is key to reasonably estimating the hydrogeological parameters. In this study, we used Fourier analysis methods to identify the significant periods of the hydraulic head. Specifically, we plotted the amplitude spectra of the hydraulic head measured in the monitoring wells (
Figure 5). As they were remarkably greater than other periods, the amplitudes of the last four periods were much more significant and generally represented the main variation characteristics of a hydraulic head. Therefore, the four significant periods were determined to be 924, 462, 308, and 231 days, and they were the more appropriate selections when using Equation (12) to estimate the aquifer diffusivity.
For monitoring well HTH02, the corresponding aquifer diffusivities estimated using the phase spectrum method were 1944, 1212, 49,655, and 34,515 m2/d, respectively, with a mean of 21,831 m2/d; those of monitoring well HTH03 were 5464, 3642, 29,975, and 49,854 m2/d, respectively, with a mean of 22,234 m2/d. In summary, the aquifer diffusivity estimated using the phase spectrum method ranged from 1.9 × 10³ to 4.9 × 10⁴ m2/d, with a mean of 2.2 × 10⁴ m2/d. Moreover, as mentioned above, the mean aquifer thickness at the study site was approximately 50 m and the specific yield was 0.15–0.20. By using Equation (13), the hydraulic conductivity of the aquifer was estimated to be about 80 m/d.
3.3. Validation
To test the efficacy, the aquifer diffusivities estimated by the phase spectrum were compared to the results obtained by using power spectral analysis, pumping tests, and inverse numerical models.
By calculating the power spectra of the hydraulic head at different distances perpendicular to the river, Wang et al. [
7] derived a spectral solution to estimate two important parameters: aquifer diffusivity and river resistance. When river resistance is not considered, the solution of Wang et al. [
7] is reduced to the following:
where
P[
H] is the power spectrum of a hydraulic head and
P[
HR] is the power spectrum of an upgradient hydraulic head.
Figure 4c,d presents the aquifer diffusivity power spectra calculated using Equation (14). Within a short period, the aquifer diffusivities obtained from the phase spectrum and power spectrum fluctuated in a similar pattern, with strong variation and uncertainty. Conversely, as the period increased, the power spectrum gradually stabilized at around 10
4 m
2/d, with far less variation, especially for the significant periods of 924, 462, 308, and 231 days. For monitoring well HTH02, the corresponding aquifer diffusivities determined using the power spectrum method were 1291, 3746, 6183, and 30,574 m
2/d, respectively, with a mean of 10,448 m
2/d; those of monitoring well HTH03 were 3759, 9943, 12,601, and 82,215 m
2/d, respectively, with a mean of 27,130 m
2/d. These results are more or less in good agreement with those of the phase spectrum determined using Equation (12).
The study site is located in the North China Plain, which is an intense area for groundwater exploitation and utilization. Many hydrogeologists have conducted investigations and studies at this site, for example, analyzing the vulnerability of groundwater in Shijiazhuang City to high-intensity groundwater exploitation using a transient flow pumping test and numerical model inversion. Cheng et al. [
21] suggested that the study site is in a hydrogeological unit with pebble gravel sand interbedded with sub-clay and that the hydraulic conductivity is 100–400 m/d. In a study of sustainable groundwater management policies in typical agricultural irrigation areas in Shijiazhuang City, the hydraulic conductivity and specific yield were reported to be 120–150 m/d and 0.13–0.14, respectively [
22]. In an intergraded hydrological model of the North China Plain, Shu et al. [
23] considered that the aquifer is composed of medium and coarse sand, with a hydraulic conductivity ranging from 86.4 to 259.2 m/d (1.0 × 10
−3 to 3.0 × 10
−3 m/s) and specific yield from 0.18 to 0.21. Overall, previous studies reported hydraulic conductivities from 100 to 200 m/d and specific yields from 0.15 to 0.20. These results are basically consistent with those obtained using the phase spectrum method in the present study.
In these methodologies, the power spectral analysis and the pumping tests have similar assumptions to the phase spectral analysis. For the numerical methods, this is related to the conceptualization of the hydrogeological conditions. In the mentioned numerical models, the characterization of aquifers is more complex, and the assumptions of aquifer isotropy, i.e., no vertical flow and constant saturated thickness, were not applied. Thus, the results would differ from the phase spectral method.
4. Discussion
Aquifer tests can provide in situ estimations of aquifer diffusivity, but they are difficult and costly to implement. Moreover, they only provide a localized estimation surrounding the measurement locations. In contrast, the phase spectral approach proposed in this paper can estimate the aquifer properties on a larger scale. One shortcoming of the phase spectral approach is that a long time is required to assemble sufficient groundwater hydraulic head time series. For example, for the case study discussed in this paper, to ensure the reliability of the results, the installation of the monitoring instruments and recording of water levels should preferably be continued for more than one hydrological year. In contrast, conventional aquifer tests take only a couple of days. Therefore, this can be an argument for not considering the phase spectral approach. However, if a long time series of groundwater hydraulic heads is available for a study site, the phase spectral approach can estimate hydrogeological parameters accurately and quickly.
Although the conceptual model shown in
Figure 1 mainly describes the interactions within aquifers, the corresponding mathematical model (Equation (5)) can also be used to describe the groundwater flow between the river and adjacent aquifers. By considering the specific head boundary of the upgradient hydraulic head in Equation (5b) as the river stage, the groundwater flow in aquifers with a river and the hydrogeological parameters of the aquifer can be characterized.
As shown in Equation (2), the mathematical model developed in this paper assumes that the saturated thickness of the unconfined aquifer is considerably greater than the hydraulic head variation. Therefore, the governing equation of groundwater flow in the unconfined aquifer is linearized, which is formally identical to that of a confined aquifer. Thus, the former can be used to estimate the confined aquifer diffusivity after substituting the specific yield of the unconfined aquifer with the storage coefficient of the confined aquifer. For the same reason, when the aquifer thickness and storage coefficient are known, the hydraulic conductivity of a confined aquifer can also be estimated.
The hydrogeological mathematical model used in this paper is relatively simple. Under the condition of an isotropic, one-dimensional horizontal flow, and an approximately constant aquifer thickness, a phase spectrum analysis method is given to find the aquifer parameters. In the future, we could increase the complex conditions of the hydrogeological mathematical model. For example, we could move from the unconfined aquifer system to the confined aquifer system; we could consider the heterogeneity of the aquifer, the impact of rainfall or evaporation on the groundwater system, and the impact of human activities on the groundwater system.
5. Conclusions
In this study, with the assumptions of aquifer isotropy, i.e., no vertical flow and constant saturated aquifer thickness, by using the Fourier transform and convolution theorem, a 1D analytical solution of the phase spectrum for an unconfined aquifer system was derived, which subsequently led to a phase spectrum solution of aquifer diffusivity.
To test the efficacy, the middle reach of the Hutuo River in North China was introduced as the field case study. A groundwater monitoring profile of three groundwater monitoring wells obtained using automatic monitoring instruments was used. By using Fourier analysis to obtain the amplitude spectra of the hydraulic head, significant periods were identified. The estimated aquifer diffusivities ranged from 1.9 × 10³ to 4.9 × 10⁴ m2/d, with a mean of 2.2 × 10⁴ m2/d, which was consistent with the results obtained using power spectral analysis, transient pumping tests, and inverse numerical models.
In situ estimations of aquifer diffusivity are costly and only provide localized estimations surrounding the measurement locations. In contrast, if long time series of hydraulic heads are available, the phase spectral method can accurately and quickly estimate the aquifer properties on a larger scale. Moreover, given the similarity of the linearized governing equations, the phase spectral approach can also be applied to the river–aquifer systems and the confined aquifer system.
Author Contributions
All authors contributed to this manuscript. B.Z. was responsible for the conceptualization, methodology, formal analysis, draft in Chinese, and project administration. R.Z. was responsible for the conceptualization, methodology, formal analysis, draft in English, reviewing, and editing. J.W. was responsible for the methodology, formal analysis, reviewing, and editing. Y.L. (Yasong Li) was responsible for the formal analysis, reviewing, and editing. X.K. was responsible for the sample collecting and data collecting. Y.L. (Yaci Liu) was responsible for data curation. All authors have read and agreed to the published version of the manuscript.
Funding
This study was supported by the Fundamental Research Funds of the Chinese Academy of Geological Sciences (CAGS) (SK202113), National Natural Science Foundation of China (41902245), Key R&D and Promotion Projects of Henan Province: Scientific Research (212102311150), and Independent Research and Development Project of YREC.
Data Availability Statement
The hydraulic head field data used in this paper are available upon request.
Conflicts of Interest
The authors declare no competing interest.
References
- Bear, J. Hydraulics of Groundwater; Dover Publications: Mineola, NY, USA, 2007. [Google Scholar]
- Freeze, R.A.; Cherry, J.A. Groundwater; Prentice-Hall: Englewood Cliffs, NJ, USA, 1979. [Google Scholar]
- Hiller, C.K.; Levy, B.S. Estimation of Aquifer Diffusivity from Analysis of Constant-Head Pumping Test Data. Groundwater 1994, 32, 47–52. [Google Scholar] [CrossRef]
- Sobolevskaia, V.; Cardenas, M.B.; Hasanov, A.K.; Knappett, P.S.K. Aquifer Diffusivity Estimation Through Joint Inversion of the Amplitude Ratios and Time Lags of Dominant Frequencies of Fluctuating Head. Water Resour. Res. 2021, 57, e2020WR027912. [Google Scholar] [CrossRef]
- Gelhar, L.W. Stochastic analysis of phreatic aquifers. Water Resour. Res. 1974, 10, 539–545. [Google Scholar] [CrossRef]
- Shih, D.-F. Determination of hydraulic diffusivity of aquifers by spectral analysis. Stoch. Environ. Res. Risk Assess. 1999, 13, 85–99. [Google Scholar] [CrossRef]
- Wang, J.; Wörman, A. Spectral Analysis of River Resistance and Aquifer Diffusivity in a River-Confined Aquifer System. Water Resour. Res. 2019, 55, 8046–8060. [Google Scholar] [CrossRef]
- Brassington, R. Field Hydrogeology; John Wiley & Sons: Hoboken, NJ, USA, 2007. [Google Scholar]
- Rasmussen, T.C.; Haborak, K.G.; Young, M.H. Estimating aquifer hydraulic properties using sinusoidal pumping at the Savannah River site, South Carolina, USA. Hydrogeol. J. 2003, 11, 466–482. [Google Scholar] [CrossRef]
- Anderson, M.P.; Woessner, W.W. Applied Groundwater Modeling: Simulation of Flow and Advective Transport; Academic Press: San Diego, CA, USA, 1992. [Google Scholar]
- Allen, R.L.; Mills, D. Signal Analysis: Time, Frequency, Scale, and Structure; John Wiley & Sons: Hoboken, NJ, USA, 2004. [Google Scholar]
- Lin, Y.-C.; Yeh, H.-D. A Lagging Model for Describing Drawdown Induced by a Constant-Rate Pumping in a Leaky Confined Aquifer. Water Resour. Res. 2017, 53, 8500–8511. [Google Scholar] [CrossRef]
- Shi, Z.; Wang, G. Relationship between the Earth tidal factor and phase lag of groundwater levels in confined aquifers and the Wenchuan M s8. 0 earthquake of 2008. Sci. China Earth Sci. 2013, 56, 1722–1730. [Google Scholar] [CrossRef]
- Han, S.; Hu, Q.; Yang, Y.; Yang, Y.; Zhou, X.; Li, H. Response of Surface Water Quantity and Quality to Agricultural Water Use Intensity in Upstream Hutuo River Basin, China. Agric. Water Manag. 2018, 212, 378–387. [Google Scholar] [CrossRef]
- Li, Y.; Zhang, Z.; Fei, Y.; Chen, H.; Qian, Y.; Dun, Y. Investigation of quality and pollution characteristics of groundwater in the Hutuo River Alluvial Plain, North China Plain. Environ. Earth Sci. 2016, 75, 1–10. [Google Scholar] [CrossRef]
- Cao, G.; Zheng, C.; Scanlon, B.R.; Liu, J.; Li, W. Use of flow modeling to assess sustainability of groundwater resources in the North China Plain. Water Resour. Res. 2013, 49, 159–175. [Google Scholar] [CrossRef]
- Xing, L.; Guo, H.; Zhan, Y. Groundwater hydrochemical characteristics and processes along flow paths in the North China Plain. Asian J. Earth Sci. 2013, 70–71, 250–264. [Google Scholar] [CrossRef]
- Zhang, P.; Hao, Q.; Fei, Y.; Li, Y.; Zhu, Y.; Li, J. Simulation-optimization model for groundwater replenishment from the river: A case study in the Hutuo River alluvial fan, China. Water Supply 2022, 22, 6994–7005. [Google Scholar] [CrossRef]
- Omer, A.; Wang, W.; Basheer, A.K.; Yong, B. Integrated assessment of the impacts of climate variability and anthropogenic activities on river runoff: A case study in the Hutuo River Basin, China. Hydrol. Res. 2016, 48, 416–430. [Google Scholar] [CrossRef]
- Peng, S.; Liu, W.; Wang, W.; Shao, Q.; Jiao, X.; Yu, Z.; Xing, W.; Xu, J.; Zhang, Z.; Luo, Y. Estimating the effects of climatic variability and human activities on streamflow in the Hutuo River Basin, China. J. Hydrol. Eng. 2013, 18, 422–430. [Google Scholar] [CrossRef]
- Cheng, Z.; Su, C.; Zheng, Z.; Chen, Z.; Wei, W. Characterize groundwater vulnerability to intensive groundwater exploitation using tritium time-series and hydrochemical data in Shijiazhuang, North China Plain. J. Hydrol. 2021, 603, 126953. [Google Scholar] [CrossRef]
- Hu, Y.; Moiwo, J.P.; Yang, Y.; Han, S.; Yang, Y. Agricultural water-saving and sustainable groundwater management in Shijiazhuang Irrigation District, North China Plain. J. Hydrol. 2010, 393, 219–232. [Google Scholar] [CrossRef]
- Shu, Y.; Villholth, K.G.; Jensen, K.H.; Stisen, S.; Lei, Y. Integrated hydrological modeling of the North China Plain: Options for sustainable groundwater use in the alluvial plain of Mt. Taihang. J. Hydrol. 2012, 464–465, 79–93. [Google Scholar] [CrossRef]
| Disclaimer/Publisher’s Note: The statements, opinions and data contained in all publications are solely those of the individual author(s) and contributor(s) and not of MDPI and/or the editor(s). MDPI and/or the editor(s) disclaim responsibility for any injury to people or property resulting from any ideas, methods, instructions or products referred to in the content. |
© 2023 by the authors. Licensee MDPI, Basel, Switzerland. This article is an open access article distributed under the terms and conditions of the Creative Commons Attribution (CC BY) license (https://creativecommons.org/licenses/by/4.0/).

 ,
, 


