Abstract
As a major agricultural province, understanding the spatial distribution characteristics of non-point source pollution in Liaoning Province plays a crucial role in preventing and controlling non-point source pollution. This paper uses the pollution discharge coefficient method to calculate the TN and TP load of non-point source pollution in each city of Liaoning Province in 2019. The results indicate that: (1) In 2019, the emissions of TN and TP from non-point source pollution in Liaoning Province were 245.6 thousand t and 23.2 thousand t, respectively. Livestock and poultry farming is the main source of TN and TP pollution. (2) The total amount of standard pollution load was 361.269 billion m3. TN is the main source of non-point source pollution, with TN and TP accounting for 67.96% and 32.04%, respectively. Overall, pollution in the central and western regions is more serious than in the eastern regions, while pollution in the plain areas is worse than in the mountainous and hilly areas. Chaoyang should be a key focus in terms of the prevention and control of non-point source pollution, and the abundant total water resources play a crucial role in reducing pollution levels.
1. Introduction
Water is the foundation of human survival, and water environmental pollution directly affects and restricts the sustainable development of human beings. The pollution sources of water are complex and can generally be divided into two main forms: point source pollution and non-point source pollution. The former is defined as having a fixed discharge point of pollution sources, such as industrial wastewater, urban domestic sewage, etc., which are collectively discharged into rivers and lakes from the discharge outlet. On the contrary, the latter refers to the pollution caused by pollution sources without fixed discharge points, mainly agricultural non-point source pollution. In other words, it is caused by pollutants such as soil sediment particles, chemical pesticides, livestock and poultry feces and sewage that accumulate on the surface and enter the receiving water body through surface or underground runoff generated by rainfall [1]. While industrial pollution sources have been well controlled and treated, the effects of non-point source pollution are becoming increasingly prominent, becoming the main cause of water environmental pollution.
As a unique agricultural power in the world, the contradiction between agricultural activities and the environment in China cannot be ignored, with the issue of non-point source pollution being particularly prominent. According to “The Second National Pollution Source Census Bulletin”, in 2017, China’s agricultural non-point sources discharged 10.67 million t of Chemical oxygen demand (COD), 1.41 million t of total nitrogen (TN) and 21 million t of total phosphorus (TP) into water bodies, accounting for 49.8%, 46.5%, and 67.2% of the total, respectively, and were the “number one” contributors to surface water pollution in China [2,3]. From this, it can be seen that non-point source pollution is a significant reason for the deterioration of water environment quality. For this reason, the country has successively issued a series of documents to promote the prevention and control of non-point source pollution. As a major agricultural province, Liaoning Province has actively promoted the prevention and control of non-point source pollution and carried out projects such as risk control of polluted farmland, achieving significant results. However, the current situation of non-point source pollution is still not optimistic. Therefore, it is necessary to understand its spatiotemporal distribution characteristics in Liaoning Province. At present, due to objective conditions and technological limitations, it is difficult to quantify various processes of non-point source pollution accurately using traditional monitoring methods. Therefore, many scholars have established different models of non-point source pollution. Non-point source pollution models are an effective tool for describing, predicting, and warning about the situation of non-point source pollution [4]. It quantitatively describes complex processes that generate pollution through simulation, helping us identify its main sources [5]. Common mechanism models include SWAT [6], AnnAGNPS [7], and HSPF [8]. Although these models consider the migration and transformation mechanisms of target pollutants under multiple factors, they have high data requirements and their parameters are difficult to obtain. In contrast, empirical statistical models have been widely used due to their simplicity, convenience, and independence from large amounts of monitoring data. At present, non-point source pollution load estimation methods at home and abroad mainly include the runoff segmentation method [9], the output coefficient method [10,11], the pollution discharge coefficient method [12], and the source intensity coefficient method [13,14]. The selection of estimation methods is usually based on the completeness of the data, and the pollution discharge coefficient method is relatively simple and has low parameter requirements and strong applicability, wherein it is usually used for estimating nitrogen and phosphorus loads in cases of limited monitoring data. Chen Wuquan (2022) estimated TP emissions in the Poyang lakeside area by using the pollution discharge coefficient method [15]. Xie Jingchao (2019) also used this method to estimate the contribution of various pollution sources to TN and TP pollutants in the Hanfeng Lake Basin and studied the spatial distribution characteristics of their emissions utilizing the GIS spatial analysis method in 2015 [16]. The methods used to analyze the source pollution mainly include the equal standard pollution load method [17], the model method [18], the average concentration method [19], the spatial analysis method [20], and the inventory method [21]. On the basis of the functional requirements of environmental water quality to assess the threat of pollutants, the equal standard pollution load method not only accounts for the characteristics of emission sources but also considers the degree of harm to environmental water quality; it is widely used and mature in application.
The spatial distribution of non-point source pollution in Liaoning Province has not been previously reported. Therefore, this paper takes 14 prefecture-level cities located in Liaoning Province as accounting units, and according to the 2019 data from the Statistical Yearbook of Liaoning Province 2020, uses the pollutant emission coefficient method to estimate the TN and TP load and emission intensity of cities in Liaoning Province, adopts the equal standard pollution load method to access the pollution sources, and analyzes the distribution characteristics and causes of non-point source pollution in Liaoning Province. It will provide a theoretical basis and scientific basis for further understanding the characteristics of non-point source pollution in Liaoning Province.
2. Research Methods
2.1. Overview of the Research Area
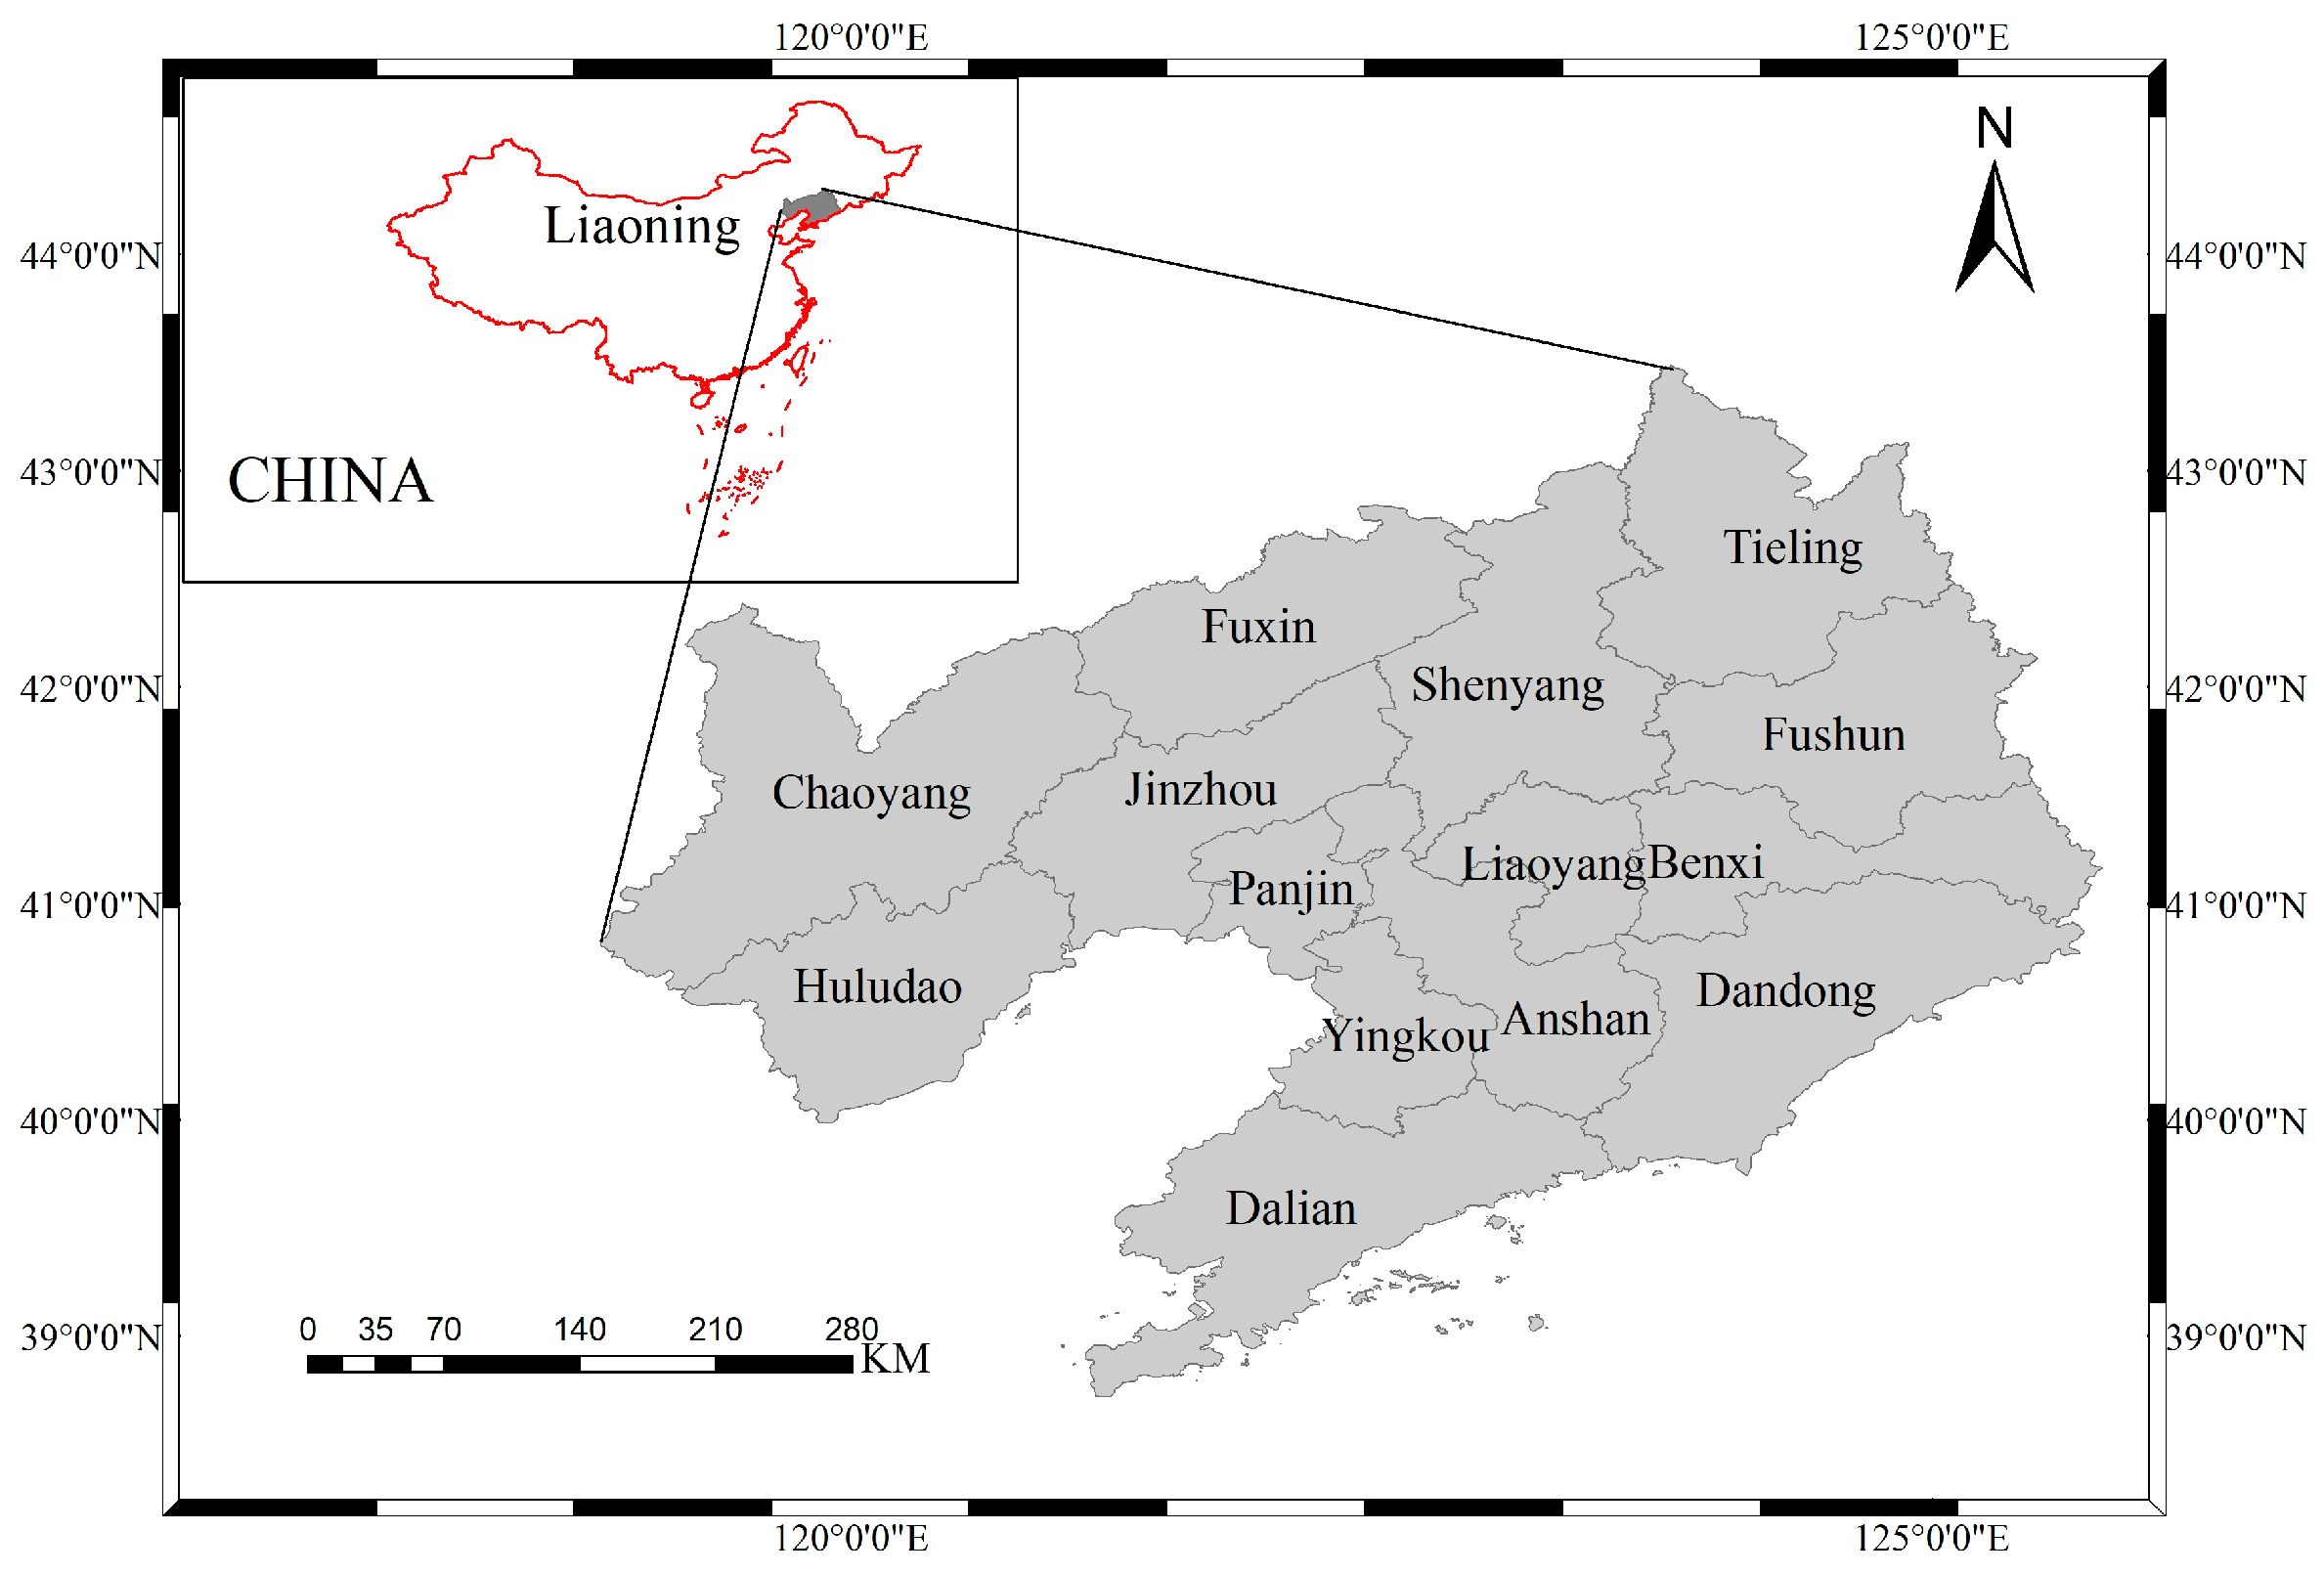
Liaoning Province is located in the northeast region of mainland China and has a temperate continental monsoon climate. It is located at 118°53′~125°46′ E and 38°43~43°26′ N. It is an important junction of the Northeast China Economic Zone and the Bohai Rim Economic Zone, with a total area of 148 thousand km2. The east and west sides belong to mountainous and hilly areas, with a vast plain in the middle. The overall terrain is generally higher in the north and lower in the south, tilting from land to sea. It is a major agricultural province and also one of the main grain-producing provinces in the country. The province has 14 prefecture-level cities, of which Shenyang is the provincial capital and Chaoyang is the prefecture-level city with the largest administrative area. Dalian is an important fishing production base and distribution center for aquatic products in northern China and is a major contributor to the fishing output value of Liaoning Province. The location map of the study area is shown in Figure 1.
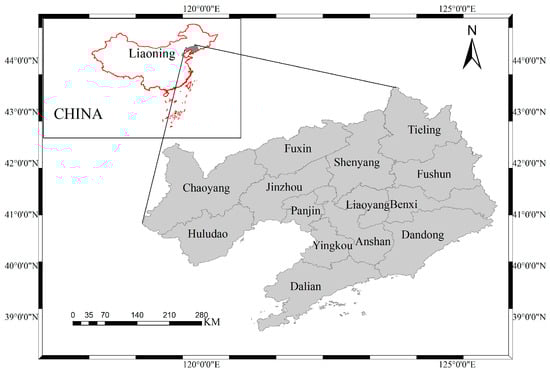
Figure 1.
Location map of the study area.
2.2. Method for Estimating Pollution Load
Non-point source pollution is dispersed, random, and difficult to monitor, making it difficult to accurately calculate using actual monitoring or centralized sampling. This paper takes agricultural land, livestock and poultry farming, aquaculture, and rural life as non-point source pollution sources, combined with the actual situation of agricultural activities in Liaoning Province, and considering the availability of the corresponding data, the TN and TP emissions of each city in Liaoning Province are calculated using the pollution discharge coefficient method [22,23].
The formula is as follows:
In the formula: represents the TN and TP emissions of each city, t; are TN and TP emissions generated from agricultural land, livestock and poultry farming, aquaculture, and rural life, respectively, t. The calculation methods are as follows:
- (1)
- Agricultural land
In the formula: is the net amount of nitrogen and phosphorus fertilizer applied to crops in each city, t; is the corresponding fertilizer loss coefficient, %.
The cultivated land in Liaoning Province is mainly dry land. The pollution of agricultural land is mainly caused by fertilization. According to “The handbook of Fertilizer Loss Coefficient of Animal Agricultural pollution Sources in the First National Pollution Source Survey”, the loss coefficient of farmland fertilizer is revised, the loss coefficient of nitrogen fertilizer is 1.44%, and that of phosphorus fertilizer is 0.10%.
- (2)
- Livestock and poultry farming
In the formula: is the number of livestock and poultry of the i-th species, head; is the feeding cycle of the i-th type of livestock and poultry, days; is the daily excretion coefficient of the i-th type of livestock and poultry, kg/day; is the average content of pollutants in the feces and urine of the i-th type of livestock and poultry, kg/t; is the loss of fecal and urine pollution in the i-th type of livestock and poultry, %.
The animals involved in the statistics include pigs, cows, sheep, and poultry. Different animals have different breeding cycles. The breeding cycle for live pigs is 199 days/year; for cows and sheep, it is 365 days/year; and for poultry, it is 210 days/year [24,25]. The daily discharge coefficient, pollution production coefficient, and loss coefficient used in this paper are shown in Table 1 [26,27].

Table 1.
Calculation coefficients for livestock and poultry breeding.
- (3)
- Aquaculture
In the formula: is the aquaculture yield, t; is the discharge intensity of aquaculture production, kg/t. Referring to the emission intensity of unit aquaculture yield released by the Ministry of Ecological Environment in 2017, the TN value is 2.02 kg/t and the TP value is 0.33 kg/t.
- (4)
- Rural life
In the formula: represents the number of rural residents, person; represents the pollution discharge coefficient of rural life, g/person·day; represents the research period in days, and the value of T in this paper is 365 days. The specific coefficients are shown in Table 2 [22].
Table 2.
Emission Factors of Rural Living Sources (Unit: g/person·day).
2.3. Pollution Level Evaluation Method
2.3.1. Unit Area Pollution Load Coefficient Method
The unit area pollution load coefficient method is used to evaluate the non-point source pollution degree of each prefecture-level city. The calculation formula is as follows:
In the formula: is the pollution load coefficient per unit area; is the emission intensity of non-point source pollutants in a certain city, t/km2; is the total emissions of TN or TP in each city, t; is the administrative area of the city, km2.
According to the magnitude of the K value, the environmental impact of TN and TP on each city can be divided into three levels: K < 0.6, which does not pose a threat to the environment; 0.6 ≤ K ≤ 1, posing a slight threat to the environment; and K > 1, posing a serious threat to the environment.
2.3.2. Equal Standard Pollution Load Index Method
It is currently a widely used pollution load assessment method in the academic community. The calculation formula is as follows [28,29]:
In the formula: is the i-th pollution source’s equivalent pollution index of the i-th pollution flow loss; is the total equivalent pollution load of the i-th pollutant from the j-th pollution source, m3; is the total water resources of the prefecture-level city where the pollutant is located, m3; is the annual emission of the i-th pollutant from the j-th pollution source, t; according to GB3838-2002 [30] Environmental Quality Standards for Surface Water, mg/L. This paper calculates according to the water quality standard for Class III, with TN being 1 mg/L and TP being 0.2 mg/L.
2.4. Data Sources
The net amount of nitrogen and phosphorus fertilizer applied to crops, livestock and poultry production, aquaculture production, and rural population in Liaoning Province in 2019 are sourced from the “Liaoning Statistical Yearbook 2020”. The total water resources data are sourced from the 2019 Liaoning Provincial Water Resources Bulletin. The total output value data relating to agriculture, forestry, animal husbandry, and fishery in each city of Liaoning Province are sourced from the” National Economic and Social Development Statistical Bulletin” of each city.
3. Results and Discussion
3.1. Characteristics of Non-Point Source Pollution in Each City of Liaoning Province
3.1.1. TN and TP Emissions in Each City
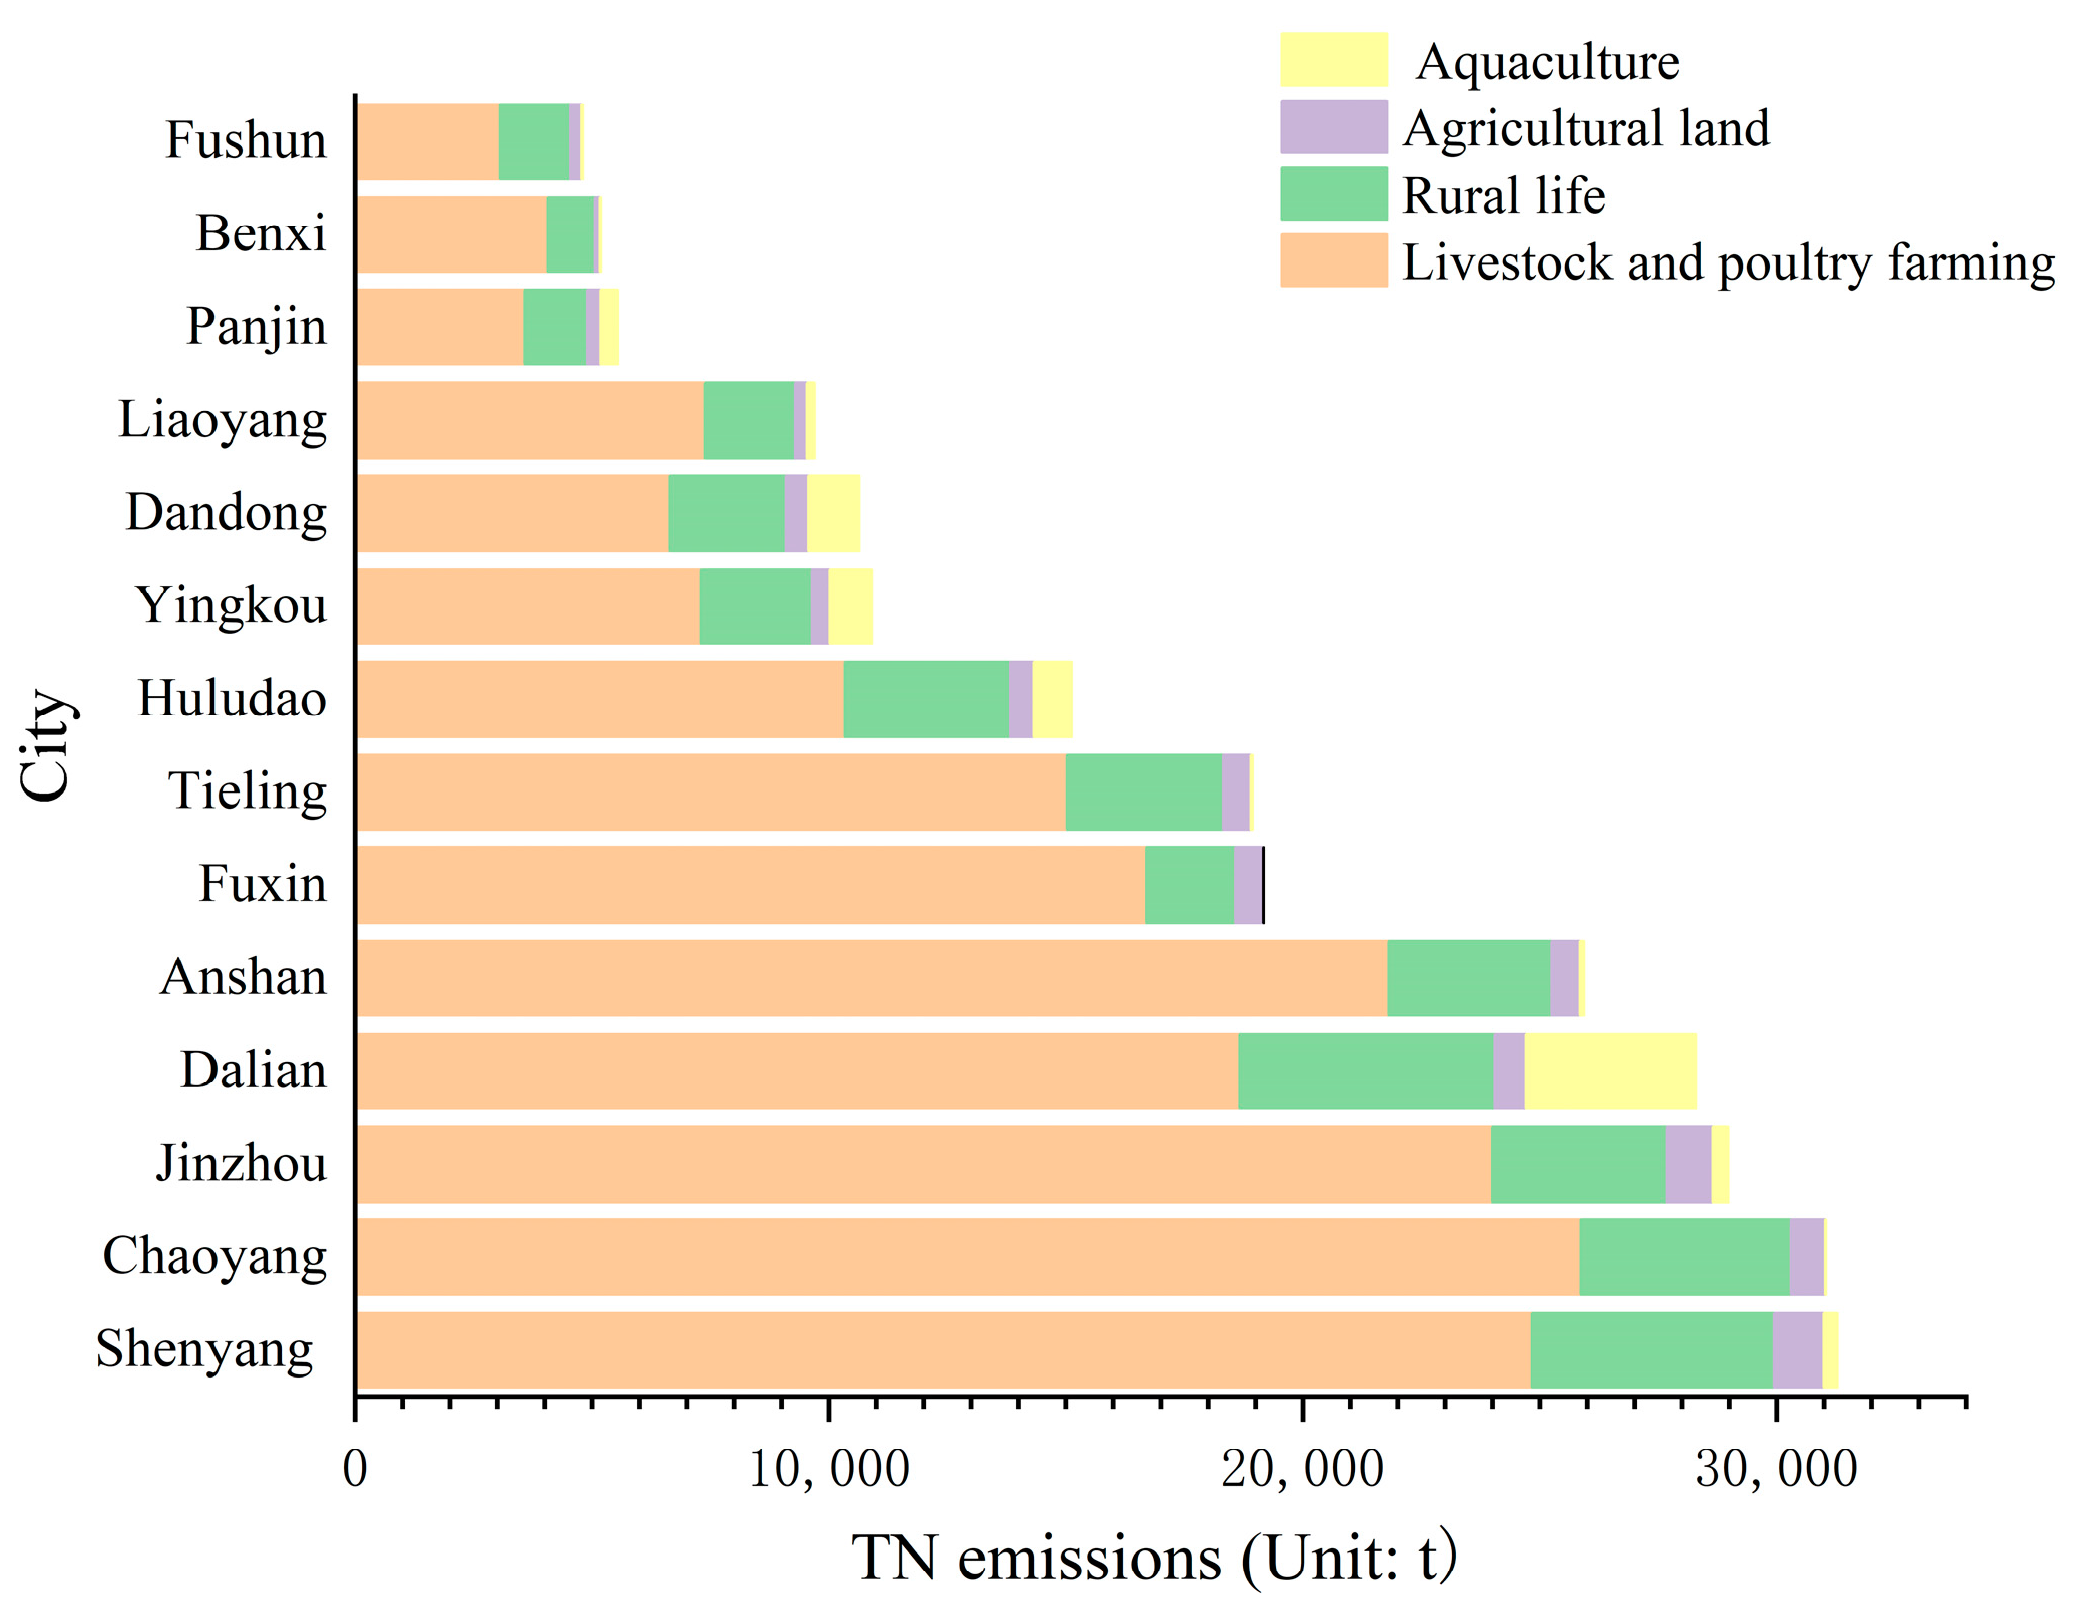
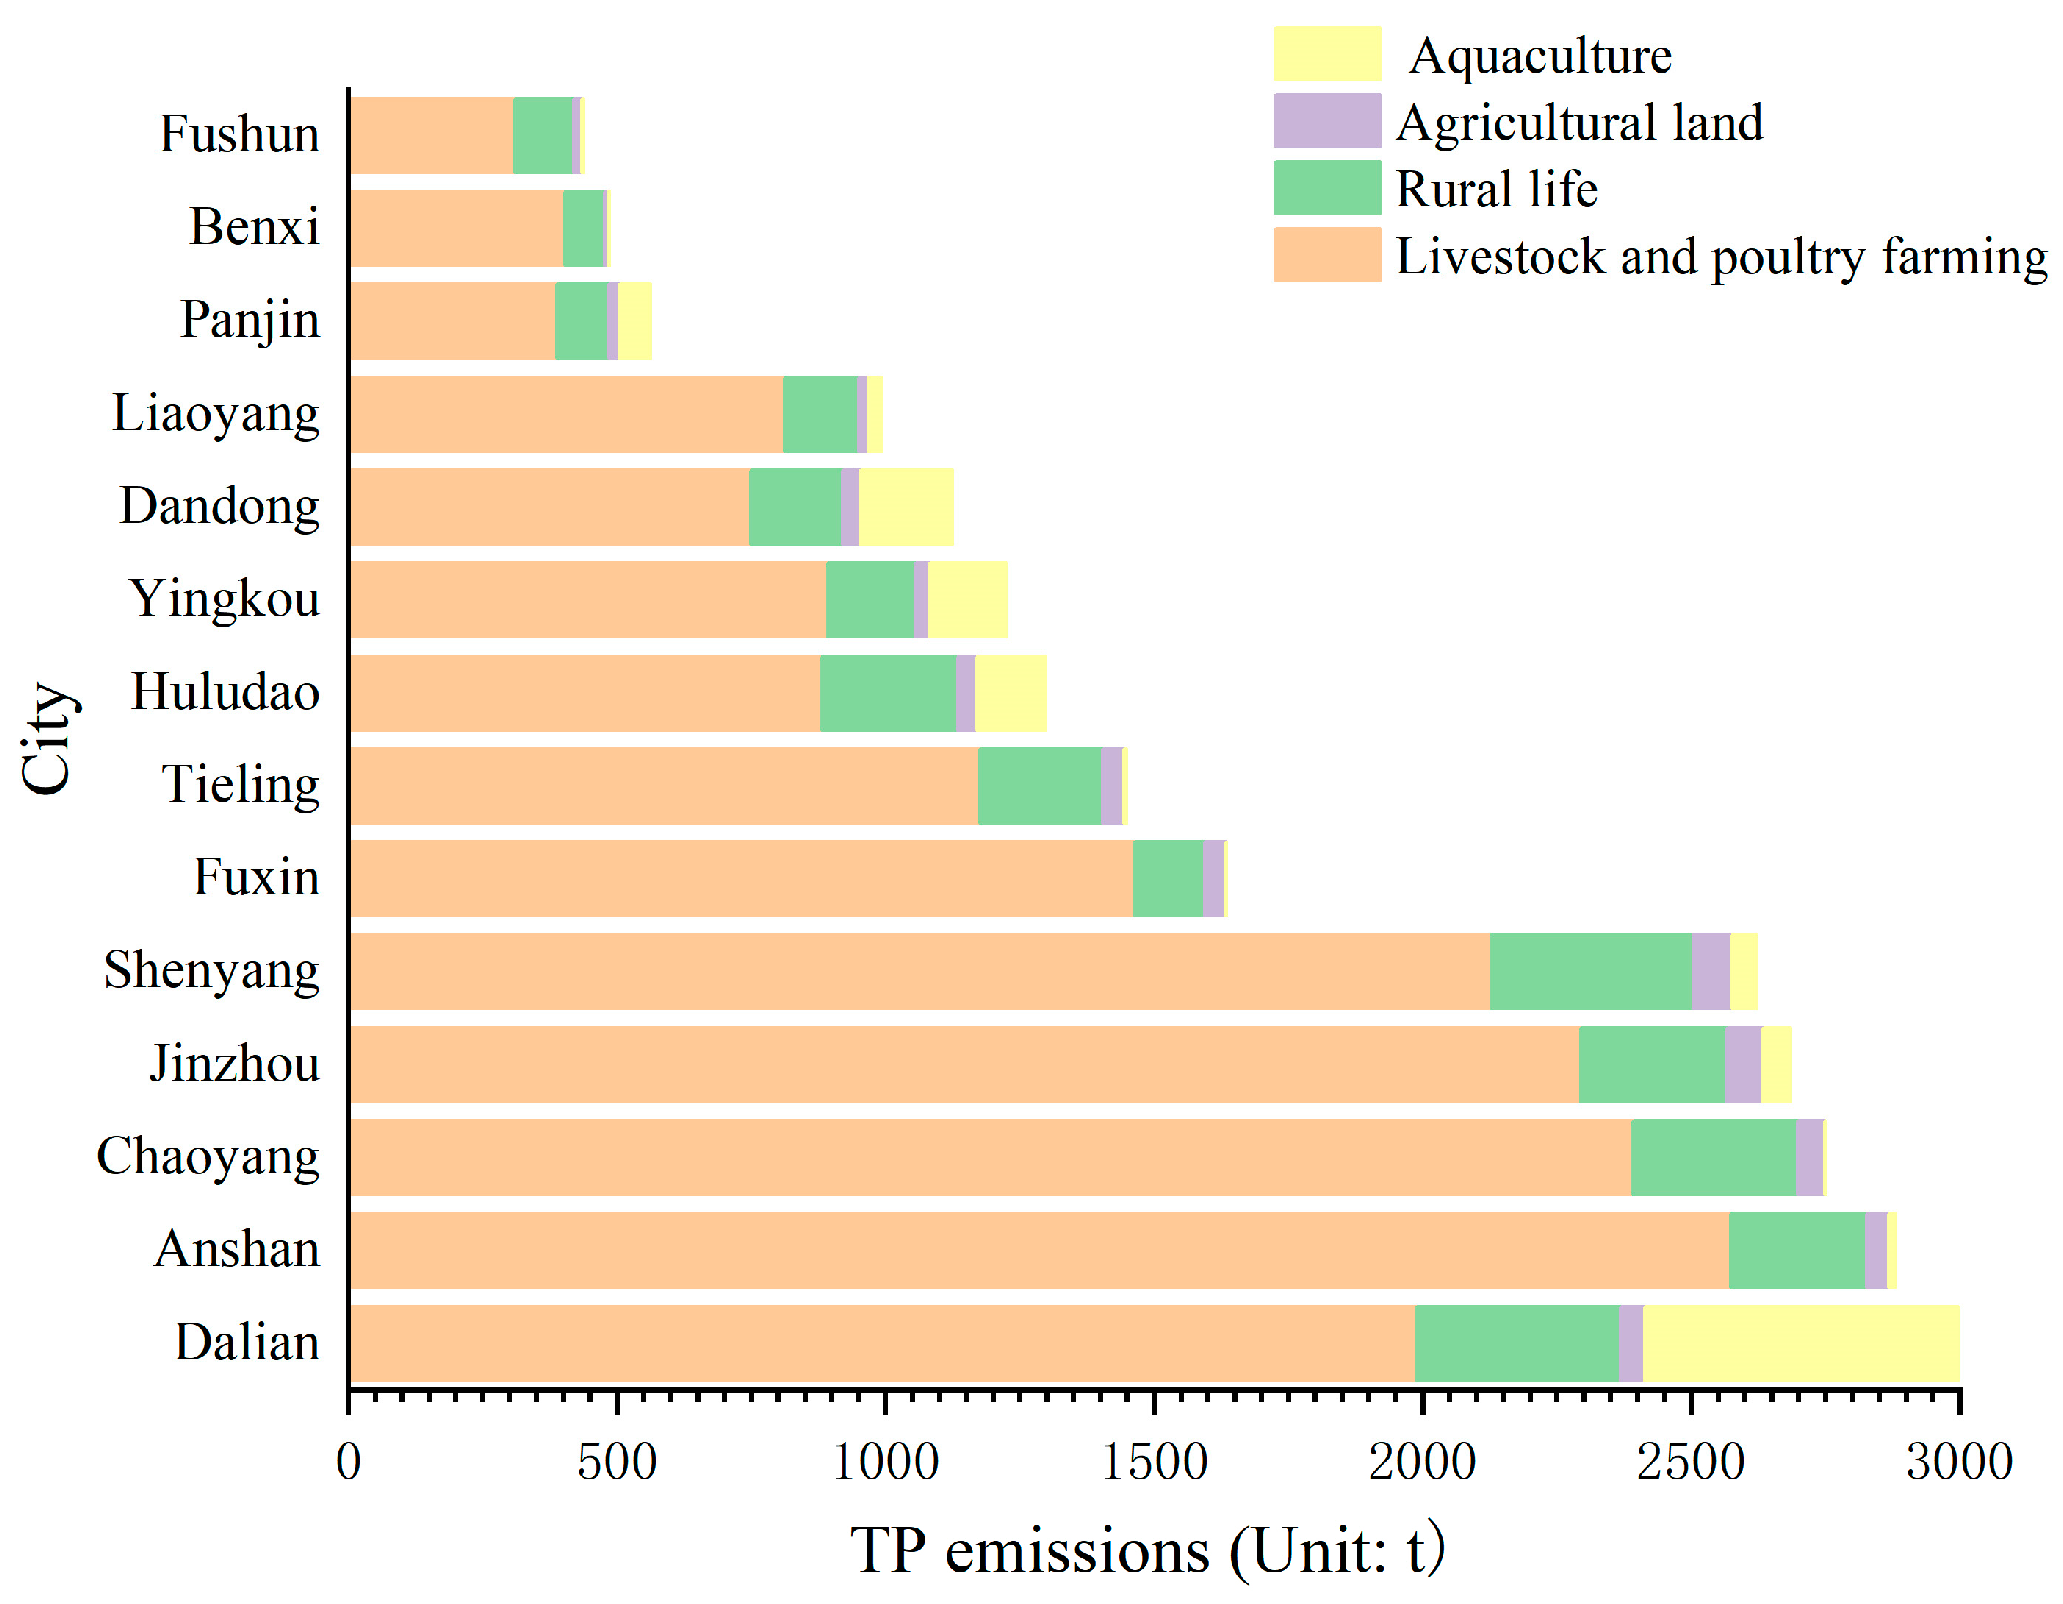
Figure 2 and Figure 3 show the TN and TP emissions of non-point source pollution from different types of pollution sources in Liaoning Province in 2019. The emissions of TN and TP in Liaoning Province were 245.6 thousand t and 23.2 thousand t t, respectively, with TN emissions in the province being 10.6 times that of TP emissions. The average annual emissions of TN and TP in each city across the province were 17.5 thousand t and 1.65 thousand t, respectively. The ranking of TN emissions was as follows: Shenyang (31.3 thousand t) > Chaoyang (31.0 thousand t) > Jinzhou (29.0 thousand t) > Dalian (28.3 thousand t) > Anshan (25.9 thousand t) > Fuxin (19.2 thousand t) > Tieling (18.9 thousand t) > Huludao (15.1 thousand t) > Yingkou (10.9 thousand t) > Dandong (10.6 thousand t) > Liaoyang (9.7 thousand t) > Panjin (5.5 thousand t) > Benxi (5.2 thousand t) > Fushun (4.8 thousand t); The ranking of TP emissions was Dalian (3.00 thousand t) > Anshan (2.88 thousand t) > Chaoyang (2.75 thousand t) > Jinzhou (2.69 thousand t) > Shenyang (2.62 thousand t) > Fuxin (1.64 thousand t) > Tieling (1.45 thousand t) > Huludao (1.30 thousand t) > Yingkou (1.23 thousand t) > Dandong (1.13 thousand t) > Liaoyang (0.99 thousand t) > Panjin (0.56 thousand t) > Benxi (0.49 thousand t) > Fushun (0.44 thousand t). There were seven prefecture-level cities and five prefecture-level cities with higher average emissions of TN and TP, respectively. From the perspective of spatial distribution, the five cities of Shenyang, Chaoyang, Jinzhou, Dalian, and Anshan had higher emissions of non-point source pollution TN and TP, all of which were in the top seven in terms of total output values of agriculture, forestry, animal husbandry, and fishery in the province in that year. This indicates that the TN and TP emissions of non-point source pollution in the region are directly related to the local level of agricultural development. The use of pesticides and fertilizers, as well as the discharge of household waste and livestock manure, can all cause non-point source pollution in the process of agricultural development. The total emissions of TN and TP from non-point source pollution in the five cities account for 59.27% and 60.19% of the total TN and TP emissions in the province, respectively. Yang Yujie (2015) pointed out that in 2012, the emissions of TN and TP in Liaoning Province were 263,900 t and 35,400 t, respectively [22]. It can be seen that compared with 2012, the non-point source pollution emissions in Liaoning Province have a downward trend, with TN and TP emissions decreasing by 18.3 thousand t and 12.2 thousand t, respectively. This is closely related to the implementation of a series of pollution prevention and control action plans and work plans issued by the Liaoning Provincial People’s Government and relevant departments, except for Dalian, Huludao, Yingkou, Dandong, and Panjin in Liaoning Province, which have TN and TP emissions in the order of livestock and poultry breeding > rural life > aquaculture > agricultural land, and the other nine cities in Liaoning Province have TN and TP emissions in the order of livestock and poultry breeding > rural life > agricultural land > aquaculture. This is mainly because Dalian, Huludao, Yingkou, Dandong, and Panjin are all coastal cities and are the main production areas in terms of aquatic products, among which Dalian’s aquaculture TN and TP emissions are much higher than other cities, with TN and TP emissions from aquaculture reaching 35.754 million t and 5.841 million t, respectively. Its total fishery output value accounts for 56.5% of the province’s total fishery output value, ranking first in Liaoning Province and far higher than other cities. It is an important fishery production base and distribution center for aquatic products in northern China. To sum up, we believe that the emissions of TN and TP from non-point sources are directly related to the local agricultural development level. Generally speaking, the higher the local agricultural development level, the more serious non-point source pollution.
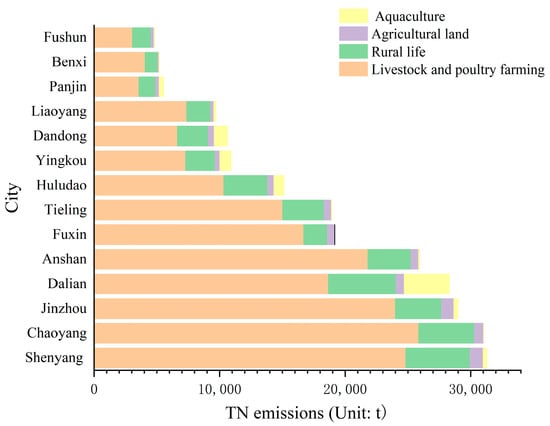
Figure 2.
TN emissions from non-point source pollution in each city of Liaoning Province in 2019 (unit: t).
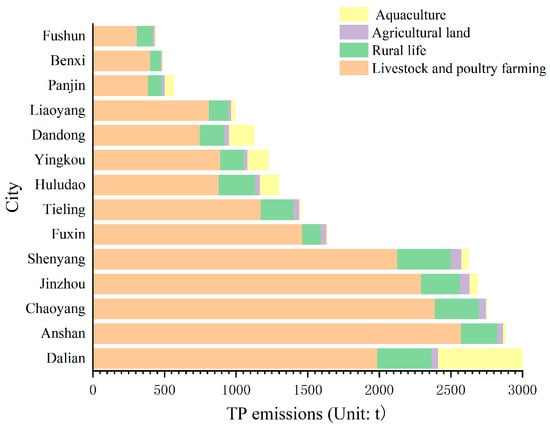
Figure 3.
TP emissions from non-point source pollution in each city of Liaoning Province in 2019 (unit: t).
3.1.2. Contribution of Different Pollution Source Types to TN and TP Emissions
In 2019, the emissions of TN and TP from livestock and poultry breeding in Liaoning Province were 189,300 t and 18,500 t, respectively, and the main non-point source pollution sources of 14 prefecture-level cities were livestock and poultry breeding industry, of which, the top five emissions of TN and TP were Chaoyang (TN25,900 t; TP2,390 t), Shenyang (TN24,800 t; TP2,130 t), Jinzhou (TN24,000 t; TP2,300 t), Anshan (TN21,800 t; TP2,570 t), and Dalian (TN18,700 t; TP1,990 t), and it was consistent with the top five of TN and TP emissions and they were the main contributors of non-point source pollution in Liaoning Province. The top five emissions of TN and TP from agricultural land were also Shenyang (TN1049.82 t; TP72.70 t), Jinzhou (TN972.79 t; TP67.56 t), Chaoyang (TN725.78 t; TP50.40 t), Dalian (TN661.74 t; TP45.95 t), and Anshan (TN598.90 t; TP41.59 t). The top five cities in terms of TN and TP emissions from aquaculture were Dalian (TN3575.40 t; TP584.10 t), Dandong (TN1058.48 t; TP172.92 t), Yingkou (TN884.76 t; TP144.54 t), Huludao (TN786.18 t; TP128.44 t), and Panjin (TN361.58 t; TP59.07 t), all of which were coastal cities suitable for the growth and reproduction of fish. In the process of aquaculture production, the use of bait and fishing drugs can cause non-point source pollution; Dalian (TN5388.18 t; TP379.52 t), Shenyang (TN5113.00 t; TP376.24 t), Chaoyang (TN4437.15 t; TP306.82 t), Jinzhou (TN3684.67 t; TP271.14 t), and Huludao (TN3490.79 t; TP253.87 t) rank among the top five in terms of TN and TP emissions from rural life, which were positively correlated with the rural population. Although Dalian had the third largest rural population in Liaoning Province, its rural life had the highest emission coefficient, so the ranking of TN and TP emissions from rural life in Dalian had increased.
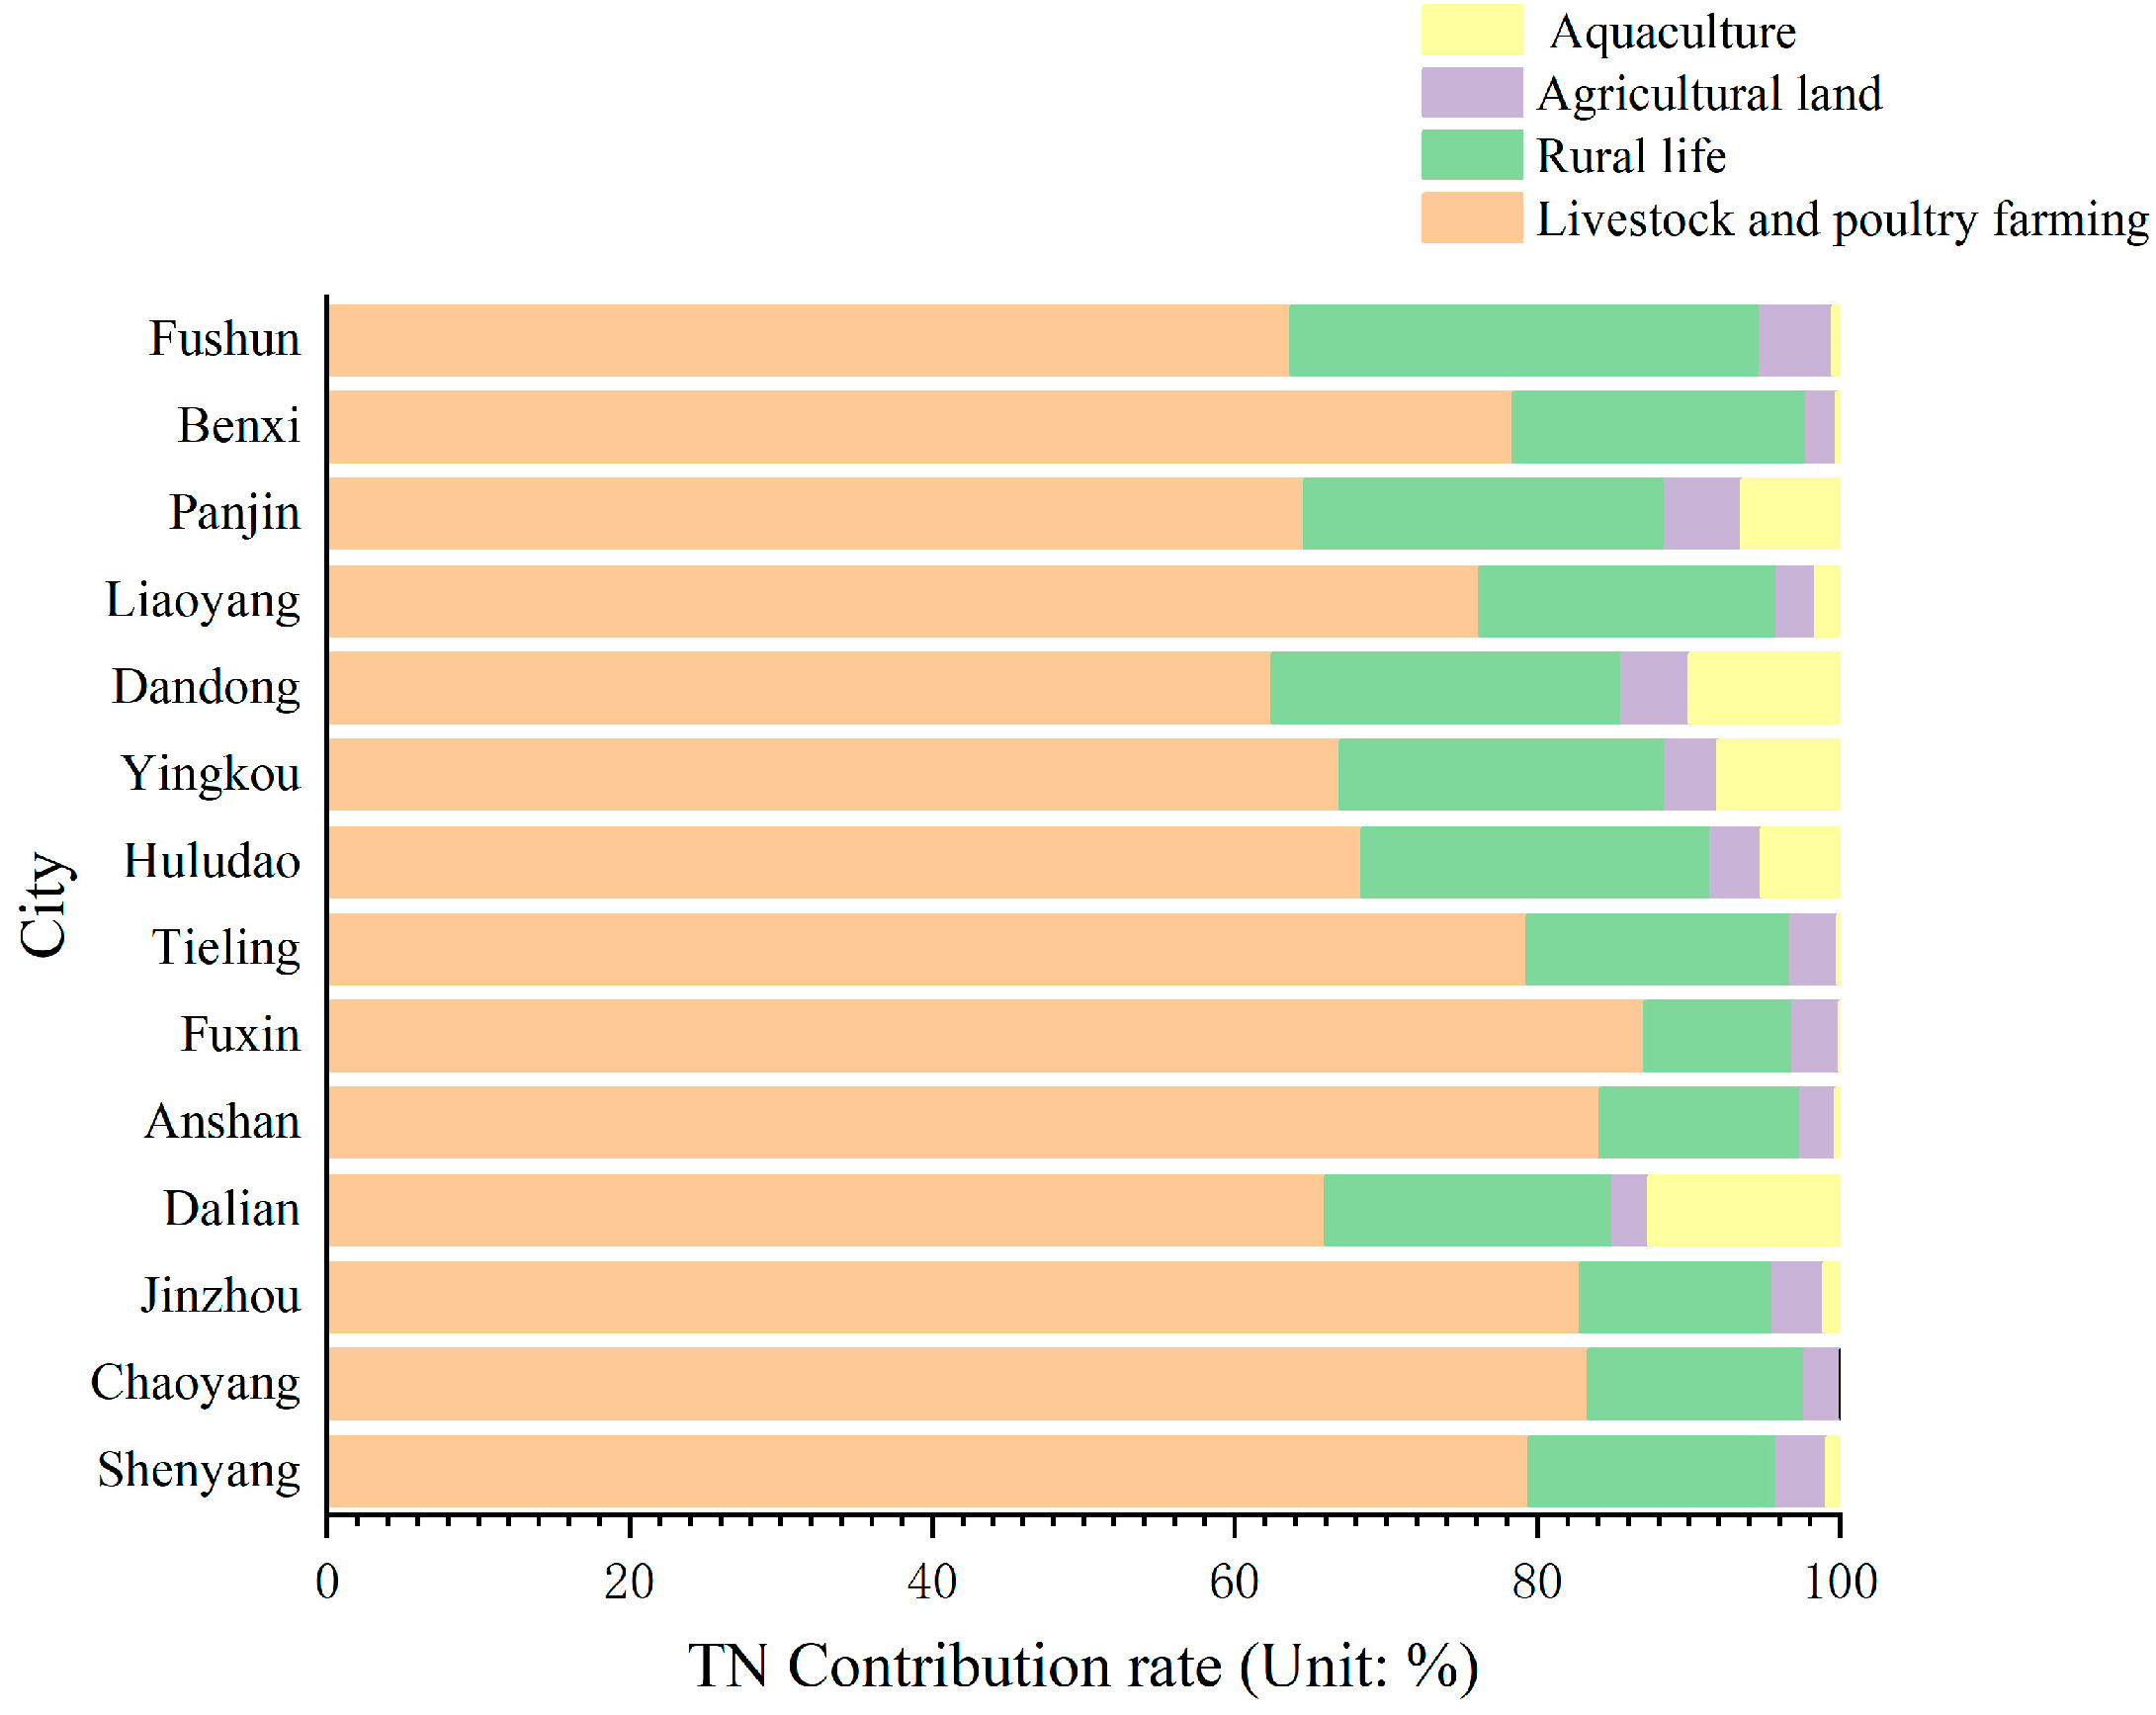
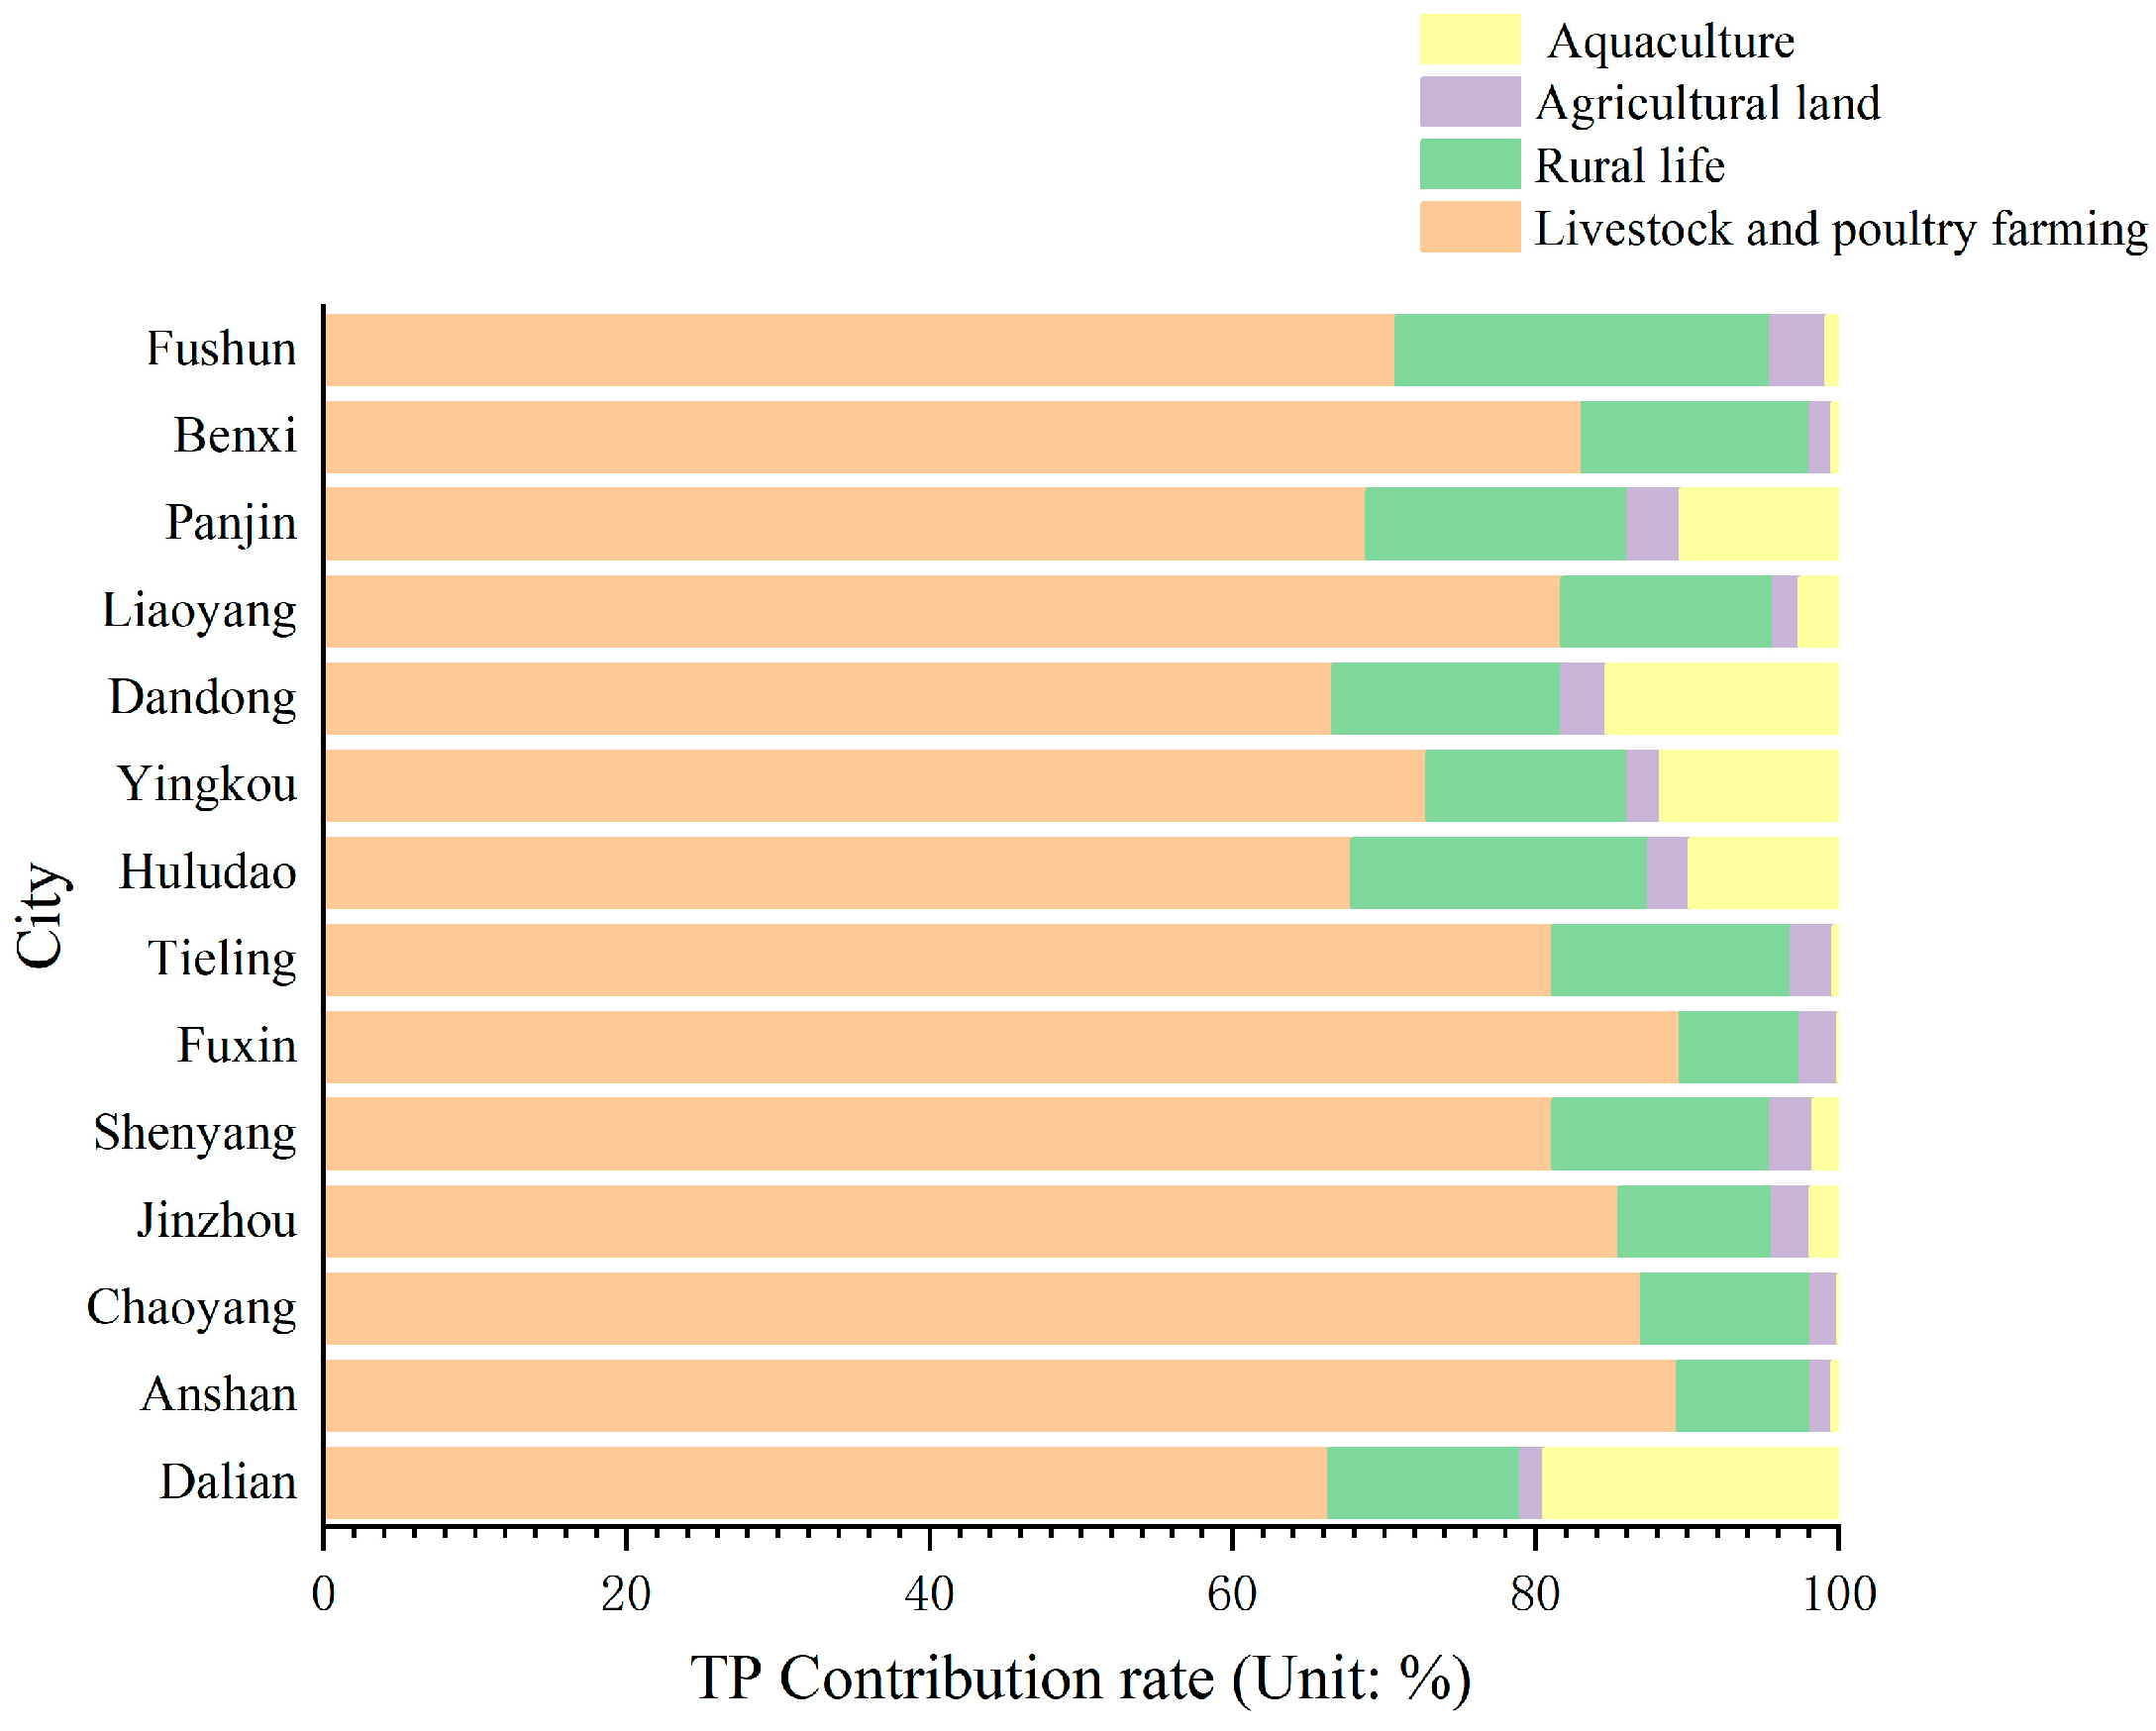
Figure 4 and Figure 5, respectively, show the contribution rates of different non-point source pollution types to TN and TP in each city of Liaoning Province in 2019. From the figures, we can see that the order of contribution rates of the four types of pollution sources to TN in Liaoning Province is livestock and poultry farming (77.11%) > rural life (16.81%) > aquaculture (3.08%) > agricultural land (3.00%). The order of contribution rates to TP is also livestock and poultry farming (79.71%) > rural life (12.74%) > aquaculture (5.34%) > agricultural land (2.21%). Moreover, the contribution rate of livestock and poultry breeding to non-point source pollution is much higher than the other three types of pollution sources, which is consistent with the research results of Wang Siru (2021), which showed that non-point source pollution in Liaoning Province was led by livestock and poultry breeding industry [31]. In summary, it can be seen that reducing emissions from livestock and poultry farming may be the primary task to reduce the non-point source pollution load in Liaoning Province.
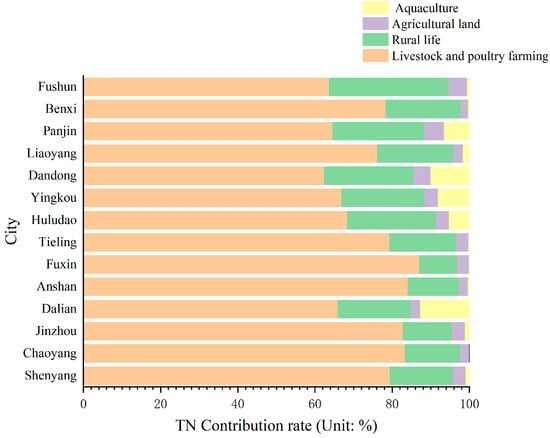
Figure 4.
Contribution rates of different non-point source pollution types to TN in different cities of Liaoning Province in 2019 (unit: %).
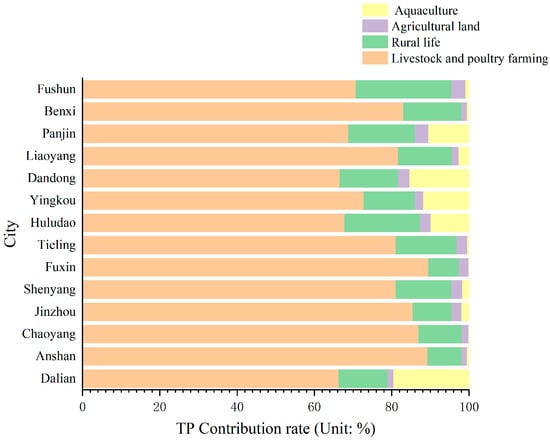
Figure 5.
Contribution rates of different non-point source pollution types to TP in different cities of Liaoning Province in 2019 (unit: %).
3.2. Pollution Level Analysis
3.2.1. Analysis of Pollution Load Coefficient per Unit Area
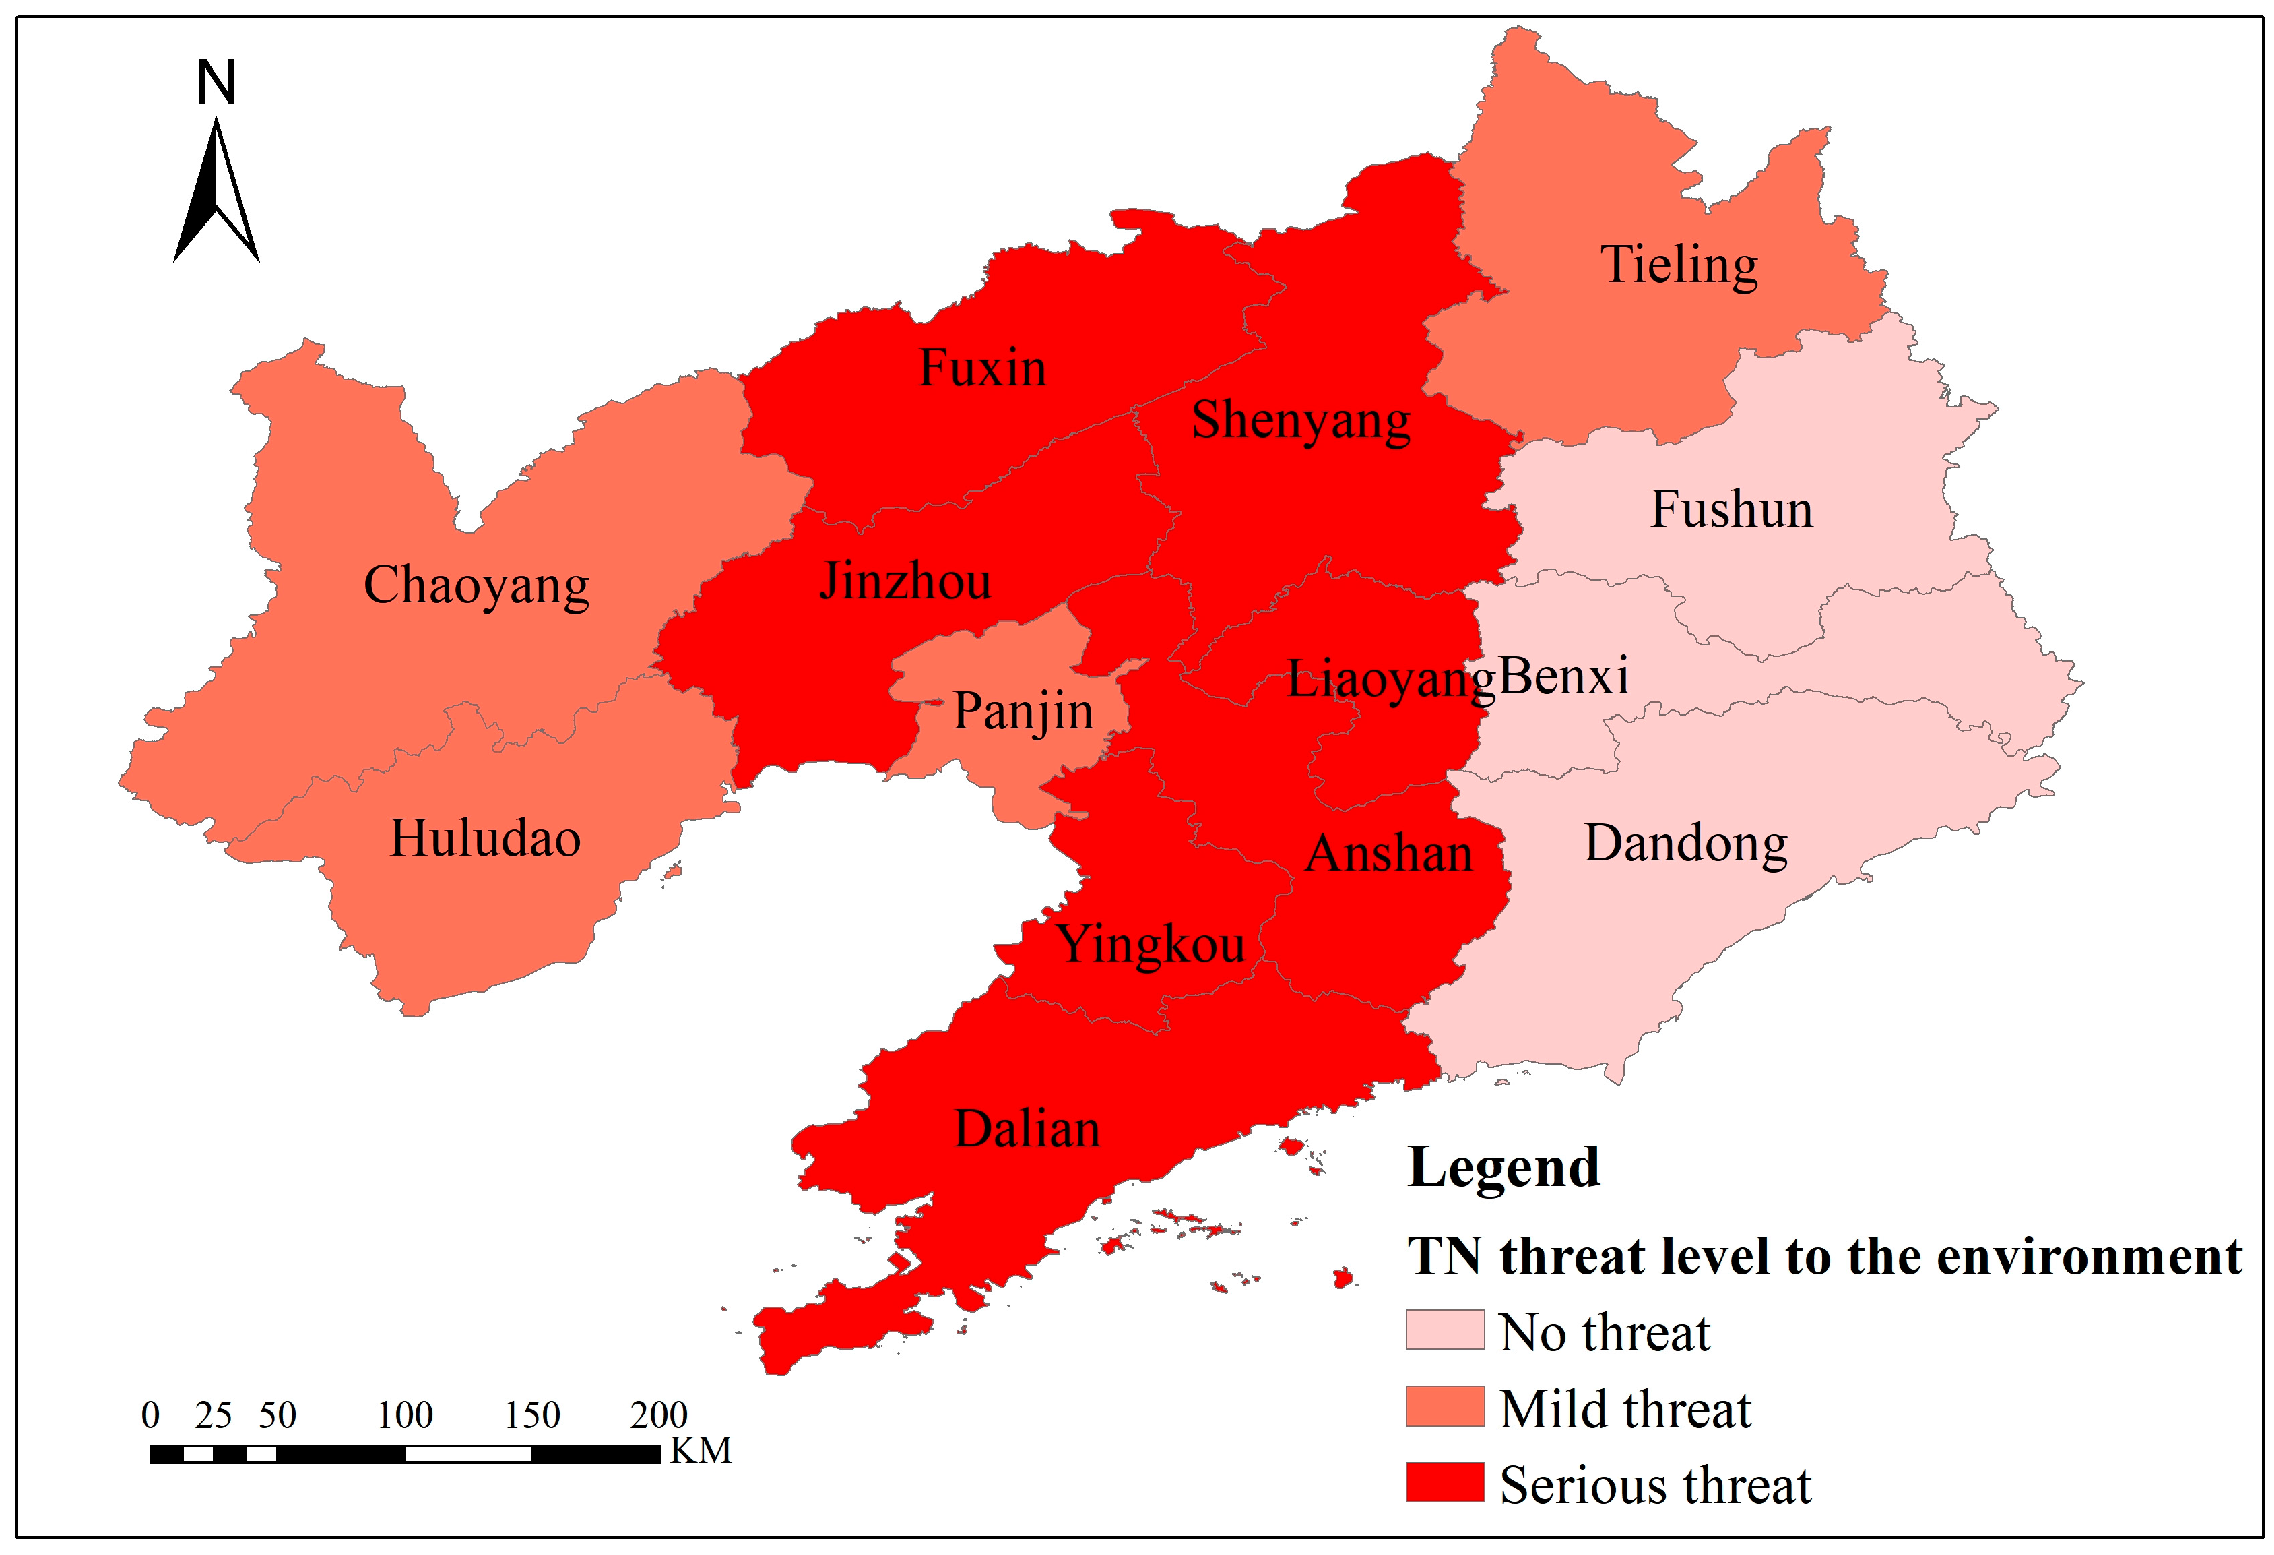
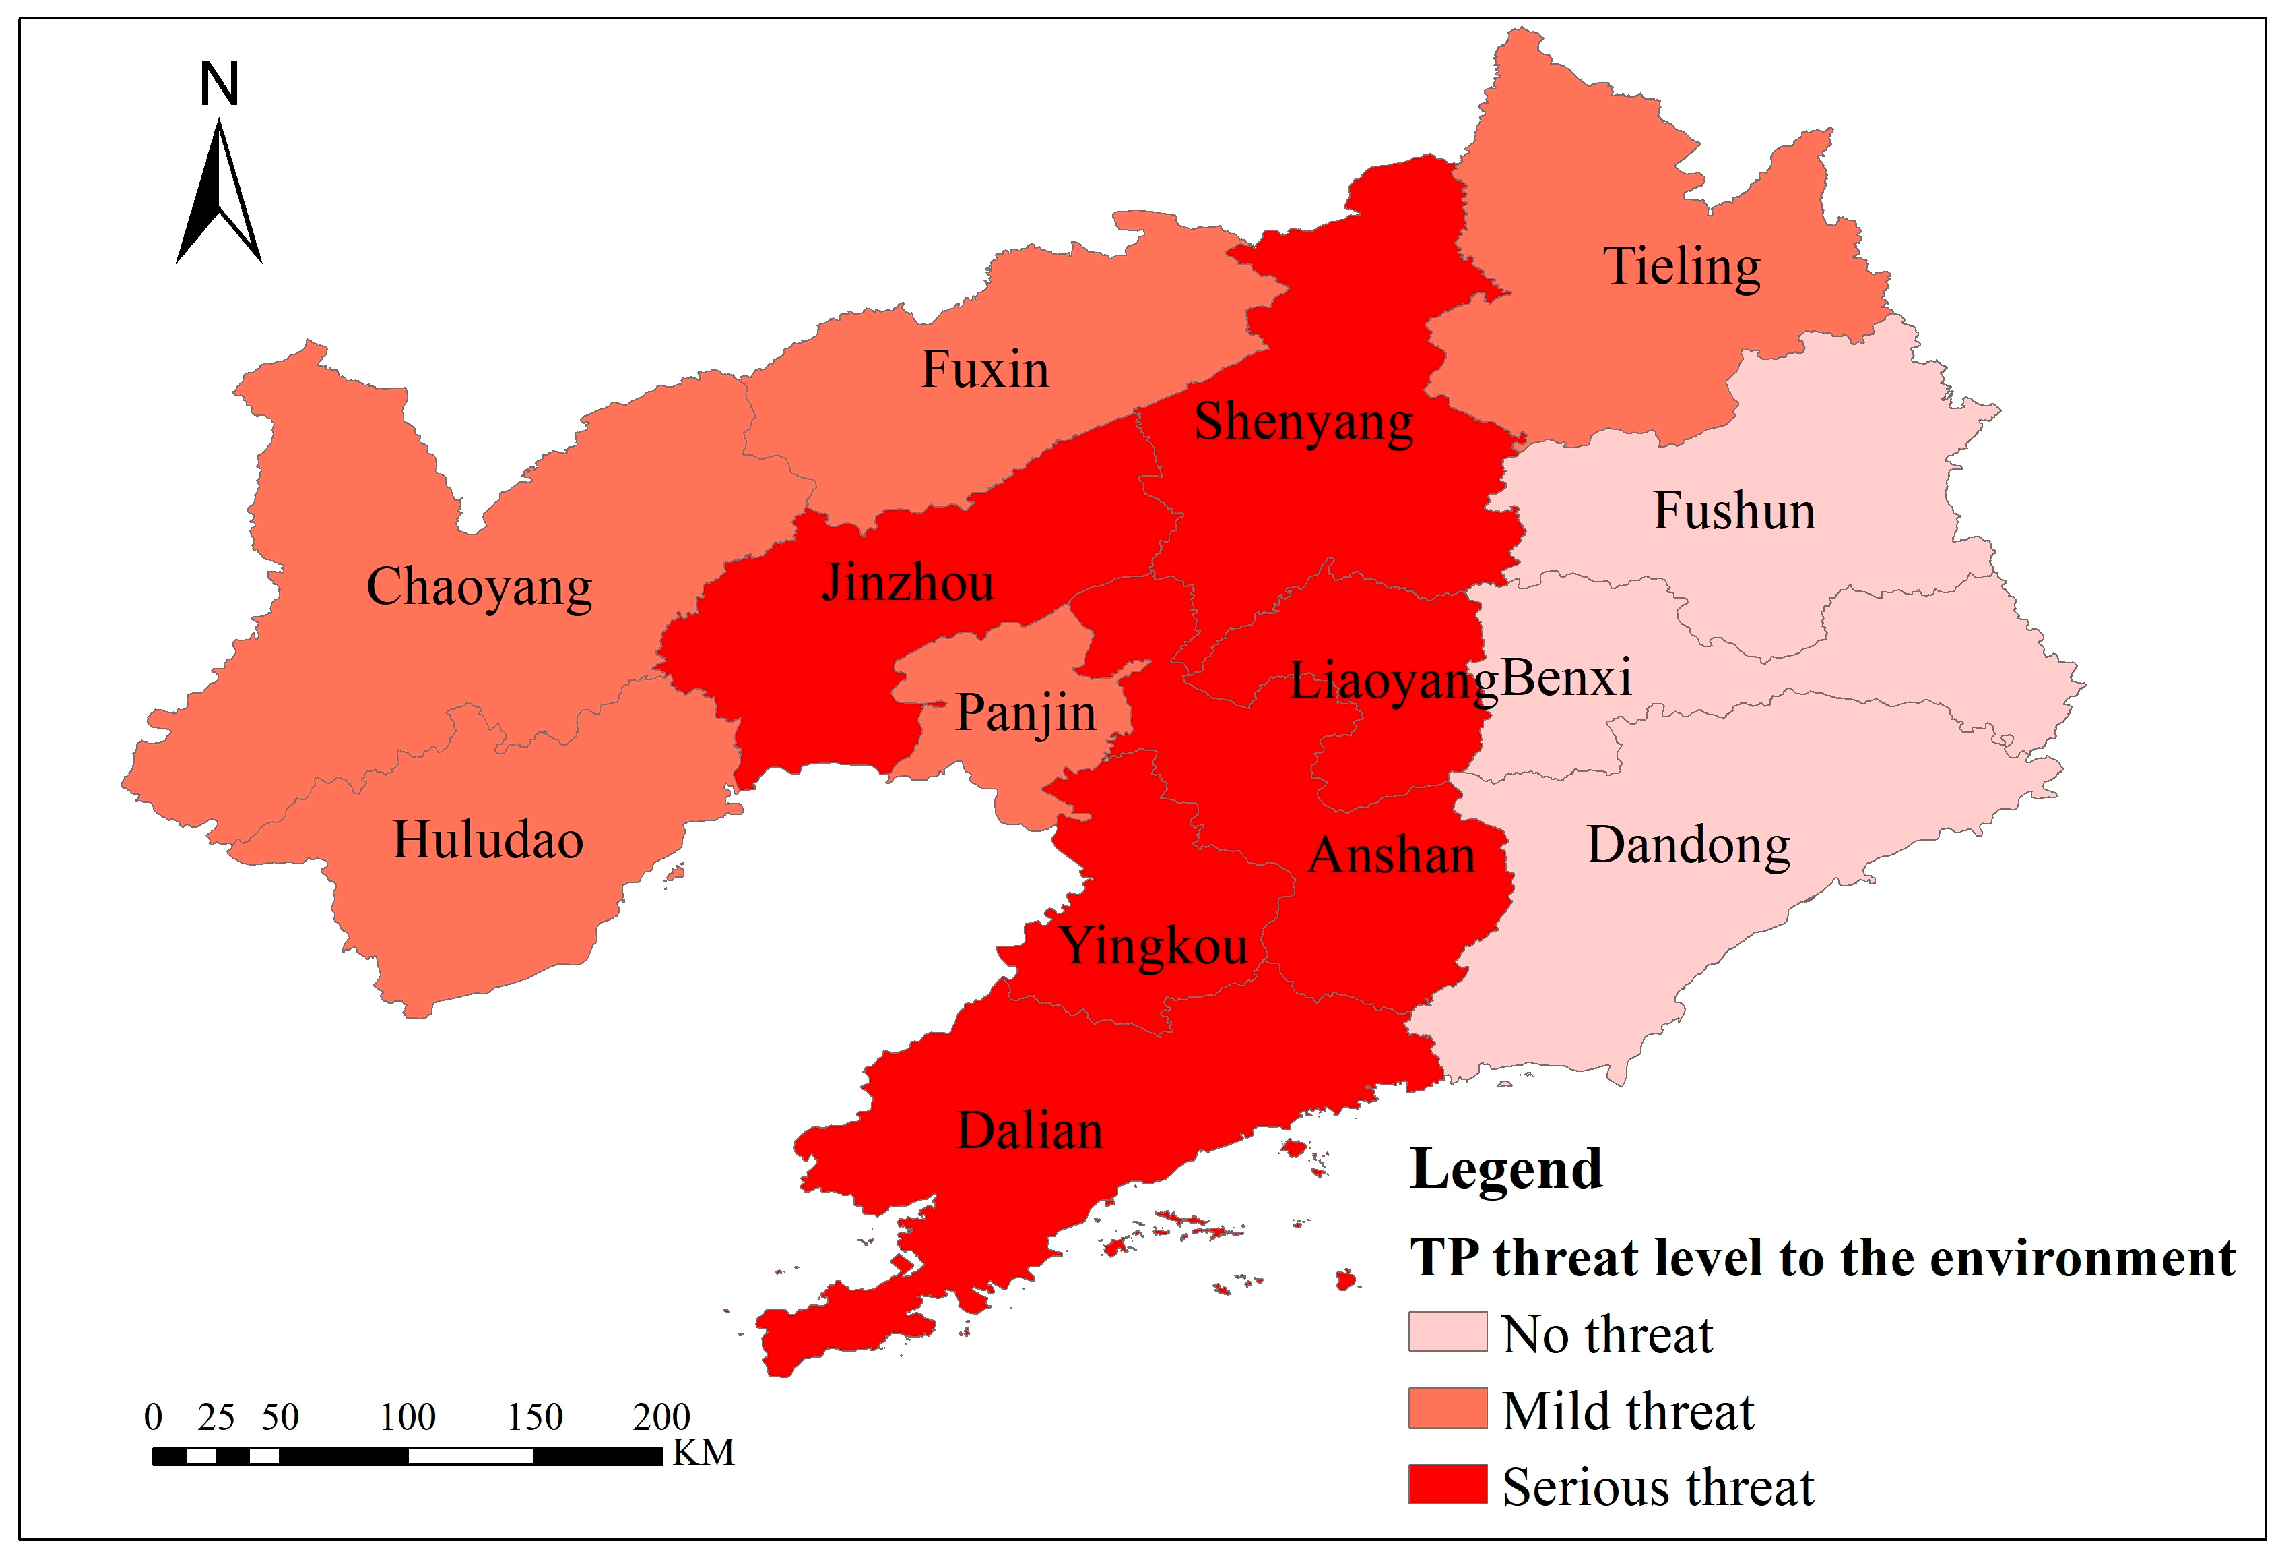
In order to explore the threat level of TN and TP pollution load to the environment, the unit area pollution load coefficient is introduced for analysis. The analysis results of the unit area pollution load coefficient of each city in Liaoning Province in 2019 are shown in Figure 6 and Figure 7. The results show that except for Fuxin, the spatial distribution of TN and TP threat to the environment in other cities was basically the same. The TP pollution load in Fuxin City posed a mild threat to the environment, while the TN pollution load posed a serious threat. The central region (Shenyang, Liaoyang, Anshan), the southern region (Yingkou, Dalian), and the Jinzhou TN and TP located in the west pose serious threats to the environment. The TN and TP in the eastern mountainous areas (Fushun, Benxi, Dandong) did not pose a threat to the environment. Tieling in the northeast and Chaoyang, Huludao, and Panjin in the west posed a mild threat to the environment. The eastern and western parts of Liaoning Province are mountainous and hilly areas, while the central part is plain. The population in plain areas is higher than that in other areas, thus pollution will be more severe. Moreover, pollutants in the mountainous and hilly areas will flow to the plain area with surface and underground runoff, resulting in more severe pollution in plain areas located in the central part and relatively light non-point source pollution in mountainous and hilly areas.
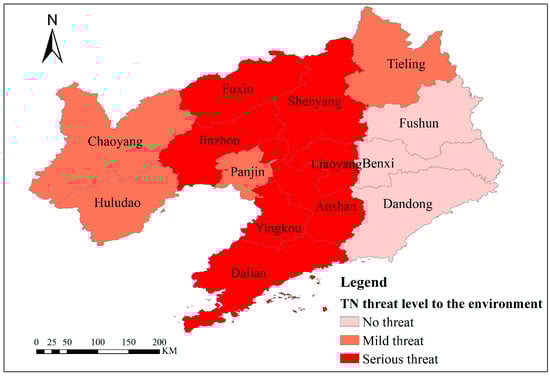
Figure 6.
Environmental threat level of TN in each city of Liaoning Province in 2019.

Figure 7.
Environmental threat level of TP in each city of Liaoning Province in 2019.
3.2.2. Analysis of Equal Standard Pollution Load Index
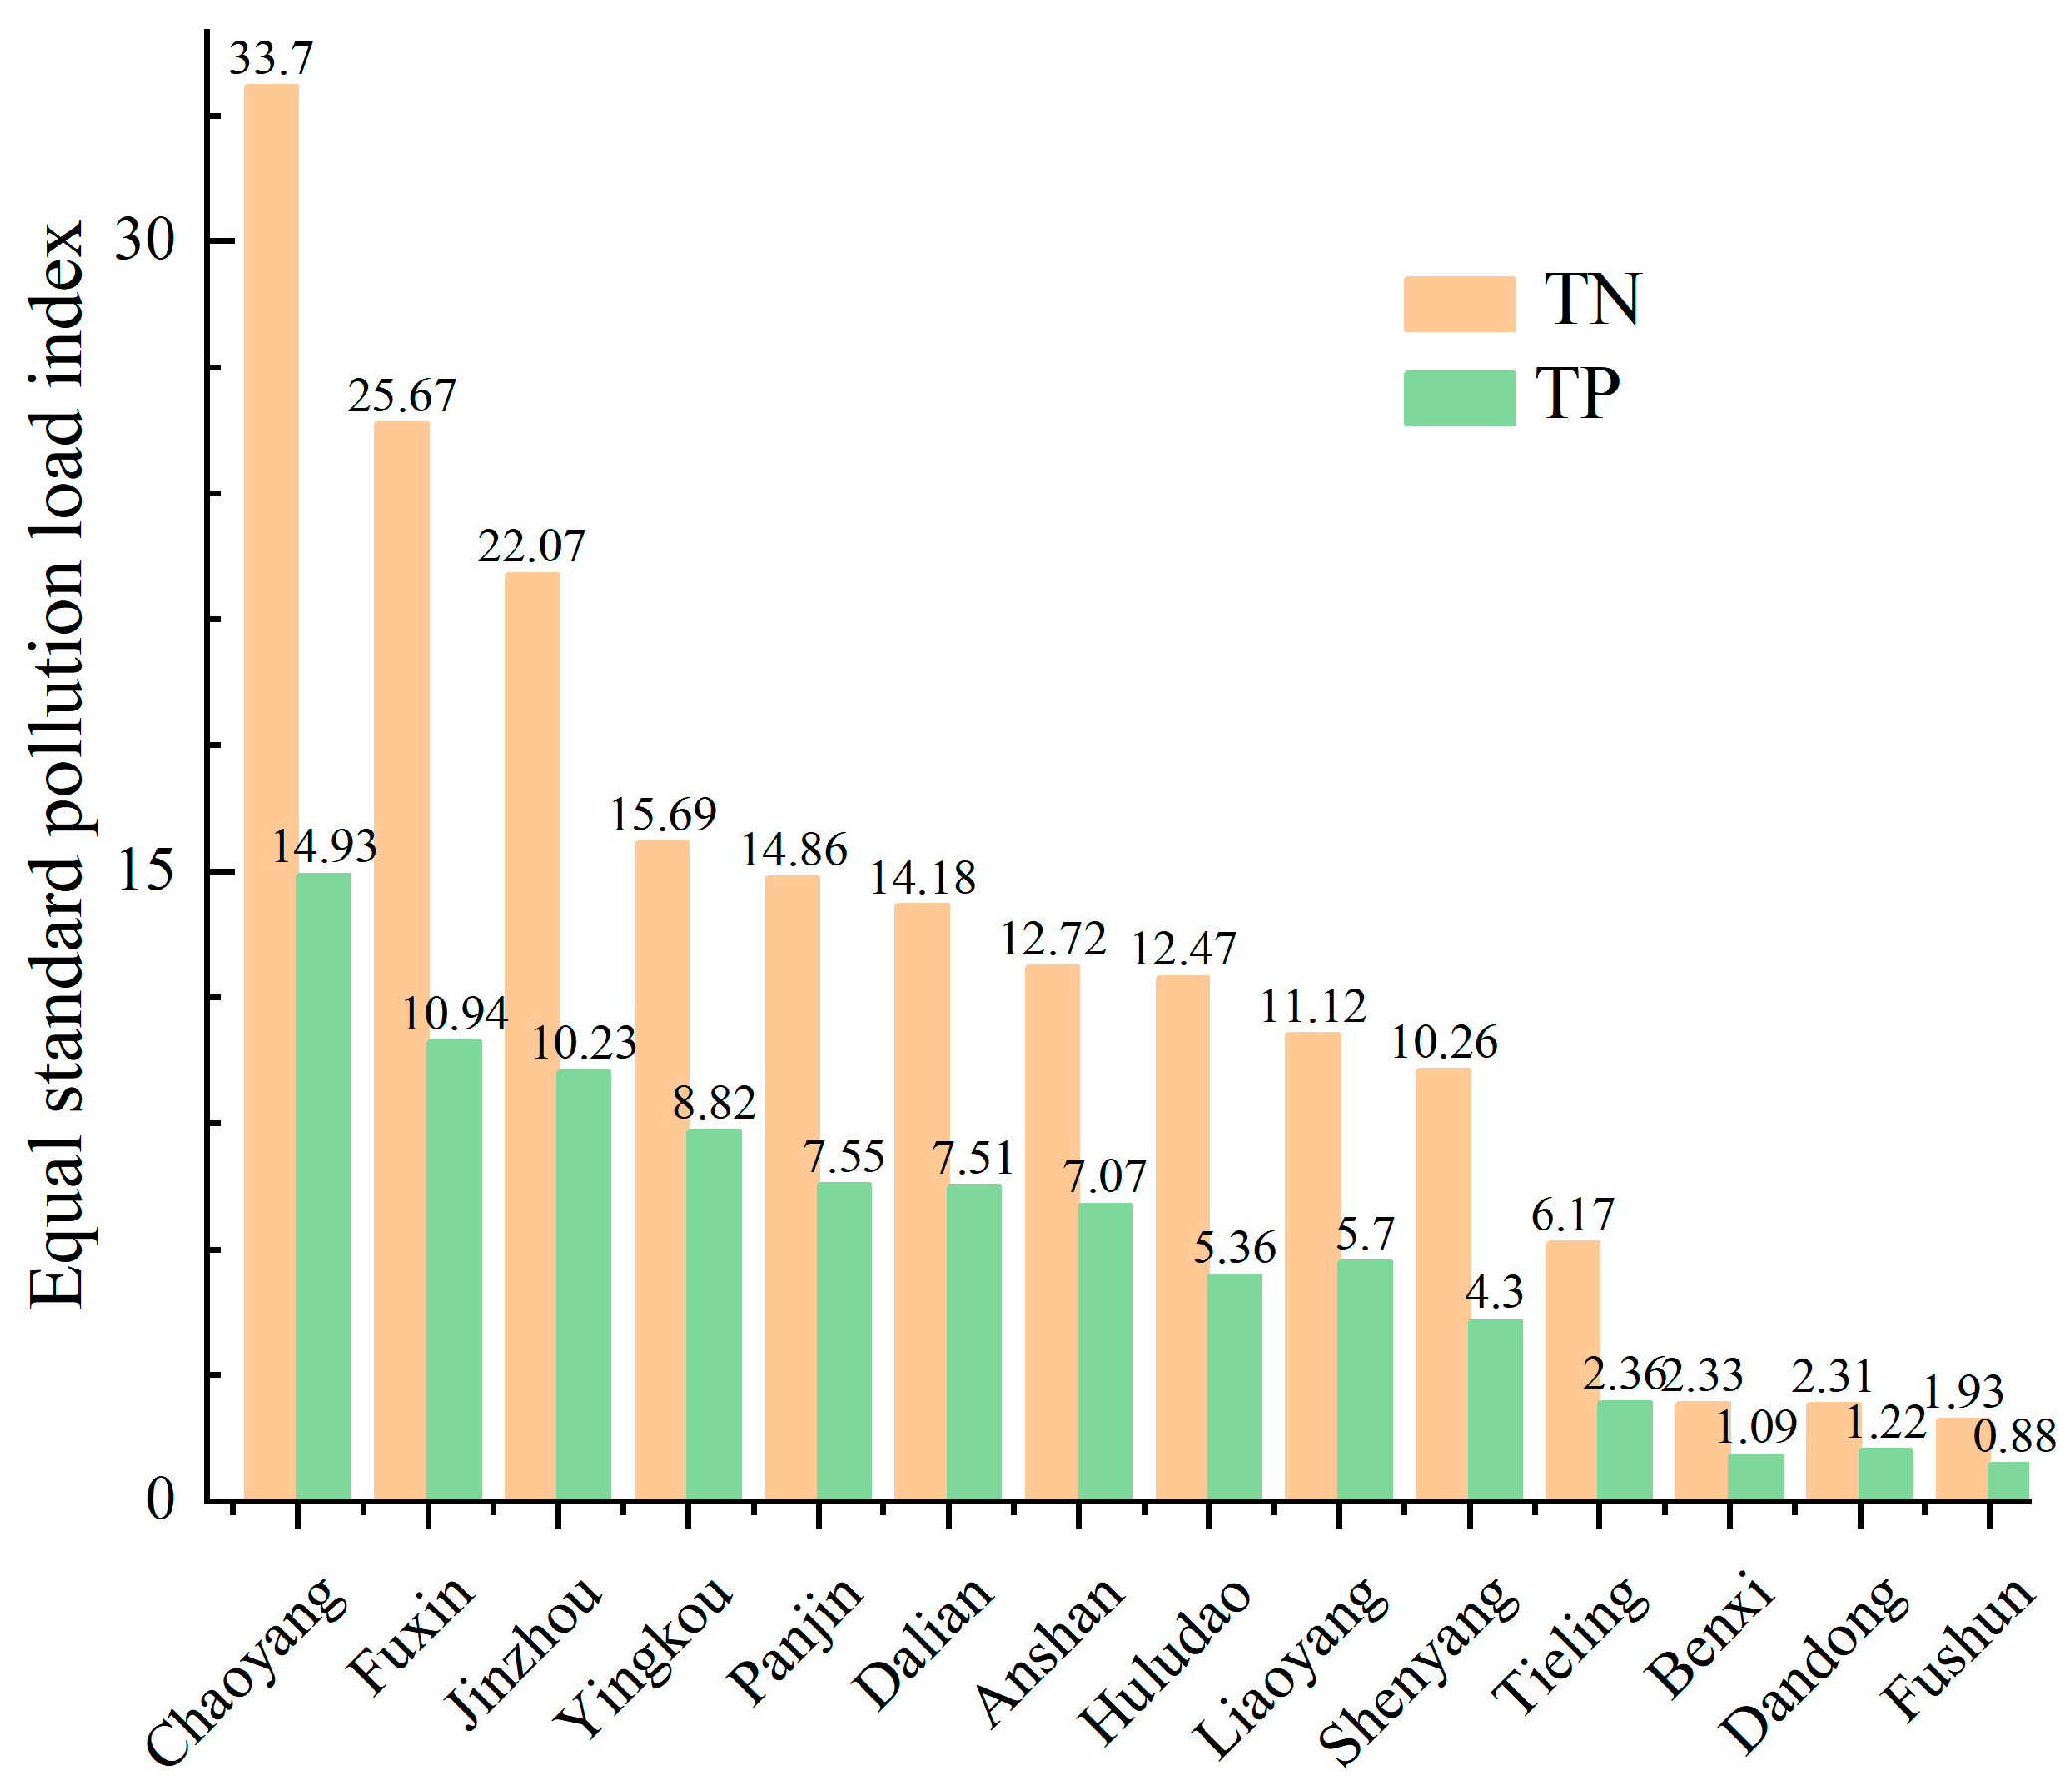
In 2019, the total amount of standard pollution load in Liaoning Province was 361.269 billion m3, the proportions of TN and TP were 67.96% and 32.04%, respectively, and the equal standard pollution load of TN in each city and pollution source was higher than that of TP, indicating that TN was the main source of non-point source pollution in Liaoning Province. In order to explore the relative pollution levels among different cities in Liaoning Province, the equal standard pollution load index is introduced for analysis. The TN and TP equal standard pollution load indices of each city in Liaoning Province in 2019 are shown in Figure 8. It can be seen that the ranking results of the TN and TP equal standard pollution load indices and non-point source pollution emissions are completely different. The TN and TP equal standard pollution load indices vary greatly among different cities, and the ranking of the TN and TP equal standard pollution load indices in each city is consistent, the correlation coefficient is 0.985. The average TN standard pollution load index is 13.25, with Chaoyang (33.70), Fuxin (25.67), Jinzhou (22.07), Yingkou (15.69), Panjin (14.86), and Dalian (14.18) exceeding the provincial average. The average TP equivalent pollution load index is 6.28, with Chaoyang (14.93) > Fuxin (10.94) > Jinzhou (10.23) > Yingkou (8.82) > Panjin (7.55) > Dalian (7.51) > Anshan (7.07) exceeding the provincial average. The TN and TP emissions and emission intensity of Yingkou and Panjin are significantly lower than the provincial average level, but their equivalent pollution load index is above the average level, which is directly related to the fact that their total water resources are in the last two places in the province. The equal standard pollution load index of Chaoyang is much higher than that of other cities, and Chaoyang should be a key area in subsequent non-point source pollution control. The emissions and intensity of TN and TP in Shenyang and Anshan are higher than the provincial average, but their equal standard pollution load index was lower than the provincial average. The main reason is that Shenyang and Anshan have relatively abundant water resources, and under the same pollution emissions, the pollution level is relatively light, making the dilution effect on pollution more significant.
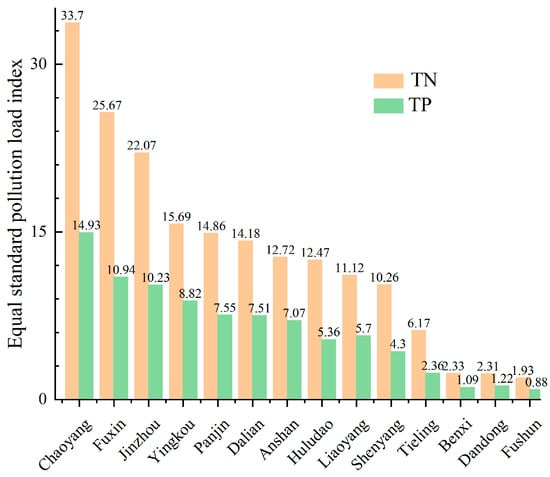
Figure 8.
The TN and TP equal standard pollution load indices of each city in Liaoning Province in 2019.
The unit area pollution load coefficient explores the degree of threat to the environment, and its calculation method is directly related to the area of each city’s administrative region. The comparison of the equal standard pollution load index is the relative pollution level between different cities, and its calculation method is directly related to the total water resources of each city. By comparing the results of the pollution load coefficient per unit area and the equal standard pollution load index, it can be seen that their distribution characteristics are not the same. For example, TN and TP in Shenyang seriously threaten the environment, while the TN and TP equal standard pollution load indices are relatively small. This is mainly because although TN and TP emissions in Shenyang are relatively large, the total water resources in Shenyang are relatively large. Due to the dilution effect of water on pollution, its standard pollution load index is relatively small. TN and TP in Chaoyang do not pose a serious threat to the environment, but their TN and TP equal standard pollution load indices are the highest. The main reason for this is that although the contribution rate of Chaoyang TN and TP pollution load is relatively high, its total water resources are relatively small. It can be seen that abundant water resources play a crucial role in reducing pollution levels. Nevertheless, it is difficult for us to change the total amount of water resources. The only thing we can do is to minimize the sources of pollution as much as possible. Through the above analysis, it can be seen that the livestock and poultry industry has the greatest impact on non-point source pollution in Liaoning Province. Therefore, compared to controlling the application of fertilizers and pesticides, controlling rural sewage discharge and waste stacking, effective prevention and control of livestock manure is obviously more effective in reducing non-point source pollution. Improving the management level of the livestock and poultry industry is the key to the control of non-point source pollution in Liaoning Province. In addition, Chaoyang should become a critical area for the prevention and control of non-point source pollution in the future.
4. Conclusions
This paper uses the pollution discharge coefficient method, the unit area pollution load coefficient method, and the equal standard pollution load method to estimate the non-point source pollution load, equal standard pollution load, and spatial distribution of Liaoning Province in 2019. The results indicate that:
- (1)
- The TN and TP emissions in Liaoning Province in 2019 were 245.6 thousand t and 23.2 thousand t, respectively. The corresponding equivalent pollution loads were 245.515 billion m3 and 115.754 billion m3, respectively. TN is the main source of non-point source pollution in Liaoning Province. The five cities with the highest contribution rate of pollutant load are Shenyang, Chaoyang, Jinzhou, Dalian and Anshan. The emissions of TN and TP from non-point sources are directly related to the level of local agricultural development level.
- (2)
- The order of contribution rates of the four types of pollution sources to TN in Liaoning Province is livestock and poultry farming (77.11%) > rural life (16.81%) > aquaculture (3.08%) > agricultural land (3.00%). The order of contribution rates to TP is also livestock and poultry farming (79.71%) > rural life (12.74%) > aquaculture (5.34%) > agricultural land (2.21%). It can be seen that the contribution rate of livestock and poultry breeding to surface source pollution is much higher than the other three types of pollution sources.
- (3)
- Except for Fuxin, the spatial distribution of TN and TP threat levels to the environment in other cities is basically consistent. Overall, pollution in the central and western regions is more serious than that in the eastern regions, while pollution in the plain areas is worse than that in the mountainous and hilly areas. Comparing the relative pollution levels of each city, Chaoyang City should be a key focus for the prevention and control of non-point source pollution in Liaoning Province, and the abundant total water resources play a crucial role in reducing pollution levels.
- (4)
- Due to the large study area, we used estimation methods to calculate the non-point source pollution load. In the estimation process, we inevitably ignore some factors. This study overlooked factors that affect the concentration of pollutants in drainage, such as soil type, the amount of leached water, and the fate of pollutants during their migration in the soil. These may have a small impact on the non-point source pollution load, but it is difficult to affect the spatial distribution results of non-point source pollutants in Liaoning Province. In subsequent studies, more accurate methods may be explored for estimation. In addition, due to our lack of long-term monitoring data, we are unable to verify our results through traditional monitoring methods. However, due to the widespread application of this method, we believe that the results are reliable. In future studies, we will add traditional monitoring methods to a small part of the study area to achieve the support of long-term data series.
- (5)
- The results of this study provide a scientific decision-making basis for the prevention and control of non-point source pollution in Liaoning Province. The impact of the terrain and total water resources of each city on surface water pollution is difficult to amend via human intervention, but the impact can be reduced by optimizing the treatment of livestock and poultry manure. Therefore, improving the management level of the livestock and poultry breeding industry is the key to the current control of non-point source pollution in Liaoning Province.
Author Contributions
Conceptualization, B.Y. and Z.G.; methodology, Q.C.; software, Q.C.; validation, Q.C., D.L. and Y.L.; formal analysis, Q.C.; investigation, D.L.; re-sources, Y.L.; data curation, S.Y.; writing—original draft preparation, Q.C.; writing—review and editing, B.Y.; visu-alization, B.Y.; supervision, Z.G.; project administration, B.Y.; funding acquisition, B.Y. All authors have read and agreed to the published version of the manuscript.
Funding
This research was funded by [Liaoning Provincial Department of Education Scientific Research] grant number [LJKZ0696].
Data Availability Statement
The authors would like to express their sincere thanks for the data support provided by the Liaoning Provincial Bureau of Statistics.
Acknowledgments
We gratefully acknowledge the Liaoning Provincial Bureau of Statistics for the data, and the Liaoning Provincial Department of Education for their financial support.
Conflicts of Interest
The authors declare no conflict of interest.
References
- Xiang, C.; Wang, Y.; Liu, H.A. Scientometrics review on nonpoint source pollution research. Ecol. Eng. 2017, 99, 400–408. [Google Scholar] [CrossRef]
- Bulletin of the Second National Pollution Source Census Environmental Protection. Available online: https://www.mee.gov.cn/home/ztbd/rdzl/wrypc/zlxz/202006/t20200616_784745.html (accessed on 18 May 2021).
- Li, X.; Shang, J. Spatial interaction effects on the relationship between agricultural economic and planting non-point source pollution in China. Environ. Sci. Pollut. Res. 2023, 30, 51607–51623. [Google Scholar] [CrossRef] [PubMed]
- Hou, L.; Zhou, Z.Y.; Wang, R.Y.; Li, J.X.; Dong, F.; Liu, J.Q. Research on the Non-Point Source Pollution Characteristics of Important Drinking Water Sources. Water 2022, 14, 211. [Google Scholar] [CrossRef]
- World Publishing Corporation. Environmental Pollution and Control; World Publishing Corporation: Cleveland, OH, USA, 2003; ISBN 9787519224592. [Google Scholar]
- Lam, Q.D.; Schmalz, B.; Fohrer, N. Assessing the spatial and temporal variations of water quality in lowland areas, Northern Germany. J. Hydrol. 2012, 438–439, 137–147. [Google Scholar] [CrossRef]
- Tu, H.Z.; Hou, Y.; Chen, W.P. Simulation of non-point source pollution in Weizigou watershed with AnnAGNPS model. J. Agro-Environ. Sci. 2017, 36, 1345–1352. [Google Scholar]
- Yang, Y.F. Simulation of Non-Point Source Pollution in Yixing Plain River Network Based on HSPF Model. Master’s Thesis, Xi’an University of Architecture and Technology, Xi’an, China, 2015. [Google Scholar]
- Zhao, L. Analysis of Estimation of Water Environmental Non point Source Pollution Load. Environ. Devel. 2018, 30, 57+59. [Google Scholar]
- Li, S.; Li, J.k.; Hao, G.R. Estimation and Assessment of Non Point source pollution Load in Danhan River Basin, Shaanxi Province. Environ. Sci. Technol. 2020, 43, 243–249. [Google Scholar]
- Zhang, C.L.; Liu, Z.S.; Zhang, G.C. Research on Agricultural Non point Source Ammonia Nitrogen Load in Henan Province Based on Output Coefficient Method. China Rural. Water Resour. Hydropower 2017, 420, 35–39. [Google Scholar]
- Liu, L.X.; Ao, T.Q.; Hu, Z.; Hu, F.C.; Li, M.R. Comprehensive evaluation of water quality and non-point source pollution in the Qiongjiang River Basin (Anju section). Int. Soil Water Conserv. 2019, 26, 372–376. [Google Scholar]
- Li, X.L.; Ao, T.Q. Research and comprehensive assessment of agricultural non-point source pollution load in river basins lacking data. Renmin Changjiang River 2016, 47, 6–11. [Google Scholar]
- Dai, W. Measurement and characteristic analysis of agricultural non-point source pollution in Beidaihe and adjacent coastal waters. J. Henan Agric. Sci. 2013, 42, 58–61. [Google Scholar]
- Chen, W.Q.; Yang, Q.B.; Yang, B. Calculation of total phosphorus emissions in Poyang lakeside area based on the production and discharge coefficient method. Environl. Poll. Control 2022, 44, 960–965. [Google Scholar]
- Xie, J.Z.; Zhao, X.L.; He, B.H.; Li, Z.A. Analysis on the characteristics of nitrogen and phosphorus emissions from agricultural non-point source pollution in the Hanfeng Lake Basin. Chin. J. Environ. Sci. 2019, 40, 1760–1769. [Google Scholar]
- Shi, X.C.; Ao, T.Q.; Li, X.D.; Wang, W.Z.; Yang, W. Comprehensive evalution on the non-point source pollution of Fujiang Basin (Shehong Territory). Res. Soil Water Conserv. 2018, 25, 375–379. [Google Scholar]
- Ma, G.W.; Wang, S.R.; Wang, Y.Y.; Zuo, D.P.; Yu, Y.; Xiang, B. Temporal and spatial distribution characteristics of nitrogen and phosphorus and diffuse source pollution load simulation of Poyang Lake Basin. Acta Sci. Circumst. 2015, 35, 1285–1291. [Google Scholar]
- Li, J.K.; Li, H.E.; Dong, W.; Qin, Y.M.; Huang, C.J.; Du, G.F. Monitoring and load estimation of non-point source pollution on typical tributaries in the Guanzhong reach of the Weihe River. Acta Sci. Circumst. 2011, 31, 1470–1478. [Google Scholar]
- Wang, L.; Xiang, B.; Su, B.Y.; Wang, Y.; Fang, G.L.; Hu, Y.; Pan, L.B.; Dai, X. Spatial-temporal variation of agricultural non-point source pollution risk in Beijing-Tianjin Hebei Region, China. J. Agro-Environ. Sci. 2017, 36, 1254–1265. [Google Scholar]
- Hu, J.F. Measurement and spatial feature analysis of agricultural non-point source pollution in Chongqing. Chin. J. Agric. Resour. Reg. Plan. 2017, 38, 135–144. [Google Scholar]
- Yang, Y.J. Research on Pressure Assessment and Treatment Approaches of Agricultural Non point Source Pollution in Liaoning Province. Master’s Thesis, Dalian Maritime University, Dalian, China, 2014. [Google Scholar]
- Zhao, J.R.; Zhao, W.; Zhan, X.H.; Chen, X.M.; Wei, D.Y.; Ma, N.; Sun, M.; Liu, J.H.; Xu, Y. Analysis of the Characteristics of Nitrogen and Phosphorus Emissions from Agricultural Non-Point Sources Pollution and Pollution Risk in Tianjin City, China. IOP Conf. Ser. Earth Environ. Sci. 2020, 440, 042057. [Google Scholar] [CrossRef]
- Zhao, L.H. Analysis on Spatio-Temporal Characteristics and Economic Driving Factors of Agricultural Non-Point Source Pollution in Zhejiang Province. Master’s Thesis, Zhejiang Gongshang University, Hangzhou, China, 2015. [Google Scholar]
- Lin, Y.; Ma, J.; Qin, F. Distribution and Development Prospects of Livestock and Poultry Manure Resources in China. Chin. Agric. Sci. Bull. 2012, 28, 1–5. [Google Scholar]
- Qin, T. Environmental Decentralization, Environmental Regulation and Agricultural Non-Point Source Pollution. Master’s Thesis, Southwest University, Chongqing, China, 2020. [Google Scholar]
- Yang, Q.; Wang, H.R.; Qin, F. Regional differences and distribution dynamics of agricultural non-point source pollution in China: 2001–2015. J. Shandong Financ. Econ. Univ. 2017, 29, 1–13. [Google Scholar]
- Zhang, J.Z. Analysis of Regional Differences and Influencing Factors of Agricultural Non-Point Source Pollution in China. Master’s Thesis, Yunnan University of Finance and Economics, Kunming, China, 2019. [Google Scholar]
- Gong, S.F.; Ding, W.H.; Ju, X.H.; Xiao, N.W.; Ye, Q.S.; Huang, J.; Li, H. Analysis and control strategy of non-point source pollution sources in typical agricultural small watershed-Taking Danjiangkou water conservation area as an example. Sci. Agric. Sin. 2021, 54, 3919–3931. [Google Scholar]
- GB3838-2002; National Standards of the People’s Republic of China, Environmental Quality Standards for Surface Water. State Environmental Protection Administration: Beijing, China, 2002.
- Wang, S.R.; Yang, D.W.; Sun, J.H.; Tang, L.H.; Wang, P.J.; Lu, S.Y. Analysis of the Current Situation and Characteristics of Agricultural Non point Source Pollution in China. Water Resour. Prot. 2021, 37, 140–147+172. [Google Scholar]
Disclaimer/Publisher’s Note: The statements, opinions and data contained in all publications are solely those of the individual author(s) and contributor(s) and not of MDPI and/or the editor(s). MDPI and/or the editor(s) disclaim responsibility for any injury to people or property resulting from any ideas, methods, instructions or products referred to in the content. |
© 2023 by the authors. Licensee MDPI, Basel, Switzerland. This article is an open access article distributed under the terms and conditions of the Creative Commons Attribution (CC BY) license (https://creativecommons.org/licenses/by/4.0/).