Article

Pontastacus leptodactylus (Eschscholtz, 1823) and Faxonius limosus (Rafinesque, 1817) as New, Alternative Sources of Chitin and Chitosan

1
Department of Marine Ecology, University of Gdańsk, 80-309 Gdańsk, Poland
2
Department of Drug Sciences, University of Pavia, 27100 Pavia, Italy
3
Centre for Marine Sciences (CCMAR), Faculty of Science and Technology, Universidade do Algarve, 8005-139 Faro, Portugal
4
Centre for Electronics, Optoelectronics and Telecommunications (CEOT), Faculty of Science and Technology, Universidade do Algarve, 8005-139 Faro, Portugal
5
Department of Chemistry, Physical Chemistry Section, University of Pavia, 27100 Pavia, Italy
6
Business Faculty, WSB Merito University in Gdańsk, 80-266 Gdańsk, Poland
*
Author to whom correspondence should be addressed.
Water 2023, 15(17), 3024; https://doi.org/10.3390/w15173024
Submission received: 29 June 2023 / Revised: 1 August 2023 / Accepted: 10 August 2023 / Published: 22 August 2023
(This article belongs to the Section Biodiversity and Functionality of Aquatic Ecosystems)

Abstract

:
The growing demand for chitin and chitosan makes it necessary to look for new sources of these polymers and to develop more environmentally friendly methods for their isolation. The subjects of the current study were chitin and chitosan extracted from shells of two crayfish species: P. leptodactylus and F. limosus. The obtained polymers were characterized by physicochemical properties (molecular weight, thermal stability, and structure). The obtained chitosan was evaluated regarding biocompatibility and antimicrobial activity. The yield of chitin obtained from P. leptodactylus and F. limosus with a standard method was 22 ± 2.7% and 20 ± 3.6% (w/w), respectively (a preliminary extraction with a natural deep eutectic solvent was performed successfully only for P. leptodactylus). The yield of chitosan production was 15 ± 0.3% and 14 ± 4.2%, respectively. Both chitosan samples showed antimicrobial activity against E. coli and S. aureus. Cytotoxicity assays revealed a time- and concentration-dependent effect, with a milder impact at concentrations up to 250 µg/mL. A more favourable profile was observed for chitosan from F. limosus shells.

1. Introduction

Chitin (poly-(1→4)-β-N-acetyl-d-glucosamine) is a commonly occurring polymer in the environment. It might be found in fungi cell walls, cuticles of insects and crustacean shells [1]. Commercially, chitin is mainly obtained from seafood wastes. However, the demand for chitin is growing [2], so it is essential to look for new sources of this polymer. In this study, we chose two crayfish species, Pontastacus leptodactylus (Eschscholtz, 1823) and Faxonius limosus (Rafinesque, 1817) shells, as a source of this polymer. They are both widespread, euryhaline [3,4,5,6], omnivorous, benthic crustaceans [7,8,9].
P. leptodactylus, also known as Turkish, Galician, swamp, narrow-clawed or pond crayfish [10], is native to Europe [11]. According to the Food and Agriculture Organization of the United Nations (FAO) [12], P. leptodactylus aquaculture ranks fifth in producing crayfish species in global aquaculture. It is cultivated among others in Turkey [13] and Poland due to its nutritious meat and to reduce the overfishing of natural resources [10].
F. limosus (spiny-cheek crayfish) is native to North America and was introduced to Europe for cultivation. Currently, it is considered one of the most invasive crayfish species in Europe and a carrier of crayfish plague [14]. Invasive alien species (IAS) are one of the major environmental problems globally [15]. According to European Regulation 1143/2014 on IAS, all European Member States must take measures to combat IAS, including prevention, early detection, eradication, and management. Studies already conducted on F. limosus meat indicate that it is good quality and might be used in the food industry [16], but there was no research on this species regarding chitin contained in its shells. We hypothesize that shell wastes obtained from both crayfish species might constitute an additional source of chitin.
Chitin in crustacean shells occurs in complexes with mineral salts and proteins. In industrial processing, chitin isolation consists of acidic demineralization and alkali deproteinization, usually carried out with hydrochloric acid (HCl) and sodium hydroxide (NaOH). This process produces a huge amount of wastewater and energy consumption [17]. Strong reagents can also induce chitosan degradation [18]. One of the most promising alternative extraction methods is those based on natural deep eutectic solvents (NADES) mixtures. NADES are mixtures of at least two primary metabolites: one of them constitutes a hydrogen bond donor (HBD) and the other a hydrogen bond acceptor (HBA). After being combined, they become a mixture with a lower melting point than the melting points of each component [19]. They are considered safe for the environment and non-toxic [20]. Extractions with NADES mixtures consume less water, energy, and time. Another advantage is the higher extraction efficiency and better quality of the obtained polymer [21]. However, chitin quality varies depending on the source, and its extraction might require different working conditions [22].
Chitin can be used in wound dressings or tissue engineering [23,24]. However, deacetylation (usually carried out with NaOH [17]) enhances solubility and significantly broadens application possibilities. Chitin polymers with a degree of deacetylation > 55% are called “chitosan” [25]. The free amino groups give chitosan a positive charge, thus, many desirable features, like mucoadhesivity or antimicrobial activity [26,27]. The antimicrobial activity is a desirable feature in medical applications, like wound dressing or for an application as an antibiotic [28]. It is considered a promising agent as a drug carrier. Chitosan was approved by the American Food and Drug Administration (FDA) as a wound dressing [29] and can be found on the market in cosmetics and dietary supplements. However, depending on many factors, such as the source and extraction method, the properties of chitosan might vary. Thus, the biocompatibility of these polymers will be different and should be investigated separately in terms of the planned application and target [30].
This paper aimed to assess if P. leptodactylus and F. limosus shells are economically viable as alternative sources of chitin and chitosan to isolate chitin from P. leptodactylus and F. limosus shells using the method proposed by Zhu et al. [31] and to assess the antibacterial activity and cytotoxicity of the obtained chitosan samples.

2. Materials and Methods

2.1. Materials

2.1.1. Biomass

F. limosus specimens were collected from Jamno Lake (Gospodarstwo Rybackie “Mielno” sp. z o.o., Mielno, Poland) in the summer of 2015, and P. leptodactylus specimens were taken from aquaculture (Gospodarstwo Rybackie Bytów sp. z o.o., Bytów, Poland) during the summer and autumn of 2020. They were treated following the method described by Rodriguez-Veiga et al. [32] and were washed and later boiled for 8 h, for easier tissue separation. The water was changed five times, and after this, the specimens were dried at 50 °C for 24 h. Then, the shells were separated from the remains of other tissues and milled to powder.

2.1.2. Reagents

Commercial chitin and chitosan standards were purchased from (Sigma-Aldrich, Milan, Italy), and used as a control in this study. Hydrochloride (HCl), sodium hydroxide (NaOH), choline chloride ((CH3)3N(Cl)CH2CH2OH), malonic acid (CH2(COOH)2) and citric acid (C6H8O7) were purchased from (Sigma-Aldrich, Milan, Italy), Tryptone Soya Broth (TSB) and Iso-Sensitest broth (ISB) were purchased from Oxoid (Basingstoke, UK). Dulbecco’s Modified Eagle’s (DMEM), L-glutamine, non-essential amino acids and 3-(4,5-dimethylthiazol-2yl)-2,5-diphenyltetrazolium bromide (MTT) were purchased from Sigma-Aldrich (Burghausen, Germany). PBS tablets pH 7.4 were purchased from VWR (Rosny-sous-Bois, France). Dimethyl sulfoxide (DMSO) was acquired from Carlo Erba (Sabadell, Spain), and penicillin and bovine serum (FBS) from Gibco (Life Technologies, Carlsband, CA, USA). A lactate dehydrogenase (LDH) kit was provided by Takara Bio (Tokyo, Japan).

2.2. Chitin and Chitosan Isolation

2.2.1. Standard Chitin Extraction

Demineralization

The material demineralization was carried out at room temperature, under magnetic stirring (30 min), with an aqueous solution of HCl (3.6%, w/v) added to the sample at a solid/liquid ratio of 1 g/15 mL. The obtained material was centrifuged, the supernatant liquid was removed, and the remaining material was thoroughly washed with 25 mL of distilled water in a centrifuge (Eppendorf 5804R, Eppendorf, Milano, Italy) at 4000 rpm (6 times for 5 min) until neutral pH was achieved. The obtained material was dried in the oven at 80 °C (48 h).

Deproteinization

The sample deproteinization was performed with an aqueous solution of NaOH (8%, w/v) added to the material obtained earlier at a solid/liquid ratio of 1 g/15 mL, at 100 °C, under stirring for 1 h. Then, again, it was centrifuged, the supernatant liquid was removed, and the remaining material was thoroughly washed with 25 mL of distilled water in a centrifuge at 4000 rpm (3 times for 5 min) until neutral pH was achieved and dried in the oven at 80 °C (48 h).

2.2.2. Standard Chitosan Extraction

Deacetylation

The process of deacetylation was carried out in a reflux apparatus (round bottom flask equipped with a refrigerator and heated in an oil bath) with an aqueous solution of NaOH (60%, w/v) that was added to the sample at a solid/liquid ratio 1 g/20 mL at 180 °C under stirring for 2 h. The obtained material was centrifuged, the supernatant liquid was removed, and the remaining material was thoroughly washed with 25 mL of distilled water in a centrifuge at 4000 rpm (4 times for 5 min) to obtain neutral pH and dried in the oven at 80 °C (48 h) afterwards.

2.2.3. NADES Chitin Extraction

NADES mixture was prepared following the modified procedure of Zhu et al. [31]. In a two-necked round-bottom flask, 8.59 g of choline chloride and 12.8 g of malonic acid were heated in an oil bath, at 100 °C, under mechanical stirring until a homogenous and colourless solution was formed. Then 1.5 g of crayfish shell powder was added, constituting 7% of the solution. The extraction was performed in two variants:
  • The material was kept with NADES at 100 °C under mechanical stirring for 2 h. After filtration under vacuum, the obtained material was washed seven times with 25 mL of distilled water in a centrifuge at 4000 rpm (7 times for 5 min) until the neutral pH was obtained and dried in the oven at 80 °C for 48 h. Then, the extracted material was additionally treated with 20 mL of H2O2 at 10% for 2 h at 80 °C, washed with 25 mL of distilled water in a centrifuge at 4000 rpm (7 times for 5 min) until the neutral pH was obtained, and dried in the oven at 80 °C for 48 h.
  • The material was pre-treated with 10 mL of C6H8O7 (10%, w/v) for 1 h at room temperature and then treated following the point above.
Chitin and chitosan yields were calculated with the following equations:
Yieldchitin [%] = (Wchitin/Wshell) × 100
Yieldchitosan from chitin [%] = (Wchitosan/Wchitin) × 100
Yieldchitosan from shell [%] = (Wchitosan/Wshell) × 100
where Wchitin is the weight of the obtained chitin, Wshell is the weight of the raw material, and Wchitosan is the weight of the obtained chitosan.

2.3. Fourier Transform Infrared Spectroscopy (FTIR)

The FTIR analysis was carried out with a Spectrum One FTIR spectrophotometer (Perkin Elmer, Wellesley, MA, USA) equipped with a MIRacleTM ATR device (Pike Technologies, Madison, WI, USA) over the frequency range of 4000–650 cm−1 at a resolution of 4 cm−1 (64 scans). The spectra were collected at least in triplicate.

2.4. Thermogravimetric Analysis (TG)

Thermogravimetric (TG) analysis was conducted with Mettler Toledo Stare System (Mettler Toledo, Milan, Italy) equipped with a TGA/DSC 1 module. To perform the analysis, about 5 mg of each sample was put in alumina crucibles with lids (scanning rate of 10 K min−1 from 30 °C to 500 °C) under a nitrogen atmosphere (flow rate 50 mL min−1). The instrument was previously calibrated with indium as a standard reference, and the measurements were done at least in triplicate.

2.5. Scanning Electron Microscopy (SEM)

The surface of the obtained chitins and chitosan samples was analysed with scanning electron microscopy (SEM). The samples were sputtered with Au and examined using an EVO MA10instrument (Carl Zeiss, Oberkochen, Germany). The measurements were performed under an ultra-high vacuum with an electron generation voltage of 5 kV and a working distance of 8.5 mm.

2.6. Molar Mass Distribution

The molar mass distribution of the obtained polymers was estimated by High-Performance Size Exclusion Chromatography (HPSEC) and carried out in a modular system comprised of a Biotech Degasi GPC degasser (Biotech, Onsala, Sweden), a Waters 515 HPLC pump (Waters, Milford, MA, USA), and a Knauer K-2300 refractive index detector (Knauer, Berlin, Germany). Two Shodex columns OHpak SB-806M HQ (Showa Denko K.K., Tokyo, Japan) of 300 mm × 8.0 mm were used in series with a 50 mm × 6.0 mm OHpak SB-G 6B guard column (Showa Denko K.K., Tokyo, Japan).
A 0.2 M NaNO3 + 0.5 M CH3COOH aqueous solution (0.02% NaN3) was used as a mobile phase at 1 mL/min. Chitosan samples were dissolved in the eluent at 5 mg/mL overnight, centrifuged at 4000 rpm for 10 min, and filtered through 0.45 μm filters. A conventional calibration curve was set using polystyrene sulfonate standards dissolved at 5 mg/mL in the former eluent.

2.7. Antimicrobial Assays

2.7.1. Chitosan Salification

Both chitosan samples were dissolved in HCl (3.6%, w/v) at a solid/liquid ratio of 1 g/6.2 mL, with distilled water in proportion to 100 mL per 1 g of the sample. Each solution was dialyzed for 24 h, under stirring, at room temperature. The water was changed every 2 h. The dialyzed samples were frozen in a diagonal position and then lyophilized.

2.7.2. Bacteria Culture

Escherichia coli (ATCC 10536) and Staphylococcus aureus (ATCC 6538) strains were cultured in TSB at 37 °C. The bacteria cultures were centrifuged at 3000 rpm for 20 min to separate cells from broth and then suspended in PBS (pH 7.3). The suspension was diluted to adjust the number of cells to 1 × 10⁷–1 ×10⁸ CFU/mL.

2.7.3. Evaluation of Minimum Inhibitory Concentration (MIC) and Minimum Bactericidal Concentration (MBC)

The antimicrobial activity of the obtained chitosan samples was tested against Escherichia coli (ATCC 10536) and Staphylococcus aureus (ATCC 6538) as models for Gram-negative and Gram-positive bacteria, respectively. The density of the used suspension was 1 × 10⁷–1 × 10⁸ CFU/mL. All the extracts were dissolved in a 10% DMSO aqueous solution at different concentrations. The minimal inhibitory concentration (MIC) and minimal bactericidal concentration (MBC) were determined by the two-fold serial broth dilution method in ISB according to Clinical and Laboratory Standards Institute (CLSI; formerly NCCLS) procedures [32]. The starting inoculum was 1.0 × 10⁷ CFU/mL. Concentrations of extracts were tested in the range of 0.1–9.2 mg/mL. The MIC was the lowest extract concentration inhibiting observable microbial growth after 24 h incubation at 37 °C. The MBC was the lowest concentration resulting in >99.9% reduction of the initial inoculum after 24 h of incubation at 37 °C. All experiments were performed in triplicate [33]. Solvent blanks were included. The positive control was stock standard solutions of ampicillin.

2.8. Cytotoxicity Assay (MTT)

2.8.1. Cell Culture

Human lung epithelial adenocarcinoma cells (A549), provided by American Type Culture Collection (ATCC, Manassas, VA, USA), were used in passages 84–94. They were cultured in flasks (75 cm2) at 37 °C in an incubator with 5% CO2/95% humidified atmospheric air. The CCM used for this cell line was (DMEM) supplemented with L-glutamine at 1% (v/v), penicillin/streptomycin at 1% (v/v), non-essential amino acids at 1% (v/v), and FBS at 10% (v/v). CCM was exchanged twice a week.

2.8.2. Assessment of metabolic activity

The metabolic activity of the A549 cells after exposure to the chitosan samples was evaluated with an MTT assay following the International Organization for Standardization indications [34]. Chitosan samples were solubilized in acetic acid (1%, v/v) at a concentration of 4 mg/mL, then dispersed in CCM at concentrations ranging between 15.62 and 1000 μg/mL. To perform the assays, cells were seeded in 96-well plates at 1 × 10⁴ cells/well the day before the exposure. After the overnight incubation, the CCM was discarded and replaced with chitosan samples. CCM and SDS solution at 2% (w/v) were used as a positive and negative control of cell viability, respectively. After 3, 24, and 48 h of exposure, the samples were replaced with 30 µL of MTT (5 mg/mL in PBS pH 7.4), which remained in contact with the cells for 2 h at 37 °C. Then, 50 µL of DMSO was added to each well to solubilise the formed formazan crystals. The absorbance was read by spectrophotometry (Infinite M200; Tecan, Grödig, Austria) at 540 nm, with background correction at 640 nm. All experiments were performed in triplicate. The cell viability was calculated from the equation:
Cell   viability % = A D CM D × 100
where A is an absorbance obtained upon exposure for each sample, D is an absorbance measured for DMSO, and CM is an absorbance read for the cells incubated in CCM. The half maximal inhibitory concentration (IC50) was calculated for samples with cell viability reaching less than 50%. IC50 values were determined by sigmoidal fitting of the data in the GraphPad Prism statistical program (GraphPad Software, Version 6.01, Boston, MA, USA).

2.9. Statistical Analysis

The results were analysed by two-way analysis of variance (ANOVA). The used software was R (packages: emmeans 1.8.5, car 3.1-2, bestNormalize 1.9.0 and DHARMa 0.4.6), and differences were considered significant at a level of p < 0.05.

3. Results

3.1. Chitin and Chitosan Recovery

3.1.1. Chitin and Chitosan Obtained Using Standard Chemical Procedures

The average chitin yield in P. leptodactylus and F. limosus shells was 22 ± 2.7% (n = 5) and 20 ± 3.4% (n = 4) (w/w), respectively. The media of chitosan yield obtained from chitin was 70 ± 13.0% (n = 2) and 76 ± 9.0% (n = 2) (w/w) respectively. Therefore the content of chitosan obtained from shells was 15 ± 0.3% and 14 ± 4.2% (w/w) (Table 1). All the obtained chitin and chitosan polymers were slightly brownish.

3.1.2. Preliminary Extraction with NADES Mixture

The extraction with NADES allowed us to obtain chitin from P. leptodactylus shells successfully. The yield was higher compared to the standard method. The NADES extraction performed on F. limosus shells did not complete chitin purification. Further FTIR analysis showed the remains of protein. The extraction with citric acid pre-treatment resulted in a higher chitin yield from P. leptodactylus, while for F. limosus shells, the yield of the obtained material was lower (about 25%). However, no changes in further analysis were observed. In the current study, each extraction with NADES was performed only once.

3.2. Fourier Transform Infrared Spectroscopy (FTIR)

Chitin and Chitosan Obtained Using Standard Extraction Characterisation

FTIR spectra of P. leptodactylus and F. limosus samples corresponded to the spectrum of the chitin standard (Figure 1, spectrum a). The Chitin standard used as reference was characterized by amide I band at 1622 cm−1, amide II at 1551 cm−1, -C-H stretching at 2875 cm−1, and -C-O-C- stretching at 1070 cm−1 and 1026 cm−1 (Table 2). For the material obtained with standard extraction performed on P. leptodactylus (spectrum b) and F. limosus (spectrum c) shells, amide I bands were observed at 1633 cm−1 and 1628 cm−1, amide II bands at 1553 cm−1 and 1552 cm−1, -C-H stretching at 2879 cm−1 and at 2890 cm−1, and -C-O-C- stretching at 1063 cm−1 and 1026 cm−1, and at 1067 cm−1 and 1026 cm−1 respectively. Similarly, for the material obtained with NADES from P. leptodactylus (spectrum c) and F. limosus (spectrum e) shells, the amide I band was observed at 1622 cm−1 and 1635 cm−1, the amide II at 1551 cm−1 and 1549 cm−1, -C-H stretching at 2883 cm−1 and 2874 cm−1, and -C-O-C- stretching at 1071 cm−1 and 1011 cm−1, and 1068 cm−1 and 1027 cm−1 respectively. For the F. limosus shells, the extraction wasn’t complete, and proteins remained in the sample, as appeared by the presence of the bands at 1414 cm−1.
Recorded FTIR spectra for both P. leptodactylus and F. limosus deacetylated samples were like the FTIR spectrum of chitosan standard (Figure 2), with small differences in wavenumbers and adsorption intensity (Table 3). Chitosan standard (spectrum a), used as a reference, was characterized by amide I band at 1647 cm−1, amide II at 1564 cm−1, -C-H stretching at 2872 cm−1, and -C-O-C- stretching at 1063 cm−1 and 102m−1 (Table 2). For the deacetylated material from P. leptodactylus (spectrum b) and F. limosus (spectrum c) shells, amide I bands were observed at around 1650 cm−1 and the amide II bands at around 1590 cm−1 for both species. The -C-H stretching was observed at 2874 cm−1 and 2864 cm−1, respectively. The -C-O-C- stretching at 1054 cm−1 and 1027 cm−1 for P. leptodactylus and at 1059 cm−1 and 1026 cm−1 for F. limosus.
The lower adsorption intensity for amide I and II in the spectra of chitosan samples compared to the spectra of chitin samples corresponds to decreased residual N-acetyl units, indicating the deacetylation process went successfully.

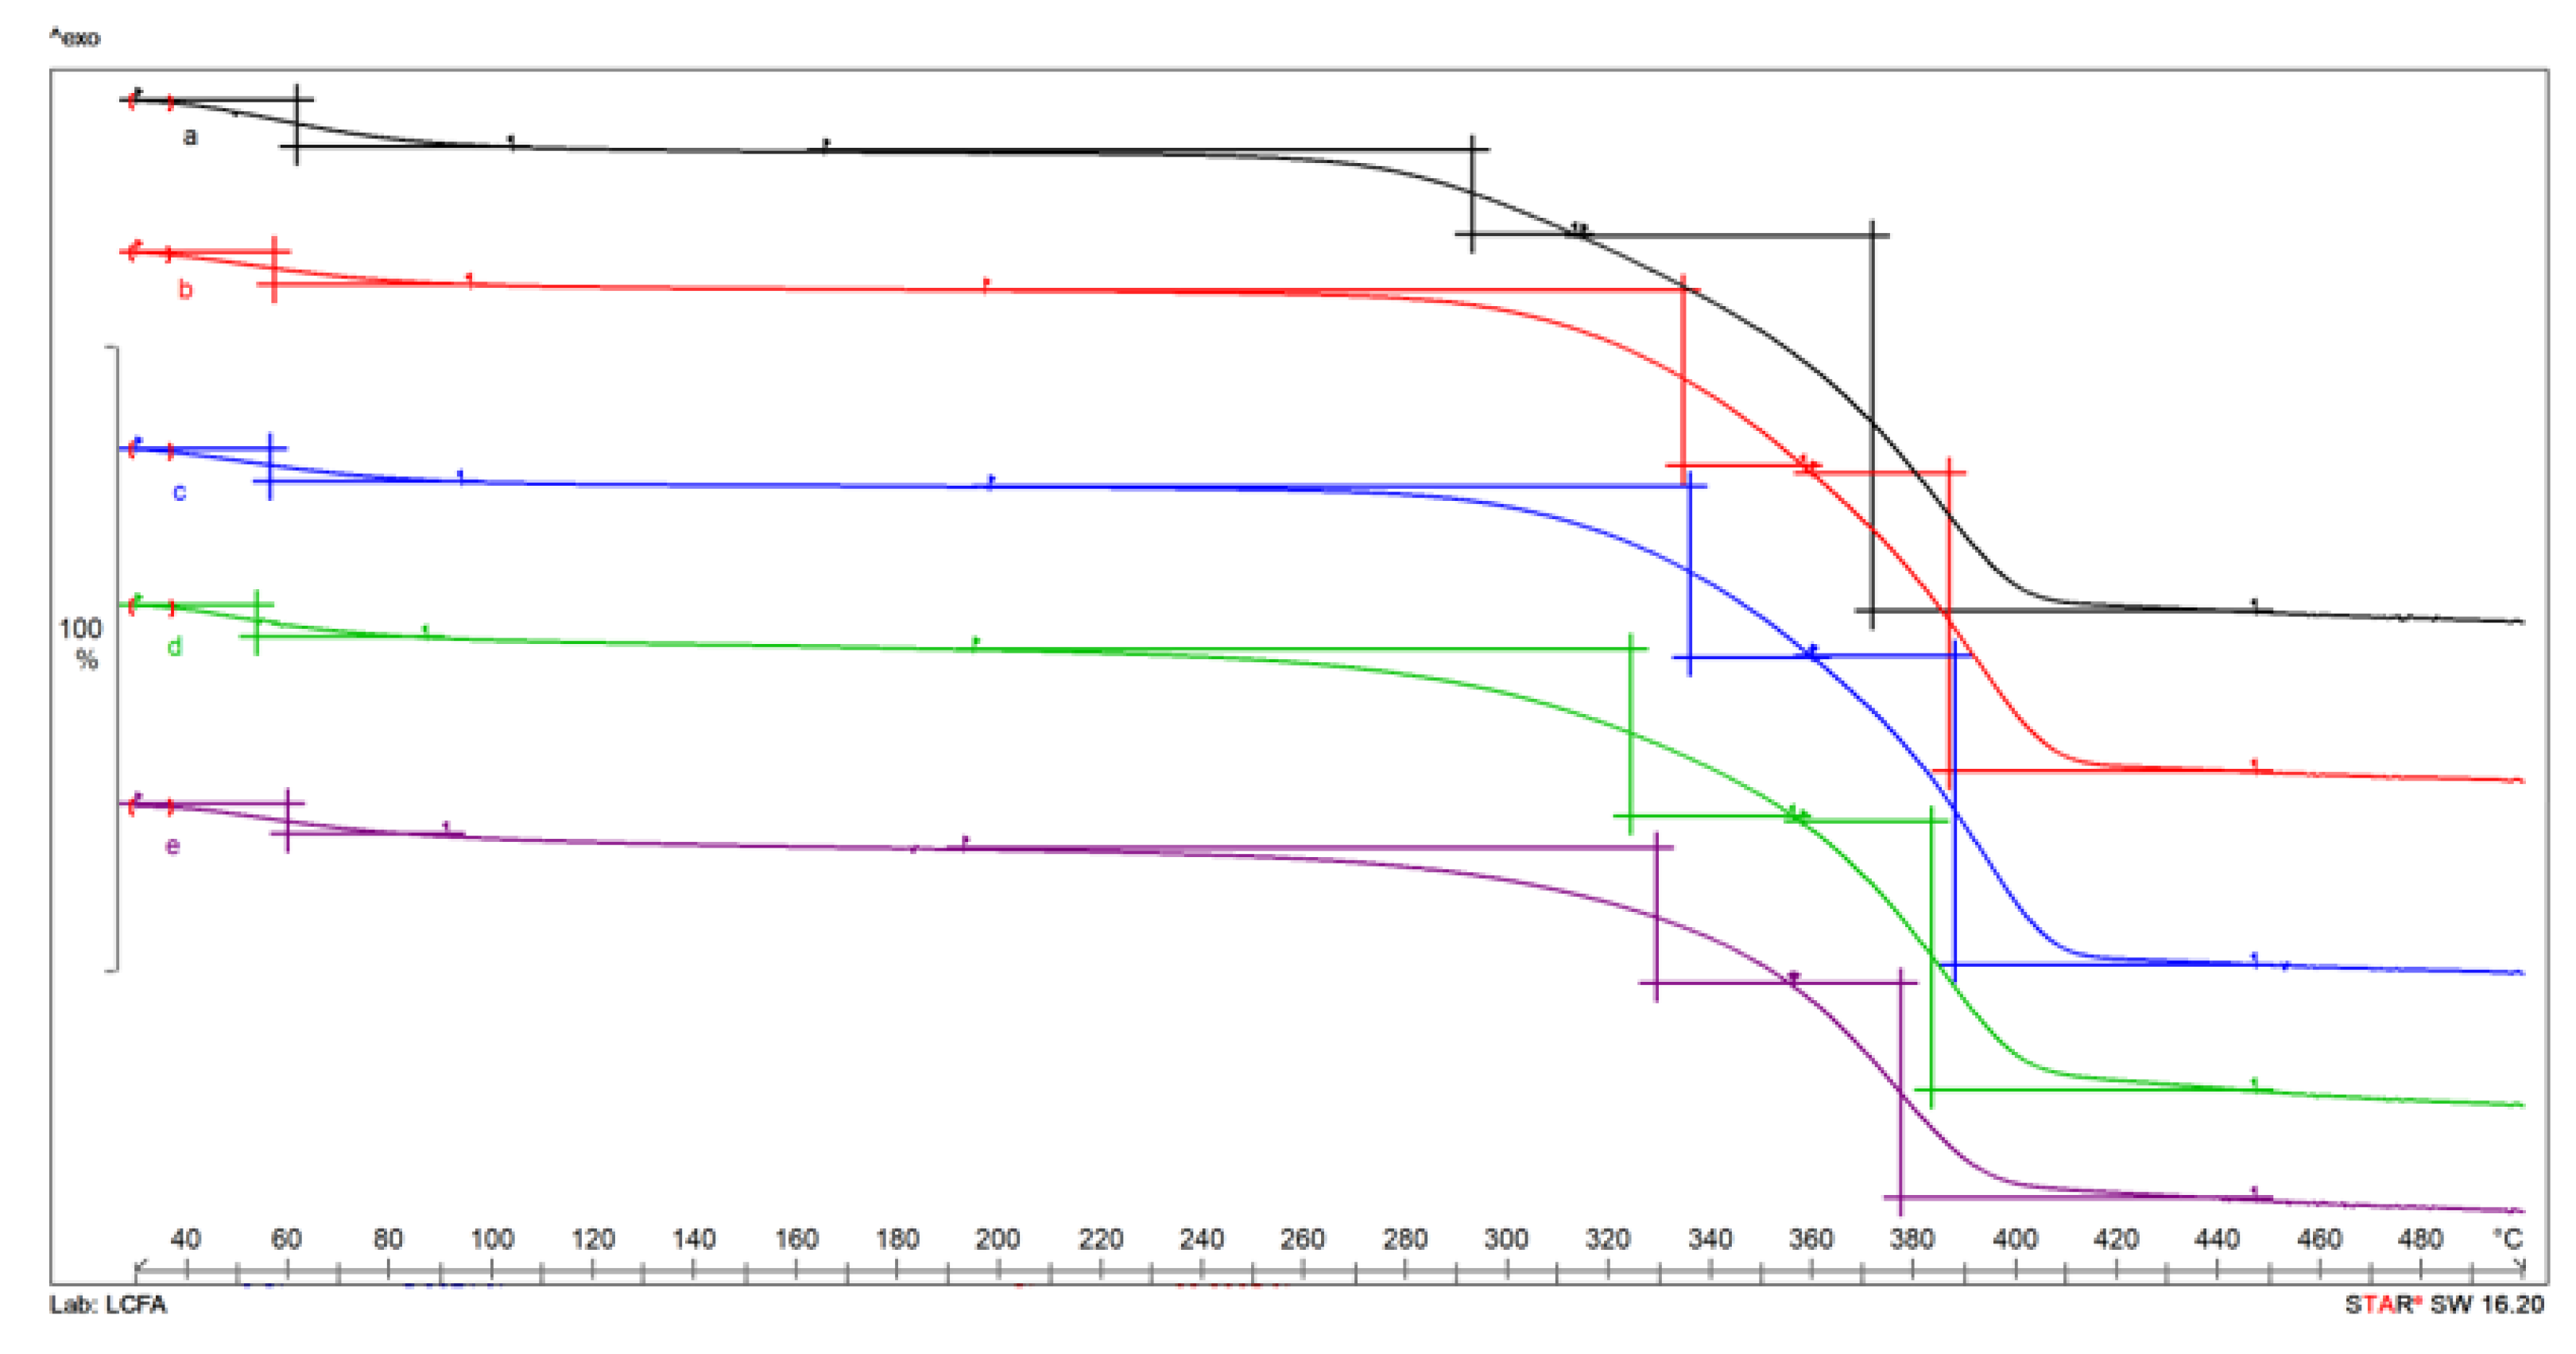
3.3. Thermogravimetric Analysis (TG) of Chitin and Chitosan Obtained Using Standard Extraction Characterisation

The thermogravimetric analyses performed on chitin extracted from P. leptodactylus and F. limosus shells using both standard and NADES methods are reported in Figure 3. All TG curves obtained are like the TG curve of the chitin standard (curve a). Their thermal profiles are composed of two main steps: the first corresponds to water evaporation, and the second to amine group degradation [35]. For the chitin standard, water evaporation lasted until around 100 °C with a mass loss of 7.7 ± 0.2%. The beginning degradation of amine groups was observed at around 164 °C with a mass loss of 75.0 ± 0.3%. This second step could be divided into two events relative to polymeric chain degradation and acetylated and deacetylated unit decomposition, respectively, and was also observed for P. leptodactylus (curve b) and F. limosus (curve c) samples. For the P. leptodactylus sample, the first step of sample dehydration lasted until 94 °C with an initial mass loss of 5.7 ± 0.5%. For the F. limosus sample, the initial mass loss was 5.4 ± 0.7% and lasted until 95 °C. For the P. leptodactylus sample, the second step was observed at 202 °C with a total mass loss of 78.5 ± 0.6%, while for the F. limosus sample, the starting degradation temperature was 206 °C with a total mass loss of 77.6 ± 0.2%. The TG profiles registered on chitin samples extracted with NADES mixture from shells of the two crayfish species showed similar thermal profiles. For the sample obtained with the NADES method, from P. leptodactylus (curve d), the water evaporation lasted until 148 °C, and the mass loss was about 6.5 ± 0.6%.
In comparison, due to the decomposition, the second step started at 230 °C with a mass loss of 70.1 ± 0.8%. The sample obtained from F. limosus shells also showed two steps: the first one lasted until 182 °C with a mass loss of 6.6 ± 0.5%, and the second one was initiated at 221 °C with a mass loss of 54.4 ± 0.3%. The different decomposition temperatures of the samples obtained with the NADES extraction method compared to those obtained with the chemical method are probably due to a greater impurity of the former.
Figure 4 shows the profiles of the recorded curves from TG analysis of chitosan from P. leptodactylus (curve b) and F. limosus (curve c) shells, which were like to the curve obtained for chitosan standard (curve a). All of them decomposed in two significant steps related to successfully performed deacetylation. Similarly, as for chitin, the first step of mass loss corresponds to water evaporation and the second to sample degradation. The first step was observed for commercial chitosan with a mass loss of 10.8 ± 0.3% and lasted until 170 °C. Sample degradation was observed at 214 °C with a mass loss of 52.4 ± 0.4%. The first step, corresponding to water evaporation in the P. leptodactylus sample, lasted until 146 °C with a mass loss of 7.9 ± 0.8%, and the second one, corresponding to the sample decomposition, started from 196 °C with a mass loss of 54.5 ± 0.6%. Analogously, for the chitosan from F. limosus shells, the first step lasted until 195 °C with a mass loss 7.2 ± 0.4%, and the sample decomposition started from 211 °C with a mass loss of 53.5 ± 0.7%.

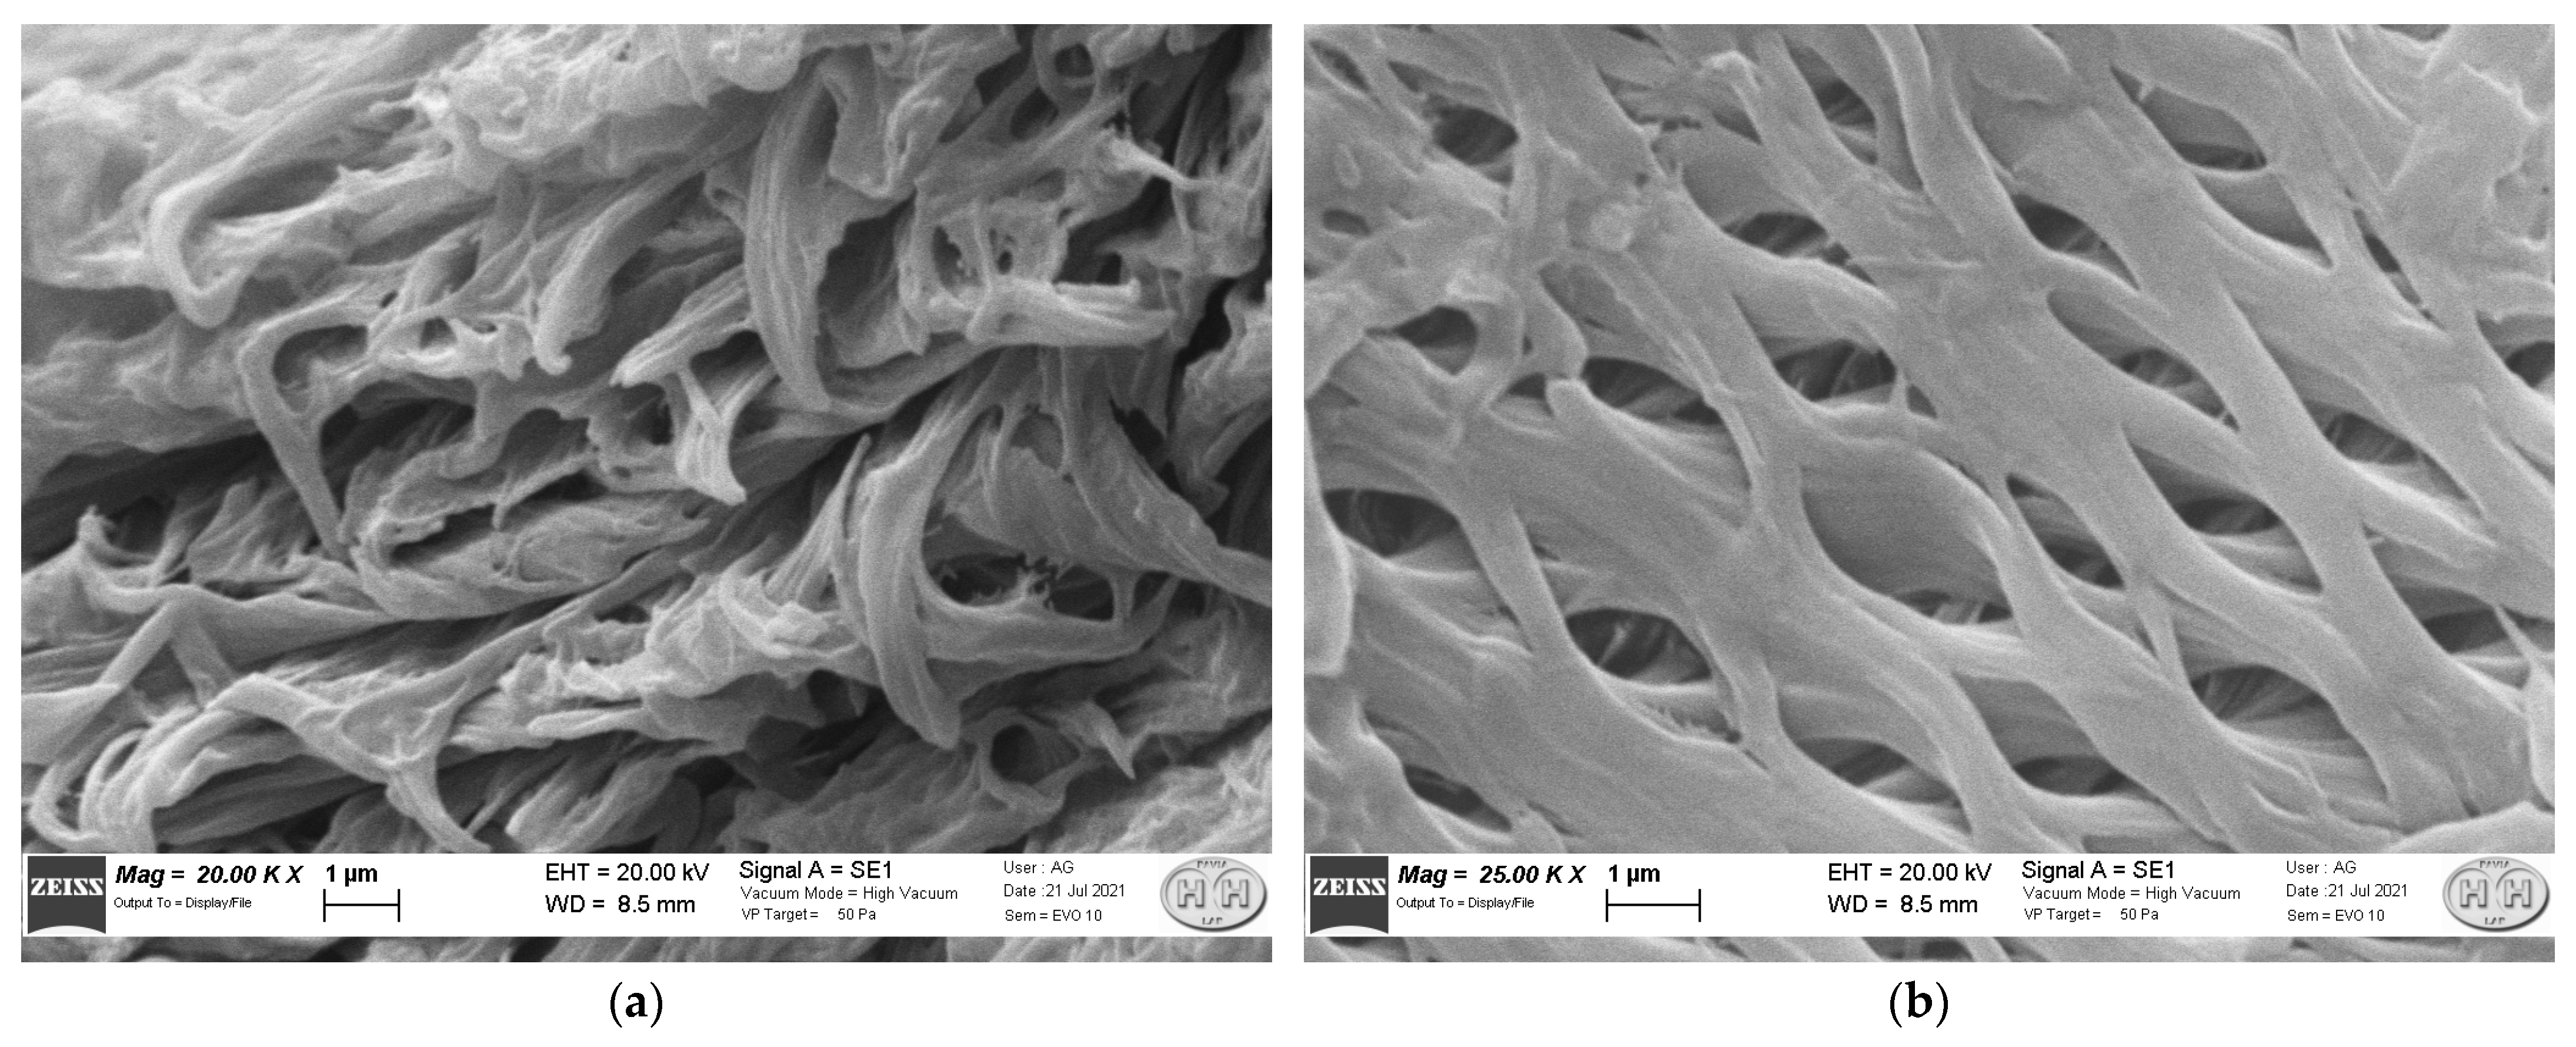
3.4. Scanning Electron Microscopy (SEM)

The structure of chitin from P. leptodactylus shells obtained with NADES is arranged in visible layers (Figure 5a) and has a fibre-like, well-organised porous structure (Figure 5b). The pores section is elongated in shape with the major and minor axes up to 2 μm and 1 μm in length, respectively.
For both species, chitosan has a fibre-like structure with pores (Figure 6). Chitosan obtained from F. limosus shells (Figure 6b) seems to have a better-organised and more porous structure with thinner layers and interconnected pores than chitosan from P. leptodactylus (Figure 6a). Also, the pores shape and size are less homogeneous.

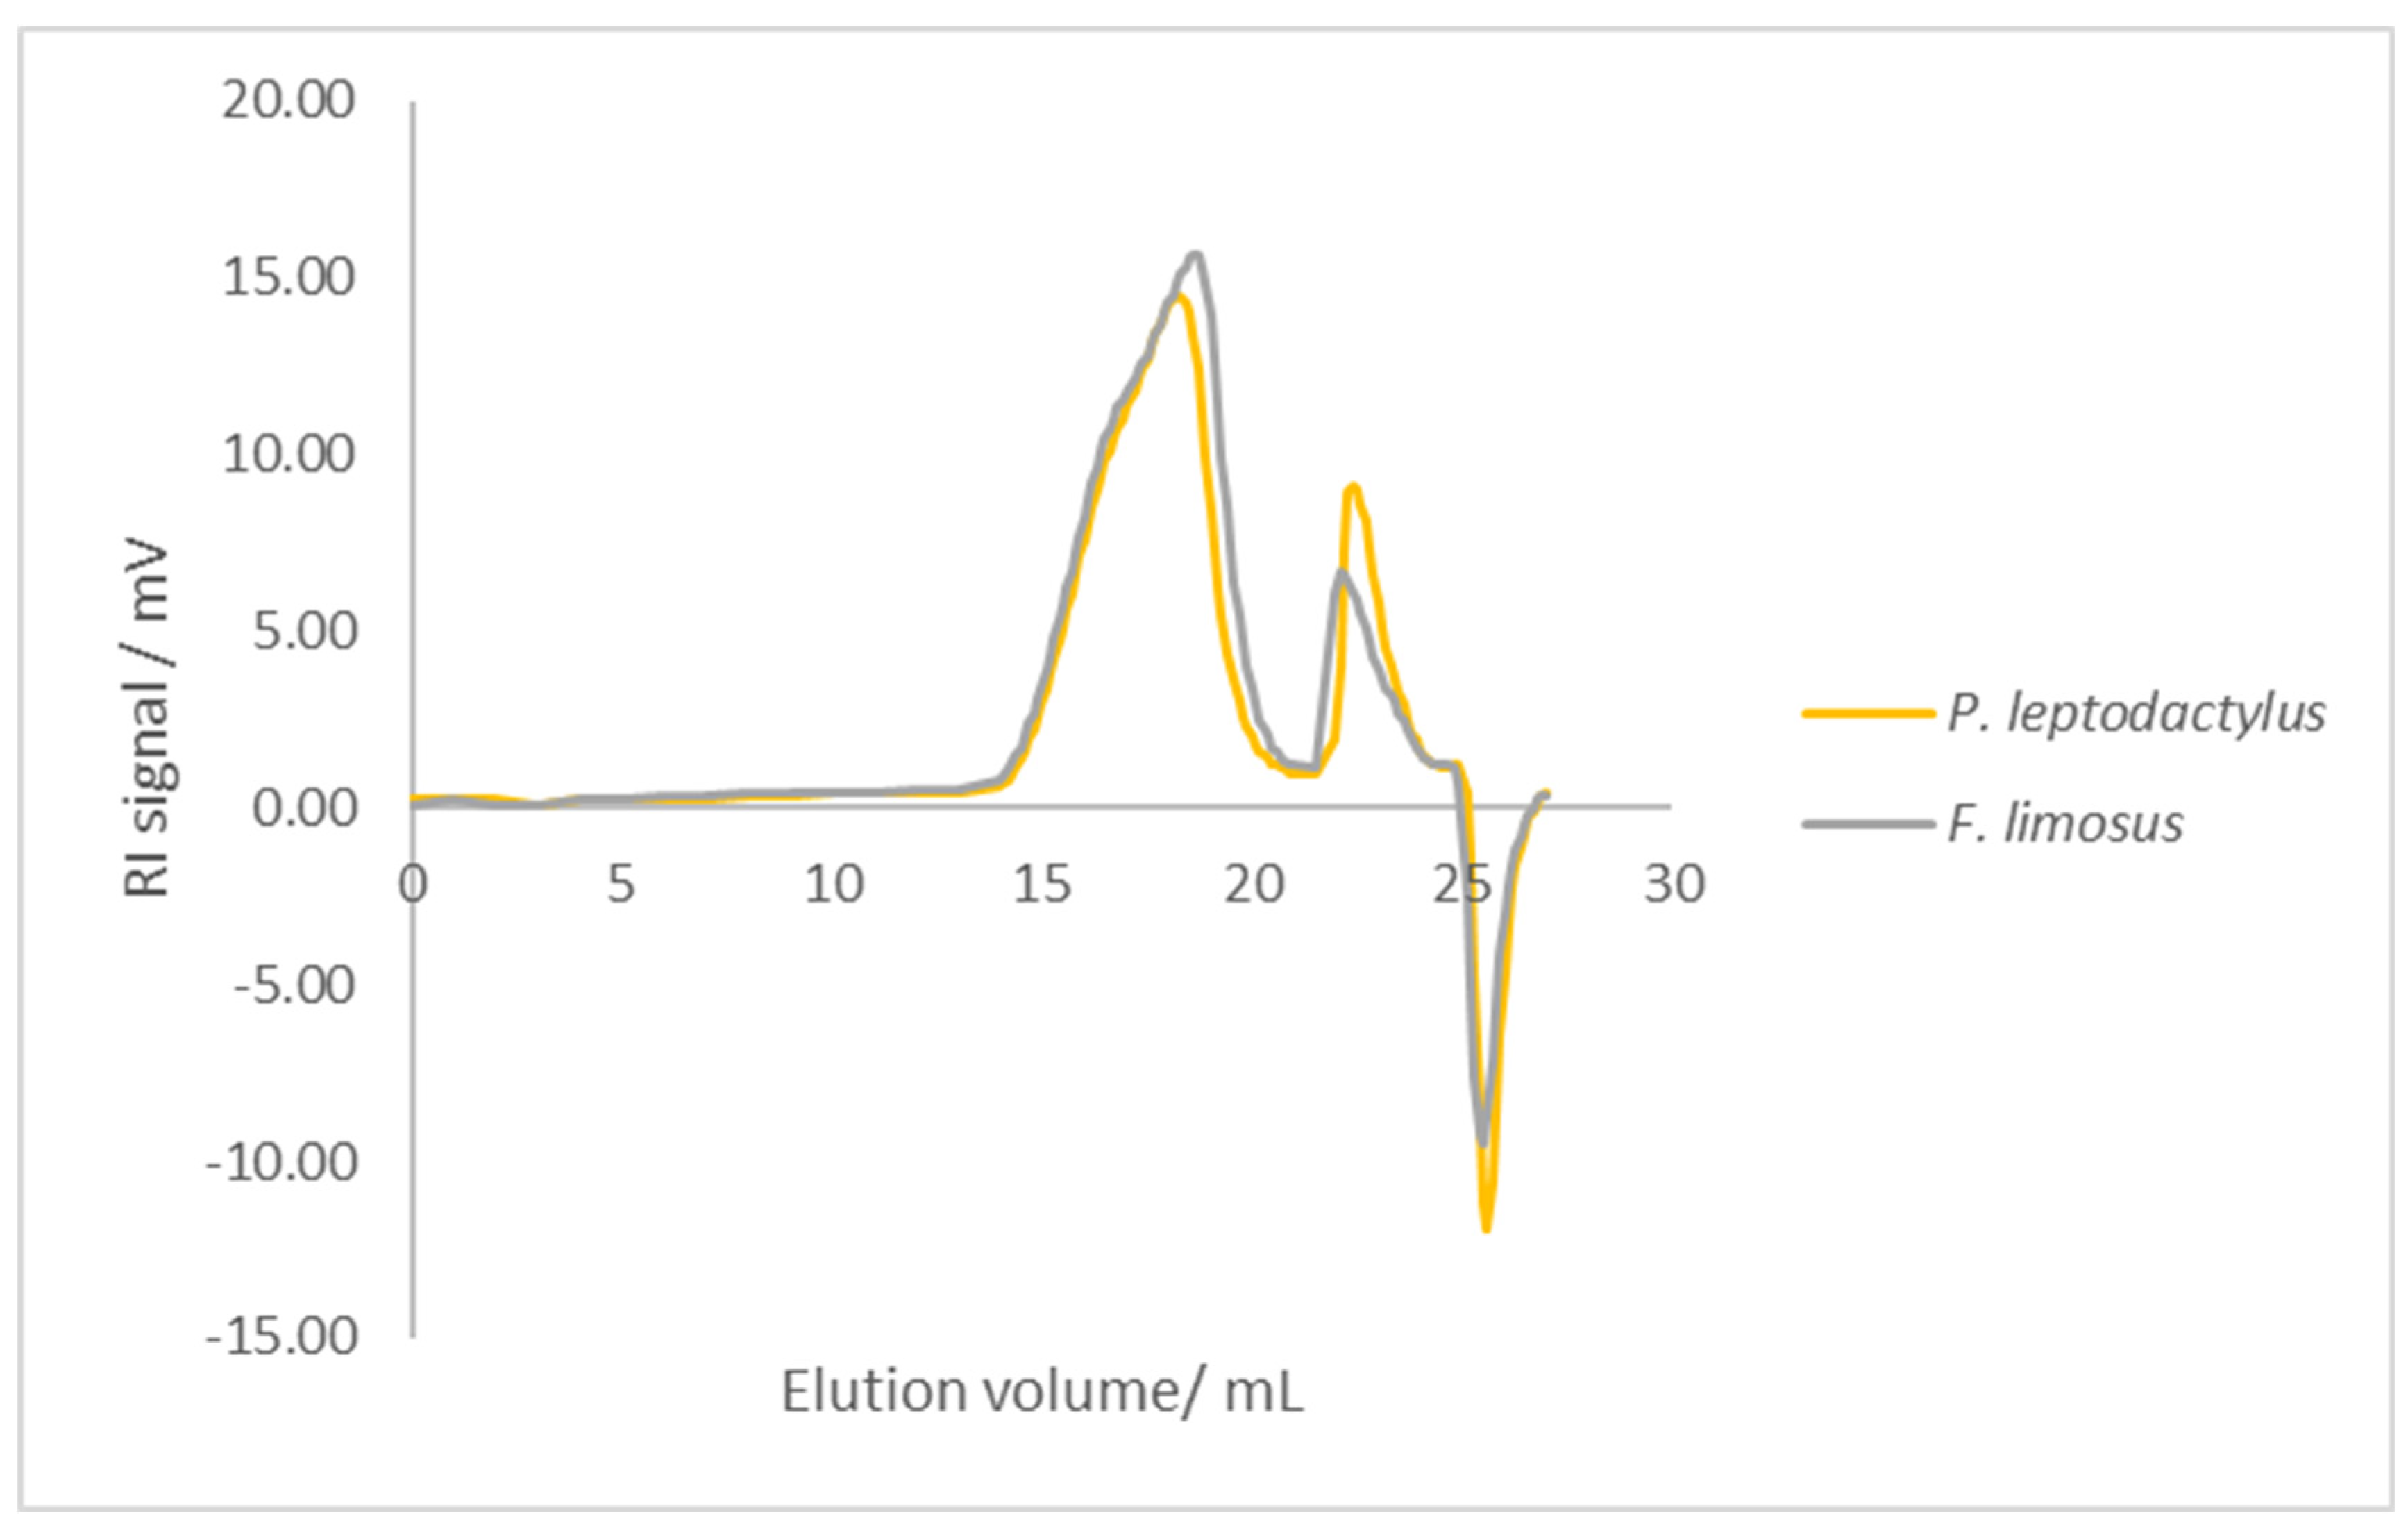
3.5. Molecular Weight (MW)

Both chitosans were characterized by HPSEC (Figure 7) to determine their molecular weight distribution. Chitosan obtained from P. leptodactylus shells presented a number average molecular weight (Mn) of 24 kDa, a weight average molecular weight (MW) of 236 kDa and a molecular dispersity (Dm) of 9.8. In contrast, chitosan from F. limosus shells presented a Mn of 19 kDa, a MW of 229 kDa and a Dm of 12.3.

3.6. Antimicrobial Activity

The MIC and MBC of the obtained chitosan polymers were determined against E. coli (gram-negative) and S. aureus (gram-positive) bacteria. These are humans’ most common pathogenic bacteria, showing resistance to some currently used antibiotics, e.g., ampicillin [36,37,38]. The antimicrobial activity is presented in Table 4. The MIC against E. coli for both chitosan samples was higher than the concentration of chitosan standard (commercially available). However, MBC against E. coli and MIC and MBC against S. aureus values were lower for the chitosan sample than for the chitosan standard. Finally, all the samples tested have an antibacterial activity lower than the ampicillin, used as a positive control. The activity of chitosan from P. leptodactylus shells was stronger against S. aureus than against E. coli.

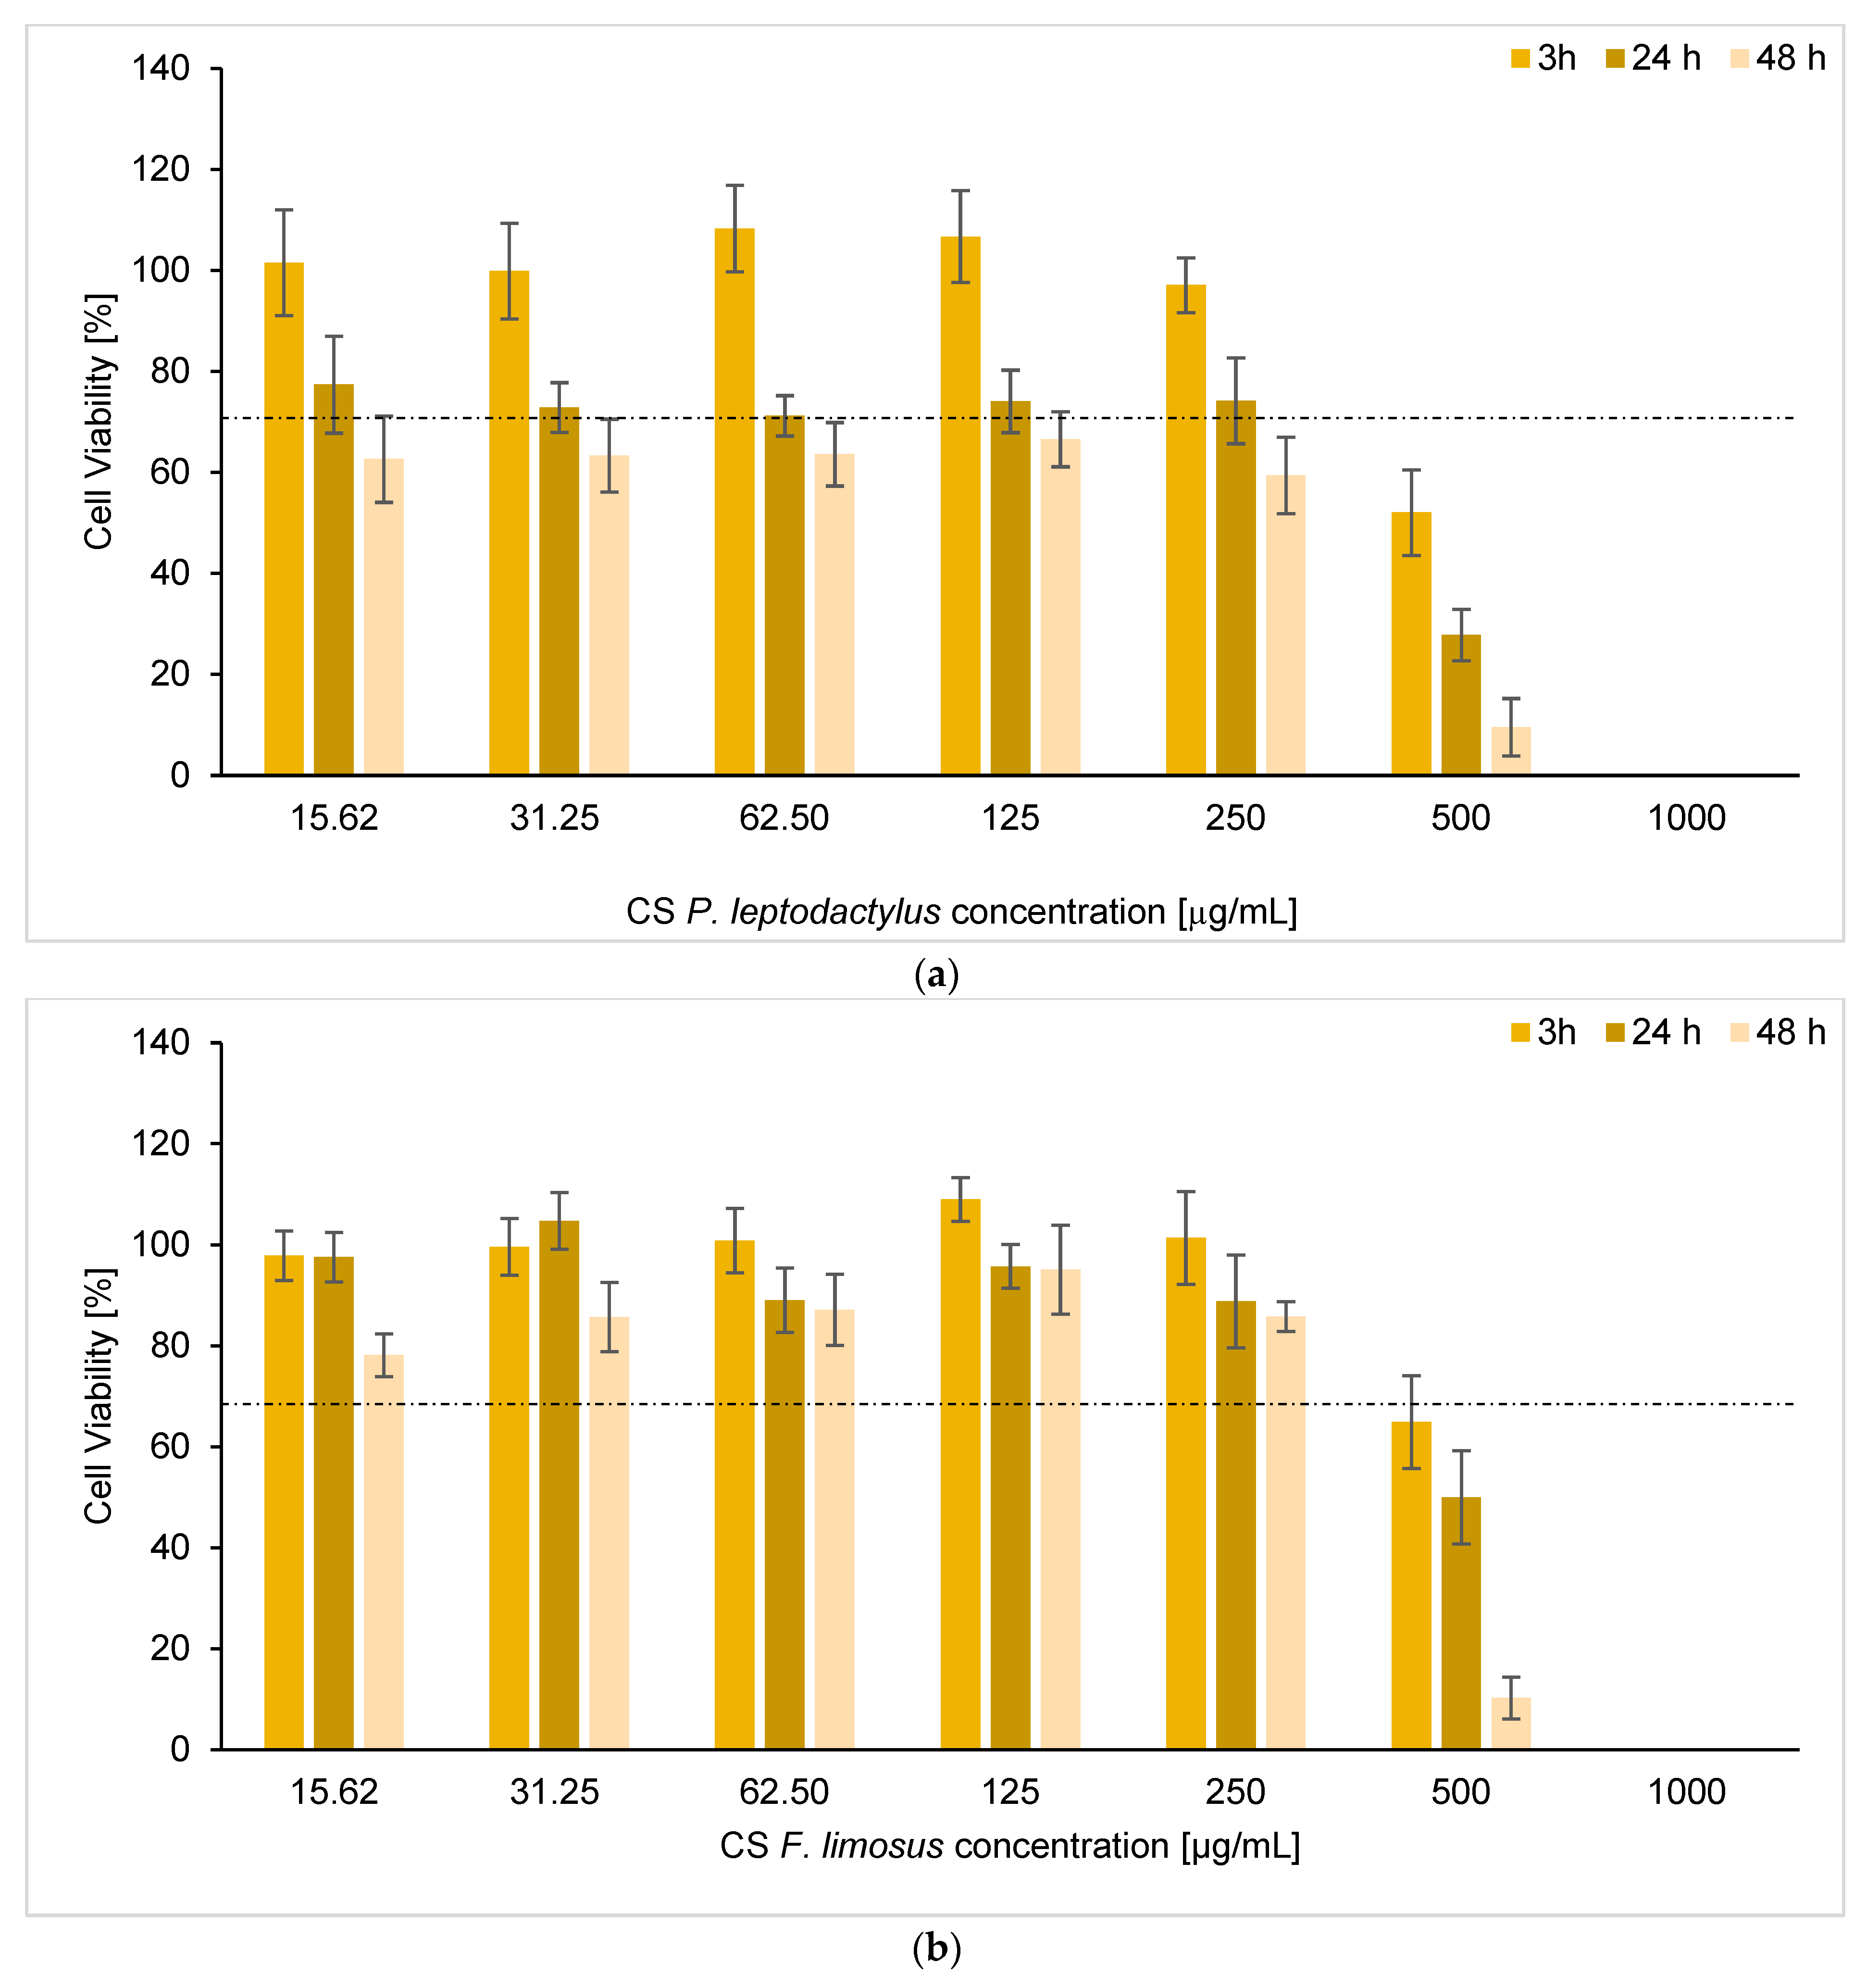
3.7. Determination of Cytotoxicity

The chitosan samples under study were tested at concentrations up to 1000 μg/mL regarding their effect on the metabolic activity of human epithelial cells. The metabolic activity was considered an indicator of cell viability, and a decrease in this parameter to values below 70% of the control (cells incubated with cell culture medium) were interpreted as a toxic effect, as indicated by ISO 10993 [34]. The results are depicted in Figure 8, showing a milder effect from the chitosan obtained from F. limosus as compared to that obtained from P. leptodactylus. In fact, for the former, a cytotoxic effect was only found when the concentration reached 500 μg/mL (p < 0.05), where cell viability decreased beyond 70%. At that concentration, a time-dependent effect was seen (p < 0.05), with cell viability varying within 10% and 65% for the period between 3 h and 48 h of exposure. On the contrary, for chitosan from P. leptodactylus, cell viability below 70% was determined at all the concentrations when the exposure was extended to 48 h (p < 0.05). The other two exposure times generally not eliciting a toxic effect. As observed for chitosan from F. limosus, the 500 μg/mL concentration also resulted in a time-dependent effect (p < 0.05) with cell viability between 10% and 52% for exposures between 3 h and 48 h. The concentration of 1000 μg/mL is massively toxic in both chitosan samples. Acetic acid, used to prepare the initial chitosan stock solution, could have a contribution, but this was observed to be minor. A control testing the effect of acetic acid in concentrations corresponding to those present in each chitosan sample revealed that only the higher amount of acetic acid (corresponding to chitosan 1000 μg/mL) decreased cell viability to values below 70% (around 65% independently of the exposure time). Therefore, the toxic effect observed in chitosan at concentrations of 500 μg/mL or higher could not be ascribed to acetic acid and should be considered an effect of the proper chitosan.
The half-maximal inhibitory concentration (IC50) was calculated for both chitosan samples (Table 5). In both cases, the IC50 value decreased with the increase in the exposure time, as expected.

4. Discussion

Crayfish shells might contain about 15% to 26% of chitin [39,40,41,42,43]. Chitin yield isolated from P. leptodactylus and F. limosus shells is within this range. The chitin yield obtained from P. leptodactylus shells was lower than the yield reported for the same species by [43]. The observed differences may be attributed to different extraction methods [44].
The most common method used for chitin isolation is carried out with HCl and NaOH [17]. According to Gadgey and Bahekar [44], strong acid and alkali treatment can negatively affect the obtained polymer. Using this method on a commercial scale is also considered hazardous to the environment. One of the most promising methods for chitin extraction is based on NADES mixtures, as they are considered environmentally friendly and efficient [17,45]. Furthermore, some NADES might be reused [46,47,48]. Studies performed by Zhu et al. [31], Hong et al. (2018) on lobster shells, and Saravana et al. [49,50] on shrimp shells showed that it is possible to obtain chitin with high purity with the use of NADES mixture, composed of choline chloride as HBA, and malonic acid as HBD. In the study described herein, chitin isolation was performed following the method described in the work of Zhu et al. [31] but at higher temperatures during extraction. The FTIR and TG analysis indicated that the extraction performed on P. leptodactylus shells resulted in the obtention of chitin.
In contrast, extraction performed on F. limosus shells resulted in chitin with protein residues observed on FTIR spectra. The purity of chitin depends on many factors, such as reaction time, solvents, and their concentration, material/solvent ratio, pre-treatment, preparation of material, and its source [51]. Crustacean shell composition varies between species and might affect the success of chitin isolation [52,53]. The extraction resulted in a product with a higher yield, and the SEM analysis showed a better-organised microfibrillar structure than the one obtained with the standard method.
According to that reported by Kaya et al. [54], chitin and chitosan surface morphologies might be classified as (1) with porosity and microfibrillar structure, (2) without porosity or microfibrillar structure or (3) only with microfibrillar structure. Chitin obtained from P. leptodacylus and F. limosus shells showed microfibrillar structure with porosity, which might indicate good adsorption properties. The nano-fibre-like structures might suit wound dressings, plastics, or protection coats [55]. The structure of chitin extracted with NADES mixture looks well organised and smooth, suggesting promising properties of the polymer.
Molecular weight (MW) is one of the most critical factors that determines polymers biological properties. Ribeiro et al. [56] classified chitosan with Mw of about 571 kDa as high MW and chitosan with Mw of about 158 kDa as low MW, meanwhile Hsu et al. [57] classified chitosan with Mw ranging from 181 kDa to 204 kDa as medium MW and from Mw 300 kDa onwards as high MW. Chitosan samples obtained in the current study from both species, with Mw around 230 kDa, may be classified as medium MW. Chitosan has higher mechanical strength and a slower degradation rate with increased viscosity average molecular weight (MV) [58]. Still, with this increase, the viscosity of the polymer solutions also increases, and the encapsulation efficiency decreases [59]. Medium MW chitosan might be used in bioplastics [40]. Another important factor is the MW distribution related to molecular dispersity. For monodisperse polymers (all chains of the same length), Dm is 1. The best-controlled synthetic polymers (e.g., low molecular dispersity polymers used for calibration) have a Dm of 1.02–1.10 [60]. In our study, both chitosan samples presented high Dm values, around 10.
Chitosan, in general, shows antibacterial activity, but it varies between polymers of this group and depends on many factors, such as MW, DD, source, and the chosen target [61]. The preliminary antibacterial assessment usually concerns activity against E. coli and S. aureus, considered common, pathogenic, drug-resistant bacteria [37,38]. Chitosan, by itself, has lower activity than clinical antimicrobial drugs [28,62]. It was observed for both chitosan samples investigated in the current study that antibacterial activity was much lower than that of ampicillin. According to Zheng and Zhu [63], chitosan with higher MW inhibits bacterial growth by blocking nutrient adsorption by forming a film. The studies performed by Liu et al. [64] evidenced that when the antibacterial activity of chitosan samples was analysed with varied MW and concentration, chitosan of low MW had higher activity than chitosan of high MW. In the current study, both chitosan samples showed antibacterial activity. Chitosan from P. leptodactylus shells was characterised by a slightly higher MW and higher antibacterial activity against E. coli and S. aureus than chitosan obtained from F. limosus.
Moreover, these results correlate with the works of Burgos-Diaz et al. [65] on chitosan with two-fold higher MW (about 589 kDa) from Parastacus pugnax shells, that was characterised by much higher antibacterial activity against both E. coli (MBC = 0.31 mg/mL), and S. aureus (MBC = 0.04 mg/mL) [65]. On the other hand, the MIC for chitosan from isopod Saduria entomon with medium MW 313 kDa against S. aureus was determined at 3.34 mg/mL, which is higher than MIC for both P. leptodactylus and F. limosus samples. Furthermore, the activity for S. entomon sample against E. coli was not observed at all [32]. Chitosan obtained from P. leptodactylus shells showed stronger antibacterial activity against gram-positive bacteria than against gram-negative bacteria. The same tendency was also observed for chitosan from S. entomon [32], P. pugnax [65], and commercial chitosan with MV 224 kDa in studies conducted by No et al. [66]. On the contrary, chitosan from F. limosus shells showed stronger inhibition activity against S. aureus, whereas the MBC values were determined at the same concentration against both strains.
Chitosan is generally characterized by biodegradability, low toxicity and bioadhesive properties, and it has been described to provide controlled release when used as matrix material of drug carriers [67,68]. In this regard, it has been used to produce nanoparticles, microparticles and films, which thus benefit from the described properties, showing great potential as drug carriers [69,70]. However, the features of each chitosan vary depending on many factors such as its source, DD and MW, and the cytotoxicity of these polymers also differs. Cytotoxicity assays are the first step in the biocompatibility assessment, and it is essential to investigate each candidate in specific conditions appropriate for the chosen application and target [30]. In this study, both chitosan samples showed time- and concentration-dependent toxicity against A549 cells. The dose-dependent cytotoxicity of chitosan observed herein was previously reported [70], attributed to the medium MW of the tested chitosan and the related diffusional limitations. The slight time-dependent cytotoxicity was also observed for medium MW chitosan by Franca et al. [71]. In that study, a reduction in cell viability to 70% was observed for a concentration of about 1000 μg/mL. In another study [72], cytotoxicity for medium MW chitosan was observed at 250 μg/mL after 24 h of exposure to the samples, with reduced cell viability to <60%. The same study showed even stronger cytotoxicity for chitosan obtained from Mayfly and low MW chitosan. The authors suggested that chitosan’s toxicity might be dependent on its source. Cytotoxicity observed for P. leptodactylus and F. limosus chitosan samples was mild when concentrations up to 250 μg/mL were tested, which could be adequate in many applications [73,74].

5. Conclusions

It is possible to obtain 22% and 20% of chitin yield from P. leptodactylus and F. limosus shells, respectively. Furthermore, it is possible to obtain chitin from P. leptodactylus shells with a NADES mixture composed of choline chloride and malonic acid. However, the chosen extraction conditions are too mild to separate the chitin-protein complex in F. limosus shells. The deacetylation of each chitin was successful, indicating that P. leptodactylus and F. limosus shells might also be used as chitosan sources. The chitosan obtained from both crustaceans revealed antimicrobial activity against E. coli and S. aureus bacteria. Chitosan from P. leptodactylus showed stronger antibacterial activity against gram-positive bacteria than against gram-negative bacteria. Contrarily, the MIC values for F. limosus chitosan were lower for gram-negative bacteria, whereas the MBC values were equal. Both chitosan samples showed cytotoxicity against A549 cells, particularly for concentrations above 250 μg/mL, with a more favourable profile for chitosan from F. limosus shells.

Author Contributions

Conceptualization: A.D.-K., G.B., P.M., A.G., M.C.B. and C.M.C.; methodology, G.B., P.M., A.G., P.G., C.M. and A.M.R.d.C.; software, Z.N., J.F.P., J.P.d.S., L.C., M.S., C.M., A.M.R.d.C. and P.G.; validation, G.B., P.M., A.G., A.M.R.d.C., L.C., C.M., P.G., M.S., A.D.-K., M.C.B. and C.M.C.; formal analysis, Z.N., C.M., A.M.R.d.C., P.G., L.C. and M.S.; investigation, Z.N., G.B., P.M., A.G., J.F.P., J.P.d.S., A.M.R.d.C., C.M., M.S. and L.C.; resources, M.C.B., C.M.C, A.D.-K. and A.G.; data curation, Z.N., L.C., M.S., J.F.P. and J.P.d.S.; writing—original draft preparation, Z.N. writing—review and editing, G.B., P.M., A.G., J.F.P., J.P.d.S., A.M.R.d.C., L.C., C.M., P.G., M.S., A.D.-K., M.C.B. and C.M.C.; visualization, Z.N., A.M.R.d.C., J.F.P., C.M., L.C. and M.S., supervision, G.B., P.M., A.G., A.D.-K., C.M.C. and M.C.B., project administration, A.D.-K. All authors have read and agreed to the published version of the manuscript.

Funding

This research received no external funding.

Data Availability Statement

The data presented in this study are available on request from the corresponding author.

Acknowledgments

We would like to thank Gospodarstwo Rybackie “Mielno” sp. z o.o. and Gospodarstwo Rybackie Bytów sp. z o.o. for crayfishes, and to ERASMUS+ Programme for Mobility Grants, that made the cooperation between our universities possible.

Conflicts of Interest

The authors declare no conflict of interest.

References

  1. Peniche, C.; Argüelles-Monal, W.; Goycoolea, F.M. Chitin and chitosan: Major sources, properties and applications. In Monomers, Polymers and Composites from Renewable Resources; Elsevier: Amsterdam, The Netherlands, 2008; pp. 517–542. [Google Scholar]
  2. Oyatogun, G.M.; Esan, T.A.; Akpan, E.I.; Adeosun, S.O.; Popoola, A.P.I.; Imasogie, B.I.; Akinluwade, K.J. Chitin, chitosan, marine to market. In Handbook of Chitin and Chitosan; Elsevier: Amsterdam, The Netherlands, 2020; pp. 335–376. [Google Scholar]
  3. Atlas of Crayfish in Europe; Patrimoines Naturrels; Souty-Grosset, C.; Holdich, D.M.; Noël, P.Y.; Reynolds, J.D.; Haffner, P. (Eds.) Muséum National d’Histoire Naturelle: Paris, France, 2006; Volume 64, p. 187. [Google Scholar]
  4. Kouba, A.; Petrusek, A.; Kozak, P. Continental-wide distribution of crayfish species in Europe. Update and maps. Knowl. Manag. Aquat. Ecosyst. 2014, 413, 5. [Google Scholar] [CrossRef]
  5. Szaniawska, A.; Dobrzycka-Krahel, A.; Jaszczołt, J. Spiny-cheek crayfish Orconectes limosus (Rafinesque, 1817) on its way to the open coastal waters of the Baltic Sea. Oceanol. Hydrobiol. Stud. 2017, 46, 451–463. [Google Scholar] [CrossRef]
  6. Dobrzycka-Krahel, A.; Fidalgo, M.L. Euryhalinity and geographical origin aid global crayfish invasion. Water 2023, 15, 569. [Google Scholar] [CrossRef]
  7. Hessen, D.O.; Skurdal, J. Food consumption, turnover rates and assimilation in the noble crayfish (Astacus astacus). Freshw. Crayfish 1987, 7, 309–317. [Google Scholar]
  8. D’Agaro, E.; Renai, B.; Gherardi, F. Evaluation of the American waterweed (Elodea canadensis Michx.) as supplemental food for the noble crayfish, Astacus astacus. BFPP-Bull. Fr. Peche Piscic. 2004, 372–373, 439–445. [Google Scholar] [CrossRef]
  9. Vojkovská, R.; Horká, I.; Ďuriš, Z. The diet of the spiny-cheek crayfish Orconectes limosus in the Czech Republic. Cent. Eur. J. Biol. 2014, 9, 58–69. [Google Scholar] [CrossRef]
  10. Harlioğlu, M.M. The present situation of freshwater crayfish, Astacus leptodactylus (Eschscholtz, 1823) in Turkey. Aquaculture 2004, 230, 181–187. [Google Scholar] [CrossRef]
  11. Crandall, K.A.; De Grave, S. An updated classification of the freshwater crayfishes (Decapoda: Astacidea) of the world, with a complete species list. J. Crust. Biol. 2017, 37, 615–653. [Google Scholar] [CrossRef]
  12. Cai, J.; Galli, G. Top 10 Species Groups in Global Aquaculture 2018; Food and Agriculture Organization of the United Nations: Rome, Italy, 2021. [Google Scholar]
  13. Özturan, S.; Gülgün, F.; Ünal Şengör, G.G.U. Effects of cooking methods on the quality and safety of crayfish (Astacus leptodactylus Eschscholtz, 1823) during chilled storage. J. Food Process. Preserv. 2022, 46, e16887. [Google Scholar] [CrossRef]
  14. CABI. 2023 CABI Compendium. Available online: https://www.cabi.org (accessed on 30 March 2023).
  15. Pyšek, P.; Hulme, P.E.; Simberloff, D.; Bacher, S.; Blackburn, T.M.; Carlton, J.T.; Richardson, D.M. Scientists’ warning on invasive alien species. Biol. Rev. 2020, 95, 1511–1534. [Google Scholar] [CrossRef]
  16. Śmietana, N.; Panicz, R.; Sobczak, M.; Śmietana, P.; Nędzarek, A. Spiny-cheek crayfish, Faxonius limosus (Rafinesque, 1817), as an alternative food source. Animals 2020, 11, 59. [Google Scholar] [CrossRef] [PubMed]
  17. Bastiaens, L.; Soetemans, L.; D’Hondt, E.; Elst, K. Sources of Chitin and Chitosan and their Isolation. In Chitin and Chitosan: Properties and Applications; John Wiley & Sons: Hoboken, NJ, USA, 2019; pp. 1–34. [Google Scholar] [CrossRef]
  18. El-Naggar, M.M.; Abou-Elmagd, W.S.; Suloma, A.; El-Shabaka, H.A.; Khalil, M.T.; Abd El-Rahman, F.A. Optimization and physicochemical characterization of chitosan and chitosan nanoparticles extracted from the crayfish Procambarus clarkii wastes. J. Shellfish. Res. 2019, 38, 385–395. [Google Scholar] [CrossRef]
  19. Paiva, A.; Craveiro, R.; Aroso, I.; Martins, M.; Reis, R.L.; Duarte, A.R.C. Natural deep eutectic solvents–solvents for the 21st century. ACS Sustain. Chem. Eng. 2014, 2, 1063–1071. [Google Scholar] [CrossRef]
  20. Mišan, A.; Nađpal, J.; Stupar, A.; Pojić, M.; Mandić, A.; Verpoorte, R.; Choi, Y.H. The perspectives of natural deep eutectic solvents in agri-food sector. Crit. Rev. Food Sci. Nutr. 2020, 60, 2564–2592. [Google Scholar] [CrossRef] [PubMed]
  21. Khajavian, M.; Vatanpour, V.; Castro-Muñoz, R.; Boczkaj, G. Chitin and derivative chitosan-based structures—Preparation strategies aided by deep eutectic solvents: A review. Carbohydr. Polym. 2022, 275, 118702. [Google Scholar] [CrossRef] [PubMed]
  22. Hajji, S.; Younes, I.; Ghorbel-Bellaaj, O.; Hajji, R.; Rinaudo, M.; Nasri, M.; Jellouli, K. Structural differences between chitin and chitosan extracted from three different marine sources. Int. J. Biol. Macromol. 2014, 65, 298–306. [Google Scholar] [CrossRef] [PubMed]
  23. Wysokowski, M.; Machałowski, T.; Petrenko, I.; Schimpf, C.; Rafaja, D.; Galli, R.; Ehrlich, H. 3D chitin scaffolds of marine demosponge origin for biomimetic mollusk hemolymph-associated biomineralization ex-vivo. Mar. Drugs 2020, 18, 123. [Google Scholar] [CrossRef] [PubMed]
  24. Lin, X.; Zhang, H.; Li, S.; Huang, L.; Zhang, R.; Zhang, L.; Duan, B. Polyphenol-driving assembly for constructing chitin-polyphenol-metal hydrogel as wound dressing. Carbohydr. Polym. 2022, 290, 119444. [Google Scholar] [CrossRef]
  25. Lv, S.H. High-performance superplasticizer based on chitosan. In Biopolymers and Biotech Admixtures for Eco-Efficient Construction Materials; Woodhead Publishing: Sawston, UK, 2016; pp. 131–150. [Google Scholar] [CrossRef]
  26. Lehr, C.M.; Bouwstra, J.A.; Schacht, E.H.; Junginger, H.E. In vitro evaluation of mucoadhesive properties of chitosan and some other natural polymers. Int. J. Pharm. 1992, 78, 43–48. [Google Scholar] [CrossRef]
  27. Liu, H.; Du, Y.; Wang, X.; Sun, L. Chitosan kills bacteria through cell membrane damage. Int. J. Food Microbiol. 2004, 95, 147–155. [Google Scholar] [CrossRef]
  28. Ke, C.L.; Deng, F.S.; Chuang, C.Y.; Lin, C.H. Antimicrobial actions and applications of chitosan. Polymers 2021, 13, 904. [Google Scholar] [CrossRef]
  29. Wedmore, I.; McManus, J.G.; Pusateri, A.E.; Holcomb, J.B. A special report on the chitosan-based hemostatic dressing: Experience in current combat operations. J. Trauma Acute Care Surg. 2006, 60, 655–658. [Google Scholar] [CrossRef] [PubMed]
  30. Rodrigues, S.; Dionísio, M.; Remunan Lopez, C.; Grenha, A. Biocompatibility of chitosan carriers with application in drug delivery. J. Funct. Biomater. 2012, 3, 615–641. [Google Scholar] [CrossRef] [PubMed]
  31. Zhu, P.; Gu, Z.; Hong, S.; Lian, H. One-pot production of chitin with high purity from lobster shells using choline chloride–malonic acid deep eutectic solvent. Carbohydr. Polym. 2017, 177, 217–223. [Google Scholar] [CrossRef]
  32. Rodriguez-Veiga, I.; Acosta, N.; Aranaz, I.; Dobrzycka-Krahel, A. Exploring Saduria entomon (Crustacea Isopoda) as a New Source for Chitin and Chitosan Isolation. Int. J. Mol. Sci. 2022, 23, 16125. [Google Scholar] [CrossRef] [PubMed]
  33. Barry, A.L.; Craig, W.A.; Nadle, H.; Reller, L.B.; Sanders, C.C.; Swenson, J.M. Methods for Determining Bactericidal Activity of Antimicrobial Agents: Approved Guideline; National Committee for Clinical Laboratory Standards: Wayne, PA, USA, 1999; Volume 19, p. 18. [Google Scholar]
  34. Wikler, M.A. Methods for Dilution Antimicrobial Susceptibility Tests for Bacteria That Grow Aerobically. Approved Standard M7-A6, 6th ed.; NCCLS: Wayne, PA, USA, 2003. [Google Scholar]
  35. ISO 10993-5: 2009; Biological Evaluation of Medical Devices-Part 5: Tests for In Vitro Cytotoxicity 2009. International Organization for Standardization: Geneva, Switzerland, 2009.
  36. Ferrero, F.; Periolatto, M. Antimicrobial finish of textiles by chitosan UV-curing. J. Nanosci. Nanotechnol. 2012, 12, 4803–4810. [Google Scholar] [CrossRef] [PubMed]
  37. Fleckenstein, J.M.; Kuhlmann, F.M. Enterotoxigenic Escherichia coli infections. Curr. Infect. Dis. Rep. 2019, 21, 1–9. [Google Scholar] [CrossRef]
  38. Ford, C.A.; Hurford, I.M.; Cassat, J.E. Antivirulence strategies for the treatment of Staphylococcus aureus infections: A mini review. Front. Microbiol. 2021, 11, 632706. [Google Scholar] [CrossRef]
  39. Meyers, S.P.; Chen, H.M.; No, H.K.; Lee, K.S. An integrated approach to recovery and utilization of Louisiana crawfish processing wastes. In Making Profits out of Seafood Wastes; Keller, S., Ed.; University of Alaska Sea Grant: Anchorage, AK, USA, 1990; pp. 161–171. [Google Scholar]
  40. Kaya, M.; Baran, T.; Karaarslan, M. A new method for fast chitin extraction from shells of crab, crayfish and shrimp. Nat. Prod. Res. 2015, 29, 1477–1480. [Google Scholar] [CrossRef]
  41. Ghannam, H.E.; Talab, A.S.; Dolgano, N.V.; Husse, A.; Abdelmagui, N.M. Characterization of chitosan extracted from different crustacean shell wastes. J. Appl. Sci. 2016, 16, 454–461. [Google Scholar] [CrossRef]
  42. Abdou, E.S.; Nagy, K.S.; Elsabee, M.Z. Extraction and characterization of chitin and chitosan from local sources. Bioresour. Technol. 2008, 99, 1359–1367. [Google Scholar] [CrossRef] [PubMed]
  43. Küçükgülmez, A. Extraction of chitin from crayfish (Astacus leptodactylus) shell waste. Alinteri J. Agric. Sci. 2018, 33, 99–104. [Google Scholar] [CrossRef]
  44. Gadgey, K.K.; Bahekar, A. Studies On Extraction Methods of Chitin From CRAB Shell and Investigation of Its Mechanical Properties. Int. J. Mech. Eng. Technol. 2017, 8, 220–231. [Google Scholar]
  45. Pan, S.Y.; Fan, C.; Lin, Y.P. Development and deployment of green technologies for sustainable environment. Environments 2019, 6, 114. [Google Scholar] [CrossRef]
  46. Huang, W.C.; Zhao, D.; Guo, N.; Xue, C.; Mao, X. Green and facile production of chitin from crustacean shells using a natural deep eutectic solvent. J. Agric. Food Chem. 2018, 66, 11897–11901. [Google Scholar] [CrossRef]
  47. Zhao, D.; Huang, W.C.; Guo, N.; Zhang, S.; Xue, C.; Mao, X. Two-step separation of chitin from shrimp shells using citric acid and deep eutectic solvents with the assistance of microwave. Polymers 2019, 11, 409. [Google Scholar] [CrossRef]
  48. Li, Z.; Li, M.C.; Liu, C.; Liu, X.; Lu, Y.; Zhou, G.; Mei, C. Microwave-assisted deep eutectic solvent extraction of chitin from crayfish shell wastes for 3D printable inks. Ind. Crops Prod. 2023, 194, 116325. [Google Scholar] [CrossRef]
  49. Hong, S.; Yuan, Y.; Yang, Q.; Zhu, P.; Lian, H. Versatile acid base sustainable solvent for fast extraction of various molecular weight chitin from lobster shell. Carbohydr. Polym. 2018, 201, 211–217. [Google Scholar] [CrossRef]
  50. Saravana, P.S.; Ho, T.C.; Chae, S.J.; Cho, Y.J.; Park, J.S.; Lee, H.J.; Chun, B.S. Deep eutectic solvent-based extraction and fabrication of chitin films from crustacean waste. Carbohydr. Polym. 2018, 195, 622–630. [Google Scholar] [CrossRef]
  51. Morgan, K.; Conway, C.; Faherty, S.; Quigley, C. A Comparative Analysis of Conventional and Deep Eutectic Solvent (DES)-Mediated Strategies for the Extraction of Chitin from Marine Crustacean Shells. Molecules 2021, 26, 7603. [Google Scholar] [CrossRef]
  52. Austin, P.R.; Brine, C.J.; Castle, J.E.; Zikakis, J.P. Chitin: New facets of research. Science 1981, 212, 749–753. [Google Scholar] [CrossRef] [PubMed]
  53. Arbia, W.; Arbia, L.; Adour, L.; Amrane, A. Chitin extraction from crustacean shells using biological methods—A review. Food Technol. Biotechnol. 2013, 51, 12–25. [Google Scholar]
  54. Kaya, M.; Baran, T.; Mentes, A. Extraction and Characterization of α-Chitin and Chitosan from Six Different Aquatic Invertebrates. Food Biophys. 2014, 9, 145–157. [Google Scholar] [CrossRef]
  55. Ishihara, M.; Nguyen, V.Q.; Mori, Y.; Nakamura, S.; Hattori, H. Adsorption of silver nanoparticles onto different surface structures of chitin/chitosan and correlations with antimicrobial activities. Int. J. Mol. Sci. 2015, 16, 13973–13988. [Google Scholar] [CrossRef] [PubMed]
  56. Ribeiro, J.C.V.; Forte, T.C.M.; Tavares, S.J.S.; Andrade, F.K.; Vieira, R.S.; Lima, V. The effects of the molecular weight of chitosan on the tissue inflammatory response. J. Biomed. Mater. Res. Part A 2021, 109, 2556–2569. [Google Scholar] [CrossRef] [PubMed]
  57. Hsu, S.H.; Whu, S.W.; Tsai, C.L.; Wu, Y.H.; Chen, H.W.; Hsieh, K.H. Chitosan as scaffold materials: Effects of molecular weight and degree of deacetylation. J. Polym. Res. 2004, 11, 141–147. [Google Scholar] [CrossRef]
  58. Yang, H.C.; Hon, M.H. The effect of the molecular weight of chitosan nanoparticles and its application on drug delivery. Microchem. J. 2009, 92, 87–91. [Google Scholar] [CrossRef]
  59. Shrivastava, A. Polymerization. In Introduction to Plastics Engineering; William Andrew Publishing: Norwich, NY, USA, 2018; pp. 17–48. ISBN 9780323395007. [Google Scholar] [CrossRef]
  60. Li, J.; Zhuang, S. Antibacterial activity of chitosan and its derivatives and their interaction mechanism with bacteria: Current state and perspectives. Eur. Polym. J. 2020, 138, 109984. [Google Scholar] [CrossRef]
  61. Erman, A.; Hergouth, V.K.; Blango, M.G.; Kos, M.K.; Mulvey, M.A.; Veranič, P. Repeated treatments with chitosan in combination with antibiotics completely eradicate uropathogenic Escherichia coli from infected mouse urinary bladders. J. Infect. Dis. 2017, 216, 375–381. [Google Scholar] [CrossRef]
  62. Zheng, L.Y.; Zhu, J.F. Study on antimicrobial activity of chitosan with different molecular weights. Carbohydr. Polym. 2003, 54, 527–530. [Google Scholar] [CrossRef]
  63. Liu, N.; Chen, X.G.; Park, H.J.; Liu, C.G.; Liu, C.S.; Meng, X.H.; Yu, L.J. Effect of MW and concentration of chitosan on antibacterial activity of Escherichia coli. Carbohydr. Polym. 2006, 64, 60–65. [Google Scholar] [CrossRef]
  64. Burgos-Díaz, C.; Opazo-Navarrete, M.; Palacios, J.L.; Barahona, T.; Mosi-Roa, Y.; Anguita-Barrales, F.; Bustamante, M. Synthesis of New Chitosan from an Endemic Chilean Crayfish Exoskeleton (Parastacus pugnax): Physicochemical and Biological Properties. Polymers 2021, 13, 2304. [Google Scholar] [CrossRef] [PubMed]
  65. No, H.K.; Park, N.Y.; Lee, S.H.; Meyers, S.P. Antibacterial activity of chitosans and chitosan oligomers with different molecular weights. Int. J. Food Microbiol. 2002, 74, 65–72. [Google Scholar] [CrossRef] [PubMed]
  66. Kean, T.; Thanou, M. Biodegradation, biodistribution and toxicity of chitosan. Adv. Drug Deliv. Rev. 2010, 62, 3–11. [Google Scholar] [CrossRef] [PubMed]
  67. Xing, L.; Fan, Y.T.; Zhou, T.J.; Gong, J.H.; Cui, L.H.; Cho, K.-H.; Cho, C.S. Chemical Modification of Chitosan for Efficient Vaccine Delivery. Molecules 2018, 23, 229. [Google Scholar] [CrossRef] [PubMed]
  68. Grenha, A.; Grainger, C.I.; Dailey, L.A.; Seijo, B.; Martin, G.P.; Remuñán-López, C.; Forbes, B. Chitosan nanoparticles are compatible with respiratory epithelial cells in vitro. Eur. J. Pharm. Sci. 2007, 31, 73–84. [Google Scholar] [CrossRef] [PubMed]
  69. Chalitangkoon, J.; Wongkittisin, M.; Monvisade, P. Silver loaded hydroxyethylacryl chitosan/sodium alginate hydrogel films for controlled drug release wound dressings. Int. J. Biol. Macromol. 2020, 159, 194–203. [Google Scholar] [CrossRef]
  70. Huang, M.; Khor, E.; Lim, L.-Y. Uptake and cytotoxicity of chitosan molecules and nanoparticles: Effects of molecular weight and degree of deacetylation. Pharm. Res. 2004, 21, 344–353. [Google Scholar] [CrossRef]
  71. Franca, R.; Mbeh, D.A.; Samani, T.D.; Le Tien, C.; Mateescu, M.A.; Yahia, L.H.; Sacher, E. The effect of ethylene oxide sterilization on the surface chemistry and in vitro cytotoxicity of several kinds of chitosan. J. Biomed. Mater. Res. Part B Appl. Biomater. 2013, 101, 1444–1455. [Google Scholar] [CrossRef]
  72. Tan, G.; Kaya, M.; Tevlek, A.; Sargin, I.; Baran, T. Antitumor activity of chitosan from mayfly with comparison to commercially available low, medium and high molecular weight chitosans. Vitr. Cell. Dev. Biol.-Anim. 2018, 54, 366–374. [Google Scholar] [CrossRef]
  73. Illum, L.; Jabbal-Gill, I.; Hinchcliffe, M.; Fisher, A.N.; Davis, S.S. Chitosan as a novel nasal delivery system for vaccines. Adv. Drug Deliv. Rev. 2001, 51, 81–96. [Google Scholar] [CrossRef]
  74. Macleod, G.S.; Fell, J.T.; Collett, J.H.; Sharma, H.L.; Smith, A.M. Selective drug delivery to the colon using pectin: Chitosan: Hydroxypropyl methylcellulose film coated tablets. Int. J. Pharm. 1999, 187, 251–257. [Google Scholar] [CrossRef]
Figure 1. FTIR spectra of chitin standard (a), and materials obtained from: P. leptodactylus (b), and F. limosus shells (c) with standard method and materials obtained from P. leptodactylus (d) and F. limosus (e) shells with NADES.
Water 15 03024 g001
Figure 2. FTIR spectra of chitosan standard (a) and deacetylated materials obtained from P. leptodactylus (b) and F. limosus (c) shells using the standard method.
Water 15 03024 g002
Figure 3. TG curves of chitin standard (a), samples obtained from standard extraction performed on P. leptodactylus (b) and F. limosus (c) shells and after extraction with NADES mixture performed on P. leptodactylus (d) and F. limosus (e) shells.
Water 15 03024 g003
Figure 4. TG curves of chitosan standard (a), material obtained after P. leptodactylus (b), and F. limosus (c) samples deacetylation.
Water 15 03024 g004
Figure 5. SEM images of chitin obtained from P. leptodactylus shells with NADES ((a) 20.00K×, (b) 25.00K×).
Water 15 03024 g005
Figure 6. SEM images of chitosan were obtained from P. leptodactylus (a) and F. limosus (b) using standard extraction.
Water 15 03024 g006
Figure 7. Size exclusion chromatography elution profiles of chitosan samples from P. leptodactylus and F. limosus.
Water 15 03024 g007
Figure 8. A549 cell viability was determined upon 3 h, 24 h, and 48 h exposure to chitosan from P. leptodactylus (a) and F. limosus (b). Data represent mean ± SEM (n = 3).
Water 15 03024 g008
Table 1. Chitin and chitosan recovery [%] in shells of P. leptodactylus and F. limosus obtained with a standard extraction, NADES, and NADES with citric acid pre-treatment.
SpeciesTreatmentChitin Recovery [%]Chitosan Recovery from Chitin [%]Chitosan Recovery from Shells [%]
P. leptodactylusstandard extraction22 ± 2.7 a70 ± 13.0 b15 ± 0.3 b
P. leptodactylusNADES24 cN/DN/D
P. leptodactylusNADES with citric acid pretreatment29 cN/DN/D
F. limosusstandard extraction20 ± 3.4 d76 ± 9.0 b14 ± 4.2 b
F. limosusNADES31 cN/DN/D
F. limosusNADES with citric acid pretreatment25 cN/DN/D
a n = 5; b n = 2; c n = 1; d n = 4; N/D—not determined.
Table 2. FTIR spectra assignments of the relevant bands for chitin standard and material obtained from P. leptodactylus and F. limosus shells.
Functional GroupCommercial Chitin
Wavenumber [cm−1]
P. leptodactylus
Wavenumber [cm−1]
F. limosus
Wavenumber [cm−1]
P. leptodactylus (NADES)
Wavenumber [cm−1]
F. limosus (NADES)
Wavenumber [cm−1]
Amide I16221633162816221635
Amide II15511553155215511549
-C-H28752879289028832874
-C-O-C-10701063106710711068
10261026102610111027
Table 3. FTIR spectra assignments of the relevant bands for chitosan standard and material obtained after deacetylation of the material obtained from P. leptodactylus and F. limosus shells.
Functional GroupCommercial Chitosan
Wavenumber [cm−1]
P. leptodactylus
Wavenumber [cm−1]
F. limosus
Wavenumber [cm−1]
Amide I164716541650
Amide II156415901590
-C-H287228742864
-C-O-C-106310541059
102710271026
Table 4. The minimum inhibitory (MIC) and minimum bactericidal (MBC) concentrations [mg/mL] of chitosan was obtained from P. leptodactylus and F. limosus shells and of ampicillin against E. coli and S. aureus.
SpeciesMIC (E. coli)MIC (S. aureus)MBC (E. coli)MBC (S. aureus)
P. leptodactylus1.191.591.58 2.48
F. limosus2.48 1.96 4.90 4.90
Chitosan s.*1.15 2.30 >9.20 >9.20
Ampicilin5 × 10−30.5 × 10−310 × 10−32 × 10−3
* Chitosan standard, commercially available.
Table 5. IC50 values [mg/mL] calculated for chitosan obtained from P. leptodactylus and F. limosus for epithelial cell line (A459) after 3, 24 and 48 h.
SpeciesIC50 (3 h)IC50 (24 h)IC50 (48 h)
P. leptodactylus0.510.240.14
F. limosus0.520.490.34
Disclaimer/Publisher’s Note: The statements, opinions and data contained in all publications are solely those of the individual author(s) and contributor(s) and not of MDPI and/or the editor(s). MDPI and/or the editor(s) disclaim responsibility for any injury to people or property resulting from any ideas, methods, instructions or products referred to in the content.

