Article

Experimental Investigation of Breach Mechanism for Overtopped Cohesive and Non-Cohesive Embankments

1
Civil Engineering Department, Maharishi Dayanand University, Rohtak 124001, India
2
Civil Engineering Department, Galgotias College of Engineering and Technology, Greater Noida 201310, India
3
Civil Engineering Department, GLA University, Mathura 281406, India
4
Department of Civil Engineering, College of Engineering, King Saud University, Riyadh 11451, Saudi Arabia
5
Department of Civil, Environmental and Architectural Engineering, University of Padova, Via Marzolo, 9, 35131 Padova, Italy
*
Authors to whom correspondence should be addressed.
Water 2023, 15(17), 3030; https://doi.org/10.3390/w15173030
Submission received: 24 June 2023 / Revised: 1 August 2023 / Accepted: 7 August 2023 / Published: 23 August 2023

Abstract

:
The failure of an embankment causes loss of lives, massive damage to infrastructure and the interruption of basic facilities; it has thus drawn increasing attention from researchers. When compared to other types of embankment disasters, overtopping-related embankment breaches are much more frequent. The study of the breach mechanism of embankments due to overtopping is becoming more and more essential for developing evacuation plans, early warning systems and damage assessment. To recognize the breach activities of embankments, it is necessary to find out discrete breach considerations like breach depth, breach initiation, breach width, etc. In the present study, a total of six tests were performed in a narrow flume using an embankment model. By conducting different experiments, it was observed that embankment breaching may be described in three stages, i.e., initial erosion, headcut erosion and lateral erosion. Furthermore, erosion is a three-dimensional process that occurs during embankment breaching, with the majority of erosion movement being associated with lateral broadening. The rate of headcut migration also has an impact on the widening rate. Furthermore, it depends upon the type of fill material and dam geometry. Also, the observed effect of moisture content on breach widening proved that the rate of widening was strongly influenced by water content. A drop of about 50% in moisture content causes approximately a 20% decrease in time to failure. In the present study, it is observed that breach shape could not be assumed to be regular shape like rectangle or trapezoid, as described in the literature. The trials were carried out in a narrow flume under constant hydraulic conditions, which are two of the study’s limitations.

1. Introduction

Since the dawn of civilization, embankments have been essential to the growth of every country. There are several embankment dams today that serve society’s social and economic needs, such as water supply (for residential use and industrial use), irrigation, navigation and flood control. These dams also deal with significant safety-related issues. These dams may burst as a result of mechanisms such as overtopping, leaking, seepage, or natural calamities, posing serious threats to human life and resulting in property loss and the obstruction of essential infrastructure. According to [1], dam break flood models and cutting-edge remote sensing data can offer engineers and stakeholders useful outcomes for decision making and planning in order to deal with the effects of comparable catastrophes around the world. The rate of breaching largely determines the size and scope of losses brought on by embankment failure. Ref. [2] compiled a database from past dam failures and reported that 66% of dam failures were earthfill dams. Ref. [3] noted that more than 90% of the dam failures in China are associated with earthen dams and they further observed that the main cause of failure was overtopping. According to [4], the failures of dams due to overtopping are more common than failures caused by other causes. Ref. [5] studied 900 dam failures and concluded that the most common cause of earth dam failures are overtopping and piping. Overtopping was the most frequent reason for embankment failure, according to statistics on prior embankment dam failures. Hence, it is highly necessary to study the behavior of an embankment before the breaching and not during the breaching. By studying the breach mechanism, it is easy to develop evacuation plans or warning systems to decrease the loss of lives and infrastructure.
Ref. [6] and subsequently [7] in their research work summarized the methods of modeling the breaching of embankment dams. Ref. [8] evaluated a quantitative analysis of embankment dam breach modeling methods and observed uncertainties associated to a large extent with breach parameters. The author of [9] described the effects of flowing water on cohesive beds in his research work. Ref. [10] studied the mechanism of embankment breaching and broadly categorized breaching into three stages: breach morphology, breach hydraulics and breach erosion. These three aspects of dam breaching are implicitly related to each other. Besides researchers whose works have been described here, there are others who have contributed significantly to this topic [11,12,13].
Ref. [14] provided evidence that studies of dam breaches typically analyze breach phenomena, forecast key breach characteristics, and correlate these factors. For analyzing breach mechanism, the different parameters associated with dam breaching are breach width, breach depth, breach shape, peak outflow, sediment erosion rate and time-dependent breach parameters (breach initiation and time to failure of breach). Over the last few decades, researchers have developed many methods and models to analyze breach behavior of embankments using these parameters. From the literature, it may be concluded that the previous studies were based mainly either on historical data of dam failure or mathematical analysis using equations of hydraulics. But, embankment breaching is quite a complex process as it involves theories of hydraulics, erosion of sediments, and soil type and its influence when used in embankments. And the approaches, which are based on a database of dam failures, could not correlate the breaching process with hydraulic and geotechnical aspects. Ref. [15] studied the breach models and concluded that it is essential to conduct small-scale or large-scale tests which help to develop a correlation between laboratory tests and real dam failures. In the last decade, laboratory experimentation to correlate different breach parameters, small-scale and large-scale, have been executed to describe the breach phenomenon in detail. According to [16], the breach peak outflow—a crucial breach parameter—depends on the hydraulic, geometrical, and geotechnical characteristics of embankments. To evaluate embankment breaches and correctly forecast the peak outflow from breached embankments, [17] created an effective model utilizing ANN and MLR to forecast peak outflow.
The present paper describes the experimental study carried out in a flume to estimate the essential breach parameters. The experiments were conducted on six different embankment models in the flume, using two different types of soil, and determined different breach parameters like breach initiation, breach formation time, and time to breach. Also, to study the effect of moisture content on breach parameters, a set of three experiments were conducted. The experiments were carried out as follows:
  • The breach mechanism was recorded and analyzed to describe the behavior of the embankment during and after breaching;
  • The breach evolution was described in terms of three different stages;
  • A detailed study of the different breach shapes formed after the breaching process was carried out;
  • The effect of moisture content was described by analyzing the results of three experiments.

2. Review of Literature

In the present study, experiments were carried out in a water flume, the dimensions of which were a length of 10 m, width of 0.60 m and depth of 0.60 m. The side walls of the flume had Perspex panels facilitating the visualization of breach characteristics during the overtopping of the embankments. This flume had large reservoir tank attached to the flume. Digital cameras and piezometers were used to record the breach mechanism. A set of six experiments were conducted to study the breach mechanism and breach shape; a set of three experiments were conducted to study the effect of moisture content.
The research of [18] was supposed to propose the first breach model and simulated gradual dam breach erosion by using a notch of a certain width. By considering the impact of soil shear strength and the power of flowing water, he derived a relationship between the rate of erosion of the breach channel and the rate of water flow through the breach. In his study, he assumed the trapezoidal shape of the breach with a constant bottom width. Ref. [8] described the two primary steps for analyzing the dam breach, to predict the breach characteristics, and route the outflow hydrograph. A lot of research has been conducted on this topic since 1990. Ref. [6] compiled the different dam failures and the methods used by different researchers to analyze the breach behavior. These methods were critically studied and classified under different categories [19].
Broadly, there are three ways to study the breach behavior: parametric, simplified and detailed physical breach models. The parametric breach models were based on case study data and empirical equations were derived to determine different breach parameters [20]. There may be many errors in the prediction of breach parameters because the viability of these models was based on the documentation of prior dam breaches rather than physical processes, and these uncertainties were reported by [8].
Since the late 1990s, many simplified physical models [21,22] have been developed. Ref. [21] conducted laboratory experiments and developed a one-dimensional numerical model to simulate the dam surface erosion and slope sliding failure with time for overtopping dam failure. Ref. [22] derived the modeling of the hydraulics and erosion process in breach formation due to overtopping. MacDonald and Monopolis [23] compared the statistics from 42 past dam failures and observed breach side slopes as 1H: 2V in most cases by assuming a triangular or trapezoidal shape of breach. They related the breach time to failure (tf) with the volume of eroded material, which in turn related to the breach formation factor. Ref. [24] studied the erosion rate and degree of compaction and described the headcutting for embankments breaching due to overtopping. Using information from a study of 52 previous dam breaches, Ref. [25] created analytical models for the simulation of earth dam breach erosion. They made use of the breach erosion relation, the broad-crested weir hydraulics, and the water mass depletion equation for reservoirs. By considering the constant breach shape to be, for all intents and purposes, trapezoidal, they provided the relationship for top and bottom breach width and related it to time of failure. Ref. [26] observed larger-scale embankment breaching and studied internal erosion and piping processes. In these models, a number of assumptions were made to simplify the computation of breach parameters and different equations were derived to develop physical modes. Also, the detailed physical models were developed by many researchers [27,28,29,30], who described the limitations of these models as possessing a poor understanding of sediment transport and failure to compute erosion of earthen dam materials. Ref. [31] found that the cohesive forces of the fill material and the hydraulic parameters of the flow have a significant impact on the breach occurrence.
Additionally, Ref. [32] makes it necessary to create a database of actual cases and experimental study by [33,34] for a practical method to measure the breach opening, breaching mechanism of embankments and erodibility of soil. Ref. [33] performed five embankment experiments with different sand-silt-clay mixtures in the laboratory to describe the embankment breaching process, and concluded that headcut erosion played an important role in the process of breach growth in the embankments made of cohesive soil mixtures. Ref. [34] conducted experiments for earthen embankment breach using a fuse plug and concluded that the cohesiveness of soil has a remarkable impact on the process of breaching. Also, the degree of compaction and type of soil directly affects the rate of erosion on the downstream side during the overtopping of an embankment. The use of a fuse plug as an auxiliary spillway to prevent uncontrolled overtopping was described experimentally by many researchers [35,36,37]. Ref. [35] conducted the laboratory test with fuse plug model and performed eight tests. He concluded that the lateral erosion rate is a function of the erosion rate of the embankment fill material and not a function of the strength of the impermeable core. Ref. [36] described the general feasibility of two fuse plug designs by successful testing for the side spillway at the Hagneck Canal and concluded that both fuse plug designs remained stable for water levels below the trigger water level. Ref. [37] conducted laboratory tests with fuse plug models and performed three tests, one constructed with non-cohesive sediment (pure sand, c = 0) and the other two with different sand-silt-clay proportions. Examination of the data from these tests indicated that erosion at the toe of the downstream side of embankments played an important role in the process of breach growth in the embankments made of cohesive soil mixtures. Also, an increase in cohesive material in the sand-silt-clay mixture slowed down the erosion process. Furthermore, they concluded that application of fuse plugs increases the spillway capacity.
Verma et al. [38,39] used experimentation to study two fuse plug embankment models and observed a three-phase erosion profile to explain the entire embankment breaching process caused by overtopping. Ref. [38] conducted tests on embankment models with and without fuse plugs, and the water surface profile of different tests indicates that for non-cohesive soil the breaching progresses gradually, but in case of cohesive soil, it is steep erosion rather than progressive. Ref. [39] found that the size of the fuse plug, the type of fill, the amount of reservoir storage, and the intensity of the inflow all have a significant role in breach growth.
Recently, common tests have been conducted by various researchers for dam break analysis, including penetration tests (PT), pressure meter tests (PMT) and dilatometer tests [19,40,41,42,43]. Ref. [40] studied the scour profiles and their temporal variation and proposed a regression-based equation to predict equilibrium scour depth under smooth and rough aprons. Ref. [41] improved traditional set pair analysis by extending the connection degree to five grades and the definition of generalized set pair potential was introduced to determine the evaluation grade. Furthermore, they proposed a new method for evaluating the environmental impact grade of dam break, which provides guidance for the adoption of targeted control measures to reduce environmental risk. Ref. [19] derived a new set of statistical equations to predict the target breach parameters by collecting a database of 126 embankment failures and conducted five large-scale overtopping failure tests conducted on cohesive and non-cohesive soil embankments. Furthermore, they quantified uncertainty in the computed parameters. They concluded that breach parameters in cohesive soil embankments should be computed based on not only embankment dimensions but on soil properties as well. Ref. [42] described the bore hole investigations and necessity of different bore hole systems. Ref. [43] compiled the Indian dam failure list with relevant data which can be used for developing a breach parameters equation. They focused on developing new empirical equations for breach parameters and peak outflow from the dam failure, which suits Indian conditions. They concluded that the dam average thickness was another control variable for finding out the breach parameters, found it suitable for breach depth calculation, and proposed new equations to compute the peak outflow rate.
To address the issues raised in the literature, prototype small- and large-scale experiments must also be carried out to study the breach mechanism thoroughly. The present study includes the breach evolution (recorded and described in terms of three different stages) and the detailed study of different breach shapes formed after the breaching process; the effect of moisture content on the rate of breaching is also described to fill the gap observed in the literature.

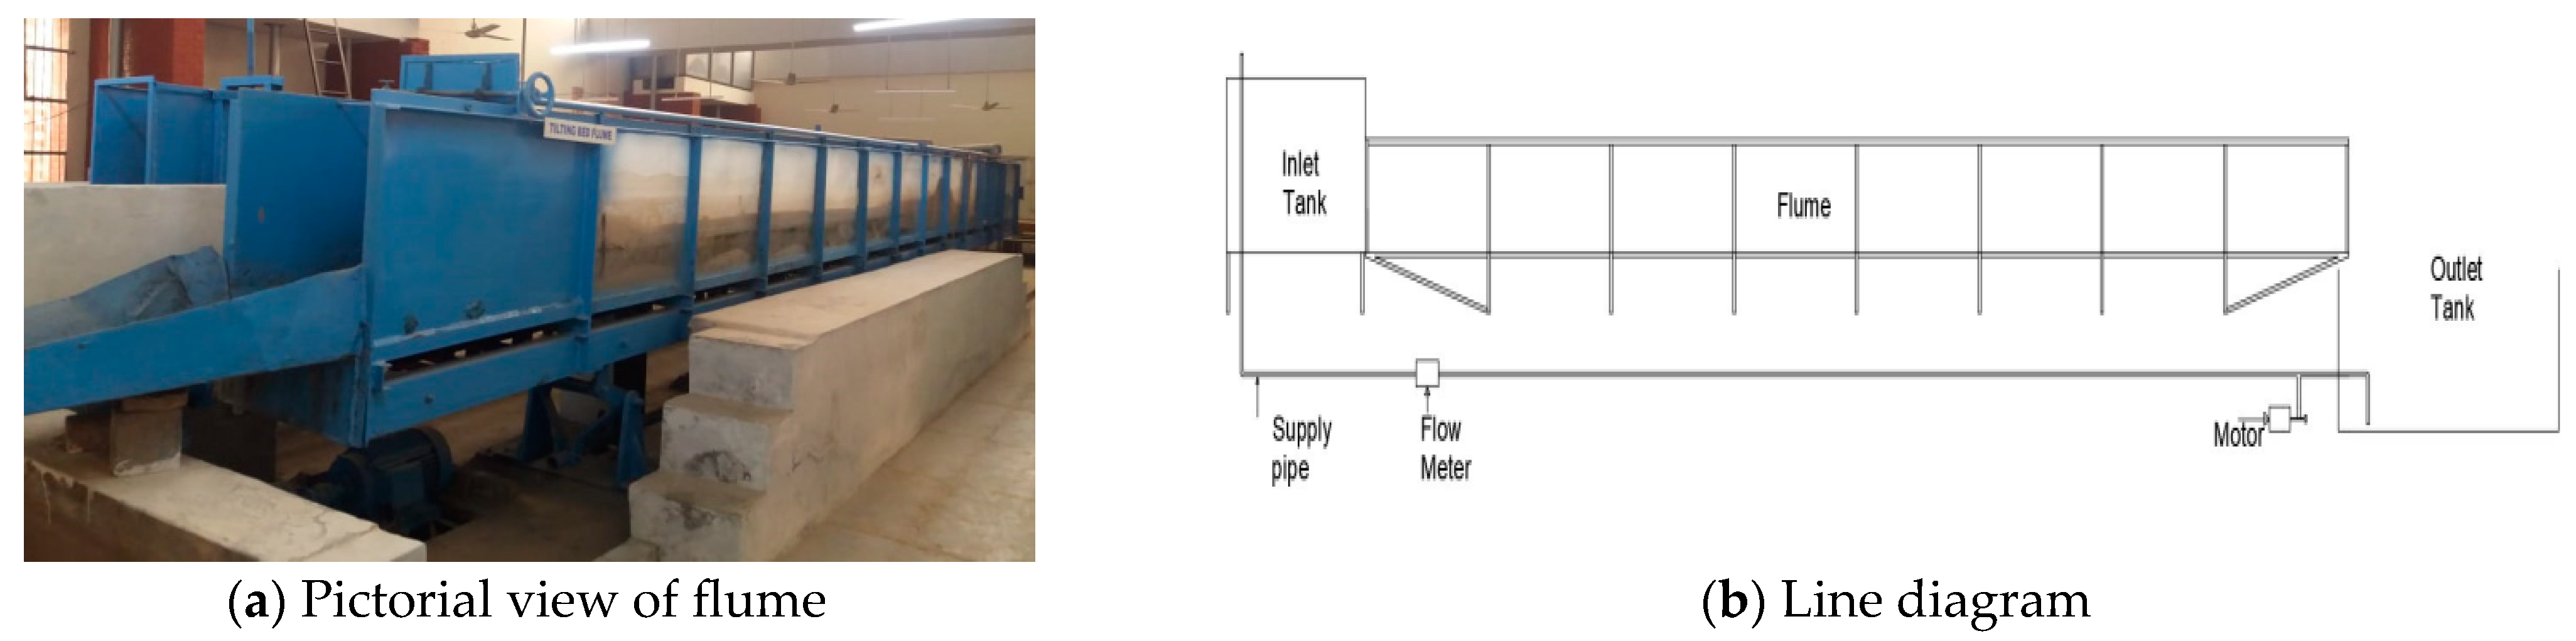
3. Experimental Facility

The experiments were carried out in a recirculating flume (Figure 1a) using different embankment models for studying the breach behavior of embankments during overtopping. All tests were conducted in the Fluid Mechanics lab of the Civil Engineering Department of NIT, Kurukshetra, (India).

3.1. Layout of Hydraulic Channel

According to [31,43], it is essential to conduct experiments with recording and observations of the embankment breaching process and essential equipment like flume, embankment model, and digital camera is required. In the present study, the flume has a large reservoir tank attached to the flume. The flume dimensions were 10 m × 0.60 m × 0.60 m (Figure 1b). Perspex panels were installed at the sides of the flume to make it easier to see breach characteristics during the overtopping of the embankments. The centrifugal pump, which was connected to a 15 hp motor, was used to regulate the flow in the flume.

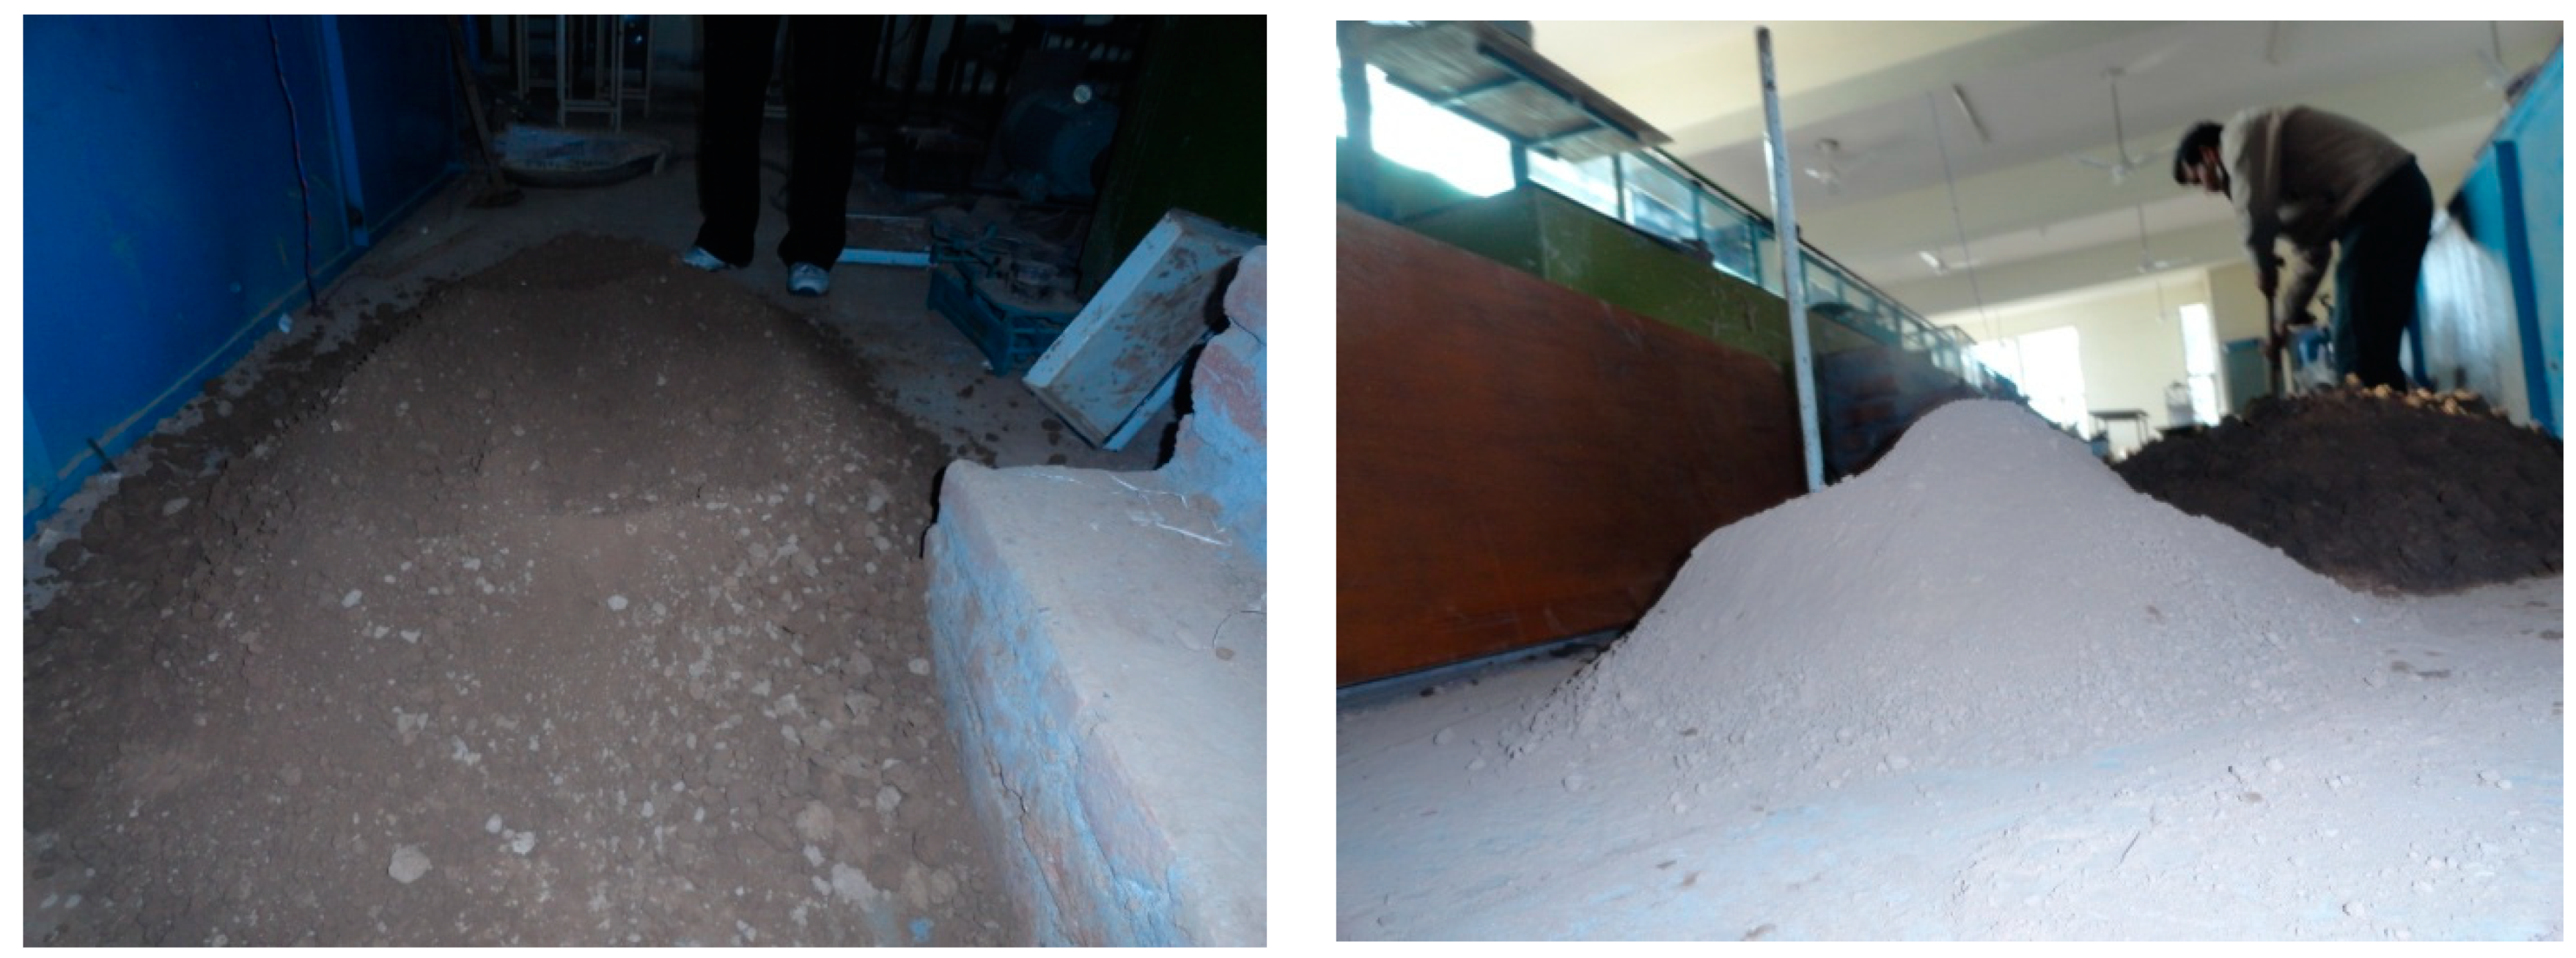
3.2. Material Characteristics

The different soil types used to analyze breach behavior of embankments were procured from River Markanda, (soil A) Kurukshetra, India, along which is coarse-grained soil designated as non-cohesive well-graded sand (SW). Soil B is locally available soil procured from Mullana, Holly, Ambala, India, which is designated as cohesive as it is classified as low-compressibility clays soil (CL). Before building the hydraulic channel embankment models, the locally available materials were obtained and prepared (Figure 2). The material was examined in the Geotechnical Laboratory of the Civil Engineering Department at MMU, Mullana, Ambala, and NIT, Kurukshetra, to ascertain the soil properties, and the results are shown in Table 1.

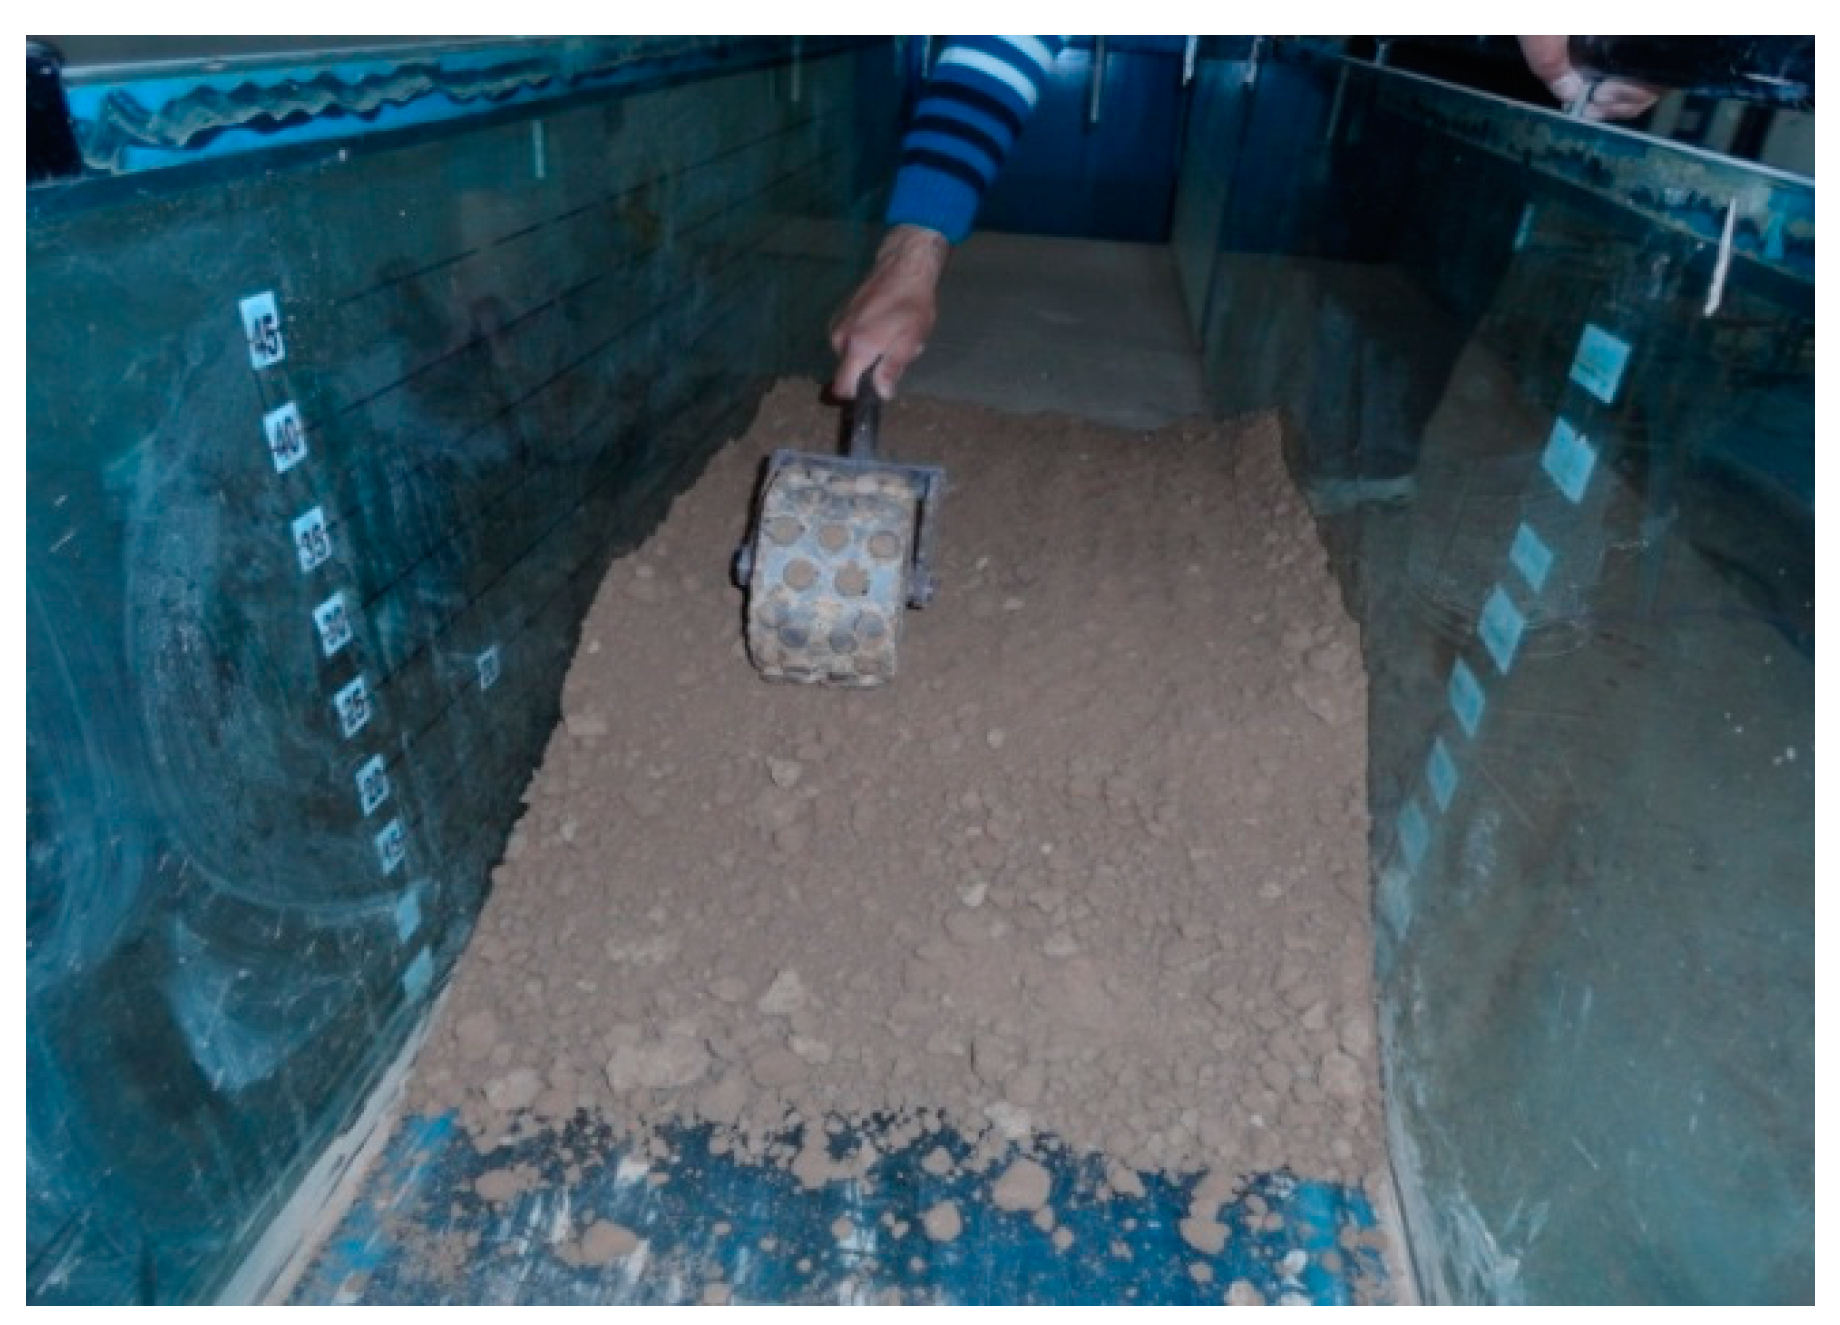
3.3. Experimental Procedure

A total of six distinct embankments were modelled for different dam geometries with two soil types (cohesive and non-cohesive). Two types of soil were taken to make the cohesive and non-cohesive embankment models. For the uniformity of all the tests, the positions of all the models in the flume were identical. Also, only two different downstream slopes and a constant upstream slope were maintained. Table 2 lists the dimensions of all the models.

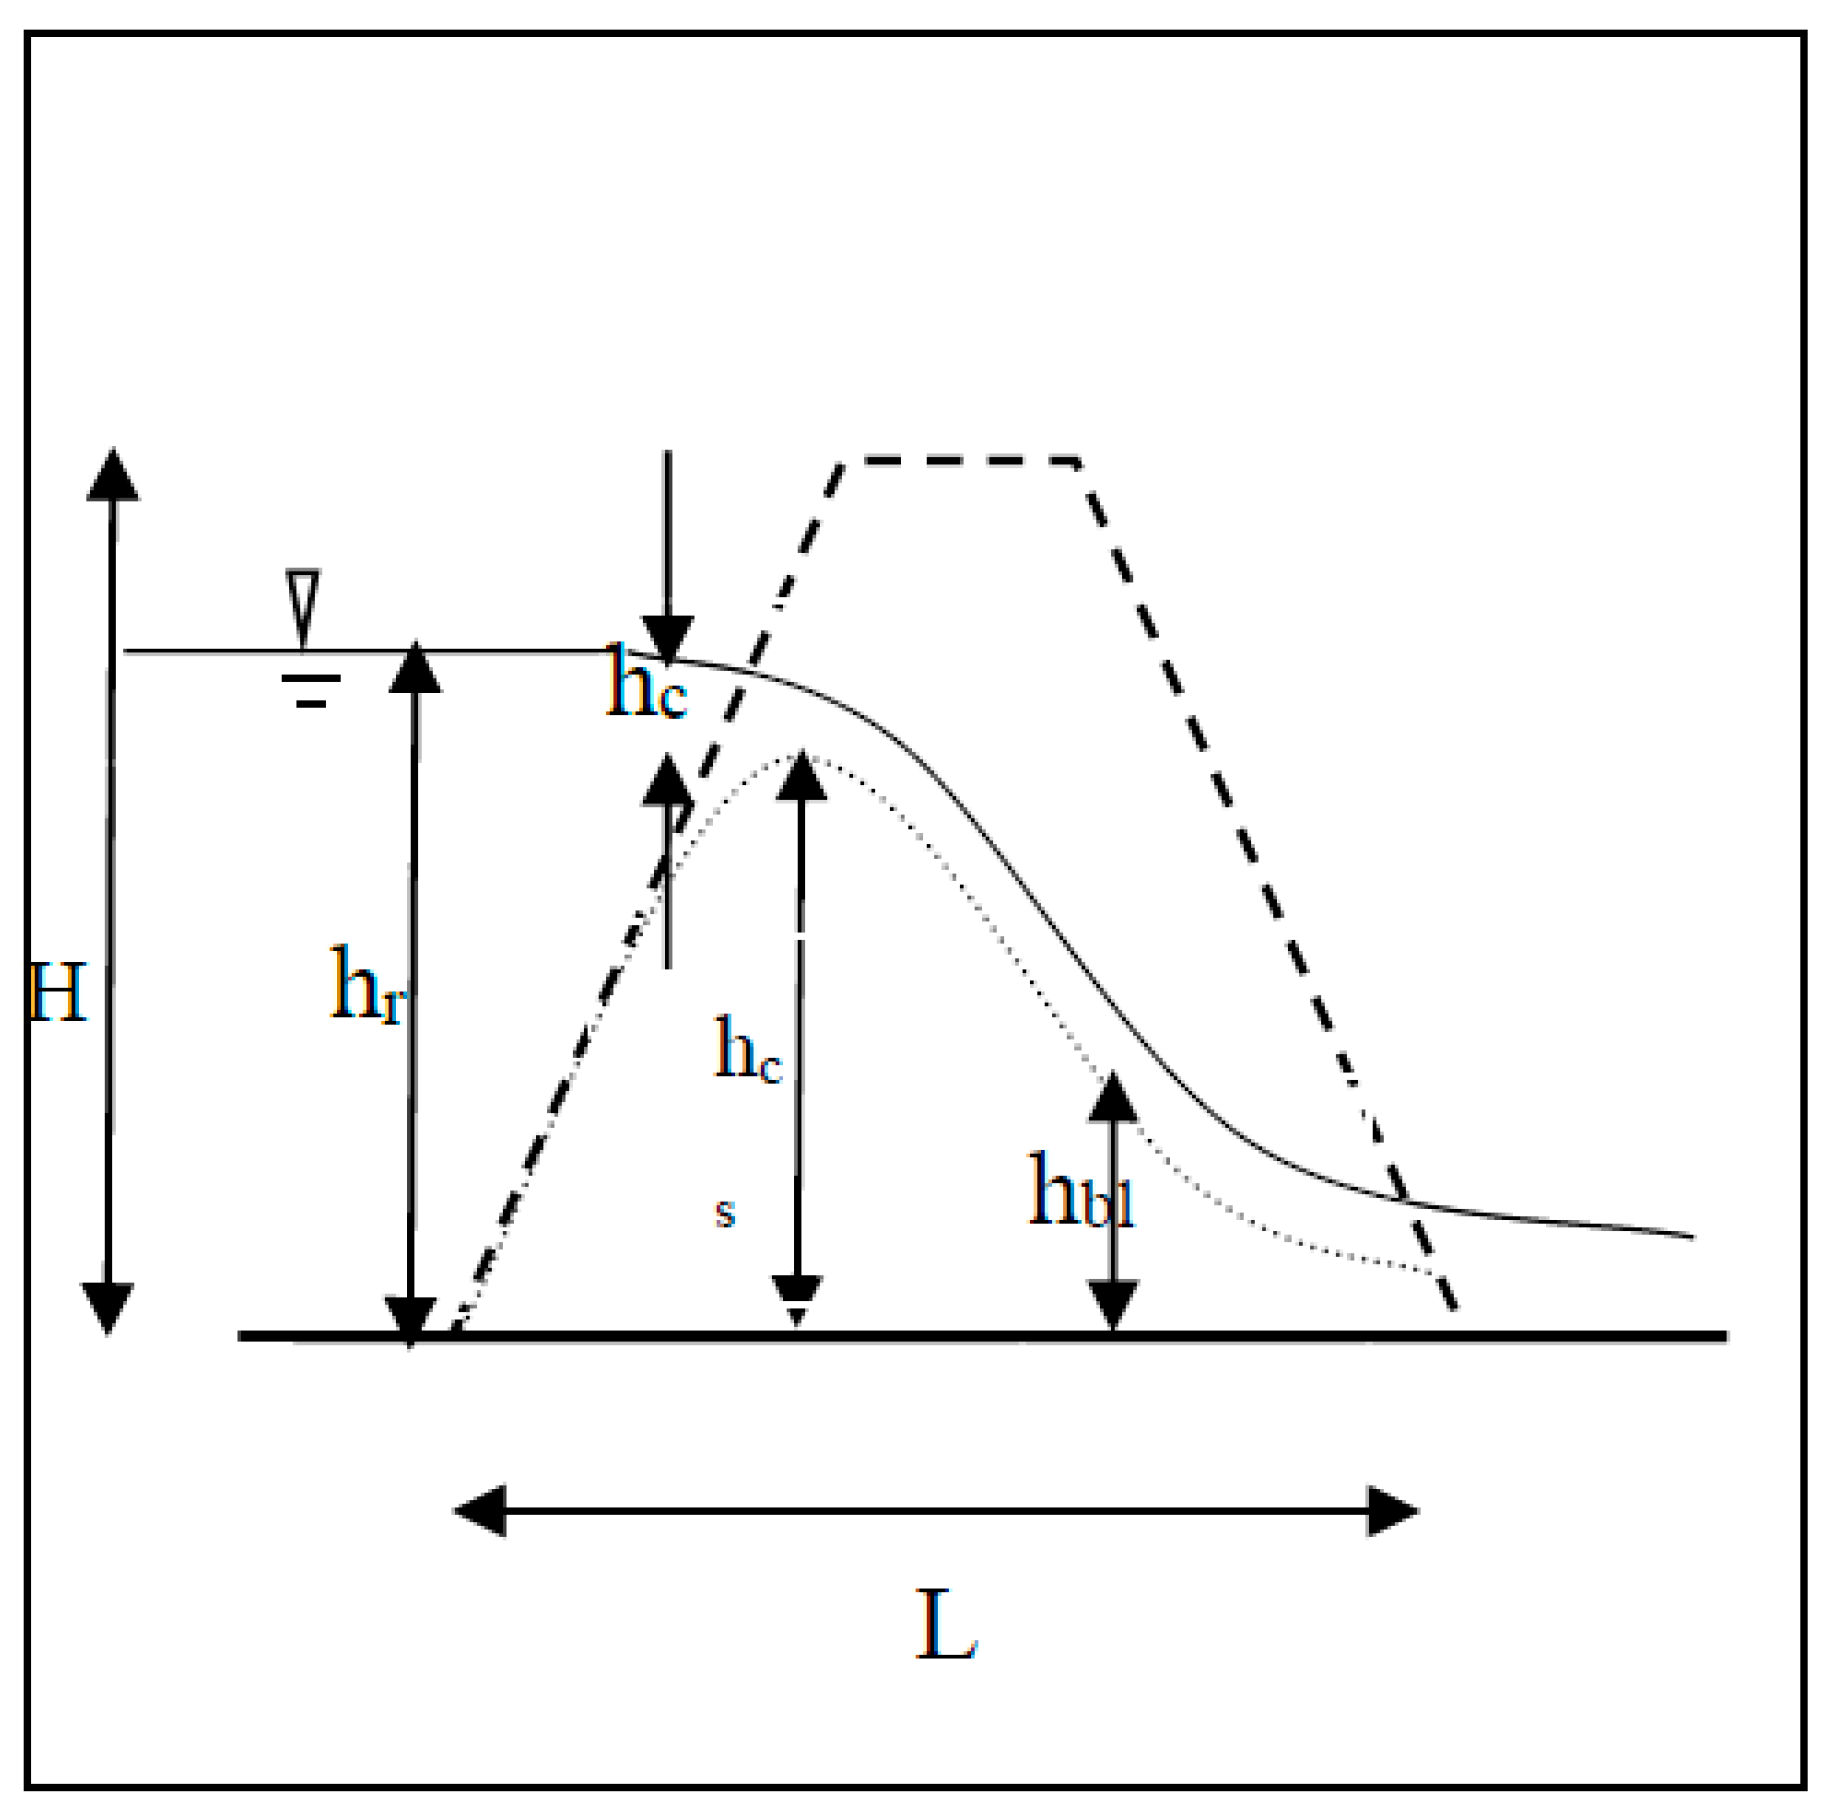
4. Design of Embankment Models

The dimensions of the models created for analysing various breach parameters were constrained by the flume sizes employed in this investigation. The soil material was weighed and mixed at the ideal moisture content before being laid in the glass flume to imitate embankments. The material was stacked in 5 layers of a specific volume to create each model (Figure 3). The weight of material and volume of each layer was used to determine bulk density. With a hand-operated roller, each layer was compressed (Figure 4).
Two types of soil, cohesive and non-cohesive, were used for different models. The upstream side of the models was layered with a protection layer of cohesive material to prevent seepage along the base of the models. All embankments were built on an erodible flume bed with sand-silt mixture thickness of 0.1 m. Out of a total of six models, four embankment models were designed with height 0.3 m and two embankment models were designed with 0.35 m height to study the scale effect. The embankment upstream side slopes were kept the same in all the six models (1:1). Due to the limited dimensions and flow capacity of flume, the downstream side slopes were varied only as 1:1.5, and 1:2 to study the effect of side slope. As the flume had a fixed width of 0.6 m, the dam length of all the models was limited to 0.6 m. The embankment models were built with a constant crest width of 0.2 m. For models no. 5 and 6, a middle trench was fixed at 0.1 m depth with 0.25 m width (Figure 5).

4.1. Hydraulic and Material Homogeneity

According to [31], it is essential to record the gradual breaching process with appropriate arrangements. Hence, lines were drawn with marker on both side walls of the flume in horizontal and vertical directions to facilitate the temporal observations of breaching. To maintain the uniformity of different layers, a sufficient time of 24–36 h was provided before filling the reservoir on the u/s side of the flume. To control the discharge, a head regulator was attached at the inlet pipe and the rate of flow during the breaching process was measured using piezometer. For all experiments, water was poured upstream up to a level that was 5 cm below the model’s crest height. Retention time (about 15–24 h) was provided for consistent infiltration.

4.2. Overtopping and Breaching of Embankment Models

Ref. [37] concluded that erosion at the toe of the downstream side of embankments played an important role in the process of breach growth and increase in cohesive material in the sand-silt-clay mixture slowed down the erosion process. Similar observations were made by Ashraf et al. [19], who found that that embankment dimensions and soil properties are equally essential parameters for studying and analyzing breach parameters in cohesive soil embankments. Considering these studies, to obtain these essential observations during embankment breaching, the complete set up was prepared. The flow rate for all the experiments was constant (4.7 L/s). To measure the depth of water on u/s side at regular intervals, a pointer gauge was used. During the breach formation of different models, the magnitude of soil erosion was observed during the tests. For the purpose of analysing the breach behavior during overtopping, the temporal fluctuations in breach breadth and breach depth were also noted. The instant photographs of breach process were taken with digital cameras and the whole process of breach growth was recorded.

4.3. Flow Parameters

It is essential to observe the flow parameters, like height of water on the upstream side during the embankment breaching, for analyzing the breach mechanism, as described by [16]. Also, almost the same observations were made by [17]: that it is essential to obtain flow parameters for analyzing the erosion process of embankment breaching. As described in [43], the different flow parameters essential to describing the washout process are shown in Figure 6. During the overtopping process, these flow parameters were observed with the passage of time for all tests to estimate different breach parameters. Here, hr = water level in reservoir; hc = water level above crest; hcs = height of crest sediment;
hc = hr − hcs

4.4. Experimental Observations

It was observed that there are different functional parameters, i.e., breach parameters as well as geotechnical factors involved in the breaching of different embankment models [17,22,31]. These factors make the breaching process complicated. In the present study, these parameters were obtained by conducting different tests to understand the behavior of the breaching process during the overtopping of an embankment. The different breach characteristics for different tests were observed and tabulated in Table 3.

5. Results and Discussion

In the present study, the breach growth was observed and analyzed for two different types of soils by conducting an experimental study in a flume.

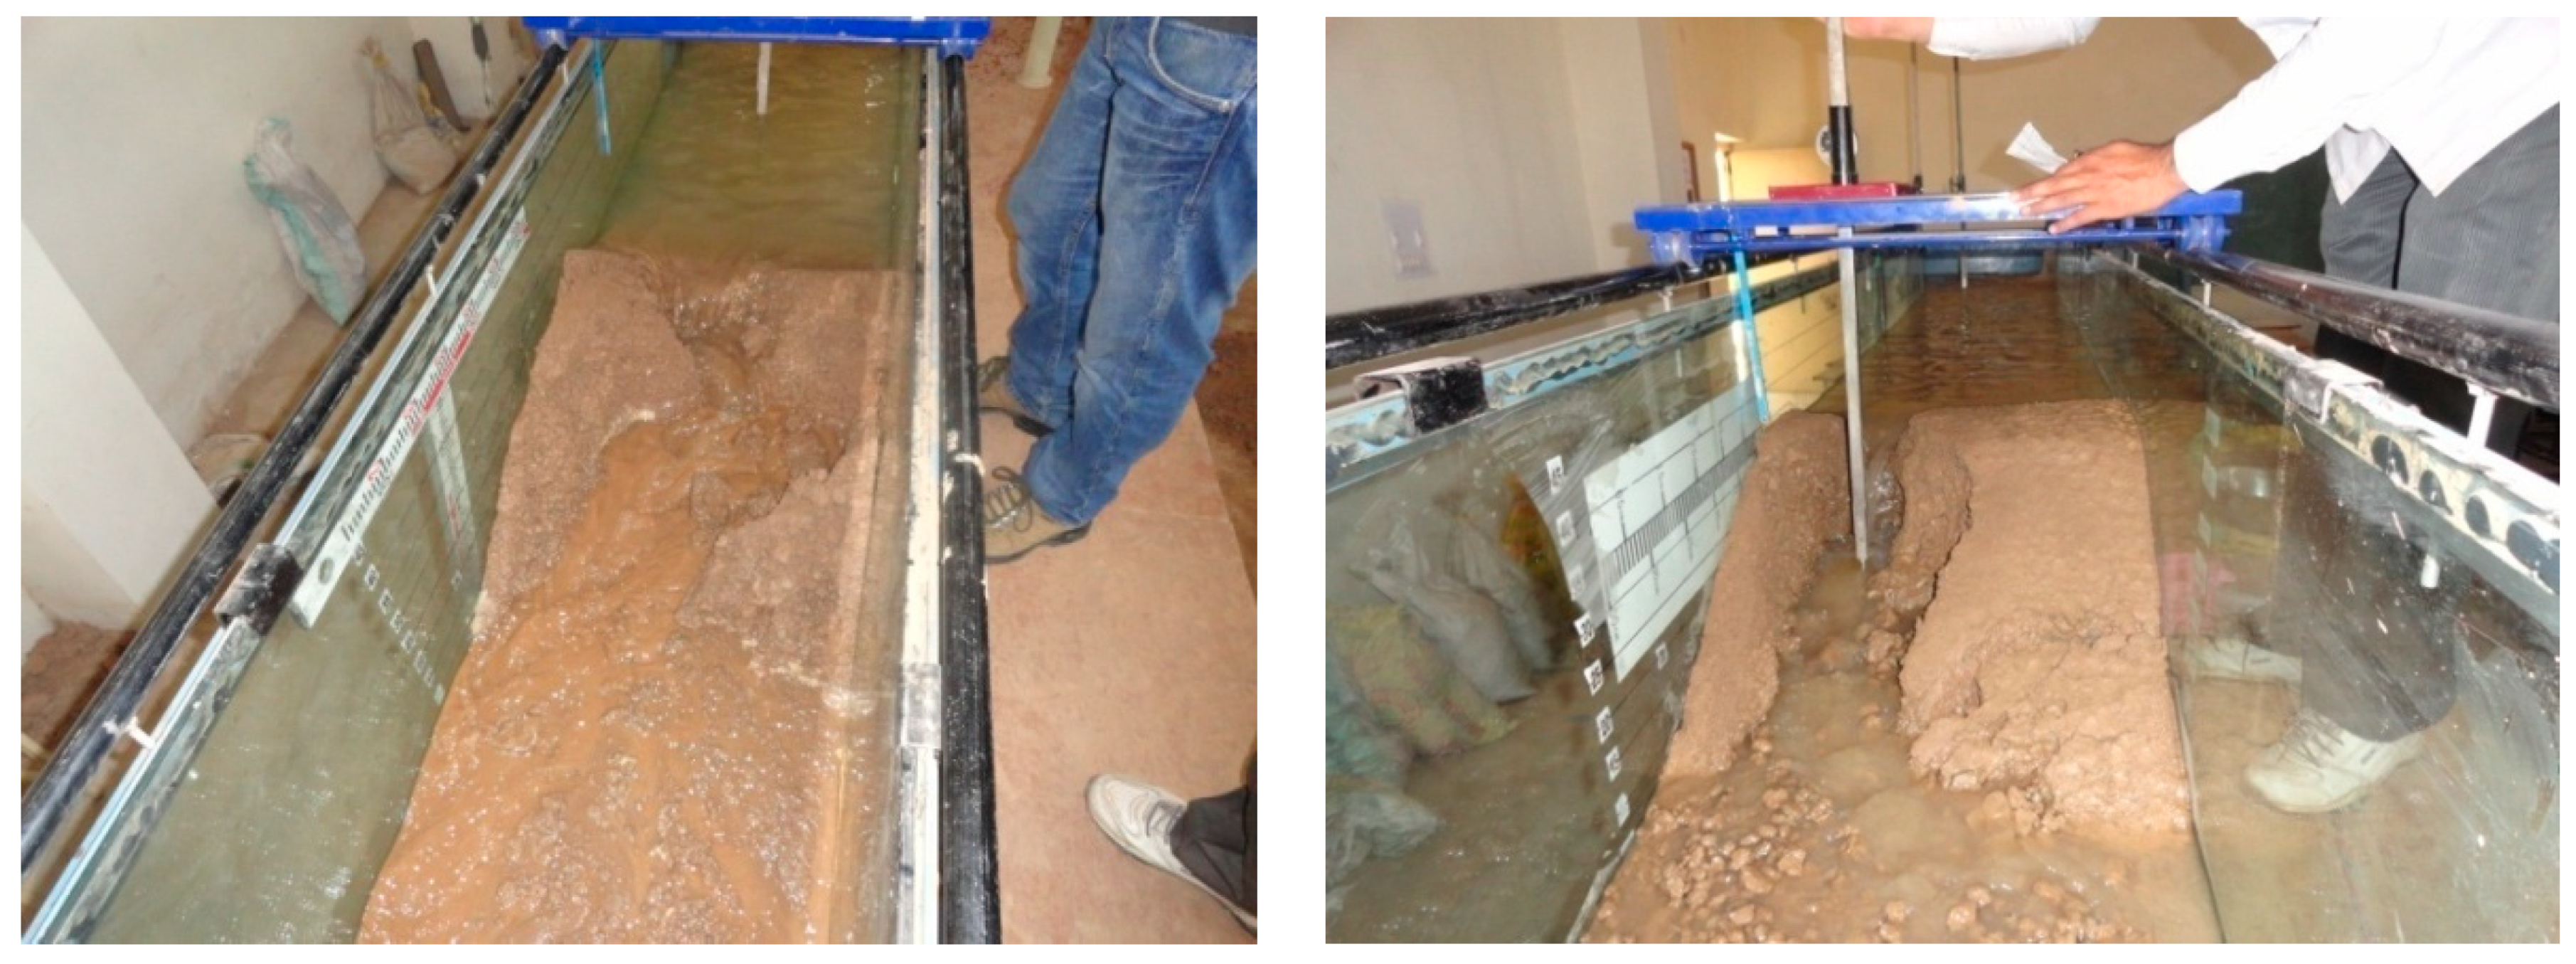
5.1. Breach Evolution

The breach development was described in terms of three stages on the basis of temporal variation in breach growth. Surface erosion normally starts either on the downstream face or at the toe.

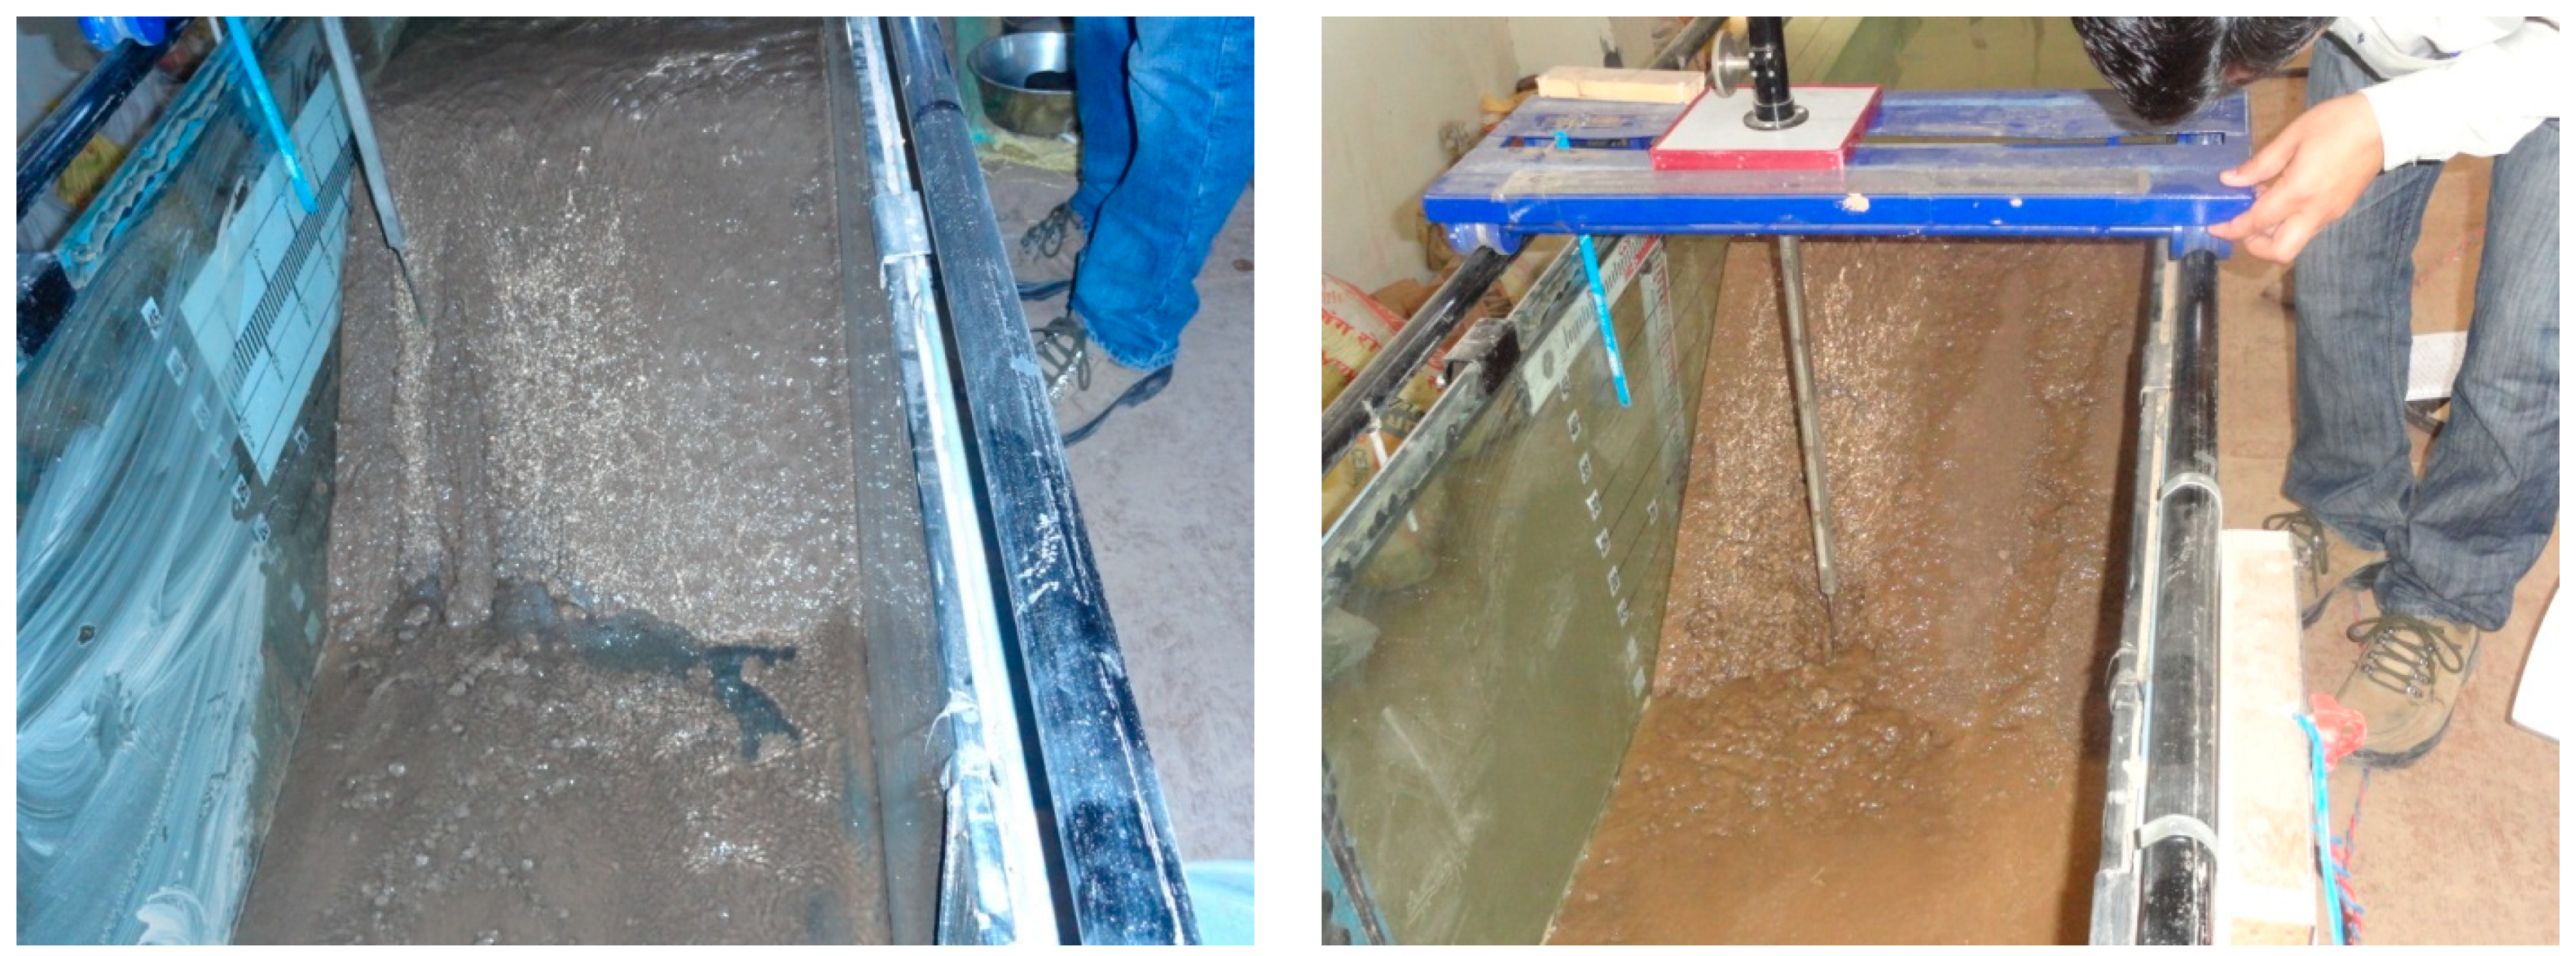
5.1.1. Stage I: Initial Erosion

Initially, a small notch across the crest of embankment was slowly cut. As the water began to move away from the upstream side of the model, there was some loss of water due to infiltration. Thus, the sediments were deposited on the downstream face. The sediment deposition occurred as the embankment was partially saturated. It occurred for a few seconds, until the toe was eroded (Figure 7). When water starts to erode material through the embankment body or from the surface, then it is called breach initiation. In this phase, there is slight outflow of water, but the embankment has not yet failed, and during this the embankment may survive if some preventive measures are taken to stop the overtopping.

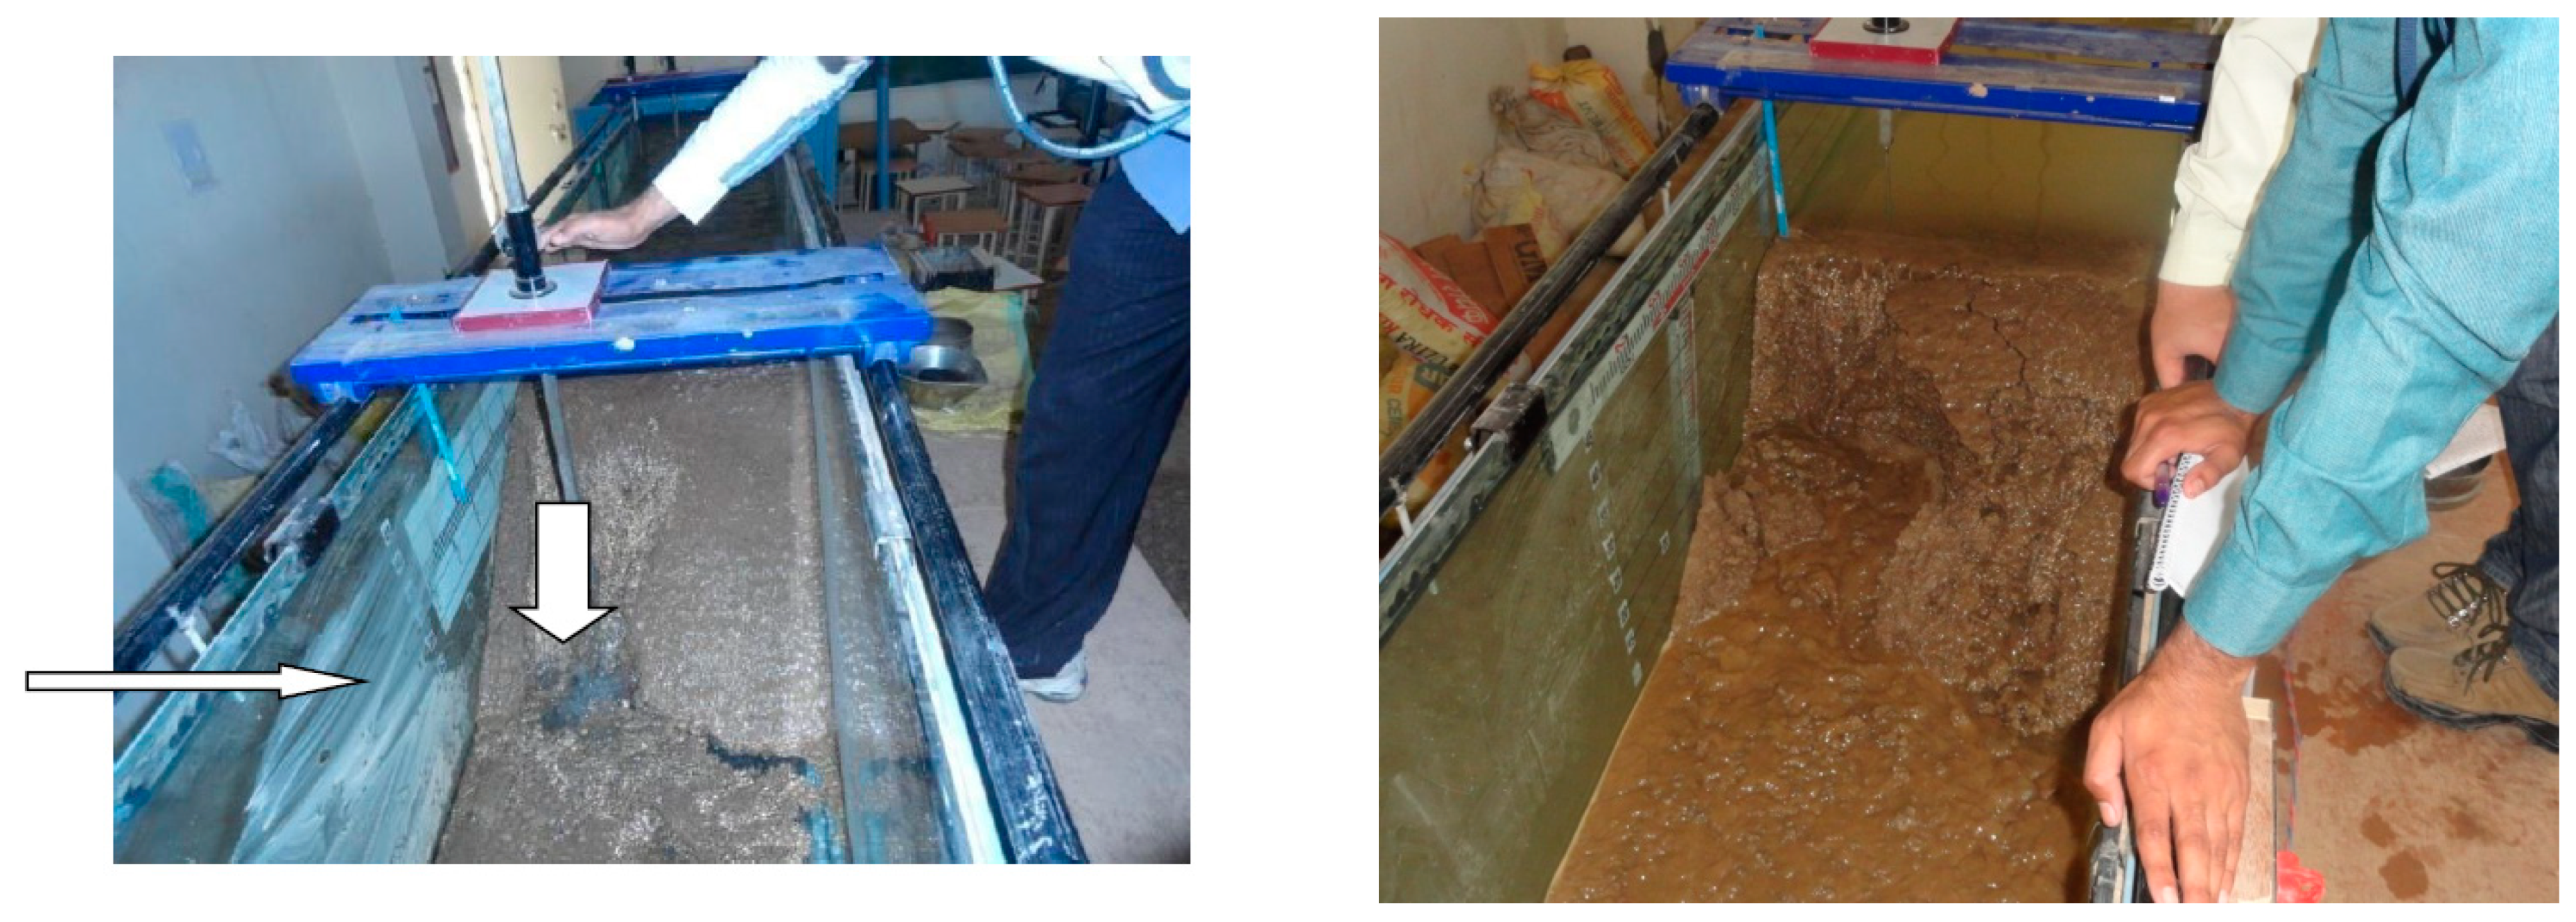
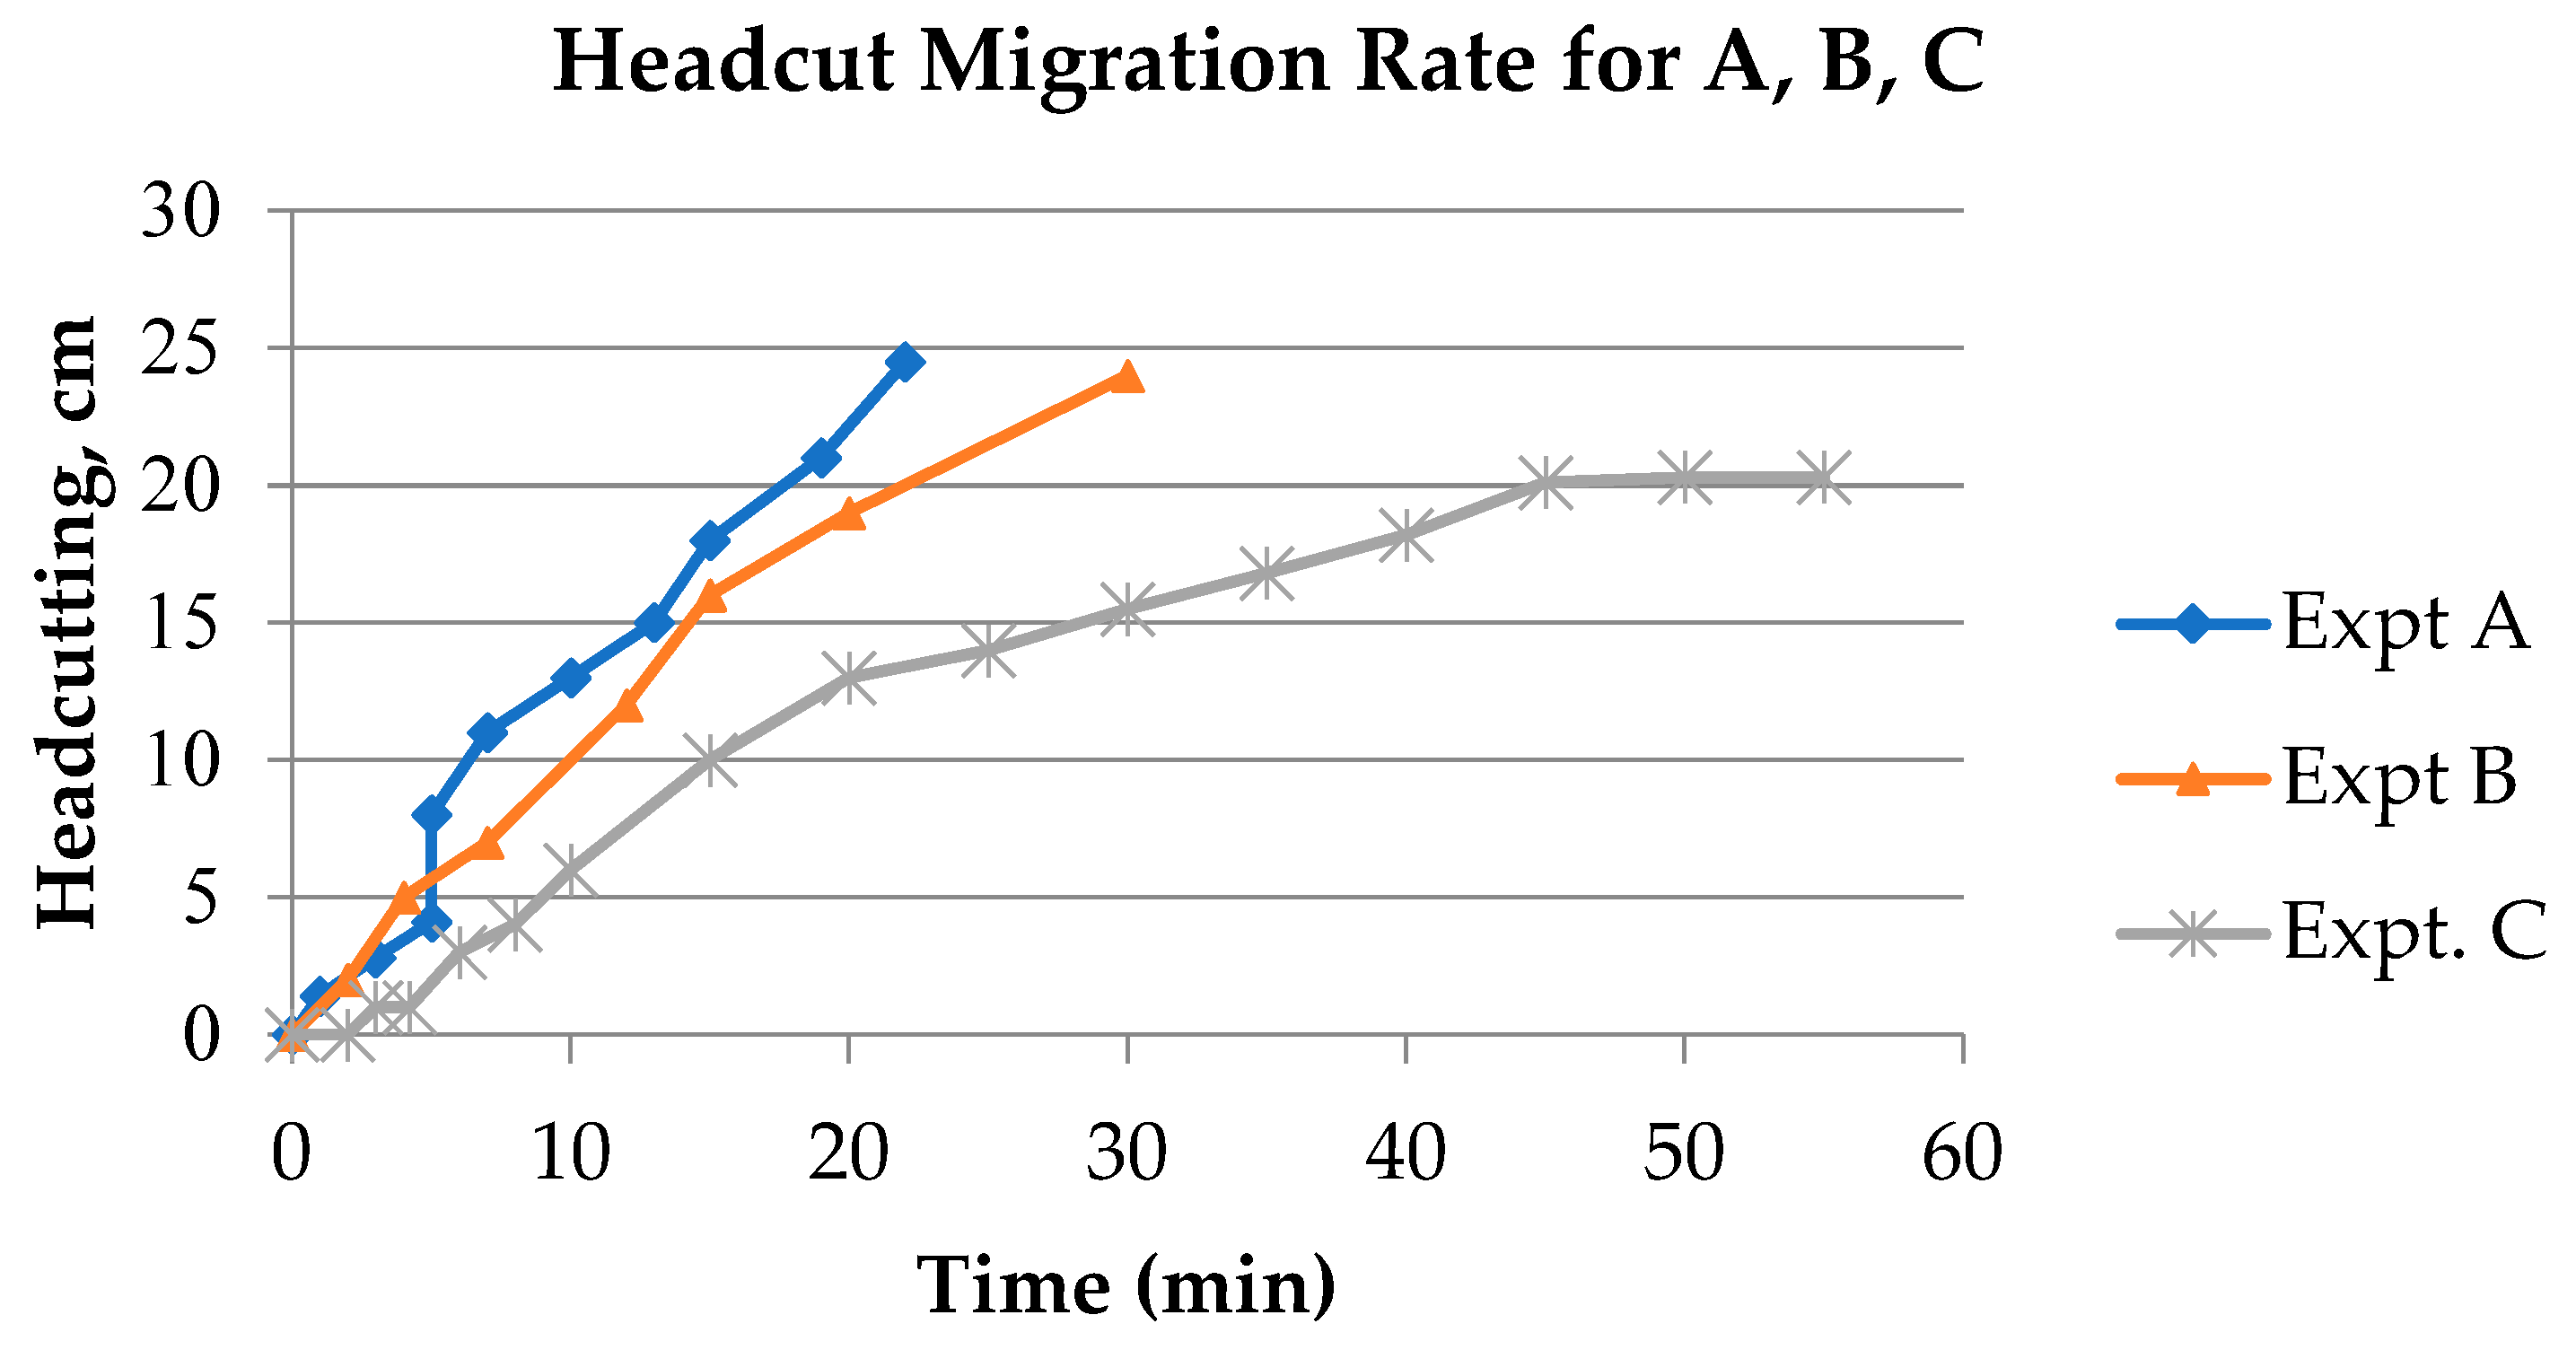
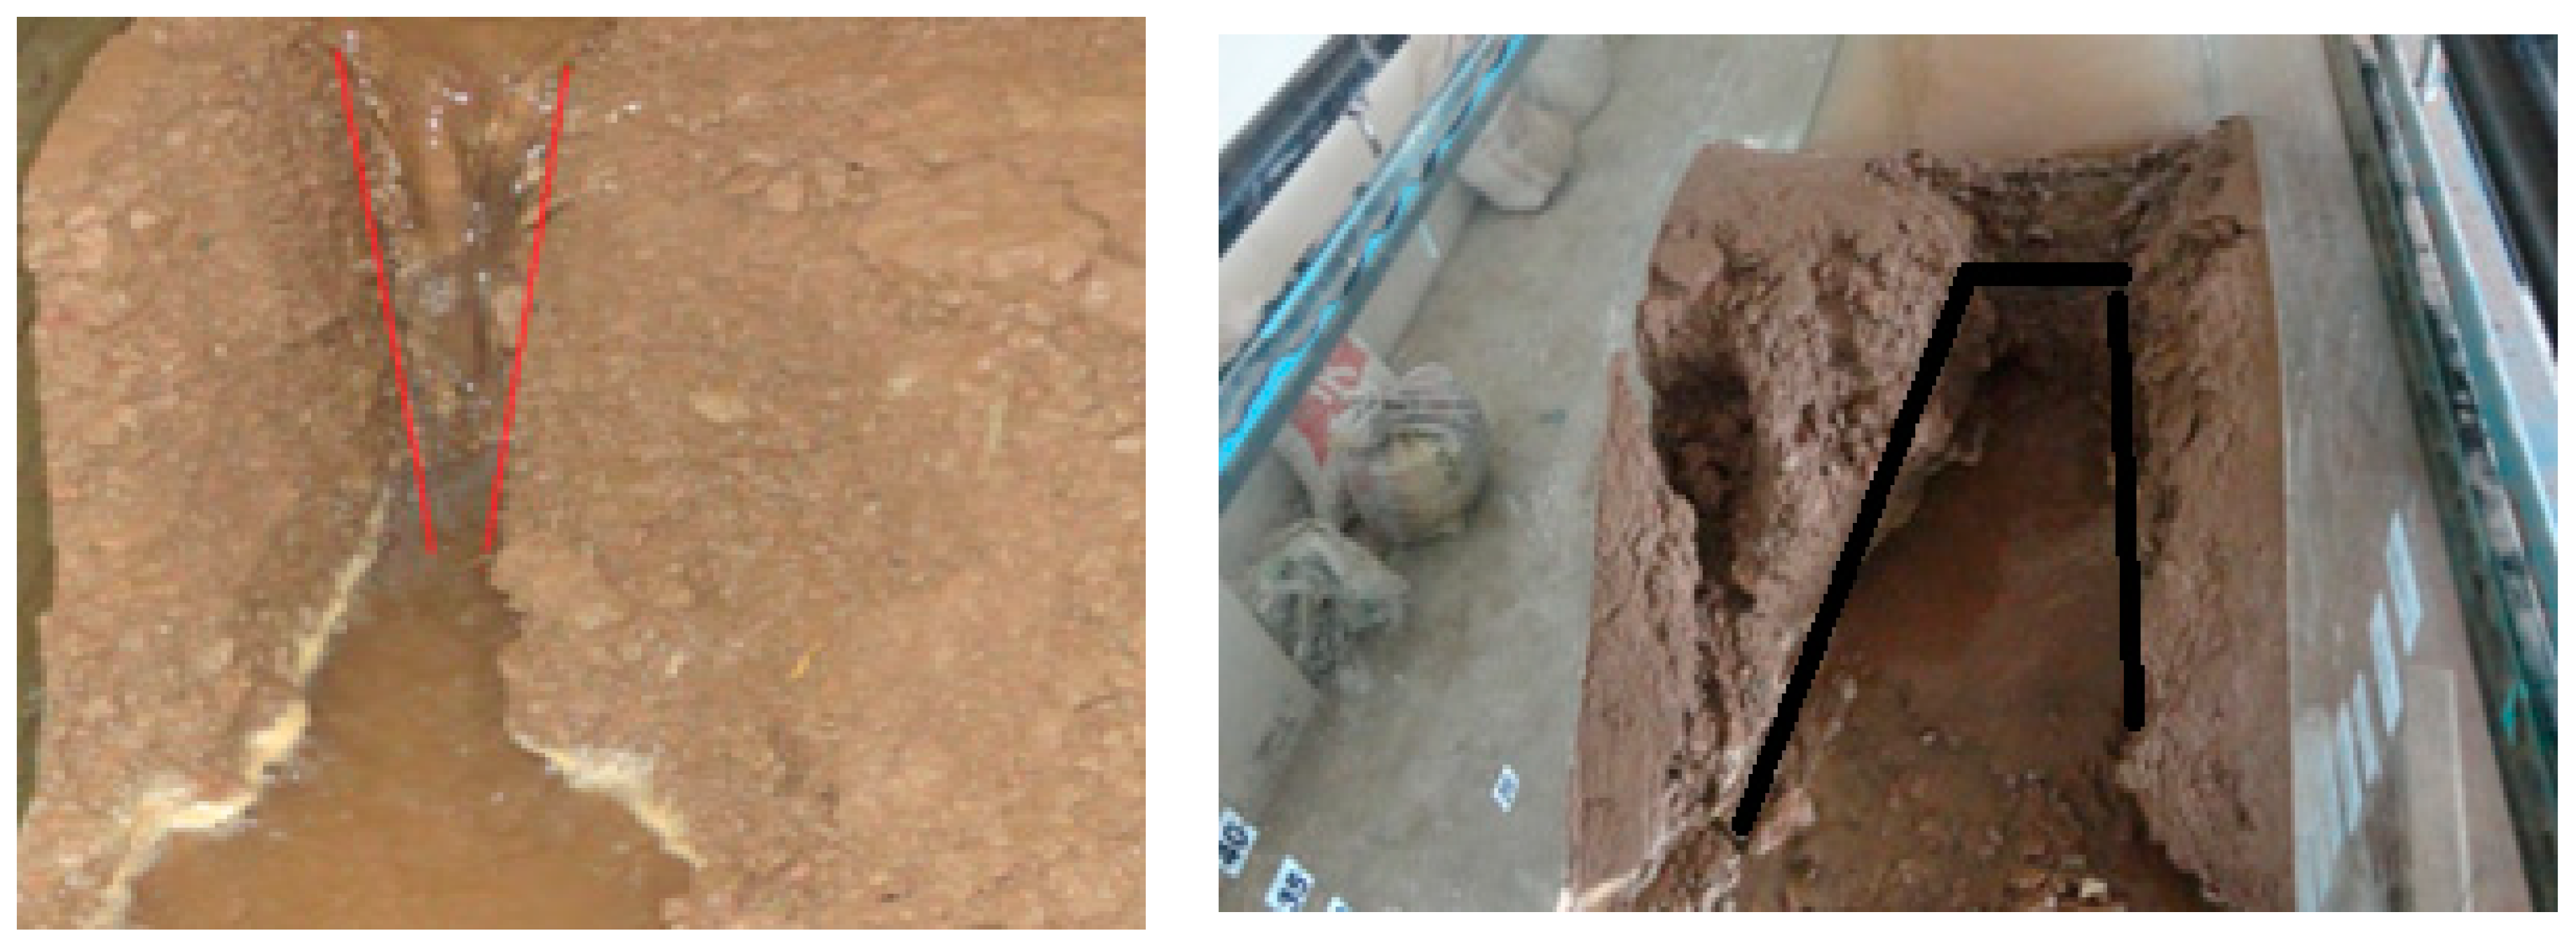
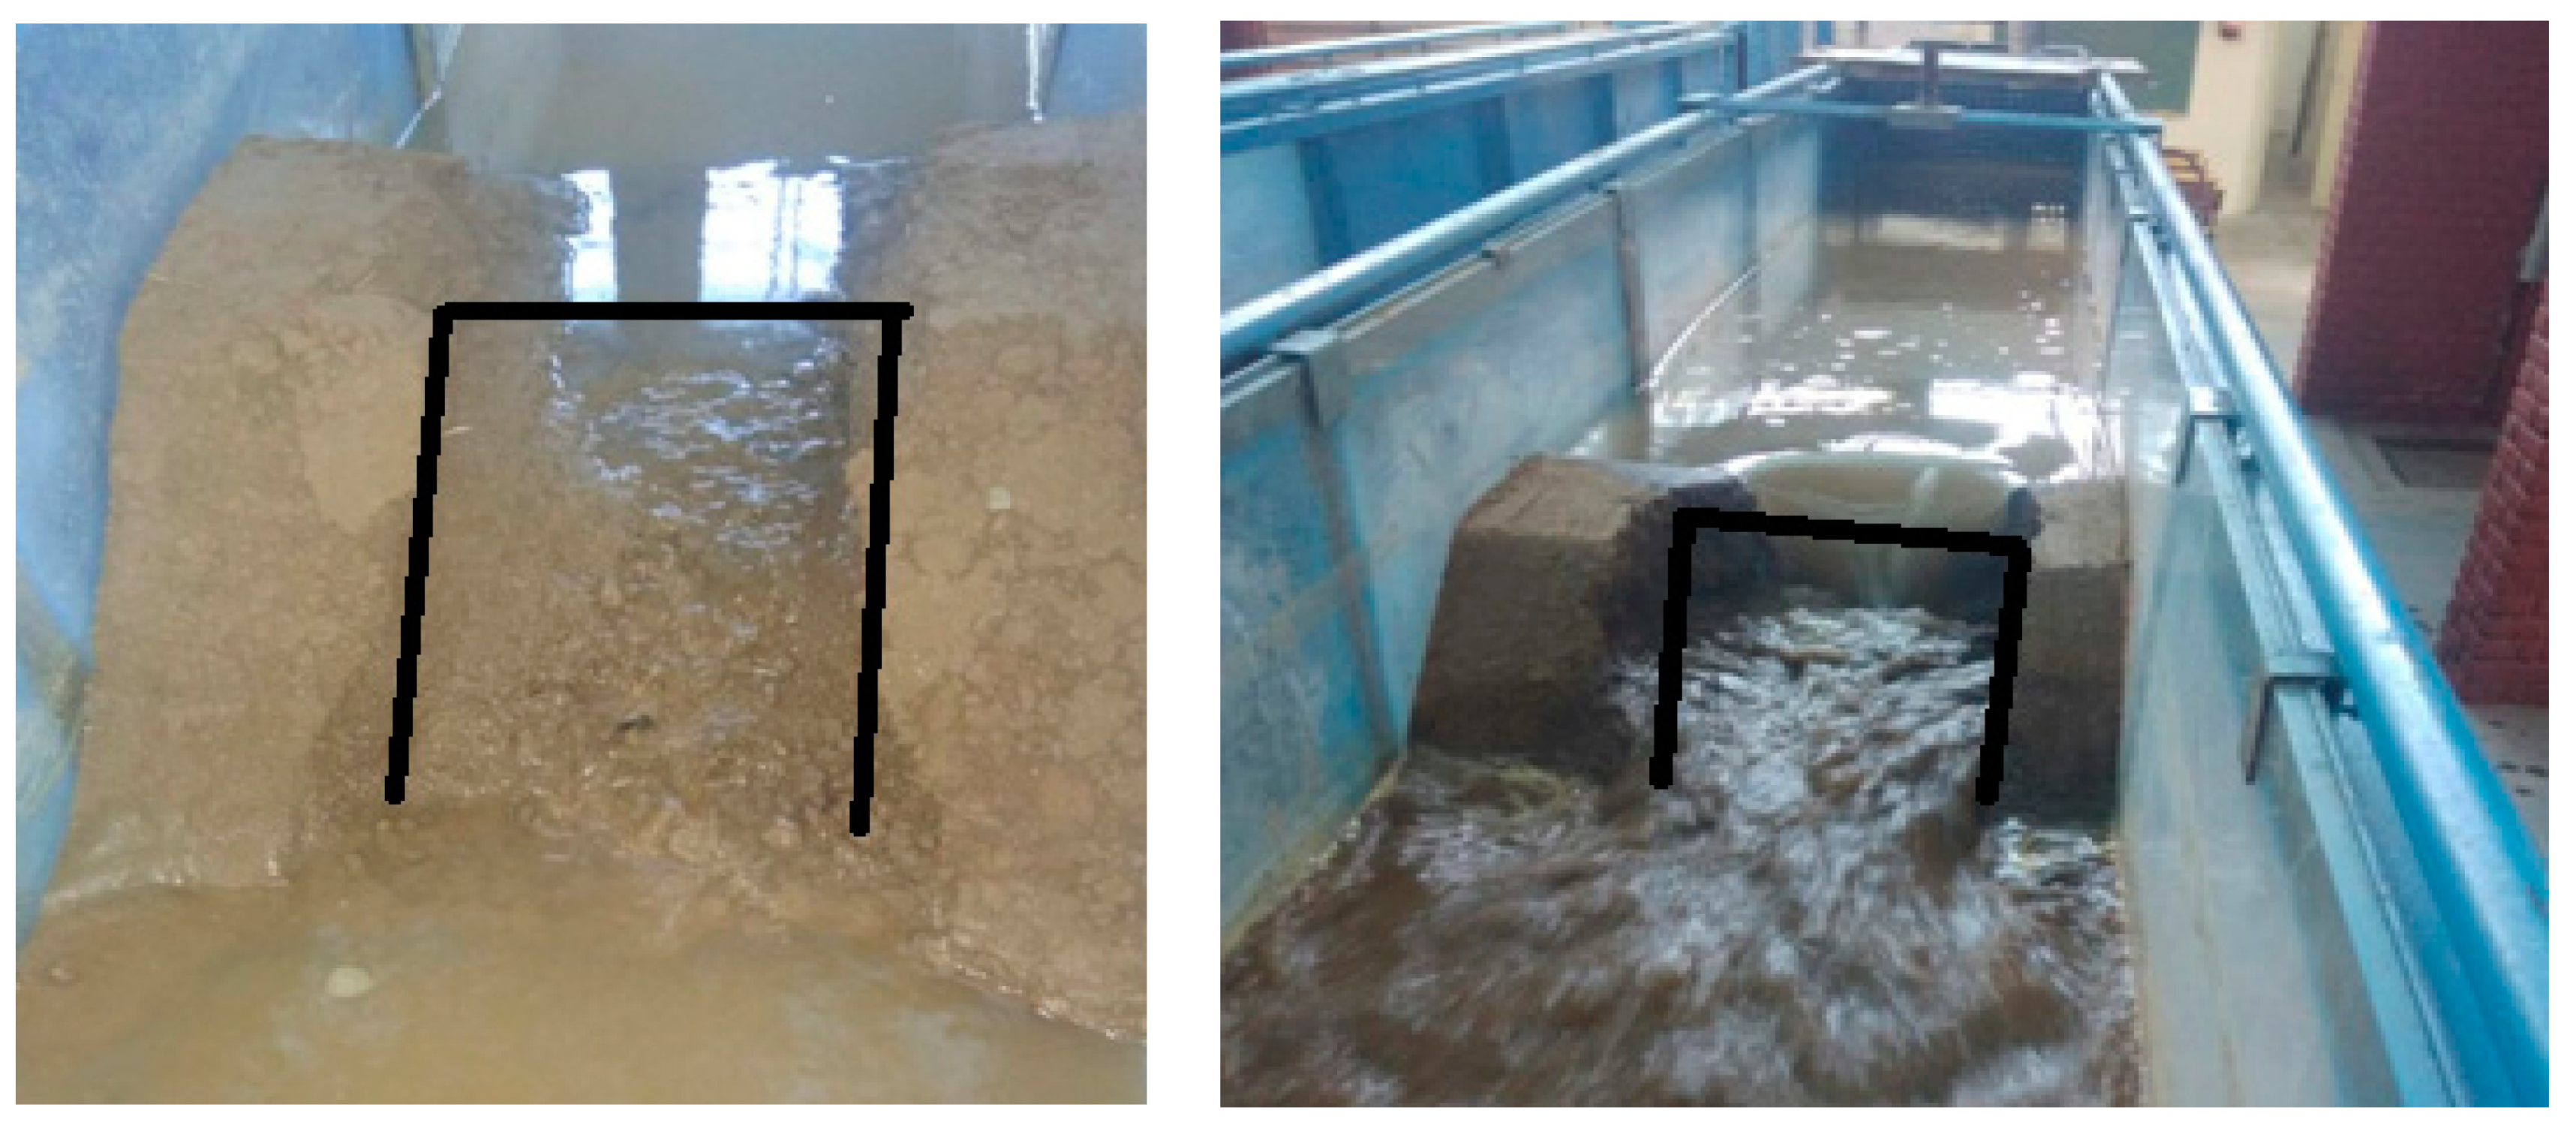
5.1.2. Stage II: Head Cut Erosion

After stage I, the breaching of embankment models was determined by bulk and high-rated erosion. Due to the elevated velocity of the stream, scouring occurred and an opening was observed in the breach of embankment (Figure 8). The embankment scour hole at the toe started in stage I of the breaching process, but the high rate of erosion occurred on the downstream face in the form of either gradual (or erosion of surface particles) surface erosion or cutting off blocks in the form of lumps (heat cutting). The surface erosion occurred due to the flow generated by high water pressure in the reservoir. Initially, it destroyed the embankment surface and the material was eroded to the downstream side of the embankment (Figure 8). The time between the erosion of the toe to the erosion of crest is termed the formation time. The headcutting initiation and rate of breach widening depends upon the slope of the embankment and hence the time to failure varies as described earlier. The time to failure increases with the increase of downstream slope from 1:1.5 to 1:2. In the study, it was observed that the time to failure varied from 99 s to 120 s for Soil A and 132 s to 181 s for Soil B by increasing the slope from 1:1.5 to 1:2. Thus, time to failure increases 10–30% for different embankment fill materials.

5.1.3. Stage III: Lateral Erosion

The lateral erosion started after the development of headcut erosion and the erosion of the upstream crest. As the scouring occurred in both vertical and lateral directions, the undercutting process started at the bottom side of the breach channel due to the helicoidal flow, as shown in Figure 9a. Before the collapsing of the embankment, the surface material was firm in spite of the bottom material having been eroded completely due to the high velocity of the stream. Also, the erosion occurred at the side toe of the breach channel, which broke the embankment balance. As a result, the material, in the form of lumps, collapsed. Arrow in Figure 9a show the collapsing of embankment due to the imbalance (Figure 9a). Further helicoidal erosion excited the enlargement of the breach channel in a lateral direction, which resulted in enormous widening of the channel (Figure 9b). The rate of lateral erosion depends on the reservoir dimensions and volume of stored water. The cohesion properties of fill material affects the lateral breach slope.
The processing continues until there is a sufficient supply of flood water or the breach channel is completely formed. In the literature, the breaching process was described in different terms. Ref. [44] recommended a five-stage breach erosion process for no cohesive embankments. Similarly, for cohesive embankments [45] described five phases of dam breach erosion.

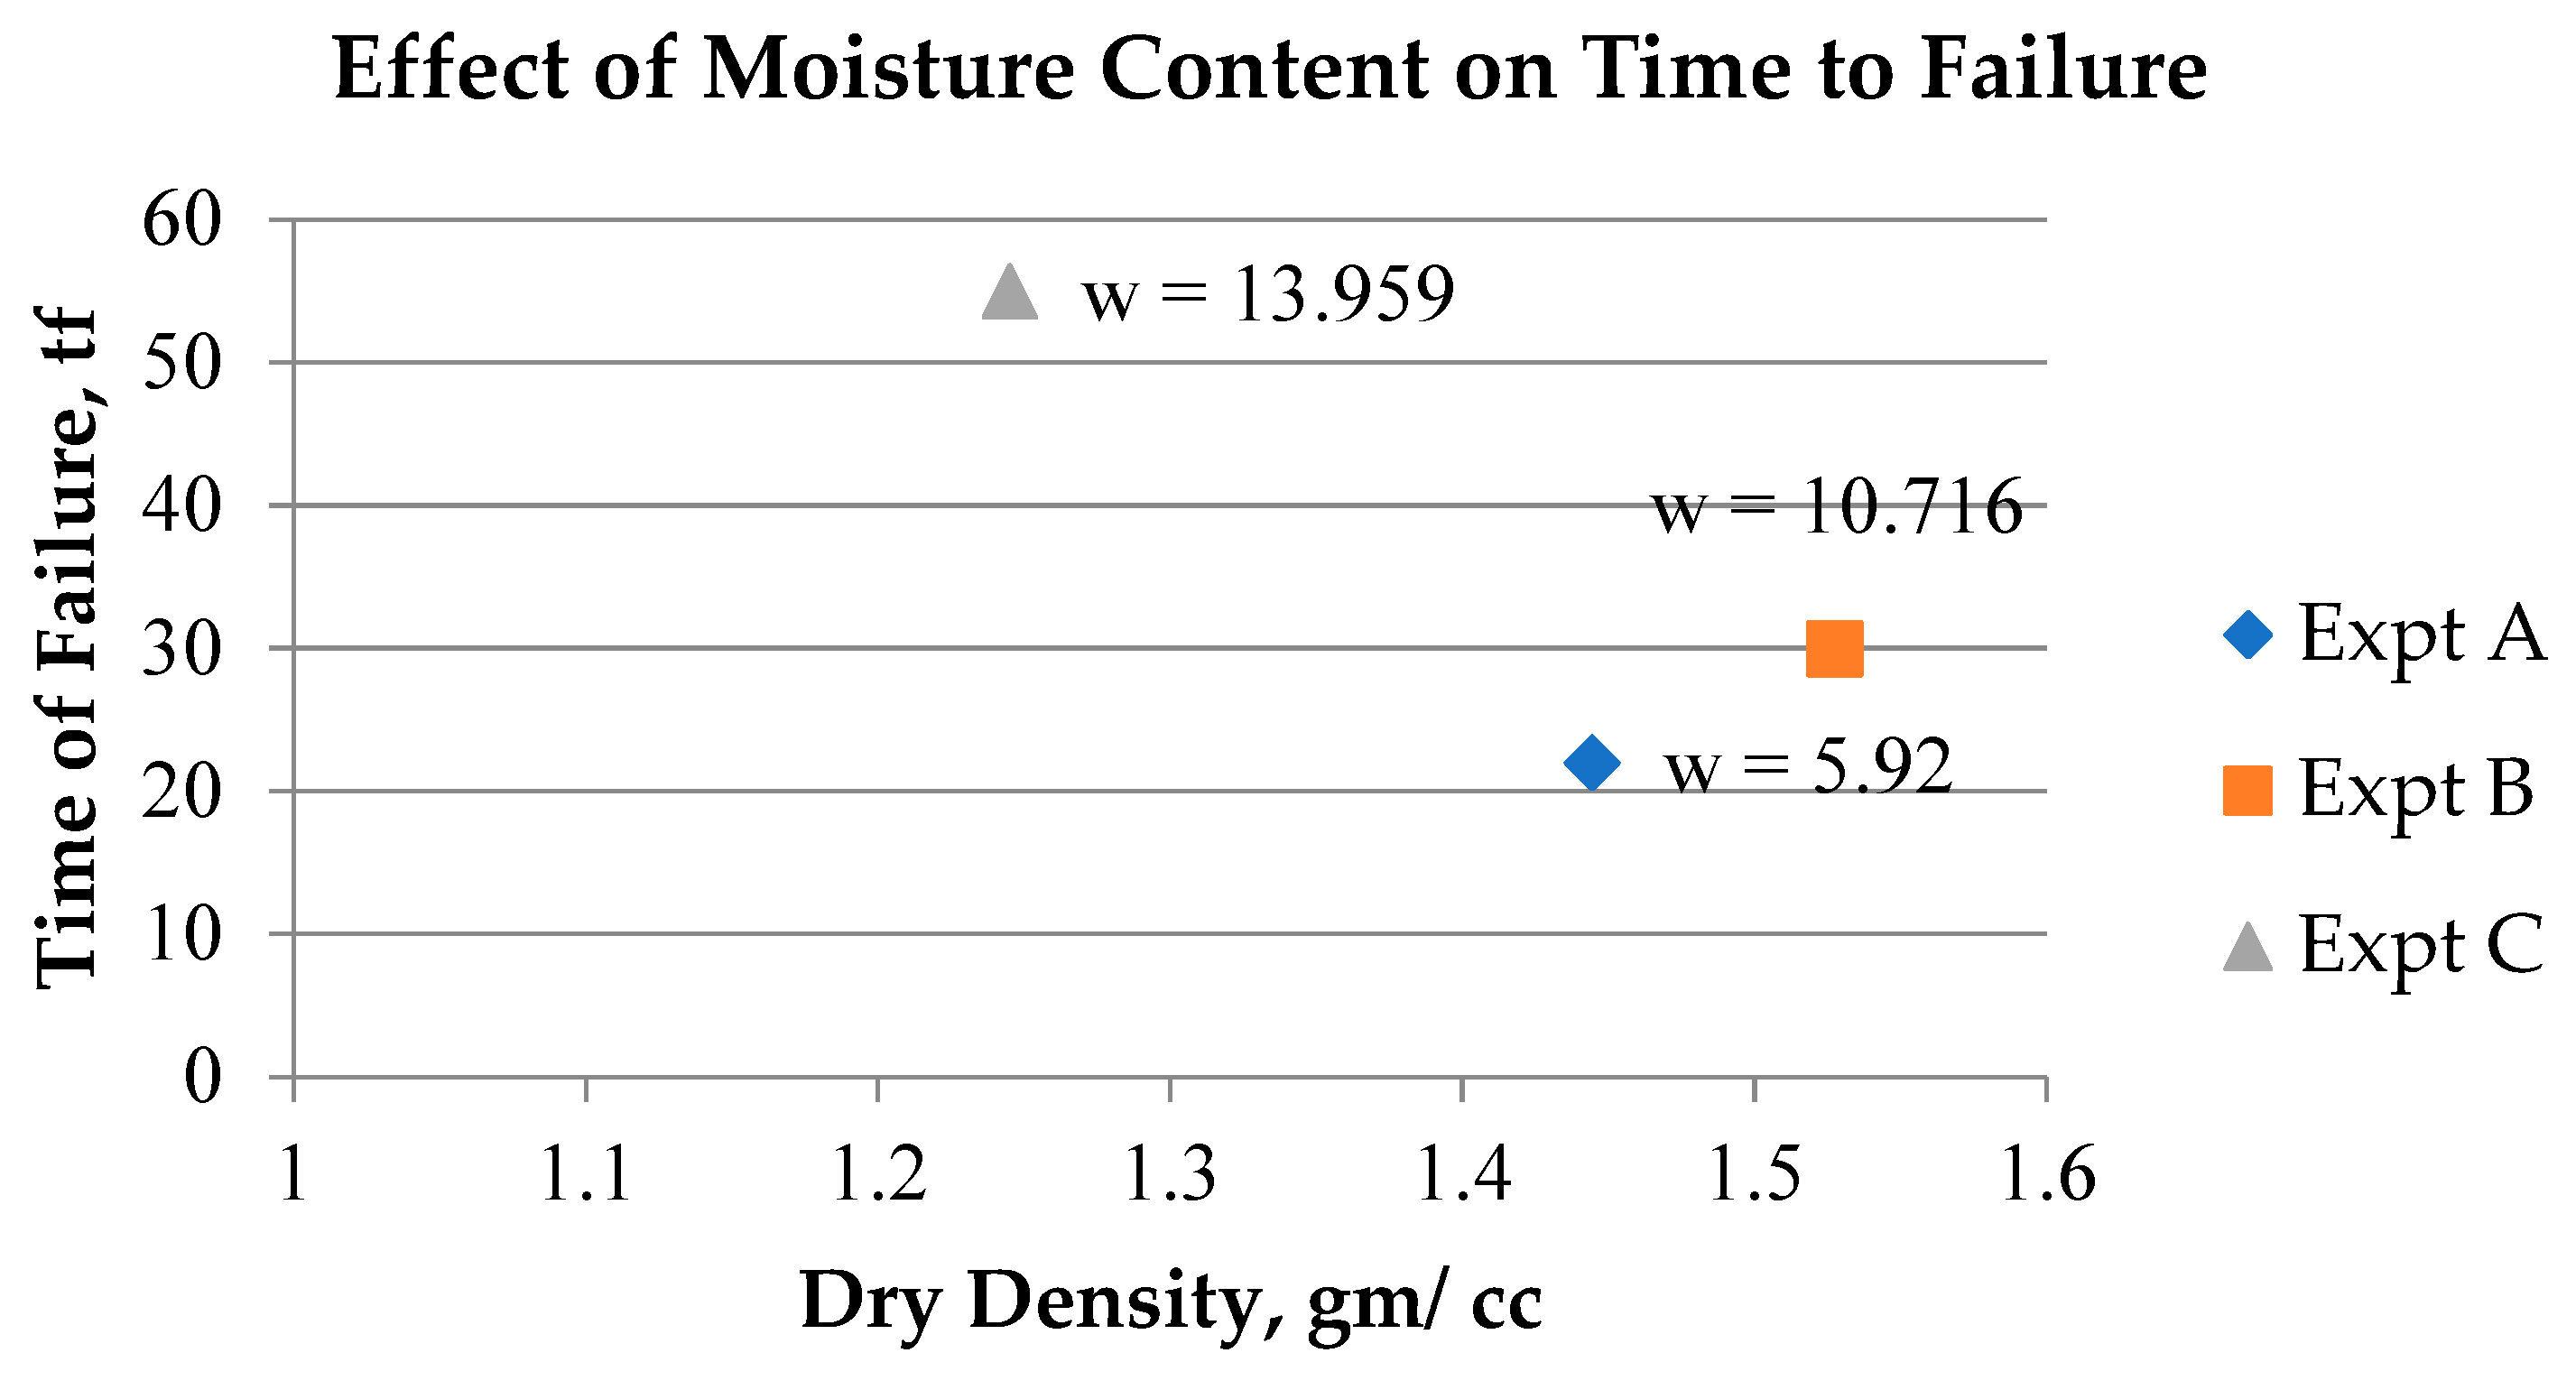
5.1.4. Effect of Water Content

For studying the effect of moisture content on erosion (as discussed in the previous section) of embankments, a further set of three experiments A, B and C were conducted by varying the compaction moisture content and dry density, as described in Table 4.
The headcut migration rates for all the experiments were obtained using a camera and analysed. It was observed that for a decrease of 24% in the compaction moisture content (Expt. C to Expt. B), there is an increase in the average headcut migration rate but a further reduction in moisture content to 50% (Expt. B to Expt. A) shows little change in headcut migration rate, as shown in Figure 10.
From Figure 10, it can be observed that the headcut migration rate was small for Experiment C (w = 13.959%) and the time to failure was 55 min. Furthermore, by decreasing the moisture content in Experiment B (w = 10.716%), the time to failure decreases, as shown in Table 4. With a further reduction in water content from 10.716% to 5.922% (Expt. B to A), it was observed that initially the headcut migration rate for experiment A was slow compared to the headcut migration rate in experiment B, but after a short duration of time, there was an increase in headcut migration rate. The time to failure decreased slightly. It was noticed that there occurred a quick failure of the embankment for experiment A (tf = 22 min) compared to experiment B A (tf = 30 min). By comparing the time to failure, it was observed that a 24% drop in moisture content resulted in a decrease in the time to failure of about 40% from experiment C to B (55 min to 30 min). And, a further drop of about 50% in moisture content caused an approximately 20% decrease in time to failure. The variation in water content also affected the dry density of soil, as shown in Figure 11.

5.1.5. Breach Shape

The breaching started from the left downstream face and fully breached up to the upstream right face. Many researchers described a regular shape of breach channel, but in the present study of breach mechanism, it was observed that the breach shape did not have a fixed pattern. For M1, the breach shape was observed to be trapezoidal (shown by red lines), while in cases of M3, it was observed to be an inverted trapezoidal shape (shown by black lines) (Figure 12). Furthermore, for M5 and M6, the breach shape was approx. rectangular (Shown by black lines) (Figure 13), but for M2 and M4, no regular pattern of the breach was observed (Figure 14). Also, for M4, the downstream breach width was larger than the upstream. The breach shape was quantitively observed, and for M5, the breach channel was 0.32 m wide at the top with a steep slope due to the undercutting process of helicoidal erosion.

5.1.6. Comparison with Other Researchers

In the previous studies, the breaching process was described by assuming a constant breach shape. Ref. [44] studied only the non-cohesive embankments (sand dike) and recommended a five-stage breach erosion process for it. On the basis of the study of sand dike breaching by [44,45], the development of breaching for clay dikes was studied. A clay dike breach’s distinctive difference from a sand dike’s breach is the great headcut erosion that occurs through the breaching progression of clay dikes. Furthermore, on the basis of the small magnitude of the initial breach and trapezoidal-shaped of the dike, the author categorized the development of breach erosion under five different phases. By considering the variations in soil erodibility along the depth and the steepening of the downstream slope, Chang and Zhang [46] studied the erosion process of landslide dams and divided the evolution of breach development into three stages. Zhao, G. [47] studied the processes of embankment breaching and divided the process of the breach erosion of sand dikes into five stages by assuming a trapezoidal shape of the initial breach.
In the study, the effect of moisture content was observed. It was observed that a 24% drop in moisture content resulted in a decrease in the time to failure of about 40% from experiment C to B (55 min to 30 min). And, a further drop of about 50% in moisture content causes an approximately 20% decrease in time to failure. In the literature, Hanson et al. [48,49] and Hunt et al. [50] observed the influence of compaction moisture content on breach widening. The rate of widening was strongly influenced by water content. Quantitatively, [48,49] observed that a 5% change in water content could result in 100-fold changes in widening rate during headcut and lateral erosion. The variation in water content also affected the dry density of the soil.
Furthermore, the in the literature, the breach shape was assumed to be constant, but in the present study, it was observed that the breach shape could not be assumed to be a regular shape, as it depended upon the type of fill material and dam geometry. Furthermore, it was observed that the breach shape may be rectangular, trapezoidal or also square.

6. Conclusions

For the present study, different tests were performed and analyzed for cohesive and non-cohesive earthen embankments to analyze the breach mechanism, effect of moisture content and breach shape. It was concluded that breach characteristics depend upon geotechnical factors as well as geometrical factors. Available models cannot fully address the need for many of the cases of the breaching of embankments. The breaching, with soil erosion, was observed to start from near the downstream toe of the embankment and wash away the embankment surface with the passage of time. These observations correlate with the observations made in the literature [44,45]. The surface erosion started at the toe of the embankment and moved to the embankment slope, which is termed headcut erosion. In a simultaneous process, headcut migration excited breach development in the longitudinal direction and helicoidal erosion activated it in a lateral direction to widen the breach. The experimental studies effectively theorized that the cohesion slower downs the breaching process. The present study describes the embankment breaching in terms of the following three stages:
  • Initial erosion;
  • Headcut erosion;
  • Lateral erosion.
Also, the effect of moisture content on embankment breaching was observed. The present study concluded that a 24% drop in moisture content results in a decrease in the time to failure of about 40% from experiment C to B (55 min to 30 min); a further drop of about 50% in moisture content causes an approximately 20% decrease in time to failure. In the literature, it was also observed that there is an influence of compaction moisture content on breach widening. The rate of widening was strongly influenced by water content. The present study reveals that:
  • A drop of about 50% in moisture content causes an approximately 20% decrease in time to failure. Hence, moisture content directly affects the breach widening;
  • Variation in water content affected the dry density of soil.
Many researchers previously concluded that the breach shape is constant. In the present study, the authors concluded that breach shape could not be assumed to be a regular shape like a rectangle or trapezoid, as described in the literature. Furthermore, the breach shape depends upon the type of fill material and dam geometry. The results of this experimental work may be useful in designing early warning systems or evacuation plans for populations on the downstream side of embankments. Hence, the outcomes of the present study will be valuable for planning evacuation areas.
The limitations of this study are the small flume, limited soil type and constant hydraulic conditions. The embankment breaching processes are complex, and large-scale tests are recommended to predict the long-term behavior of breaching processes. Further experimentation on the same topic can help to develop newer concepts, for example.

Author Contributions

D.V.: drafting—data collection and preparation of the manuscript, writing—review and editing; P.B.: drafting—preparation of the manuscript, revision, and correction; M.A.K.: composing—reviewing and modifying; F.M.A.: composing—reviewing and modifying; N.G.: composing—reviewing and modifying, S.A.: composing—reviewing and modifying, J.Q.: composing—reviewing and modifying. All authors have read and agreed to the published version of the manuscript.

Funding

This research was funded by Researchers Supporting Project Number RSP2023R297, King Saud University, Riyadh, Saudi Arabia.

Data Availability Statement

The datasets used and/or analysed during the current study available from the corresponding author on reasonable request.

Conflicts of Interest

The authors declare no conflict of interest.

References

  1. Psomiadis, E.; Tomanis, L.; Kavvadias, A.; Soulis, K.; Charizopoulos, N.; Michas, S. Potential Dam Breach Analysis and Flood Wave Risk Assessment Using HEC-RAS and Remote Sensing Data: A Multicriteria Approach. Water 2021, 13, 364. [Google Scholar] [CrossRef]
  2. Zhang, J.; Li, Y.; Xuan, G.; Wang, X.; Li, J. Overtopping breaching of cohesive homogeneous earth dam with different cohesive strength. Sci. China Ser. E Technol. Sci. 2009, 52, 3024–3029. [Google Scholar] [CrossRef]
  3. Loukola, E.; Reiter, P.; Shen, C.; Pan, S. Embankment dams and their foundations, evaluation of erosion. In Proceedings of the International Workshop on Dam Safety Evaluation, Grindelwald, Switzerland, 26–28 April 1993; Volume 4. [Google Scholar]
  4. Foster, M.; Fell, R.; Spannagle, M. A Method for Assessing the Relative Likelihood of Failure of Embankment Dams by Piping. Can. Geotech. J. 2000, 37, 1025–1061. [Google Scholar] [CrossRef]
  5. Zhang, L.M.; Xu, Y.; Jia, J.S. Analysis of earth dam failures—A database approach. In Proceedings of the 1st International Symposium on Geotechnical Safety & Risk, ISGSR2007, Shanghai Tongji University, Shanghai, China, 18–19 October 2007; pp. 293–302. [Google Scholar]
  6. Singh, V.P. Dam Breach Modeling Technology; Kluwer Academic Publisher: Amsterdam, The Netherlands, 1996. [Google Scholar]
  7. Wahl, T.L. Prediction of Embankment Dam Breach Parameters: A Literature Review and Needs Assessment; Dam Safety Rep. No. DSO-98-004; U.S. Department of the Interior, Bureau of Reclamation: Denver, CO, USA, 1998.
  8. Wahl, T.L. Predicting of Embankment Dam Breach Parameters: A Needs Assessment; PAP-735; USBR, Water Resources Research Laboratory: Denver, CO, USA, 2007. [Google Scholar]
  9. Rahman, A.; Mohamed, N. The Effect of Flowing Water on Cohesive Beds. Ph.D. Thesis, ETH Zurich, Zurich, Switzerland, 1963. [Google Scholar] [CrossRef]
  10. Das, P.K. Breach Erosion Process of Homogeneous Earthfill Dams and Fuse Pugs Due to Overtopping Flow. Ph.D. Thesis, IIT Kanpur, Kanpur, India, 1997. [Google Scholar]
  11. Kumar, J.; Kouzer, K.M. Vertical uplift capacity of horizontal anchors using upper bound limit analysis and finite elements. Can. Geotech. J. 2008, 45, 698–704. [Google Scholar] [CrossRef]
  12. Aydan, O.; Ohta, Y.; Hamada, M. Geotechnical evaluation of slope and ground failures during the 8 October 2005 Muzaffarabad earthquake. Pakistan. J. Seismol. 2009, 13, 399–413. [Google Scholar] [CrossRef]
  13. Trivedi, A. Strength and dilatancy of jointed rocks with granular fill. Acta Geotech. 2010, 5, 15–31. [Google Scholar] [CrossRef]
  14. Gaagai, A.; Aouissi, H.A.; Krauklis, A.E.; Burlakovs, J.; Athamena, A.; Zekker, I.; Boudoukha, A.; Benaabidate, L.; Chenchouni, H. Modeling and Risk Analysis of Dam-Break Flooding in a Semi-Arid Montane Watershed: A Case Study of the Yabous Dam, Northeastern Algeria. Water 2022, 14, 767. [Google Scholar] [CrossRef]
  15. Wu, W. Earthen Embankment Breaching. J. Hydraul. Eng. 2011, 137, 1549–1564. [Google Scholar] [CrossRef]
  16. Verma, D.; Berwal, P.; Khan, M.A.; Alharbi, R.S.; Alfaisal, F.M.; Rathnayake, U. Design for the Prediction of Peak Outflow of Embankment Breaching due to Overtopping by Regression Technique and Modelling. Water 2023, 15, 1224. [Google Scholar] [CrossRef]
  17. Verma, D.; Setia, B.; Arora, V.K. Effect of Functional Parameters on Embankment Breaching. In Proceedings of the 3rd International Conference on Natural Hazards and Infrastructure, ICONHIC, Athens, Greece, 5–7 July 2022. [Google Scholar]
  18. Cristofano, E.A. Method of Computing Erosion Rate for Failure of Earthfill Dams; U.S. Bureau of Reclamation: Denver, CO, USA, 1965.
  19. Ashraf, M.; Soliman, A.H.; El-Ghorab, E.; El Zawahry, A. Assessment of embankment dams breaching using large scale physical modeling and statistical methods. Water Sci. 2018, 32, 362–379. [Google Scholar] [CrossRef]
  20. Weiming, W. Simplified Physically Based Model of Earthen Embankment Breaching. J. Hydraul. Eng. 2013, 139, 837–851. [Google Scholar]
  21. Tingsanchali, T.; Chinnarasri, C. Numerical modelling of dam failure due to flow overtopping. Hydrol. Sci. J. 2001, 46, 113–130. [Google Scholar] [CrossRef]
  22. Wang, P.; Kahawita, R. Modeling the hydraulics and erosion process in breach formation due to overtopping. In Sedimentation and Sediment Transport; Springer: Dordrecht, The Netherlands, 2003; pp. 211–220. [Google Scholar]
  23. MacDonald, T.C.; Langridge-Monopolis, J. Breaching characteristics of dam failures. J. Hydraul. Eng. 1984, 110, 567–586. [Google Scholar] [CrossRef]
  24. Powledge, G.R.; Ralston, D.C.; Miller, P.; Chen, Y.H.; Clopper, P.E.; Temple, D.M. Mechanics of overflow erosion on embankments. I: Research activities. J. Hydraul. Eng. 1989, 115, 1040–1055. [Google Scholar] [CrossRef]
  25. Singh, V.P.; Scarlatos, C.A. Analysis of gradual earth-dam failure. J. Hydraul. Eng. 1988, 114, 21–42. [Google Scholar] [CrossRef]
  26. Zhong, Q.M.; Chen, S.S.; Deng, Z.; Mei, S.A. Prediction of overtopping-induced breach process of cohesive dams. J. Geotech. Geoenvironmental Eng. 2019, 145, 04019012. [Google Scholar] [CrossRef]
  27. Wang, Z.; Bowles, D.S. Dam breach simulations with multiple breach locations under wind and wave actions. Adv. Water Resour. 2006, 29, 1222–1237. [Google Scholar] [CrossRef]
  28. Mohamed, A.A.A.; Samuels, P.G.; Morris, M.W.; Ghataora, G.S. Improving the accuracy of prediction of breach formation through embankment dams and flood embankments. In Proceedings of the International Conference on Fluvial Hydraulics, Louvain-la-Neuve, Belgium, 4–6 September 2002. [Google Scholar]
  29. Faeh, R. Numerical modeling of breach erosion of river embankments. J. Hydraul. Eng. 2007, 133, 1000–1009. [Google Scholar] [CrossRef]
  30. Wahl, T.L. Dam breach modeling-an overview of analysis methods. In Proceedings of the Joint Federal Interagency Conference on Sedimentation and Hydrologic Modeling, Las Vegas, NV, USA, 27 June–1 July 2010. [Google Scholar]
  31. Verma, D.K.; Setia, B.; Arora, V.K. Breach behaviour of earth embankments during overtopping. In Proceedings of the 2nd International Conference on Natural Hazards and Infrastructure, ICONHIC 2019, Chania, Greece, 23–26 June 2019. [Google Scholar]
  32. Alhasan, Z.; Jandora, J.; Říha, J. Study of dam-break due to overtopping of four small dams in the Czech Republic. Acta Univ. Agric. Silvic. Mendel. Brun. 2015, 63, 717–729. [Google Scholar] [CrossRef]
  33. Zhu, Y.H.; Visser, P.J.; Vrijling, J.K.; Wang, G.Q. Experimental investigation on breaching of embankments. Sci. China Technol. Sci. 2011, 54, 148–155. [Google Scholar] [CrossRef]
  34. Verma, D.K.; Setia, B.; Arora, V.K. Experimental Study of Breaching of an Earthen Dam using a Fuse Plug Model. Int. J. Eng. Trans. A Basics 2017, 30, 479–485. [Google Scholar]
  35. Pugh, C.A. Hydraulic Model Studies of Fuse Plug Embankment; Rep. No. REC-ERC-85-7; Bureau of Reclamation, U.S. Department of the Interior: Denver, CO, USA, 1985; Volume 34.
  36. Schmocker, L.; Höck, E.; Mayor, P.A.; Weitbrecht, V. Hydraulic model study of the fuse plug spillway at Hagneck canal, Switzerland. J. Hydraul. Eng. 2013, 139, 894–904. [Google Scholar] [CrossRef]
  37. Verma, D.; Setia, B.; Arora, V.K. Mechanism of embankment dam breach. In Proceedings of the International Conference on Fluvial Hydraulics, Lausanne, Switzerland, 3–5 September 2014; pp. 1655–1659. [Google Scholar]
  38. Verma, D.; Setia, B.; Arora, V.K. Experimental study on breaching of embankments. In Proceedings of the 9th International Conference on Scour and Erosion, ICSE, 2018, Taipei, Taiwan, 5–8 November 2018; pp. 255–261. [Google Scholar]
  39. Verma, D.K.; Setia, B. Two-dimensional unsteady dam breach analysis using fuse plug models. Disaster Adv. 2021, 14, 74–82. [Google Scholar]
  40. Aamir, M.; Ahmad, Z.; Pandey, M.; Khan, M.A.; Aldrees, A.; Mohamed, A. The Effect of Rough Rigid Apron on Scour Downstream of Sluice Gates. Water 2022, 14, 2223. [Google Scholar] [CrossRef]
  41. Wu, M.; Ge, W.; Li, Z.; Wu, Z.; Zhang, H.; Li, J.; Pan, Y. Improved Set Pair Analysis and Its Application to Environmental Impact Evaluation of Dam Break. Water 2019, 11, 821. [Google Scholar] [CrossRef]
  42. Kruse, E.; Eslamian, S.; Ostad-Ali-Askari, K.; Hosseini-Teshnizi, S.H. Borehole Investigations. In Encyclopedia of Engineering Geology, Encyclopedia of Earth Sciences Series; Bobrowsky, P., Marker, B., Eds.; Springer: Cham, Switzerland, 2018. [Google Scholar]
  43. Dhiman, S.; Patra, K.C. Studies of dam disaster in India and equations for breach parameter. Nat. Hazards 2019, 98, 783–807. [Google Scholar] [CrossRef]
  44. Visser, P.J. Breach growth in sand-dikes. In Communications on Hydraulic and Geotechnical Engineering; Delft University of Technology: Delft, The Netherlands, 1998; Volume 172. [Google Scholar]
  45. Zhu, Y.; Visser, P.J.; Vrijling, J.K. Laboratory observations of embankment breaching. In Proceedings of the 7th ICHE Congress, Philadelphia, PA, USA, 10–13 September 2006. [Google Scholar]
  46. Chang, D.S.; Zhang, L.M. Simulation of the erosion process of landslide dams due to overtopping considering variations in soil erodibility along depth. Nat. Hazards Earth Syst. Sci. 2010, 10, 933–946. [Google Scholar] [CrossRef]
  47. Zhao, G. Breach Growth in Cohesive Embankments due to Overtopping. Ph.D. Thesis, Delft Academic Press, Delft, The Netherlands, 2016. [Google Scholar]
  48. Hanson, G.J.; Morris, M.; Vaskinn, K.; Temple, D.M.; Hunt, S.; Hassan, M. Research activities on the erosion mechanics of overtopped embankment dams. ASDSO J. Dam Saf. 2005, 3, 4–16. [Google Scholar]
  49. Hanson, G.J.; Temple, D.M.; Morris, M.; Hassan, M.; Cook, K. Simplified Breach Analysis Model for Homogeneous Embankments: Part II, Parameter Inputs and Variable Scale Model Comparisons; The United State Society on Dams: Salt Lake City, UT, USA, 2005; pp. 163–174. [Google Scholar]
  50. Hunt, S.L.; Hanson, G.J.; Cook, K.R.; Kadavy, K.C. Breach widening observations from earthen embankment tests. Trans. ASAE 2005, 48, 1115–1120. [Google Scholar] [CrossRef]
Figure 1. Pictorial view and line diagram of recirculating flume (10 m long, 0.60 m wide, 0.60 m deep; NIT, Kurukshetra).
Water 15 03030 g001
Figure 2. Material procurement and treatment.
Water 15 03030 g002
Figure 3. Embankment Modeling.
Water 15 03030 g003
Figure 4. Compaction Roller.
Water 15 03030 g004
Figure 5. Embankment with middle trench.
Water 15 03030 g005
Figure 6. Different flow parameters.
Water 15 03030 g006
Figure 7. Initial Erosion for Two Different Embankment Models.
Water 15 03030 g007
Figure 8. Progress of headcut erosion of different embankment models.
Water 15 03030 g008
Figure 9. (a) Undercutting due to negative flow; (b) enormous widening of breach.
Water 15 03030 g009
Figure 10. Headcut migration rate of three set of experiments.
Water 15 03030 g010
Figure 11. Variation in moisture content with dry density for three sets of experiments.
Water 15 03030 g011
Figure 12. Breach shape for model M1 and M3.
Water 15 03030 g012
Figure 13. Breach shape for model M5 and M6.
Water 15 03030 g013
Figure 14. Breach shape for model M2 and M4.
Water 15 03030 g014
Table 1. Soil parameters of fill material used for embankment models.
Soil TypeMedian Size (D50) mmDry Density (gm/cc)Cohesion (Kg/cm2)Moisture
Content (%)
Soil Classification
A0.251.820.05524SW (Non-cohesive)
B0.091.660.3518CL (Cohesive)
Table 2. Dimensions of different embankment models.
Model No.Soil TypeEmbankment Model Parameters
Dam Length (cm)Dam Height (cm)Crest Width (cm)Bottom Width (cm)Upstream SlopeDownstream SlopeFlume Bed Thickness (cm)
M1Soil A60252092.51:11:1.510
M2Soil B60252092.51:11:1.510
M3Soil A6025201201:11:210
M4Soil B6025201201:11:210
M5Soil A603520142.51:11:1.510
M6Soil B603520142.51:11:1.510
Table 3. Different breach characteristics for different models.
Model No.Breach Initiation Time (s)Time to Failure (s)Breach Width (cm)Breach Depth (cm)
TopBottom Width
M1499504019
M220132424820
M33120424825
M455181444815
M5898464432
M635208484730
Table 4. Soil properties and results of three sets of experiments.
Expt.Water Content, wDry Density, γw/w0γ/γdTime to Failure, tf
A5.9221.44420.420.8722
B10.7161.52720.760.9230
C13.9591.2450.990.7555
Disclaimer/Publisher’s Note: The statements, opinions and data contained in all publications are solely those of the individual author(s) and contributor(s) and not of MDPI and/or the editor(s). MDPI and/or the editor(s) disclaim responsibility for any injury to people or property resulting from any ideas, methods, instructions or products referred to in the content.

