Article

Comprehensive Evaluation and Distribution Prediction of River Water Quality in One Typical Resource-Depleted City, Central China

1
College of Life Sciences, Henan Normal University, Xinxiang 453007, China
2
Puyang Field Scientific Observation and Research Station for Yellow River Wetland Ecosystem, Puyang 457183, China
3
Henan Provincial Institute of Natural Resources Monitoring and Land Improvement, Zhengzhou 450016, China
4
Department of Environmental Sciences, Kohsar University Murree, Rawalpindi 47150, Punjab, Pakistan
*
Authors to whom correspondence should be addressed.
These authors contributed equally to this work.
Water 2023, 15(17), 3035; https://doi.org/10.3390/w15173035
Submission received: 20 July 2023 / Revised: 11 August 2023 / Accepted: 14 August 2023 / Published: 24 August 2023
(This article belongs to the Section Water Quality and Contamination)

Abstract

:
Access to clean and equitable water is vital to human survival and an essential component of a sustainable society. Using 59 monitoring sections, the water quality of 32 rivers in 12 river systems within two river basins in one resource-depleted city (Jiaozuo) was examined in four seasons to better comprehend the extent of river pollution, and the distribution prediction of main indexes was conducted. In total, 92% of the monitoring sections met the national standards. Overall, 12.5%, 62.5%, and 25% of samples met water quality standards III, IV, and V, respectively. The concentrations of total nitrogen (TN), total phosphorus (TP), and chemical oxygen demand (COD) ranged from 0.527 to 7.078, 0.001 to 1.789, and 0.53 to 799.25 mg/L, respectively. The Yellow River Basin has higher annual mean concentrations of total carbon (TC), TN, and total organic carbon (TOC) than the Haihe River Basin. The highest and lowest concentrations of specific water quality indices varied across seasons and rivers. Dashilao and Rongyou Rivers have the best water quality, while Dasha, Xin, and Mang Rivers have the worst. TN, TP, and NH4+-N concentrations in the Laomang River midstream were greater than those upstream and downstream. Statistically, significant positive associations were found between NH4+-N and TC, TOC, and COD (p < 0.025), where NH4+-N and COD influenced water quality the most. A significant positive relationship between COD and TP (p < 0.01) was observed. Overall, water quality values were highest in the summer and lowest in winter. The distribution prediction revealed TN, TP, NH4+-N, and COD showed significant regional differences. Household sewage, industrial sewage discharge, and agricultural contamination were all the possible significant contributors to declining water quality. These findings could provide a scientific reference for river water resource management in resource-depleted cities.

1. Introduction

Water resources sustain human life and aid in the development of civilization. Additionally, they are critical to the normal functioning of ecosystems and biological life [1,2]. Accelerated population growth, climate change, economic development, agricultural irrigation, and other factors are significant drivers of water scarcity, which leads to significant threats to human survival and the health of terrestrial and aquatic ecosystems [3,4,5,6]. In addition, urbanization, industrial development, and excessive use of pesticides have severely disrupted the natural equilibrium of the water ecosystem [7,8,9], thereby accelerating the depletion of available freshwater resources and promoting deterioration of water quality. Nearly four billion people live in environments where water is limited for at least one month per year [10]. As a water-scarce nation, the urbanization process in China is accelerating, and the per capita water resource capacity is greatly insufficient. Moreover, the spatial heterogeneity of water resource distribution and utilization efficiency further aggravates the water resource shortage. According to studies, the efficacy of water resource utilization is greater in the east, where water resources are abundant, than in the west, where water is limited [11]. With the growing disparity between the supply and demand of water resources [12], the shortage of water resources resulting from rapid economic growth and water pollution has become a significant constraining factor impeding the coordination and sustainable development of the economy, society, and ecological environment [13]. Therefore, it is necessary to determine whether the water quality in a particular region is sufficient for its requirements.
The whole world continues to face serious issues with water pollution. Every year, more than 420 billion m3 of sewage is released into rivers, lakes, and seas, contaminating 5.5 trillion m3 of fresh water and accounting for more than 14% of the world’s total runoff [14]. Every day, millions of tons of waste are deposited into rivers, lakes, and streams throughout the globe, and each liter of wastewater can pollute 8 liters of fresh water [15]. In the United States, processed food waste, metals, fertilizers, and pesticides pollute 40% of water basins, whereas only 5 out of 55 rivers have barely usable water in Europe [16]. In 2022, total wastewater discharge in China was 43.95 billion tons, of which industrial wastewater (20.72 billion tons) accounts for 47.1% with a relatively high chemical oxygen demand (COD) content, and municipal effluent (23.23 billion tons) accounts for 52.9% with a higher NH4+-N concentration. Enrichment of nutrients in water bodies, particularly those with TN and TP, may lead to eutrophication. In addition to non-point agricultural sources, pesticide pollution, heavy metal pollution, and urban sewage have become significant sources of contamination [17,18].
There are numerous methods for assessing the water environment at the moment, such as the single-factor assessment method, the Nemero pollution index method, the comprehensive water quality identification index method, and the principal component analysis method [19,20,21]. These assessment methodologies have been extensively employed in river, lake, and reservoir water quality evaluations, providing vital scientific support for water pollution prevention and aquatic environment governance [22]. The combined FCE–PCA (Fuzzy Comprehensive Evaluation–Principal Component Analysis) model should be useful in assessing water quality in the Nansi Lake Basin [23]. Bi et al. [24]. discovered that the findings of each approach were not similar; thus, it is critical to investigate complete water quality evaluation using diverse methodologies in order to develop scientific and acceptable water pollution management plans. As a consequence of the thorough water quality assessment findings, a series of water treatment projects in polluted areas may be carried out, favorably impacting municipal sewage treatment [25]. There are currently few water pollution analyses and water quality assessments for significant expanses of water that are becoming urbanized.
Jiaozuo City, located in North China, is a typical example of a resource-depleted city in China. However, it is also a well-known “century-old coal city” and old industrial base, a national intellectual property pilot city, and a national demonstration base for modern industrialization. The per capita water resources in Jiaozuo City are 223 m3, less than 1/8 of the national total. In general, the spatiotemporal distribution of water resources in Jiaozuo is uneven, with few water conservation projects and a lack of overall water resource allocation capability, resulting in river flow interruption, wetland shrinkage, and river biological water source depletion. Furthermore, water resources in Jiaozuo are severely contaminated as a result of the expansion of the mining sector and the excessive discharge of urban sewage. The water quality of Jiaozuo, as well as the river system and watersheds, were analyzed using the single-factor assessment and the revised Nemero pollution index technique in this study. Furthermore, this research examined the seasonal fluctuations in water quality in Jiaozuo as well as the major pollution sources. The findings may offer a valid scientific foundation for targeted water pollution management and river water quality improvement in Jiaozuo.

2. Methods and Materials
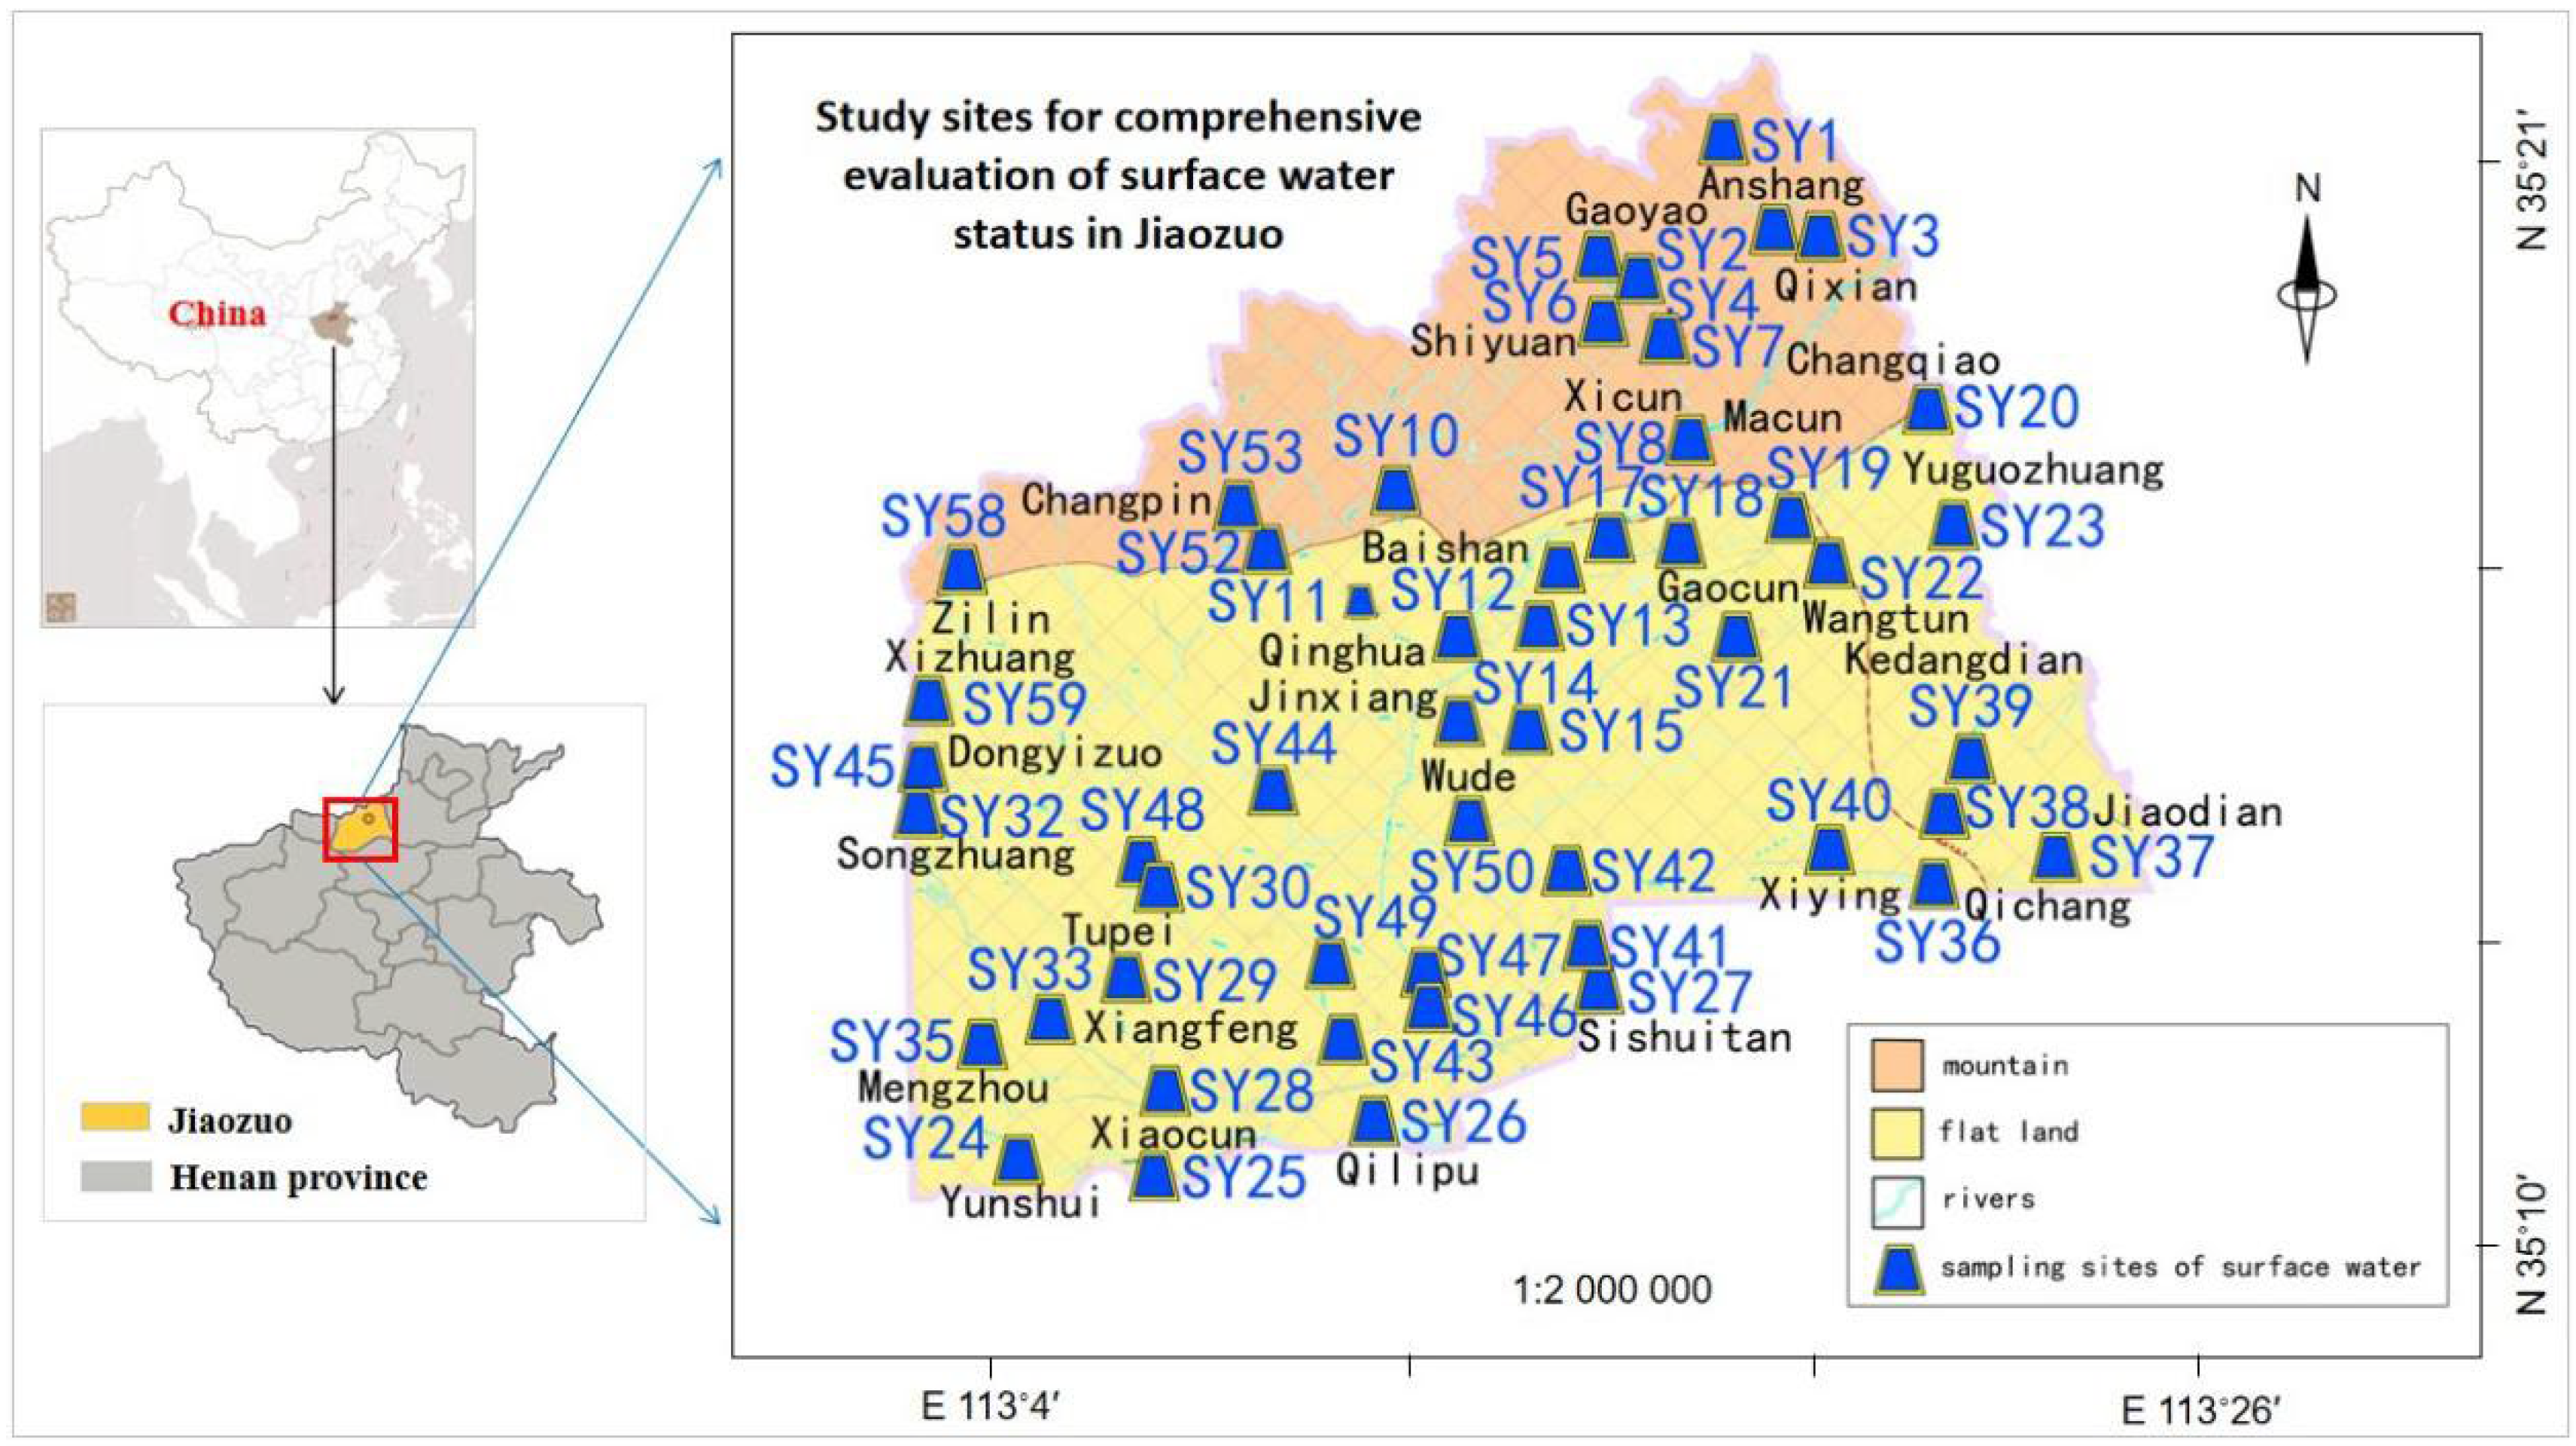
2.1. Study Site

Jiaozuo City (113.25′ E, 35.22′ N), which is situated in the northwest of Henan province, consists primarily of mountains and the sloping plains in front of mountains. The mountain terrain is steep, and the valleys are deep, which makes it simple to generate surface drainage and suitable for constructing water conservation facilities such as reservoirs. Notably, Jiaozuo has a large permanent population, and its economy is dominated by the secondary industry. The industrial system is highly dependent on water resources and exerts a significant influence on them. Jiaozuo City is subject to the continental monsoon climate of a warm temperate zone, with little rain and snow in winter, dry and windy conditions in spring, hot and rainy conditions in summer, and sufficient sunshine in autumn. As mountainous regions transition to plains, precipitation decreases progressively due to climatic and topographical factors. The average annual precipitation is between 575 and 641 mm, and between 51% and 58% of the annual precipitation falls during the flood season (June and August). In addition, this region experiences a substantial amount of evaporation during the months of May and June. The Jiaozuo Meteorological Bureau recorded 752.3 mm of precipitation and 1512 mm of evaporation in the urban area of Jiaozuo in 2021. Under the comprehensive influence, the majority of rivers in Jiaozuo City are seasonal, and the seasonal distribution of water resources is highly unequal.

2.2. Sampling

Set of monitoring sample sites. This investigation adhered to the guiding principles of scale, information, economy, representativeness, controllability, and continuous optimization. In the study area, a total of 59 monitoring sites were designated. Figure 1 depicts the location distribution of each monitoring section. This investigation included the upstream, middle-stream, and downstream portions of 36 rivers, which are part of 12 water systems and 2 water basins. Since some rivers are seasonal and others have dried up, there are no data for certain seasons or the entire year. Lastly, the specific characteristics of each site were recorded in the schedule (Table S1).
Determination of sampling sites. The water surface widths of all rivers were less than 50 m, so one monitoring vertical line was set. The water depth of all rivers was less than 5 m, so only one point needs to be sampled at 0.5 m below the water surface.
Monitoring frequency. This 12-month research period began in the spring of 2021. The whole experiment period was divided into four quarters: spring (March, April, and May), summer (June, July, August), autumn (September, October, November), and winter (December, January, February). Due to the epidemic situation, rainstorms, and the effect of flooding in July 2021 in the research area, a total of four sample detections were undertaken in this study, including one each in April, September, and November 2021 and January 2022.
Water sample collection. Perspex water collector (2.5 L, Purity, Beijing, China) was used to collect water samples at the surface depth (0.2–0.3 m). Three water samples were collected from each sample site. The water sample was transferred into the polyethylene kettle, and 2.5 mL MgCO3 reagent (1%, v/v) was added by drops immediately to avoid changes in chlorophyll-a (Chl-a). In the meantime, water temperature (WT), pH, dissolved oxygen (DO), etc., were measured in the field.
River sediment collection. In November 2021, river sediment was collected concurrently with water samples using a columnar sediment collector. The sediment sample was sealed in a bag and sent to the laboratory for analysis.

2.3. Measurement of Physical and Chemical Parameters of Water Bodies and Sediment

Total carbon (TC), total nitrogen (TN), total phosphorus (TP), total organic carbon (TOC), NH4+-N, NO3--N, Chl-a, chemical oxygen demand (COD), WT, DO, pH, and electrical conductance (EC) were selected as the indexes. Of all indexes, WT, pH, oxidation-reduction potential (ORP), and DO were measured by a Hash water quality analyzer (HQ11D53000000, America) in the field, while other indexes were assessed using the Environmental Quality Standard for Surface Water (GB3838-2002) [26]. The detection methods of each index are shown in Table 1.
After natural air drying, the TC and TN content of sediment was determined using a total carbon and nitrogen analyzer (Vario EL Ⅲ, Germany). TP content was determined by potassium persulfate digestion spectrophotometry [27].

2.4. Evaluation Method of River Water Quality

2.4.1. Evaluation Standard for River Water Quality

Seven basic river water quality criteria were established in this work based on the requirements of Environmental Quality standards for Surface Water (State Environmental Protection Administration, GB3838-2002) and according to the research needs for statistical analysis (Table 1).
In order to investigate the changes in water indicators after the rivers flow through cities center, we selected the Laomang River, with the middle section flowing through downtown and human settlements as the research object, and then various indicators were measured.

2.4.2. Evaluation Method of River Water Quality

Water quality was evaluated using the single-factor assessment method and the improved Nemero pollution index method. By comparing the monitoring results of physical and chemical factors with the water quality classification standards, the single-factor assessment method determined if the water quality met the standards. The evaluation factors selected by the single-factor evaluation method consist of sensory properties (color, smell), physical indicators, general chemical indicators, toxicological indicators, microbial indicators, and other water quality evaluation items. The water quality category of the worst factor was used as the overall water quality category of the evaluated body of water. The water environment quality standards for single-factor assessment are shown in Table 2.
The Nemero pollution index method was a method of evaluating the target water quality category based on the comprehensive pollution index [28]. Firstly, for the river function to be evaluated, the water quality classification level was determined, and then the weight of each pollution index was calculated according to the following Formulas (1) and (2).
ω i = r i i = 1 n r i
r i = S m a x S i
where ω i is the weight value of the pollution factor; n is the number of pollution factors; Si is the calculation standard of the i-th pollution factor; and Smax is the maximum value of n pollution factor calculation standards.
Then, the same pollution factors that were to be evaluated in the rivers were then selected from the water environment quality standards, and the improved Nemero pollution index of each water quality level was calculated using Formula (5) to obtain the pollution level standard divided by the improved Nemero index.
F i = C i S i
F i , m a x = F i , m a x + F ω 2
P = F i , m a x 2 + F ¯ i 2 2
where Fi is the single indicator pollution index; Ci is the measured value of a single index; Si is the maximum allowable standard value corresponding to a single indicator; Fi max is the maximum value of Fi; Fω is the F value of the pollution factor with the largest weight value; F ¯ i is the average value of Fi; P’ is the improved Nemero pollution index.
Finally, we defined the pollution levels: pollution factors DO, COD, NH4+-N, TN, and TP were selected from the Environmental Quality Standards for Surface Water (GB3838-2002). With the ideal categories of each river as the calculation standard, the improved Nemero pollution index of each water quality category was calculated using the above formula to obtain the pollution level standard divided by the improved Nemero index.

2.5. Distribution Prediction of Main Water Quality Indexes

The distribution prediction of water quality indexes was completed by ArcGIS, and the main method was spatial interpolation technology. Kriging method is a random method of exact interpolation and local interpolation, which can be used to estimate the prediction quality by the estimated prediction error and has been widely used in many subjects [29,30,31]. The interpretation differences of different influencing factors also form a variety of Kriging methods [32,33], and the Ordinary Kriging method was used in this study [34].
Firstly, the histogram tool was used to analyze the frequency distribution, and the normal QQ chart was used to observe the normal distribution of data. Secondly, the observation for outliers was conducted via the Tyson polygon map, and the trends were analyzed. Then, the semi-variogram/covariance cloud was used to examine the data set and identify local outliers. Finally, we started the local statistics wizard to obtain the distribution prediction graphs. In this study, we chose to remove the second order; thus, the regression function y = 0.269x + 11.727, and among them, the mean (−0.025) and standard mean (−0.008) were close to 0. The root mean square (2.530) was close to the mean standard error (2.438). The standard root mean square (1.024) was close to 1, and the prediction results were reliable.

2.6. Data Analysis

River water quality was analyzed from the stream system and basin and compared from four quarters. To examine the significance of the data and the association between various factors, single-factor analysis of variance and person correlation analysis were applied. To better understand the physical and chemical properties of rivers, as well as to investigate the interaction between physical and chemical factors, person correlation and principal component analysis were performed using the software SPSS 22, Origin 2022, and Prism 8.

3. Result

3.1. Monitoring Results of Physical and Chemical Indexes of River Water

TN concentrations varied from 0.527 to 7.078 mg/L, TP concentrations from 0.001 to 1.789 mg/L, and COD concentrations from 0.53 to 799.25 mg/L (Figure S1). The highest monthly average concentrations of NH4+-N (1.196 mg/L), TOC (16.563 mg/L), COD (188.451 mg/L), and Chl-a (22.585 μg/L) were all recorded in spring. Additionally, the highest values of TN (4.503 mg/L) and TP (0.119 mg/L) were found in summer, while the lowest values of TN and TP (3.365 mg/L, 0.055 mg/L) were observed in spring and autumn, respectively. The monthly average concentrations of TOC (6.432 mg/L), COD (25.40 mg/L), and Chl-a (2.972 μg/L) were the lowest in winter. The highest monthly mean concentration of nitrate nitrogen (8.883) was found in autumn.
Among all the rivers investigated, 34.18% have the highest TN concentration in summer, 29.11% have the highest TP concentration in summer, 31.65% have the highest NH4+-N concentration in summer, and 36.71% have the highest COD concentration in summer. Among all the rivers, the water quality indexes of TOC, TP, NH4+-N, Chl-a, and COD in the rivers with the highest water quality parameter concentration in spring accounted for more than 30%. The annual mean value of TC content was found to be highest in the Jianggou River system (46.041 ± 6.516 mg/L), and the lowest was found in the Anquan River system (17.994 ± 13.117 mg/L) (Figure 2A). Significant differences (p = 0.018) were found across various water systems, while TC content varied significantly (p = 0.024) between seasons.
The Jianggou River system had the highest annual mean TN content (5.418 ± 1.660 mg/L), whereas the Xin River system had the lowest (1.592 mg/L) (Figure 2B). There was a significant difference (p = 0.012) across water systems and seasons (p = 0.022). The highest annual mean value for TP concentration was 0.141 ± 0.164 mg/L in the Dasha River system, while the lowest was 0.007 mg/L in the Dan River system (Figure 2C). Notably, the annual TP concentration varies significantly (p = 0.009) amongst different water systems. The highest annual mean value of TOC was 20.440 mg/L (Xin River system), while the lowest was 5.048 ± 2.032 mg/L (Anquan River system) (Figure 2D). The TOC content of 58.3% of river systems was greatest in spring, with a significant difference (p = 0.001) between seasons. The highest annual average value of NH4+- N was 1.494 mg/L (Xin River system), while the lowest was 0.101 ± 0.068 mg/L (Anquan River system) (Figure 2E). Additionally, there existed a very significant difference (p = 0.008) among water systems. Importantly, the NH4+-N content in the same river varies significantly from season to season.
The Xinmang River system had the highest annual mean COD content (40.811 ± 20.883 mg/L), while the Anquan River system had the lowest value (9.780 ± 9.427 mg/L) (Figure 2H). There was a significant difference between seasons (p < 0.05) for the annual average value of COD content. Overall, DO concentration ranged between 4.003 and 21.980 mg/L, having the highest values in the Yellow River during spring, while the lowest in the Mang River during summer was the Chl-a concentration, which ranged between 0.018 and 132.246 μg/L. pH was recorded in the range of 7.44–9.22.

3.2. The Physical and Chemical Indexes of Water Quality in Different Watersheds in Different Seasons

The annual average values of TC, TN, TOC, DO, and pH were higher in the Yellow River Basin than in the Haihe River Basin, with the exception of TP, NH4+- N, NO3-N, Chl-a, COD, WT, and EC indicators (Figure 3). Except for TP, pH, and DO (p = 0.007; p = 0.002; p = 0.034), there was no significant difference between the two basins. Except for WT, DO, and EC (p = 0.001; p = 0.011; p = 0.019), the other indicators in the Haihe River Basin had no significant difference between different seasons. Compared with the Haihe River Basin, TN, TOC, NO3-N, COD, WT, pH, and EC in the Yellow River Basin varied significantly or highly significant among different seasons (p = 0.023, 0.001, 0.007, 0.005, 0.001, 0.027, 0.011, respectively).

3.3. The Changes in Indicators When Rivers Flow through Urban Centers or Human Settlements

Laomang River was selected as a typical example of rivers running through urban centers or human settlements.TN, TP, and NH4+-N content in the middle reaches of the Laomang River were larger than those upstream and downstream, with downstream values being greater than upstream values (Figure 4). The TN content midstream and downstream were significantly higher than those upstream (p = 0.0008 < 0.01) (Figure 4A). Although not statistically significant, the concentrations of TP and NH4+-N in the Laomang River midstream were higher than those upstream and downstream (Figure 4B,C).

3.4. Detection Results of C, N, and P Content in Sediment

Regarding C, N, and P content of river sediment, it was important to note that the TC, TN, TP, and C/N content varied significantly between water systems.
TC concentrations in sediment ranged from 9.50 to 78.30 mg/g. The Danhe River system had the highest TC content (78.30 mg/g), while the Xinmanghe River system had the lowest (21.83 mg/g) (Figure 5A). The Jianggou River system contained the greatest concentrations of TN (2.86 ± 1.61 mg/g) and TP (0.90 ± 0.04 mg/g), while the Danhe River system contained the lowest concentration of TN (0.67 mg/g) (Figure 5B) and the Weihe River system contained the lowest concentration of TP (0.35 ± 0.14 mg/g) (Figure 5C). The highest C/N in sediment was 116.24 in the Danhe River system, while the lowest ratio was 15.87 in the Dashilao River system (Figure 5D).
The concentrations of TC, TN, and TP in water showed a positive correlation with the contents of TC, TN, and TP in sediments at the corresponding sampling sites, and the correlation coefficients R2 were 0.022, 0.046, and 0.017, respectively (Figure 6).

3.5. Water Quality Assessment Results

Water quality assessment by the improved Nemero pollution index method suggested that the overall water quality of both the Yellow River Basin and Haihe River Basin were Class IV water. Water quality in the Dasha River system, Xin River system and Mang River system met the Class V water standard, and the Dashilao River system and Rongyou River system met the Class III standard, while the remaining belonged to Class IV water (Table 3).
In addition, the single-factor assessment results showed that the water qualities of the two water basins were both Class V, and the water qualities of all the 12 river systems were Class V. TN has been identified as the index factor of the highest pollution level. According to the improved Nemero pollution index evaluation, the Xin River system in spring met water quality Class Ⅱ, and the Dan River system met water quality Class IV in autumn. The other rivers had water quality of Class Ⅴ for the four seasons (Table 4).

3.6. Correlation Analysis of Physical and Chemical Indexes of Water in Different Seasons

The results of the Pearson correlation analysis of water indicators varied greatly in different seasons (Figure 7). The NH4+-N had significant positive correlations with TC (r = 0.74, p = 0.010), TOC (r = 0.62, p = 0.044), COD (r = 0.73, p = 0.016), and EC (r = 0.70, p = 0.025) in spring (Figure 7A) and also had significant relationships with TC (r = 0.71, p = 0.014) and TP (r = 0.70, p = 0.016) indicators in summer (Figure 7B). During the autumn, there was a significant positive correlation existed between NH4+-N and TP (r = 0.76, p = 0.011), as well as significant negative correlations between pH and NH4+-N (r = −0.68, p = 0.031) and TP (r = −0.73) (Figure 7C). In the winter, there was a significant positive correlation between TC and TN (r = 0.83) and NO3--N (r = 0.82). Significant negative correlations were revealed between DO and WT (r = −0.72) and between pH and TN (r = −0.69).
However, COD had significant and highly significant positive correlations with TC (r = 0.74, p = 0.044), TOC (r = 0.76, p = 0.011), TP (r = 0.84, p = 0.002), NH4+-N (r = 0.73, p = 0.016) in spring, and moreover, there were significant positive correlations between COD and TOC (r = 0.66, p = 0.026), TP (r = 0.75, p = 0.007), Chl-a (r = 0.63, p = 0.039) in summer, as well as between COD and TP in autumn (r = 0.67, p = 0.033).
As shown in Figure S1, there was a significant positive correlation between NH4+-N and TC, TOC, COD, and WT, and significant positive correlations were found between COD and TC, TOC, and TP.

3.7. Principal Component Analysis

Since COD and NH4+- N indicators had the greatest impact on assessing water quality, the indicators that had a significant correlation with these two indicators were selected for principal component analysis. Among the indicators that were significantly related to COD, one principal component was extracted; its characteristic value was 2.131, and its contribution rate was 53.28% (Figure 8). Each of the indicators made a positive contribution to COD, with the TP indicator having the highest load value and the greatest contribution.
Two principal components were extracted from the indicators that were significantly related to NH4+-N. The characteristic value of principal component 1 was 1.913, with the contribution rate of 47.834%. Among them, the COD load value was the largest. The characteristic value of principal component 2 was 1.314, which accounted for 32.85%. Among them, the TOC load value was the largest, and all indicators had a positive contribution to NH4+-N.

3.8. Distribution Prediction of Main River Water Quality Indexes in Jiaozuo City

Areas where the average annual river temperature exceeds 20 °C include the south of Jiefang district, the middle of Shanyang district, the southeast of Wen County, the southwest of Wuzhi, and the areas bordering Mengzhou, Wen County, and Qinyang city. Additionally, the average annual river temperature in the mountains in the north of Jiaozuo, the south of Mengzhou, and the southeast of Wuzhi was less than 11 °C. The average annual river temperature in the Yellow River Basin was higher than that in the Haihe River Basin, and the average annual water temperature in the northern mountainous area was lower than that in the southern plain area (Figure 9A).
According to the forecast of pollutant distribution, generally, DO content was higher in the north and south and lower in the middle (Figure 9B). The river with the highest concentration of DO was located in the northern mountainous area and along the Yellow River in the south of Jiaozuo. TN concentration was highly distributed in the middle and low in the east and west, with the highest concentrations in Qinyang, Boai, and Wen counties (Figure 9C). NH4+-N content in rivers was forecasted low in the north and south and high in the east and west, and the contents of TN and NH4+-N were distributed continuously and uniformly in sheets, which requires overall improvement. It is predicted that TP concentration in the river was high in the northeast and low in the southwest. Under the condition of overall low TP content, a high concentration outbreak point occurs, and timely treatment should be taken according to the special situation of the outbreak point (Figure 9D). COD content was high in the northeast and southwest, low in the northwest and southeast, and the pollution was the most serious in the east of Xiuwu County, the east of Machun District, and the west of Mengzhou and Wen County (Figure 9F).
Comprehensively, under the consideration of multiple indexes, the water quality in Shanyang district and Machun district was poor. The direct discharge of domestic sewage occurs frequently in Jiaozuo, and there are many sewage outlets in the river.

4. Discussion

4.1. Evaluation and Analysis of Whole-Area Water Quality in Jiaozuo City

The better water quality of the Yellow River Basin in Jiaozuo compared to that of the Haihe River Basin may be attributable to the greater number of water systems that travel through urban or agricultural areas in the Haihe River Basin. Pollutants discharged by urban production and living activities and non-point source contamination from agriculture degraded water quality [14,15,35]. The findings of the present study indicated that the water quality of the Dasha River system, Xin River system, and Mang River system was severely contaminated. This might be because the majority of the three rivers pass through the areas where human activity is concentrated, and the majority of sewage released by humans is dumped into rivers without treatment, resulting in severe water pollution. Water quality was better in the lower sections of the Qinhe River system in comparison to the middle and upper reaches, possibly because of the addition of water from tributaries that had diluted pollutants. The better water quality of the Qinhe River was comparable with the Hei River, which is the second largest inland river in China [36].
In the Mang River system, the water quality in the middle reaches of the Laomang River was very poor because it flows through the urban areas of Wenxian County, where intense human activities cause more pollutants to enter the river. Additionally, the Rongyou River also flows through the urban areas, which causes the concentration of pollutants in the middle reaches of the Laomang River to increase. Before merging with the Yellow River, the lower reaches of the Laomang River traverse a vast area of agriculture. Long-distance river self-purification improved the water quality of the lower reaches of the Laomang River, as reported previously [37]. On the other hand, the water quality in the lower reaches of the Xinmang River and Zhulong River was worse than in the upper reaches, which was due to the fact that the Zhulong River transported polluted V water into the middle reaches of the Xinmang River. The Dasha River system also had a low water quality for the same reason that most rivers pass through urban areas, and as human population and activities expand, more pollutants are introduced into rivers [38]. The Shanmen River was also seriously polluted, and many physical and chemical factors exceeded the environmental water quality standards. During summer and autumn, the upstream of Chaoyang Gong River, Longdong River, and Jiabanchuang River supplement their water to Shanmen River. However, the Shanmen River and its three upstream tributaries were shut off over most of one year. As a consequence, the rivers that run through residential areas accumulate a great deal of domestic effluent. The environmental quality of these rivers was poor, which was just in line with the current situation of the Shanmen River, a polluted river in Jiaozuo City. Moreover, the highest and lowest content of water quality parameters in one river varied among seasons, and the highest and lowest content of water quality parameters in one season varied among different rivers. This is not only related to the characteristics of water quality parameters but also to the lifestyle, economic level, and social function of the region where the water sample sites are located [39,40]. When the water flows through the downtown area, a certain index of water quality (TN content of the Laomang River) was significantly worse than the upstream water quality, which was clearly due to the discharge of human sewage or industrial wastewater. For example, the midstream of the river in this study had excessive levels of NH4+-N and low levels of DO due to an adjacent swine farm. The above description was exactly consistent with the predicted distribution analysis results of water quality indexes, and the current results agreed with Han and Zheng [31] that the value of model decision mainly depends on pollution severity and management objectives.
Except for the highest monthly average concentrations of TN and TP, which were concentrated in summer when the temperature was higher, the highest monthly average concentrations of NH4+-N, TOC, COD, and Chl-a were all in spring. The hot and wet summer, along with high per capita water consumption, may have resulted in pollution dilution. The lowest monthly average concentration of Chl-a was found in winter, which was mostly connected to the optimal growing season of phytoplankton in the water, which was comparable to the Xiangxi Bay of the Three Gorges Reservoir [41].
In the water quality evaluation, the dissolved oxygen content of the rivers in Jiaozuo met the national standard for Class III. In reality, the field survey discovered a significant number of aquatic plants, such as curly pondweed, in the Qinhe River system, Rongyou River system, and Mang River system, which were distributed in the highest solubility region. These plants’ activities provide a significant quantity of dissolved oxygen to the river [42]. Of course, the more intense the development of planktonic algae, the higher the consumption of dissolved oxygen in the water, which may cause the water body to become dark and stinky, and the water quality to drop dramatically. The quantity of dissolved oxygen in Jiaozuo City’s rivers indicated that phytoplankton growth in the water did not reach the level that impacts water quality. Total nitrogen pollution was severe in Jiaozuo. Han and Li [43] discovered that the TN in rivers was mostly caused by residential sewage, farming drainage, and nitrogenous industrial effluent. During field sampling, it was discovered that there were a large number of sewage outlets in rivers that have been severely contaminated because they run through human populations.

4.2. Analysis of Key Factors Affecting Water Quality

Overall, COD and NH4+-N had the greatest impact on the whole-are water quality in Jiaozuo. This was because the dissolved oxygen of the river played an important role in maintaining the virtuous cycle of the river’s aquatic ecosystem [44], but the NH4+-N, an oxygen-consuming substance, will consume much of the oxygen if the river has a large amount of it [35]. According to the predicted results of water pollution distribution, the contents of TN and NH4+-N in the east and west of Jiaozuo showed continuous and uniform distribution, so we suggest that comprehensive treatment should be carried out. Obviously, the high levels of COD implied that there were many reducing chemicals in the water and that it may have used a significant quantity of oxygen [45]. Once the organic pollutants with increased COD content enter rivers and lakes, they may be absorbed by the soil under the water if they are not treated in time. These organic compounds accumulate over time and can be toxic to organisms in the water for years [46]. When COD was very high, it may have caused the deterioration of natural water quality because the self-purification of water needs to degrade the organic matter, and the degradation of COD must consume oxygen. The reoxygenation capacity in the water body could not meet the oxygen demand, so DO in the water body may have decreased, and the water body became anaerobic. In the anaerobic state, the organic matter may continue to decompose (anaerobic treatment of microorganisms), and the water body may become black and smelly [47]. As the main limiting factor in natural water bodies, the increase in phosphorus content can promote algae and other phytoplankton to grow in large numbers within a certain range [48,49]. On the one hand, the rapid growth of algae can consume oxygen in the water body [50]. On the other hand, the increase in algae residues may also lead to a rapid increase in COD content in the water body, causing the deterioration of water quality [51]. The fluctuation in temperature may have caused the change in the activity of microorganisms in water, which directly affected the decomposition of COD [52]. In addition, the proportion of C, N, and P in water was not balanced, which led to decreased microbial activity and directly affected the normal decomposition of organic matter for a long time [53]. The fluctuation of DO content in water quality was too large, which directly affected the microbial activity and led to abnormal COD decomposition efficiency, which has been reported in aquamats-oxidation pond [54]
In this study, the levels of TP and COD in all Jiaozuo City rivers consistently increased in the spring, with a significant positive correlation between TP and COD, which was consistent with the findings of Zhong et al. [55]. The concentration of organic carbon in water bodies may have altered the magnitude of COD in water bodies as an indication of the pollution level of organic matter in water bodies [55]. Interestingly, the greatest TP and TOC levels were found in spring rather than summer, presumably due to the fast development of plants such as algae in summer and frequent precipitation increased river flow, which may have diluted TP and TOC in water to some degree. NH4+-N, a rapidly rising water pollutant in recent years [56], may be converted into carcinogenic nitrite, compromising the safety of human water supplies, and can also be converted into ammonia, affecting fish growth and development [57]. The reason why ammonia nitrogen concentration in the water exceeded the threshold was usually due to a lack of dissolved oxygen, which was not favorable to nitrification and interfered with nitrogen removal. Perhaps there were not enough nitrobacteria or the pH of the water swings substantially, reducing the action of nitrifying bacteria in sediment. The study discovered that when the pH was 7.0 or above, the activity of nitrifying bacteria decreased [58]. The current investigation found a significant positive connection between NH4+-N and COD. A relatively high COD concentration may have impeded the activity of anammox bacteria to some degree, resulting in a weakening of the anammox reaction in water, a reduction in ammonium nitrogen removal rate, and, eventually, an increase in ammonium nitrogen content [59]. According to the research, ammonium nitrogen in water was mostly derived from human sewage discharge and industrial wastewater, and organic matter-rich sewage may enhance COD concentration in natural water bodies [60]. Meanwhile, the present findings indicated that TP and TOC are the primary variables influencing COD and NH4+-N.
Moreover, sediment is an important source of water-quality nutrients. The concentrations of TC, TN, and TP in water were positively correlated with the contents of TC, TN, and TP in sediments at the corresponding sampling sites, indicating that sediment nutrition was an important source of nitrogen and phosphorus release in water quality. We discovered that river silt acts as a nitrogen sink in the water environment. It has been shown that the nitrogen in river water was mostly due to sewage caused by human activity. It is worth mentioning that as the river runs through farmland, the quantity of nitrogen fertilizer applied increases the nitrogen content of the river [18,35]. Wheat and maize were the principal crops of Jiaozuo, and farmers typically fertilize in the spring and summer. More rain in the summer caused nitrogen to accumulate in the river. In contrast to the N content, it seems that river silt may serve as a C and P source in the aquatic environment.

5. Conclusions

Overall, the water quality of rivers in Jiaozuo City is not optimistic. A total of 58.3% of the river systems in Jiaozuo met the Class Ⅳ standard, while only 16.7% of the river systems met the more favorable Class Ⅲ standard. During the sampling period, we found that part of the sewage was discharged into the river without treatment, which had a great influence on the water quality. This was exactly consistent with the prediction of water quality distribution by the Ordinary Kriging method. Therefore, Jiaozuo, an industrial city, should implement stricter sewage discharge measures for factories that are upstream and downstream of the river. Additionally, there should be regular monitoring of the water quality of the rivers around the factories. Additionally, the government should build a larger urban sewage treatment plant, optimize urban sewage channels, and regulate the discharge of domestic sewage. At the same time, environmental protection publicity should be carried out to reduce the residents discharging pollutants into rivers. Only in this manner can the water quality of the rivers in Jiaozuo be significantly improved.

Supplementary Materials

The following supporting information can be downloaded at: https://www.mdpi.com/article/10.3390/w15173035/s1, Figure S1: sampling sites; Table S1: The feature information and surrounding environment information of all sites.

Author Contributions

Conceptualization, J.M., S.Q., J.W., Q.L. and Z.H.; methodology, J.M., S.Q., J.W., Q.L. and Z.H.; software, S.W., Z.H. and Y.H.; validation, J.W. and Q.L.; formal analysis, Q.L. and Z.H.; investigation, Q.L., Z.H., S.W. and Y.H.; resources, T.X. and X.B.; data curation, S.W., Z.H. and Y.H.; writing—original draft preparation, Q.L. and Z.H.; writing—review and editing, L.R. and Q.L.; visualization, Q.L. and Z.H.; supervision, J.M., S.Q. and J.W.; project administration, J.M., S.Q. and J.W.; funding acquisition, J.M., S.Q. and J.W. All authors have read and agreed to the published version of the manuscript.

Funding

This research was funded by the Henan Provincial Department of Natural Resources 2020 Annual Financial Natural Resources Scientific Research Project (Financial Procurement through Bidding 2020-165-4), the Youth fund of the Natural Science Foundation of Henan Normal University (2021QK05), and the Youth fund of the Natural Science Foundation of Henan Province (202300410228).

Data Availability Statement

Data can be obtained by contacting us at [email protected].

Acknowledgments

We thank Huixia Dong, Peipei Zhang, and Jiajia Shi from Henan Normal University for samples measurement and collection.

Conflicts of Interest

The authors declare no conflict of interest.

References

  1. Zhang, H.Q.; Cai, X.Y.; Zhang, C.J. An empirical study on the impact of urbanization process on water resources utilization efficiency. Manag. Mod. 2020, 40, 55–58. [Google Scholar]
  2. Wang, J.H.; Huang, H.M.; Jia, H.L.; Zheng, S.X.; Zhao, M.L.; Chen, M.R.; Zhang, X.H.; Zhuang, D. Discussion on the strategies of coastal ecosystem protection and restoration in the Guangdong-Hong Kong-Macao Greater Bay Area. Acta Ecol. Sin. 2020, 40, 8430–8439. (In Chinese) [Google Scholar]
  3. Ghosh, S.; Mujumdar, P.P. Risk minimization in water quality control problems of a river system. Adv. Water Resour. 2006, 29, 458–470. [Google Scholar] [CrossRef]
  4. Ercin, A.E.; Hoekstra, A.Y. Water footprint scenarios for 2050: A global analysis. Environ. Int. 2014, 64, 71–82. [Google Scholar] [CrossRef] [PubMed]
  5. Qin, Y.; Mueller, N.D.; Siebert, S.; Jackson, R.B.; AghaKouchak, A.; Zimmerman, J.B.; Tong, D.; Hong, C.P.; Davis, S.J. Flexibility and intensity of global water use. Nat. Sustain. 2019, 2, 515–523. [Google Scholar] [CrossRef]
  6. Richter, B.D.; Bartak, D.; Caldwell, P.; Davis, K.F.; Debaere, P.; Hoekstra, A.Y.; Li, T.S.; Marston, L.; McManamay, R.; Mekonnen, M.M.; et al. Water scarcity and fish imperilment driven by beef production. Nat. Sustain. 2020, 3, 319–328. [Google Scholar] [CrossRef]
  7. Sotivoldievna, M.G.; Nabijonovich, A.N.; Solievna, A.G. Impact of waste water on the environment. Acad. Int. Multidiscip. Res. J. 2021, 11, 1033–1037. [Google Scholar] [CrossRef]
  8. Islam, N.; Irshad, K. Artificial ecosystem optimization with deep learning enabled water quality prediction and classification model. Chemosphere 2022, 309, 136615. [Google Scholar] [CrossRef]
  9. Chen, S.S.; Kimirei, I.A.; Yu, C.; Shen, Q.S.; Gao, Q. Assessment of urban river water pollution with urbanization in East Africa. Environ. Sci. Pollut. Res. 2022, 29, 40812–40825. [Google Scholar] [CrossRef]
  10. Mesfin, M.M.; Arjen, Y.H. Four billion people facing severe water scarcity. Sci. Adv. 2016, 2, e1500323. [Google Scholar]
  11. Zhang, X.H.; Lin, Z.K. Evaluation of water resource utilization efficiency in provincial areas of China based on the unexpected output SBM model. J. Environ. Public Health 2022, 2022, 9554730. [Google Scholar] [CrossRef] [PubMed]
  12. Wang, X.B.; Wang, Z.L. Research on the impact of environmental regulation on water resources utilization efficiency in China based on the SYS-GMM model. Water Supply 2021, 21, 3643–3656. [Google Scholar] [CrossRef]
  13. Pan, Z.W.; Li, Z.X.; Xu, C.H. Environmental regulation and improvement of regional green water resources efficiency—An empirical analysis based on the Yangtze River economic belt. Surv. World 2020, 11, 2–19. [Google Scholar]
  14. Yang, Y.; Ok, Y.S.; Kim, K.H.; Kwon, E.E.; Tsang, Y.F. Occurrences and removal of pharmaceuticals and personal care products (PPCPs) in drinking water and water/sewage treatment plants: A review. Sci. Total Environ. 2017, 596, 303–320. [Google Scholar] [CrossRef] [PubMed]
  15. Rao, S.M.; Mogili, N.V. New classification method to evaluate pollution levels of sewage contaminated lakes. Sustainability 2021, 13, 3677. [Google Scholar] [CrossRef]
  16. Hader, D.P.; Banaszak, A.T.; Villafane, V.E.; Narvarte, M.A.; Gonzalez, R.A.; Helbling, E.W. Anthropogenic pollution of aquatic ecosystems: Emerging problems with global implications. Sci. Total Environ. 2020, 713, 136586. [Google Scholar] [CrossRef] [PubMed]
  17. Peng, J.F.; Song, Y.H.; Yuan, P.; Cui, X.Y.; Qiu, G.L. The remediation of heavy metals contaminated sediment. J. Hazard. Mater. 2009, 161, 633–640. [Google Scholar] [CrossRef] [PubMed]
  18. Yu, C.Q.; Huang, X.; Chen, H.; Godfray, H.C.J.; Wright, J.S.; Hall, J.W.; Gong, P.; Ni, S.Q.; Qiao, S.C.; Huang, G.R.; et al. Managing nitrogen to restore water quality in China. Nature 2019, 567, 516–520. [Google Scholar] [CrossRef]
  19. Samuela, F.; Christina, W.T. Assessment of uncertainty sources in water quality modeling in the Niagara River. Adv. Water Resour. 2010, 33, 493–503. [Google Scholar]
  20. Ismail, N.S.; Dodd, H.; Sassoubre, L.M.; Horne, A.J.; Boehm, A.B.; Luthy, R.G. Improvement of urban lake water quality by removal of Escherichia coli through the action of the bivalve Anodonta californiensis. Environ. Sci. Technol. 2015, 49, 1664–1672. [Google Scholar] [CrossRef]
  21. Shang, H.L.; Xu, R.F.; Xiao, Y.X. Water quality evaluation of Duyun-Kaili section in the upper reaches of the Qingshui river basin. J. Landsc. Res. 2018, 10, 86–89. [Google Scholar]
  22. Pan, W.Y.; Wang, F.; Jiao, Z. Temporal variation and water quality assessment of Xiaoqing River catchment. IOP Conf. Ser. Earth Environ. Sci. 2021, 791, 012172. [Google Scholar] [CrossRef]
  23. Xu, S.G.; Cui, Y.X.; Yang, C.X.; Wei, S.J.; Dong, W.P.; Huang, L.H.; Liu, C.Q.; Ren, Z.M.; Wang, W.L. The fuzzy comprehensive evaluation (FCE) and the principal component analysis (PCA) model simulation and its applications in water quality assessment of Nansi Lake Basin, China. Environ. Eng. Res. 2021, 26, 222–232. [Google Scholar] [CrossRef]
  24. Bi, Y.L.; Wang, H.C.; Xi, A.B.; Jiang, S.S.; Wu, W.Y.; Li, Z.L.; Li, S.M.; Su, H.; Bai, Z.H.; Xu, S.J.; et al. Pollution characterization and comprehensive water quality assessment of rain-source river: A case study of the Longgang river in Shenzhen. Search Life Sci. Lit. 2022, 43, 782–794. [Google Scholar]
  25. Ouyang, L.L.; Shi, Y.R.; Yang, J.Q.; Mao, S.J.; Yuan, Q.; Wang, Y.L. Water quality assessment and pollution source analysis of Yaojiang River Basin: A case study of inland rivers in Yuyao City, China. Water Supply 2022, 22, 674–685. [Google Scholar] [CrossRef]
  26. GB 3838-2002; State Environmental Protection Administration. Surface Water Environmental Quality Standards. China Environmental Science Press: Beijing, China, 2002.
  27. Wang, T.F.; Zhang, W.J.; Liao, G.Y.; Zhang, M.Y.; Li, Q.L.; Wang, D.S. Occurrence and influencing factors of antibiotics and antibiotic resistance genes in sediments of the largest multi-habitat lakes in Northern China. Environ. Geochem. Health 2022, 45, 2567–2578. [Google Scholar] [CrossRef] [PubMed]
  28. Ding, X.Q. Application of Improved Nemerow index method for evaluation of environmental quality of waterhead area of public drinking water supply. Sichuan Environ. 2010, 29, 47–51. [Google Scholar]
  29. McAvoy, D.C.; Masscheleyn, P.; Peng, C.; Morrall, S.W.; Casilla, A.B.; Lim, J.M.U.; Gregorio, E.G. Risk assessment approach for untreated wastewater using the QUAL2E water quality model. Chemosphere 2003, 52, 55–66. [Google Scholar] [CrossRef]
  30. Ghermandi, A.; van den Bergh, J.C.J.M.; Brander, L.M.; de Groot, H.L.F.; Nunes, P.A.L.D. Values of natural and human-made wetlands: A meta-analysis. Water Resour. Res. 2010, 46, W12516. [Google Scholar] [CrossRef]
  31. Han, F.; Zheng, Y. Multiple-response Bayesian calibration of watershed water quality models with significant input and model structure errors. Adv. Water Resour. 2016, 88, 109–123. [Google Scholar] [CrossRef]
  32. Song, S.Q. Water quality model structure identification using dynamic linear modeling: River cam case study revisited. Water Sci. Technol. 1997, 36, 27–34. [Google Scholar]
  33. Petty, J.D.; Jones, S.B.; Huckins, J.N.; Cranor, W.L.; Parris, J.T.; McTague, T.B.; Boyle, T.P. An approach for assessment of water quality using semipermeable membrane devices (SPMDs) and bioindicator tests. Chemosphere 2000, 41, 311–321. [Google Scholar] [CrossRef] [PubMed]
  34. Aaguilera, P.; Garridofrenich, A.; Torres, J.A. Application of the kohonen neural network in coastal water management: Methodological development for the assessment and prediction of water quality. Water Res. 2001, 35, 4053–4062. [Google Scholar] [CrossRef] [PubMed]
  35. Karandish, F.; Hoekstra, A.Y.; Hogeboom, R.J. Groundwater saving and quality improvement by reducing water footprints of crops to benchmarks levels. Adv. Water Resour. 2018, 121, 480–491. [Google Scholar] [CrossRef]
  36. Wang, Y.; Lu, S.G.; Liu, J.J.; Shi, W.Q.; Guo, Y.M. Spatial distribution characteristics of the physical and chemical properties of water in the Heihe river during low water periods in spring. J. Ecol. Rural. Environ. 2019, 35, 433–441. [Google Scholar]
  37. Zhao, X.; Xue, X.S.; Xu, S.; Xu, S.L.; Xu, Y.J. Scenario simulation of water environment improvement for plain river network of Changzhou. Chin. J. Environ. Eng. 2015, 9, 4637–4642. [Google Scholar]
  38. Wen, M.L.; Yang, L.; Fang, G.X.; Zhou, X.; Zhang, H.O. Spatio-temporal variation of nitrogen and phosphorus pollution in upriver water course of the Xinfengjiang reservoir in Guangdong province. Trop. Geogr. 2015, 35, 103–110. [Google Scholar]
  39. Guo, T.; Huang, X.S. Governance and improvement of drinking water source protection zones from the perspective of inclusive development. China Popul. Resour. Environ. 2020, 30, 167–176. [Google Scholar]
  40. Sun, Y.H. Research on the spatial and temporal pattern evolution and driving factors of gray water footprint in Yangtze River economic belt. J. Lanzhou Univ. Financ. Econ. 2020, 38, 1–15. [Google Scholar]
  41. Yang, T.T.; Yang, Z.J.; Liu, D.F. Seasonal distribution of Chlorophyll-a in Xiangxi Bay of three gorges reservoirand relationship to environment factors. J. Hydroecol. 2018, 38, 14–21. [Google Scholar]
  42. Patthamawan, K.; Keisuke, T.; Wu, X.Z. Real-time monitoring of dissolved oxygen at a vicinity of an aquatic plant. IOP Conf. Ser. Mater. Sci. Eng. 2019, 639, 012045. [Google Scholar] [CrossRef]
  43. Han, Z.C.; Li, H.P. Nitrogen budget balance characteristics of main landuse types in Qiandao lake Basin. Environ. Pollut. Control 2022, 44, 682–686. [Google Scholar]
  44. Dai, M.H.; Guo, X.H.; Zhai, W.D.; Yuan, L.Y.; Wang, B.W.; Wang, L.F.; Cai, P.H.; Tang, T.T.; Cai, W.J. Oxygen depletion in the upper reach of the Pearl River estuary during a winter drought. Mar. Chem. 2006, 102, 159–169. [Google Scholar] [CrossRef]
  45. Wang, Z.H. Determine COD by Spectrophotometry. Environ. Prot. Sci. 2003, 2, 43–44. [Google Scholar]
  46. Yu, Y.; Wang, X.H.; Wen, Y.; Zhao, Y.H. Study on the toxicity of organic pollutants to seven aquatic organisms based on Abraham model. Environ. Chem. 2015, 34, 23–36. [Google Scholar]
  47. Degetto, S.; Cantaluppi, C.; Schintu, M. Critical analysis of radiochemical methodologies for the assessment of sediment pollution and dynamics in the lagoon of Venice (Italy). Environ. Int. 2005, 31, 1023–1030. [Google Scholar] [CrossRef] [PubMed]
  48. Qin, B.Q.; Song, Y.Z.; Gao, G. The role of periphytes in the shift between macrophyte and phytoplankton dominated systems in a shallow, eutrophic lake (Lake Taihu, China). Sci. China Ser. C Life Sci. 2006, 49, 597–602. [Google Scholar] [CrossRef] [PubMed]
  49. Jin, Z.X.; Wang, J.F.; Jiang, S.H.; Yang, J.J.; Qiu, S.R.; Chen, J.A. Fuel from within: Can suspended phosphorus maintain algal blooms in Lake Dianchi. Environ. Pollut. 2022, 311, 119964. [Google Scholar] [CrossRef]
  50. Doug, W.; Darius, M. Innovative hypoxia measurement. Sea Technol. 2021, 62, 8–13. [Google Scholar]
  51. He, J.; Zhang, Y.; Wu, X.; Yang, Y.; Xu, X.M.; Zheng, B.H.; Deng, W.M.; Shao, Z.; Lu, L.; Wang, L.; et al. A study on the relationship between metabolism of Cyanobacteria and chemical oxygen demand in Dianchi Lake, China. Water Environ. Res. 2019, 91, 1650–1660. [Google Scholar] [CrossRef]
  52. Zhu, J.; Li, H.D.; Wang, P. The impact of environmental factors on COD, TN, TP release from sediment. Technol. Water Treat. 2009, 35, 44–49. [Google Scholar]
  53. Wang, S.T.; Hu, X.G.; Yu, F.B.; Qin, S.Y. Microbe regulates the mineral photochemical activity and organic matter compositions in water. Water Res. 2022, 225, 119164. [Google Scholar] [CrossRef] [PubMed]
  54. Zhao, Z.G.; Zhang, Y.X.; Li, Z.Y.; Li, W.Y. Pilot-scale research on treatment of micro-polluted river water by Aquamats-oxidation pond. Chin. J. Environ. Eng. 2004, 8, 2833–2836. [Google Scholar]
  55. Zhong, Y.M. Study on correlation of total phosphorus, ammonia nitrogen and chemical oxygen demand in surface water. J. Green Sci. Technol. 2020, 63–66. (In Chinese) [Google Scholar] [CrossRef]
  56. Huang, Y.W.; Du, Y. Source and enrichment of ammonium in shallow confined aquifer in the west of Dongting Plain. Bull. Geol. Sci. Technol. 2020, 39, 165–174. [Google Scholar]
  57. Du, Y.; Ma, T.; Deng, Y.M.; Shen, S.; Lu, Z.J. Sources and fate of high levels of ammonium in surface water and shallow groundwater of the Jianghan Plain, Central China. Environ. Sci. Process. Impacts 2017, 19, 161–172. [Google Scholar] [CrossRef] [PubMed]
  58. Du, H.T.; Xu, R.; Xu, H.; Shi, W.Q.; Deng, H.Y.; He, J.L.; Zhu, L. Ammonia nitrogen removal by nitrifying bacteria from different habitats. J. Environ. Eng. Technol. 2022, 12, 81–91. [Google Scholar] [CrossRef]
  59. Ni, S.Q.; Ni, J.Y.; Hu, D.L.; Sung, S.W. Effect of organic matter on the performance of granular anammox process. Bioresour. Technol. 2012, 110, 701–705. [Google Scholar] [CrossRef]
  60. Xu, H.; Liu, Z.P.; Jiao, J.G.; Yang, L.Z. Nitrogen pollution status of various types of passing by water bodies in upper reaches of Taihu Lake. Chin. J. Ecol. 2008, 27, 43–49. [Google Scholar]
Figure 1. The setting of detection section. (The SY represent the each detection sections).
Water 15 03035 g001
Figure 2. The physical and chemical indexes of river water in Jiaozuo city ((AL) show the values of TC, TN, TP, TOC, NH4+-N, NO3--N, Chl-a, COD, WT, DO, pH and EC in river water respectively. AQ: Anquan River system; DS: Dasha River system; DLS: Dashilao River system; D: Dan River system; Y: Yellow River system; JG: Jianggou River system; M: Mang River system; Q: Qin River system; RY: Rongyou River system; W: Wei River system; X: Xin River system; XM: Xinmang River system).
Water 15 03035 g002
Figure 3. The physical and chemical indexes of water quality in different watersheds in four seasons (H: Haihe River Basin; Y: Yellow River system. Additionally, (A), (B), (C), (D), (E), (F), (G), (H), (I), (J), (K), and (L) represent the TC, TN, TP, TOC, NH4+-N, NO3-N, Chl-a, COD, WT, DO, pH, and EC content in the water, respectively).
Water 15 03035 g003
Figure 4. The changes in indicator when rivers flow through urban centers or human settlements (A): TN content; (B): TP content; (C): NH4+-N content; (D): COD content. In addition, the ** indicates that there is a very significant difference between different regions).
Water 15 03035 g004
Figure 5. C, N, and P content in sediment and river. (AD) represent the TC, TN, TP, and C/N content of the river sediment and water. (* represents that there is a significant difference in sediment or river water between different points).
Water 15 03035 g005
Figure 6. Analysis of the correlation between the concentrations of TC, TN, and TP in water and the contents of TC, TN, and TP in sediments at corresponding sampling sites. (A): TC content; (B): TN content; (C): TP content).
Water 15 03035 g006
Figure 7. Person correlation analysis of physical and chemical indicators of the Jiaozuo River in different seasons ((A): spring; (B): summer; (C): autumn; (D): winter).
Water 15 03035 g007
Figure 8. Principal component analysis for COD index (A) and NH4+-N index (B).
Water 15 03035 g008
Figure 9. Distribution prediction of main river water quality indexes via the ordinary Kriging method: river water temperature (A); dissolved oxygen (B); total nitrogen (C); total phosphorus (D); ammonia nitrogen (E); chemical oxygen demand (F) in Jiaozuo.
Water 15 03035 g009
Table 1. Basic item analysis method of surface water environmental quality standard.
Monitoring IndexUnitAnalytical MethodLimit of Detection (mg/L)Method Source
Chl-amg/LEthanol extraction spectrophotometry--
TOCmg/LCombustion oxidation non-dispersive infrared absorption method0.5GB 13193-91
CODmg/LDichromate titration10GB 11914-89
TNmg/LUltraviolet spectrophotometry for potassium persulfate digestion0.05GB 11894-89
NH4+-Nmg/LNasi reagent colorimetry0.05GB 7479-87
NO3-Nmg/LPhenol disulfonic acid photometry0.02GB 7480-87
TPmg/LAmmonium molybdate spectrophotometry0.01GB 11893-89
Table 2. Basic project standard limit of river water environmental quality standard (unit: mg/L).
Classification of Standard Value
Items
WT (℃)The change in WT that is made by human should be limited in; Maximum temperature rise in one week ≤ 1;
Maximum temperature decline in one week ≤ 2
pH6–9
DO7.56532
COD1515203040
NH4+-N0.150.51.01.52.0
TP0.020.10.20.30.4
TN0.20.51.01.52.0
Table 3. The water quality assessment results in the whole year (H: Haihe River system; Y: the Yellow River system. DS: Dasha River system; DSL: Dashilao River system; JG: Jianggou River system; W: Wei River system; X: Xin River system; Y: Yellow River system; XM: Xinmang River system; M: Mang River system; Q: Qin River system; AQ: Anquan River system; RY: Rongyou River system; D: Dan River system; U: upstream; M: midstream; DN: downstream; for example, DS-U means the upper reaches of the Dasha River system).
BasinP’Improved Nemero Pollution Index EvaluationSingle-Factor EvaluationSections of River SystemP’Improved Nemero Pollution Index EvaluationRiver SystemP’Improved Nemero Pollution Index EvaluationWorst IndexSingle-Factor Evaluation
H1.471DS-U4.500D2.011TN, COD
DS-M1.144
DS-DN1.027
DSL-U0.722DSL0.775TN
DSL-M0.735
DSL-DN0.920
JG-U- JG1.212TN, COD
JG-M1.259
JG-DN1.188
W-U0.752W1.021TN
W-M1.206
W-DN1.085
X-U7.703X2.337TN
X-M0.806
X-DN0.850
Y1.370Y-U- Y1.239TN, COD
Y-M-
Y-DN1.239
XM-U1.569XM1.384TN
XM-M1.434
XM-DN1.097
M-U0.706M2.246TN
M-M1.822
M-DN4.895
Q-U2.063Q1.510TN
Q-M1.307
Q-DN1.176
AQ-U1.289AQ1.289TN
AQ-M-
AQ-DN-
RY-U- RY0.852TN
RY-M0.884
RY-DN0.789
D-U1.067D1.067TNV
D-M-
D-DN-
Table 4. The water quality assessment results of the improved Nemero pollution index in different reason. (H: Haihe River system; Y: the Yellow River system. DS: Dasha River system; DSLS: Dashilao River system; JG: Jianggou River system; W: Wei River system; X: Xin River system; Y: Yellow River system; XM: Xinmang River system; M: Mang River system; Q: Qin River system; AQ: Anquan River system; RY: Rongyou River system; D: Dan River system).
River SystemSeason
SpringSumerAutumnWinter
P’Improved Nemero Pollution Index EvaluationP’Improved Nemero Pollution Index EvaluationP’Improved Nemero Pollution Index EvaluationP’Improved Nemero Pollution Index Evaluation
DS2.071.932.132.21
DSL2.001.782.322.44
JG2.271.741.692.14
W1.972.192.102.36
X0.44------
Y2.591.631.711.82
XM3.352.362.592.39
M2.372.182.312.62
Q2.101.832.012.02
AQ2.152.122.17--
RY2.411.753.242.48
D--1.641.28--
Disclaimer/Publisher’s Note: The statements, opinions and data contained in all publications are solely those of the individual author(s) and contributor(s) and not of MDPI and/or the editor(s). MDPI and/or the editor(s) disclaim responsibility for any injury to people or property resulting from any ideas, methods, instructions or products referred to in the content.

