Article

HPLC-Based Detection of Two Distinct Red Tide Causative Species (Mesodinium rubrum and Margalefidinium polykrikoides) in the South Sea of Korea

1
Department of Oceanography and Marine Research Institute, Pusan National University, Busan 46241, Republic of Korea
2
South Sea Fisheries Research Institute, National Institute of Fisheries Science, Yeosu 59780, Republic of Korea
3
Library of Marine Samples, Korea Institute of Ocean Science & Technology, Geoje 53201, Republic of Korea
4
Department of Civil and Environmental Engineering, Pusan National University, Busan 46241, Republic of Korea
5
Oceanic Climate and Ecology Research Division, National Institute of Fisheries Science, Busan 46083, Republic of Korea
6
Ecological Engineering Institute Co., Ltd., Busan 48058, Republic of Korea
7
Horn Point Laboratory, Center for Environmental Science, University of Maryland, Cambridge, MD 21613, USA
*
Author to whom correspondence should be addressed.
Water 2023, 15(17), 3050; https://doi.org/10.3390/w15173050
Submission received: 21 July 2023 / Revised: 23 August 2023 / Accepted: 23 August 2023 / Published: 25 August 2023
(This article belongs to the Special Issue Harmful Algae Control)

Abstract

:
Various approaches have been applied to red tide monitoring in Korea since reliable information on phytoplankton communities is crucial. In this study, we employed a high-performance liquid chromatography (HPLC) method to analyze two types of red tide, Mesodinium rubrum and Margalefidinium polykrikoides (also known as Cochlodinium polykrikoides), along the southern coasts of Korea. During the M. rubrum red tide on 8 August 2022, an unusual dominance of cryptophytes was observed, being the most dominant phytoplankton group. A significant positive correlation was found between alloxanthin concentrations, a marker pigment of cryptophytes, and M. rubrum cell numbers (p < 0.01, r = 0.830), indicating that HPLC-derived alloxanthin concentrations can serve as a valuable indicator for identifying red tides caused by M. rubrum and estimating cell numbers. However, it is crucial to consider the temporal dynamics of the prey–predator relationship between cryptophytes and M. rubrum. Further investigation is required to understand the environmental conditions that promote cryptophyte predominance and their role in M. rubrum red tide development. In the second field campaign on 29 August 2022, we observed a significant correlation between the concentration of peridinin, a marker pigment for dinoflagellates, and M. polykrikoides cell numbers (p < 0.01, r = 0.663), suggesting that peridinin can serve as a reliable indicator of M. polykrikoides red tides. In conclusion, HPLC-derived pigments, namely alloxanthin and peridinin, can be used to effectively monitor red tides caused by M. rubrum and M. polykrikoides, respectively. However, to overcome certain methodological limitations of HPLC, future studies should explore additional markers or analytical techniques capable of differentiating M. polykrikoides from other coexisting dinoflagellate species. Furthermore, the broad applicability of our method requires thorough investigation in diverse ecosystems to fully comprehend its scope and limitations. Future research should focus on evaluating the method’s efficacy in different contexts, accounting for the distinct traits of the ecosystems under consideration.

1. Introduction

Red tides in Korea have been a recurring issue along the south coast, often leading to significant damage to aquaculture industries [1,2,3]. These events predominantly occur during the summer period (June to September), with warm water temperatures accounting for approximately 80% of red tide occurrences in Korea between 1981 and 2020 [4,5,6]. Since the establishment of the first governmental monitoring programs in 1972, a nationwide monitoring network has been in place to monitor red tides in Korea [4]. Over the last five decades, there has been a significant shift in the prevalence of red tide causative species in Korean coastal waters [3,4,7,8,9]. In the 1970s–1980s, the diatom Skeletonema costatum was prominent, while in the 1990s–2010s, the mixotrophic dinoflagellate Margalefidinium polykrikoides (also known as Cochlodinium polykrikoides) became dominant [4,7]. M. polykrikoides has emerged as the most frequently observed red tide species, accounting for up to 38% of all red tide events during the period from 2011 to 2018 since its initial detection in the Narodo–Yeosu area in 1995 [3,4,8,9]. Consistently, its global occurrence and intensity have been increasing in recent years [10,11]. The most intense M. polykrikoides blooms in the southern coastal waters adjacent to the cities of Geoje and Yeosu in Korea, where M. polykrikoides has been introduced, have caused large-scale damage to aquaculture, resulting in annual economic losses ranging from USD 4 to 18.6 million in the Korean aquaculture industry since the 2000s [12,13,14]. Previous studies have indicated that the formation and extinction of thermohaline fronts, typhoon activity, the intrusion of outer seawater, the transport of favorable seawater by the Tsushima Warm Current, and factors such as water temperature, insolation, and precipitation play important roles in the outbreaks of M. polykrikoides blooms near the Narodo Islands ([15] and references therein).
Among the various red tide species in Korean coastal areas, Mesodinium rubrum Lohmann 1908, a species of Ciliophora, was first identified on the Myungji coast of the Nakdong River estuary in 1982 [4,16]. According to the Red Tide Monitoring Dataset of NFRDI in Korea, M. rubrum accounted for only 3% of all red tide events, with approximately 40 occurrences in Korean coastal waters over the last four decades from 1972 to 2011 [4,16]. More recently, from 2011 to 2018, the occurrences of M. rubrum increased slightly, accounting for approximately 7% of all red tide events, with around 17 recorded occurrences [3]. M. rubrum is a cosmopolitan and non-toxic red tide ciliate found in various estuaries and coastal upwelling regions, and its massive blooms can potentially pose a threat to aquaculture industries [16]. Previous studies highlighted M. rubrum’s recurrent bloom occurrences along the Korean coast and historical events with high cell concentrations, such as the extreme hypoxia and subsequent mass mortality of metazoan plankton and shellfish; the importance of M. rubrum as a linking ciliate in marine ecosystems due to its diverse trophic modes and ability to sequester prey plastids; and the ecophysiological characteristics of M. rubrum, including its oral apparatus, life cycle, primary productivity, and potential as a live feed for culturable marine animals ([16] and references therein).
Traditional microscopic identification methods for phytoplankton species compositions require a high level of taxonomic expertise and considerable time and may have limited sensitivity, particularly for detecting species in low abundance [14,17,18], although they can provide specific information. In recent years, modern approaches, such as molecular methods and high-performance liquid chromatography (HPLC), have been utilized for red tide detection in Korea [14,19,20]. The authors of [14,20] utilized qPCR and metabarcoding analysis to detect M. polykrikoides blooms in southern Korean waters, confirming their early warning potential and identifying taxa associated with the blooms while observing consistent microbial community functions in all southern Korean coastal waters during harmful M. polykrikoides algal blooms. Furthermore, the algorithm developed by [19] for the geostationary ocean color imager (GOCI) successfully estimated the hourly chlorophyll a (chl-a) concentration of M. polykrikoides and demonstrated a strong performance in the East Sea areas with low total suspended particle concentrations, but further modifications are needed to account for the optical environments and shallow water depths influenced by high suspended particle concentrations, particularly in the coastal areas of southern Korea.
HPLC allows for precise quantification of various photosynthetic pigments and phytoplankton species compositions [18,19,21], offering advantages over traditional microscopic methods by enabling the detection and quantification of small and fragile phytoplankton species in a single operation, including prymnesiophytes and cryptomonads [17,18,21,22].
In this study, we applied HPLC and microscopic approaches to detect red tide causative species and other phytoplankton species during two different types of red tide, aiming to investigate the potential of HPLC application in red tide studies.

2. Materials and Methods

2.1. Study Site and Water Sampling

This study was conducted on two occasions in the east of Geumodo and south of Nangdo in Yeosu, Jeollanam-do, Korea, where red tides occurred on 8 August and 29 August 2022 (Figure 1). Surface seawater samples were collected for pigment compositions and enumeration of phytoplankton from 16 and 20 stations on 8 August and 29 August 2022, respectively (Table 1). Seawater samples (500–1000 mL) were immediately fixed with Lugol’s iodine to preserve phytoplankton for microscopic identification. For pigment analysis, water samples (60–300 mL) were filtered through a 47 mm glass fiber filter (0.7 μm GF/F), immediately frozen in liquid nitrogen, and transported to the laboratory for analysis.

2.2. HPLC Pigment and CHEMTAX Analysis

The pigments of phytoplankton in the filtered samples were extracted using 5 mL of 100% acetone at 4 °C for 24 h to prevent degradation. To correct for any sample loss during extraction, 100 μL of canthaxanthin was added as an internal standard (IS) [23,24]. The samples were sonicated for 1 min before analysis, and suspended particles were removed using a syringe filter with a pore size of 0.2 μm (Polytetrafluoroethylene; PTFE, Hydrophobic, Advantec, Tokyo, Japan). The filtered samples were then centrifuged at 3500 rpm for 10 min. Aliquots (1 mL) of the extract were mixed with 0.3 mL of distilled water and analyzed using an HPLC system (Agilent 1260 HPLC system, Agilent Technologies, Santa Carla, CA, USA) within 48 h of extraction to minimize pigment losses [23,25]. The HPLC analysis followed a well-established method, with minor modifications based on the study of [26]. Pigment separations were carried out using a Zobrax Eclipse XDB C8 column (250 × 4.6 mm, 5 µm). The mobile phase consisted of two eluents: eluent A, which was a mixture of methanol, acetonitrile, and an aqueous pyridine solution (0.25 M pyridine) in a ratio of 50:25:25 v:v:v, and eluent B, which was a mixture of methanol, acetonitrile, and acetone in a ratio of 20:60:20 v:v:v. The separation was performed using a binary linear gradient, initiated with 100% eluent A, followed by a gradient of 60% eluent A and 40% eluent B for 20 min. This was subsequently followed by a step-wise gradient of 5% eluent A and 95% eluent B for 25 min, with another step of 5% eluent A and 95% eluent B for 37 min, before finally returning to 100% eluent A at 45 min. Throughout the analysis, the flow rate was consistently maintained at 1.0 mL/min, except during the 25- and 37-min intervals, where it was adjusted to 0.8 mL/min. Analysis was performed by injecting 100 µL of the sample. Qualitative and quantitative analyses were performed using standards from DHI Inc. (Hørsholm, Denmark), which included chlorophyll c2, peridinin, 19′-butanoyloxy-fucoxanthin, fucoxanthin, 19′-hexanoyloxy-fucoxanthin, neoxanthin, prasinoxanthin, violaxanthin, alloxanthin, lutein, zeaxanthin, chlorophyll b, diatoxanthin, diadinoxanthin, β-carotene, and chlorophyll a (chl-a). The pigment concentrations in the samples were determined using the following equation. The standard response factor (Rf) was calculated by dividing the concentration of the standard pigment by the measured peak area [27].
Concentration = Area × Rf × (Ve/Vs) [ngL−1]
  • Area = area of the peak in the sample [area];
  • Rf = standard response factor [ngL−1 area−1];
  • Ve = AIS/(peak area of IS added to sample) × (volume of IS added to sample) [L];
  • Vs = volume of filtered water sample [L];
  • AIS = peak area of IS when 1 mL IS is mixed with 300 μL of H2O;
  • IS = internal standard.
To estimate the phytoplankton composition, we employed the CHEMTAX program based on the method developed by [28,29,30]. The initial pigment-to-chl-a ratio was determined based on [27], which used various algae groups collected around the Korean Peninsula.

2.3. Phytoplankton Identification and Enumeration

To identify and enumerate phytoplankton, the fixed sample was allowed to settle for 24 h, after which it was initially concentrated down to 200 mL using the siphon principle. Subsequently, an additional 24 h sedimentation period was employed, and the sample was further concentrated down to a final volume of 20 mL using the same siphon principle. The concentrated samples were then carefully stored in a dark environment to prevent degradation before being analyzed under a microscope to determine the abundance and composition of the phytoplankton. The identification and counting methodology followed the method outlined by [31].

2.4. Suspended Particulate Matter

Suspended particulate matter (SPM) was measured following the method of [32]. Subsamples (150–300 mL) of seawater were filtered through pre-combusted and weighed GF/F filters (pore size 0.7 μm). The filters were then dried at 75 °C for 24 h to remove the water content. The amount of SPM was calculated by dividing the difference in weight before and after filtration by the volume of the filtered water sample.

3. Results

3.1. Environmental Conditions

The water depths in this study were shallow, ranging from approximately 25 to 30 m on 8 August 2022 and from approximately 12 to 16 m on 29 August 2022 (Table 1). The surface water temperature ranged from 26.7 to 27.2 °C on 8 August 2022 and from 23.1 to 24.1 °C on 29 August 2022, with very low spatial variation observed within each field campaign. In contrast, the spatial variation in the SPM concentration was relatively larger. The SPM concentrations ranged from approximately 4.1 to 36.0 g m−3 on 8 August 2022 and from approximately 4.2 to 25.9 g m−3 on 29 August 2022.

3.2. Plankton Assemblage by Microscopic Observation

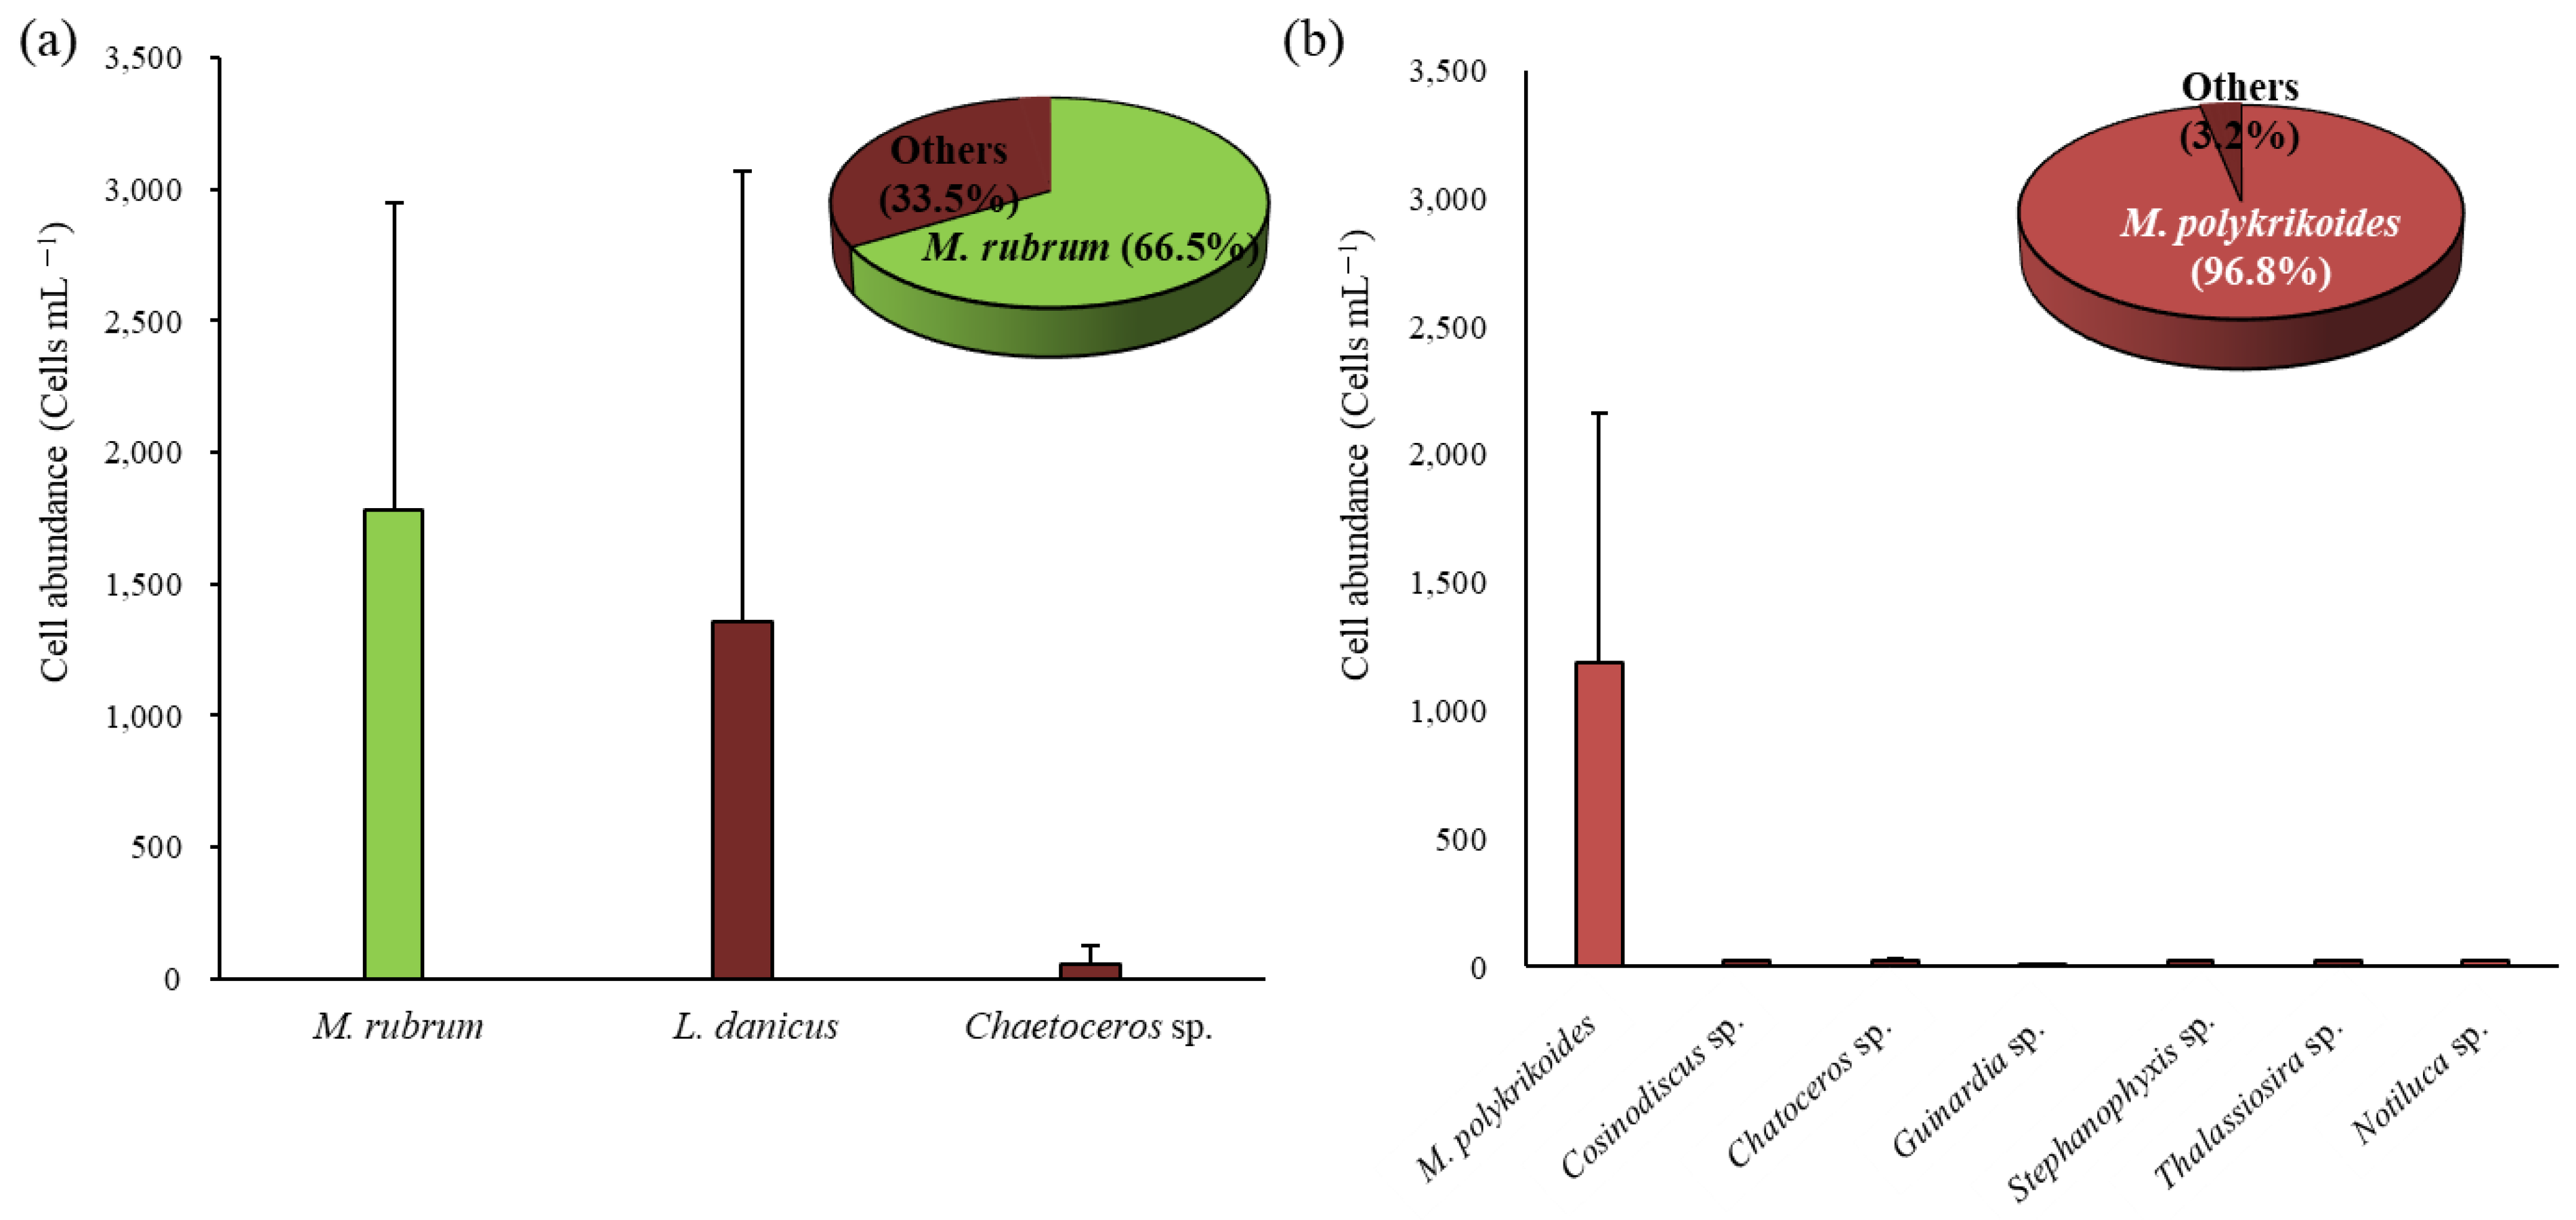
A total of nine species were microscopically identified during the study period (Figure 2a). These species belonged to two phytoplankton groups (diatoms and dinoflagellates) and ciliates. On 8 August 2022, the phytoplankton community mainly consisted of M. rubrum, with concentrations ranging from 1.90 × 10² to 4.69 × 10³ cells mL−1. The highest abundance of M. rubrum was found at station A5-2, and its distribution appeared in patches. The second most abundant species was Leptocylindrus danicus, with an average concentration of 1.35 × 10³ cells mL−1, accounting for approximately 31.1% of the total observed plankton. On 29 August 2022, the red tide was caused by a bloom of M. polykrikoides, which dominated all the stations (Table 1; Figure 2b). The density of M. polykrikoides ranged from 3.60 × 101 cells mL−1 to 3.21 × 10³ cells mL−1, with the highest abundances observed at station Y12. Diatoms (Chaetoceros sp., Coscinodiscus sp., and Stephanopyxis sp.) were also present but at much lower abundances (5.3, 2.0, and 1.3 cells mL−1, respectively).

3.3. HPLC Pigment and CHEMTAX Results

The average chl-a concentrations during the study periods on 8 August and 29 August 2022 were 44.1 ± 31.7 and 49.9 ± 55.4 μg L−1, respectively. The highest chl-a concentrations of 130.54 and 197.6 μg L−1 were observed at stations A5-2 and Y14, respectively (Figure 3). Alloxanthin (a marker pigment of cryptophytes) and peridinin (a marker pigment of dinoflagellates) concentrations were significantly higher (11.4 ± 7.9 and 30.8 ± 32.4 μg L−1, respectively) compared to the concentrations of other pigments in each investigation. The highest alloxanthin and peridinin concentrations (31.95 and 108.7 μg L−1) were observed at stations A5-2 and Y14, respectively.
The relative contribution of different phytoplankton groups to chl-a, as calculated using CHEMTAX, is displayed in Figure 3. On 8 August 2022, cryptophytes were the dominant group, accounting for 76.7–95.3% of total chl-a. Diatoms also contributed an average of 6.8%, appearing as a subdominant community. On 29 August 2022, dinoflagellates were the most dominant community at all stations, with an average contribution of 90.7 ± 7.8% of the total phytoplankton community. Cryptophytes and diatoms were also present but with much lower contributions (3.1 ± 3.5% and 3.0 ± 2.5%, respectively).
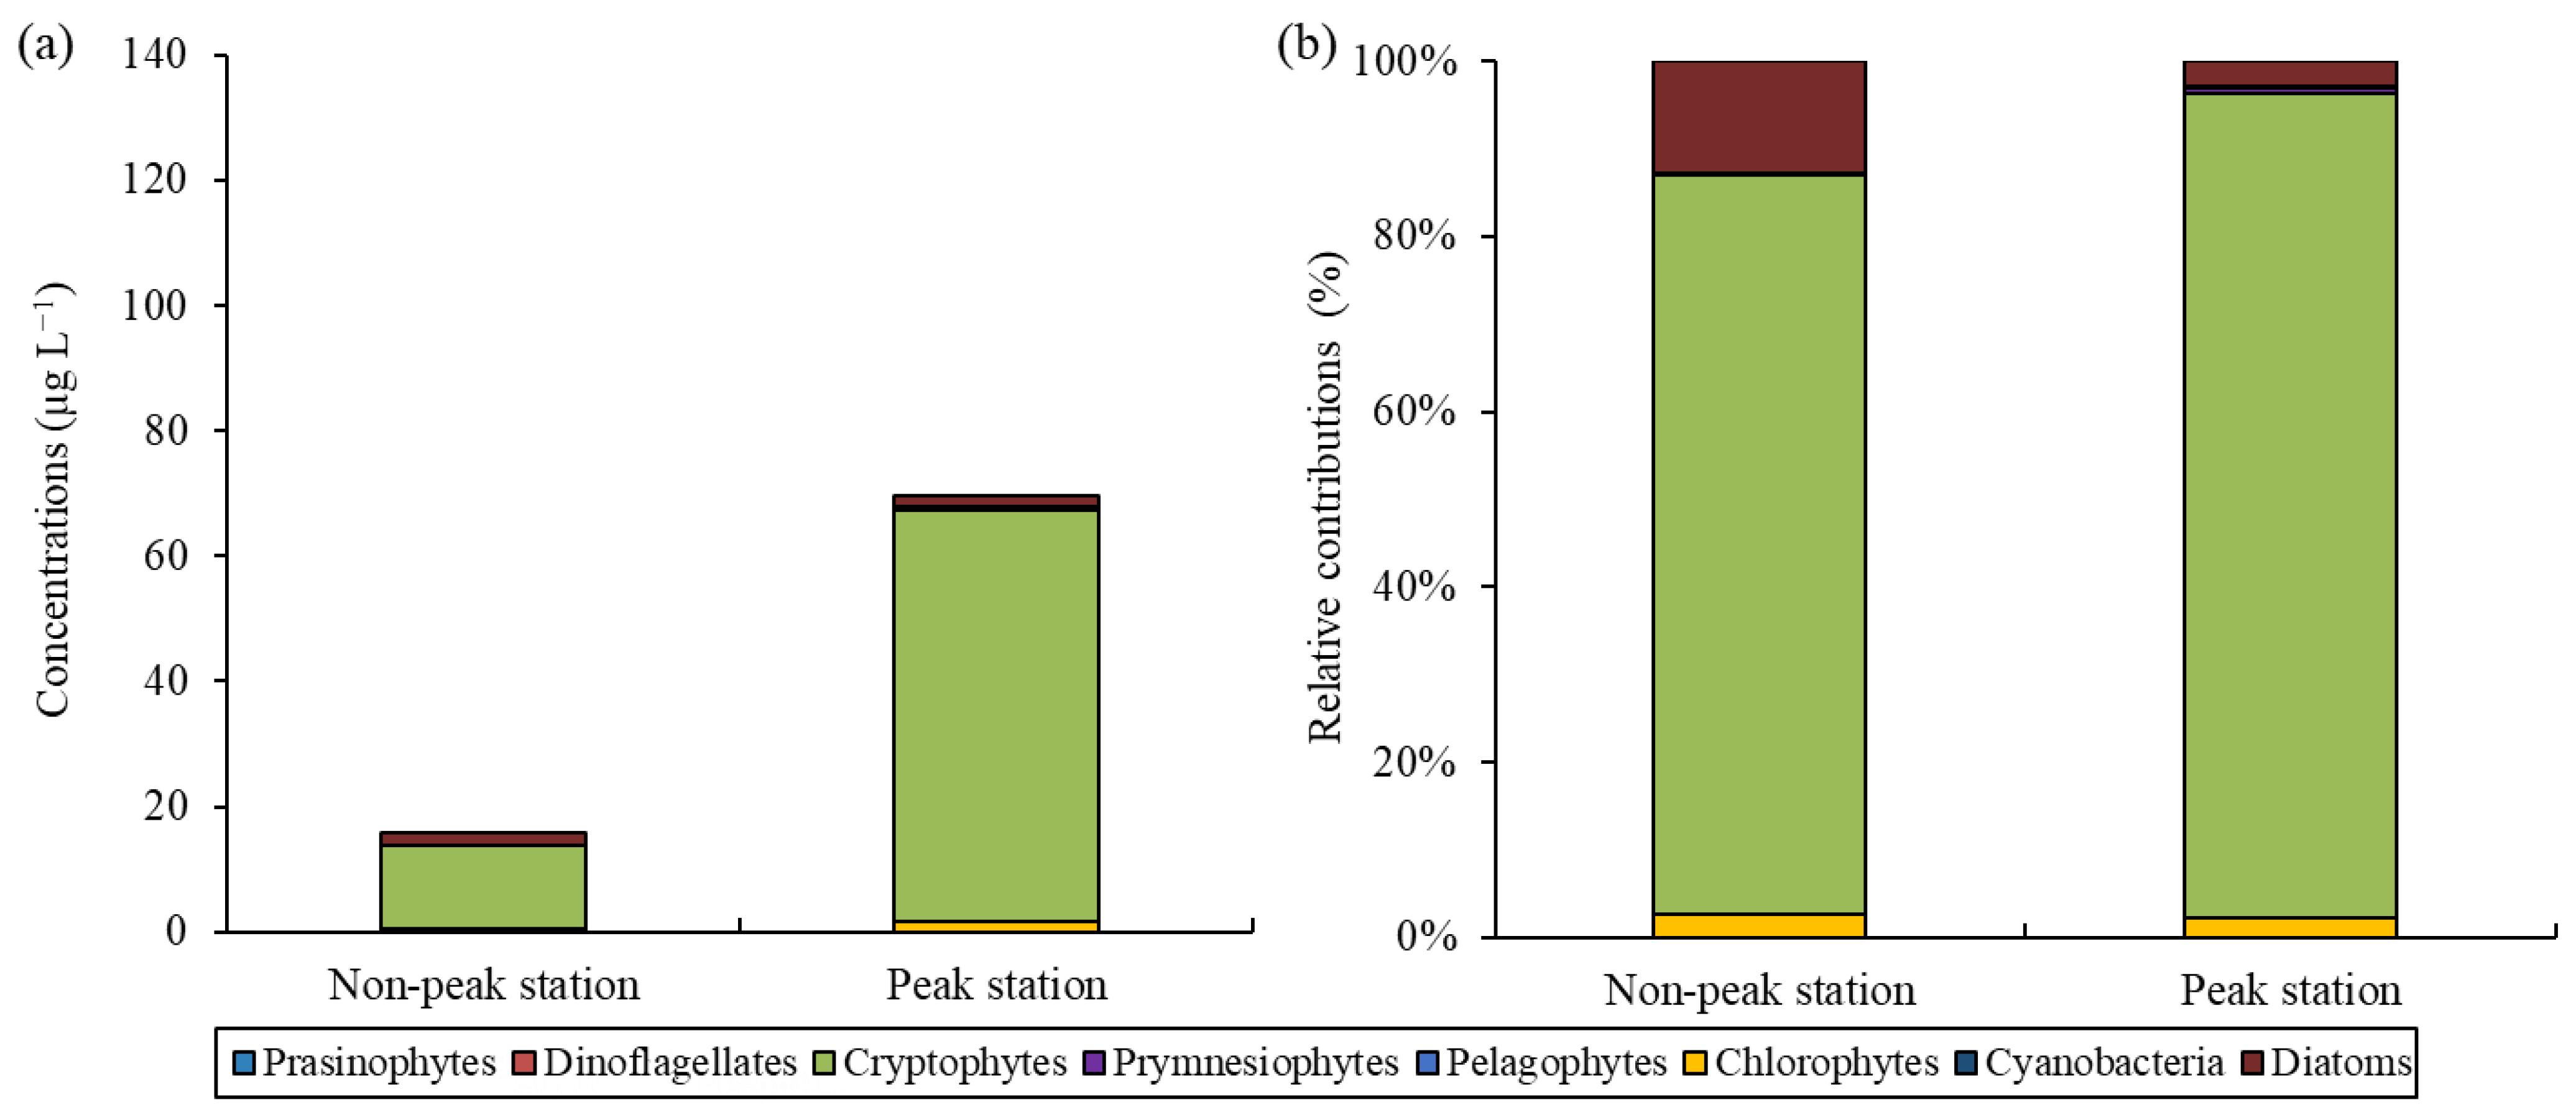
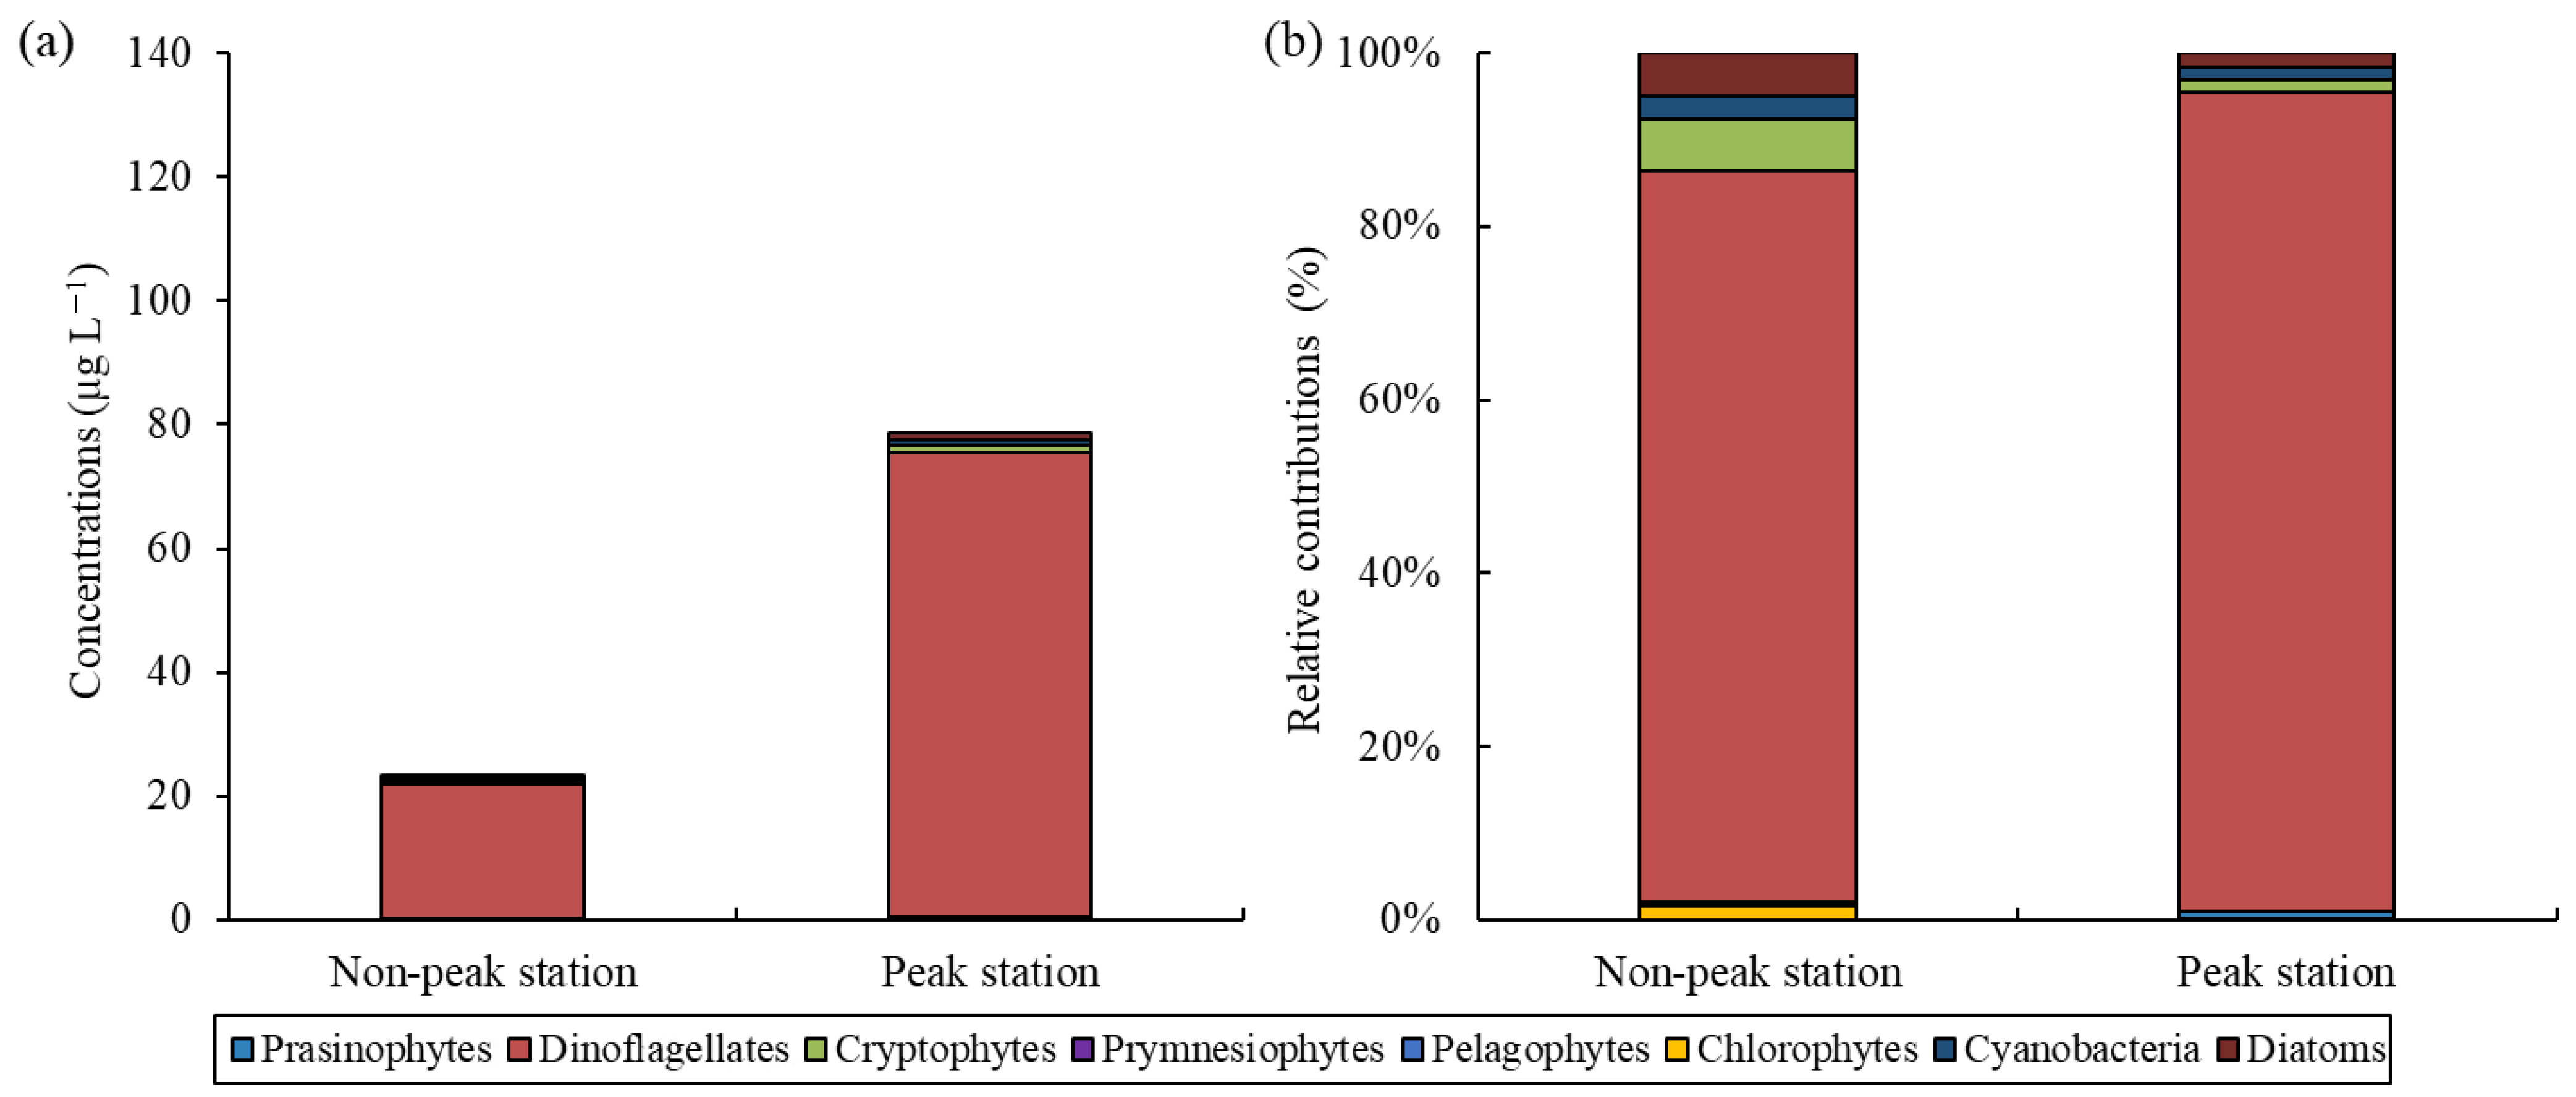
Based on the total chl-a concentrations derived from HPLC analysis, several chl-a peaks were observed on 8 August and 29 August 2022 (Figure 3). Phytoplankton species compositions were classified into two groups, peak and non-peak groups, based on the total chl-a concentrations. The peak group was identified based on its distinctive characteristic of having chlorophyll concentrations significantly higher than the adjacent values by at least 130%. This determination was made by considering the distribution pattern of the chlorophyll concentration, as illustrated in Figure 3. On 8 August 2022, stations A3-2, A5-2, and A7-1 belonged to the peak group, while stations A1-2, A3-1, A4-1, A6-3, and A6-4 were included in the non-peak group. Cryptophyte concentrations were statistically higher in the peak group, whereas the concentrations of the second dominant diatoms were statistically lower (t-test, p < 0.01; Figure 4). Similarly, on 29 August 2022, stations Y03, Y04, Y07, Y09, Y10, Y12, Y14, and Y17 belonged to the peak group, while stations Y02, Y06, Y08, Y11, Y19, and Y20 were part of the non-peak group. The dinoflagellate concentrations were significantly higher in the peak group, whereas non-dinoflagellate concentrations (mostly diatoms, cryptophytes, and cyanobacteria) were statistically lower (t-test, p < 0.01; Figure 5).

3.4. Relationship between Microscopic Observation and CHEMTAX Estimates

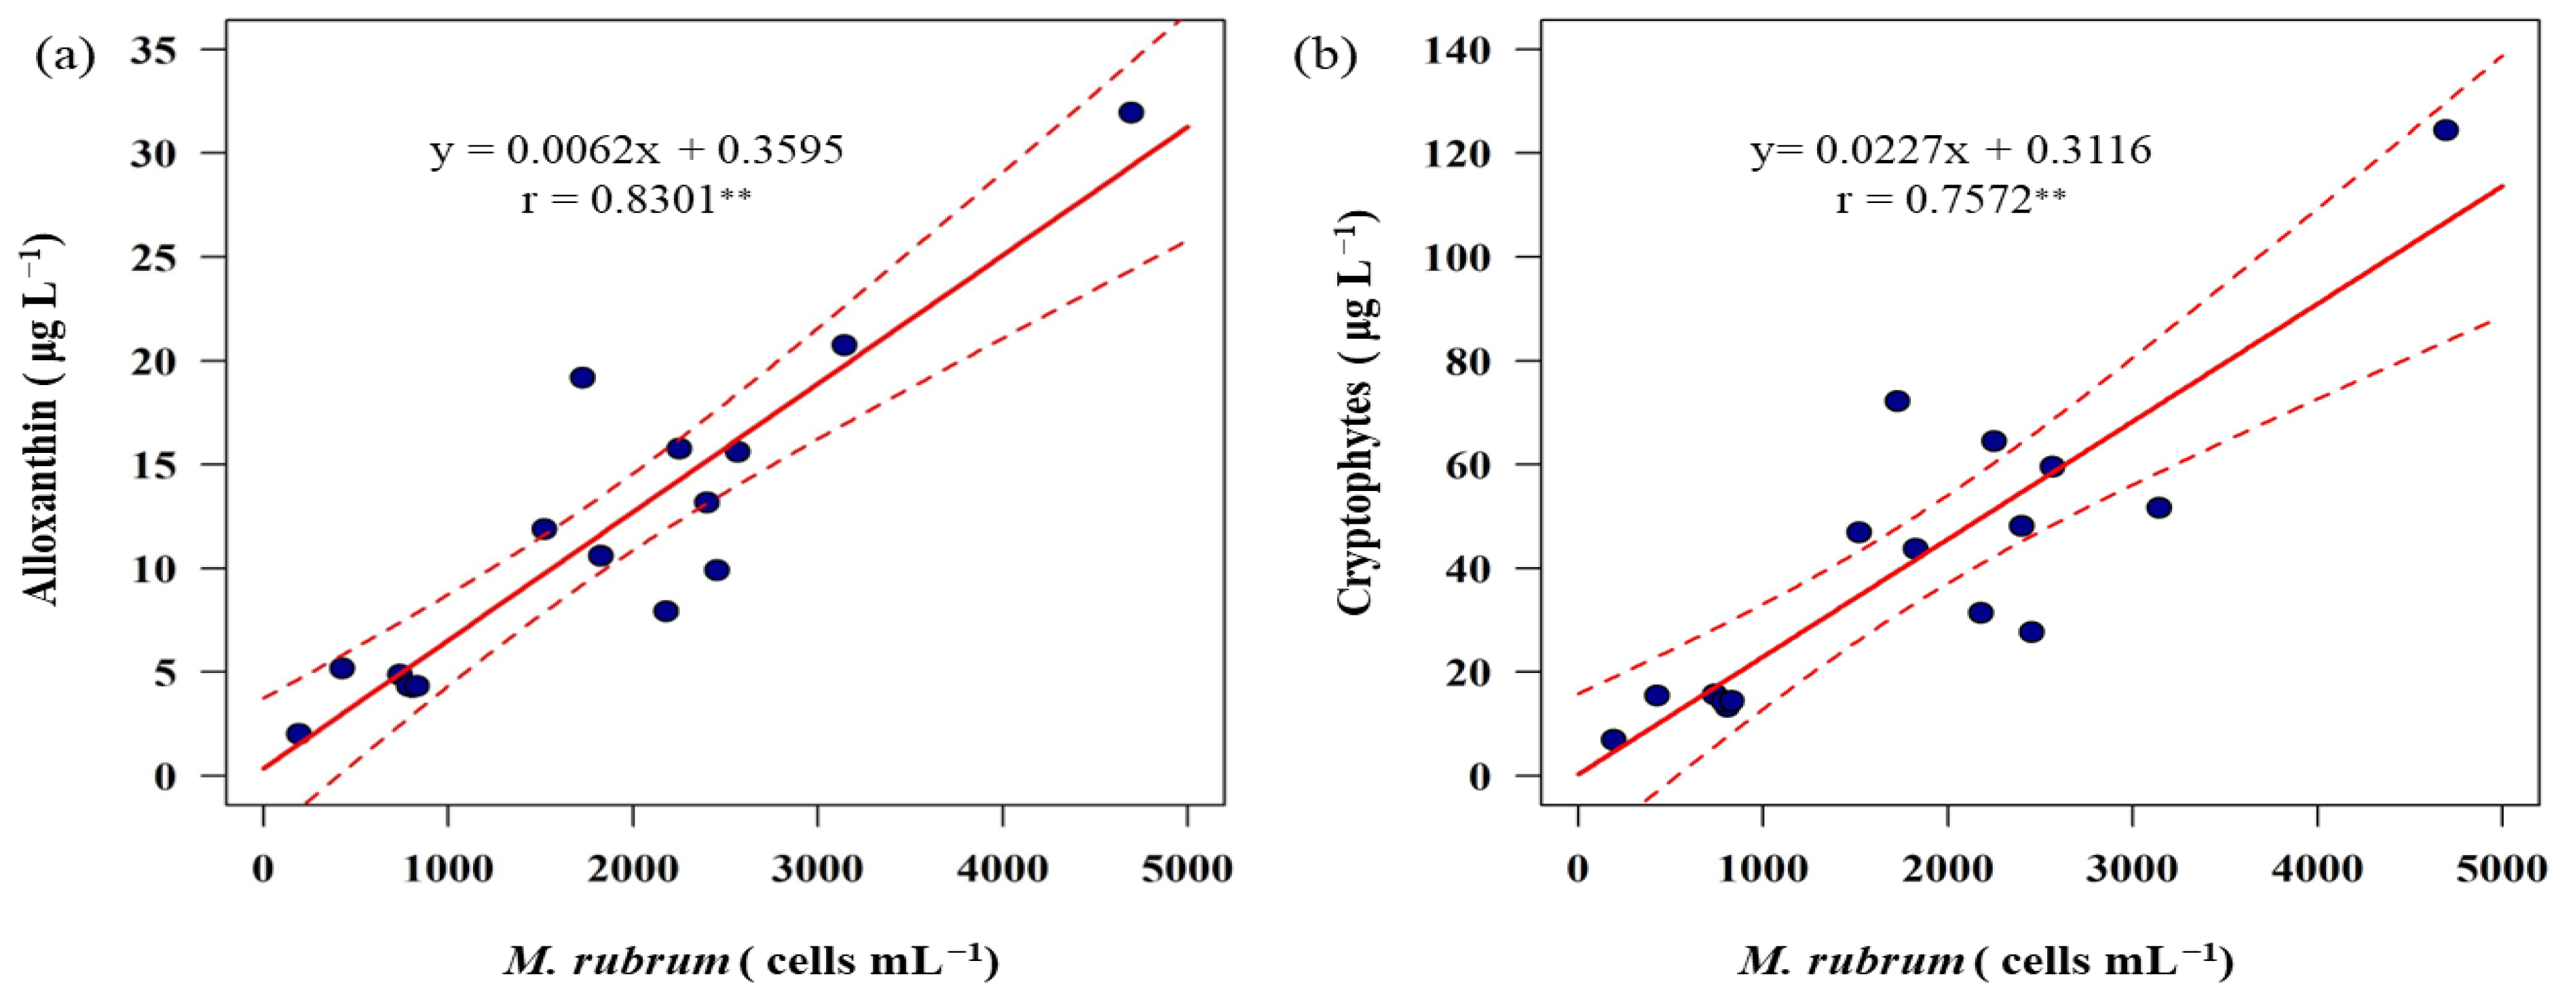
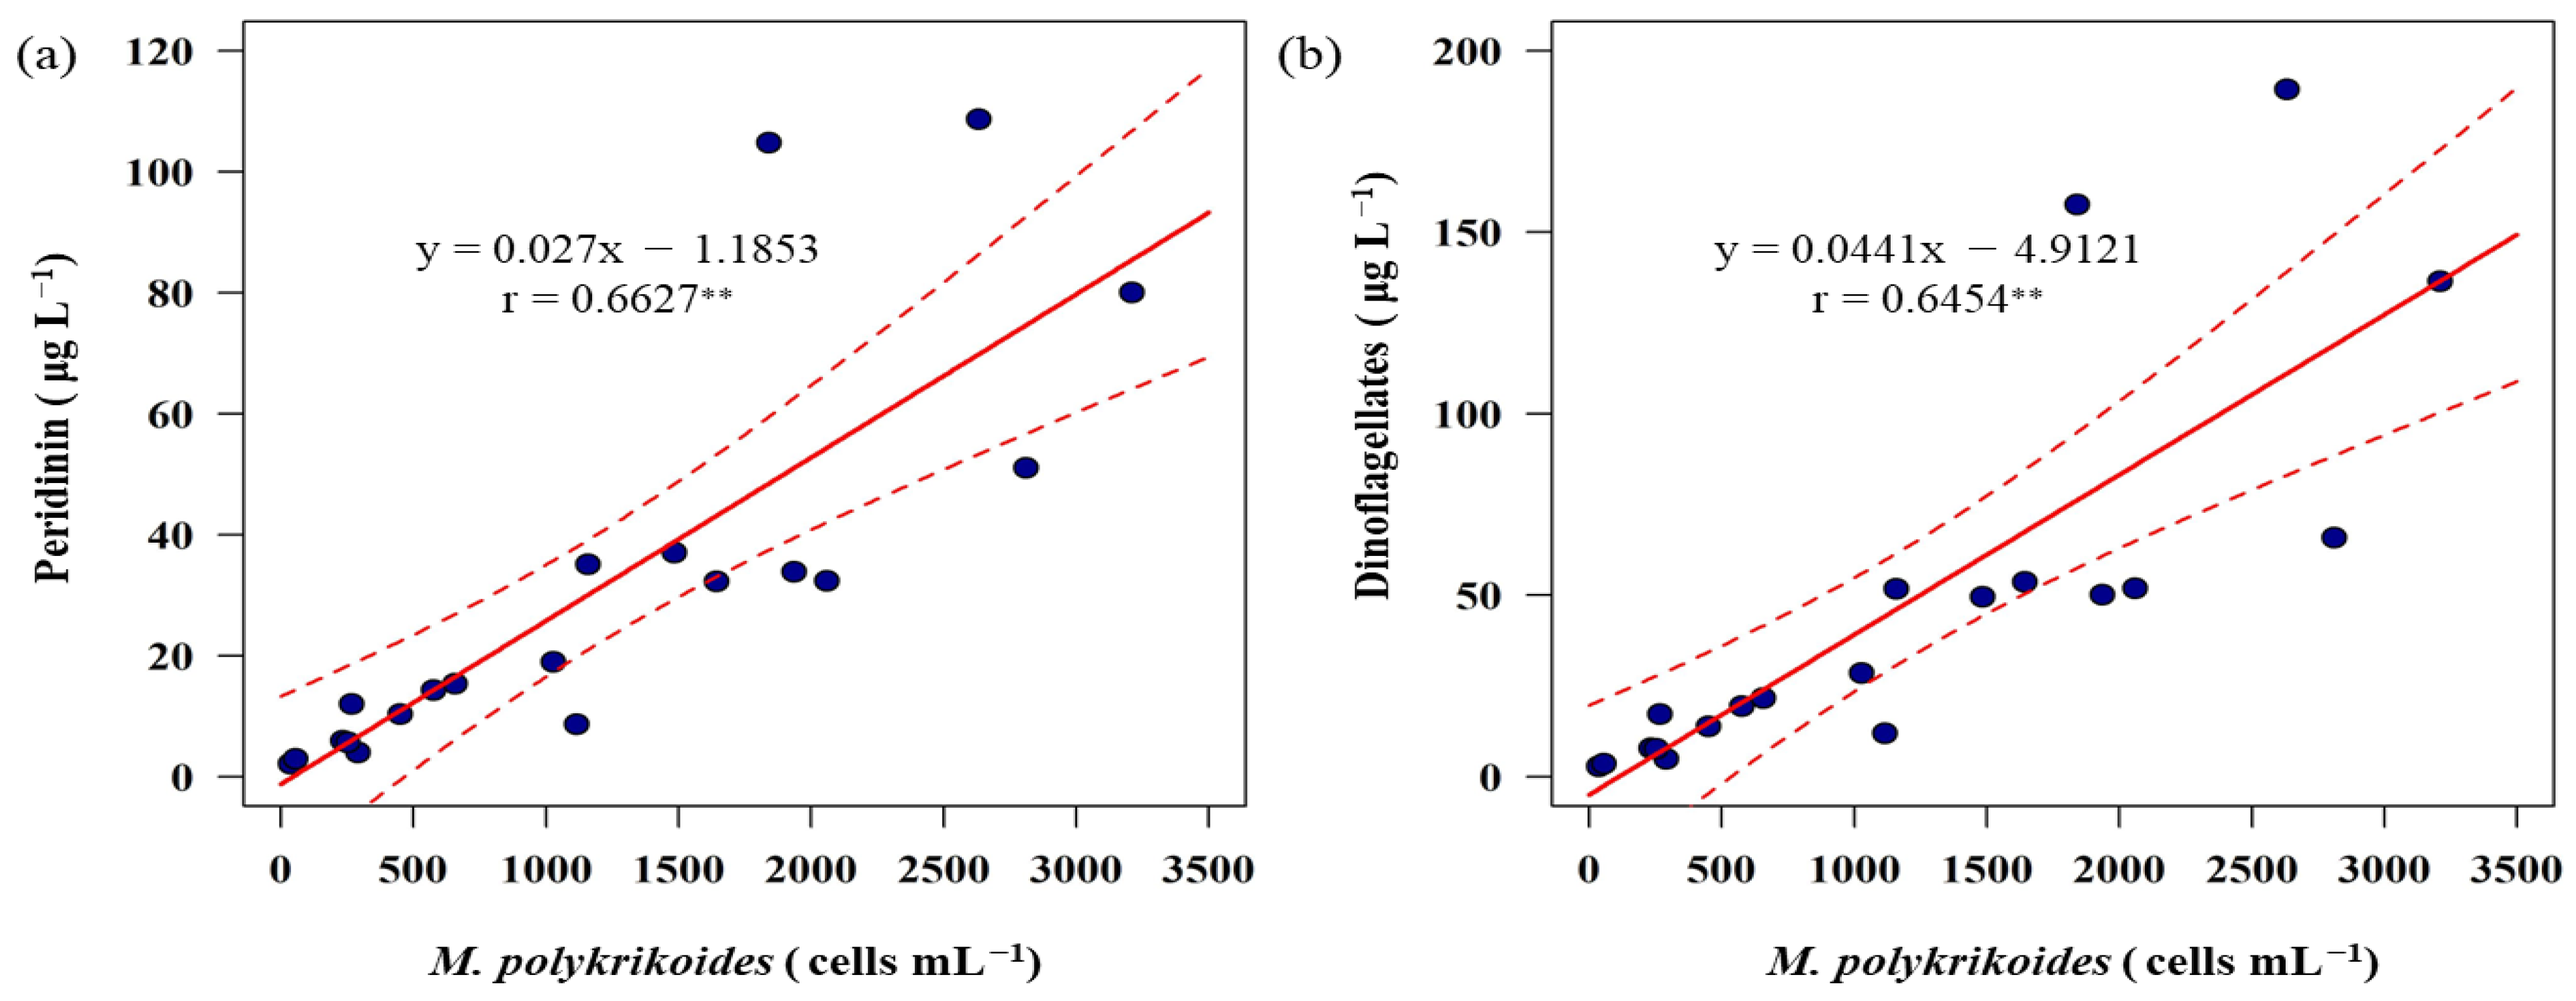
A simple regression analysis was used to evaluate the relationship between the microscopically derived cell abundance of M. rubrum and HPLC-derived alloxanthin concentration, as well as CHEMTAX-derived cryptophyte concentration (Figure 6). On 8 August 2022, significant correlations (p < 0.01) were found between the alloxanthin concentration and cell numbers of M. rubrum (r = 0.830), and between the cryptophyte concentration and cell numbers of M. rubrum (r = 0.757) (Figure 6). Similarly, on 29 August 2022, significant correlations (p < 0.01) were found between the HPLC-derived peridinin concentration and the cell density of M. polykrikoides (r = 0.663), and between the CHEMTAX-derived dinoflagellate concentration and the density of M. polykrikoides (r = 0.645) (Figure 7).

4. Discussion

Various monitoring approaches have been employed in Korea and globally to study red tides [3,11,21,33,34,35,36]. The HPLC approach for investigating red tide causative dinoflagellates using their corresponding marker pigments, such as peridinin, has been successfully applied in Tolo Harbor, Hong Kong [21]. In [19], the HPLC method was applied to determine M. polykrikoides biomass changes during a massive bloom period in the East Sea of Korea in 2013. It was proven that HPLC application could be an effective alternative approach to red tide monitoring and the study of phytoplankton dynamics during red tides. In this study, HPLC was applied to two different types of red tides caused by M. rubrum and the dinoflagellate M. polykrikoides on the southern coasts of Korea, where red tides have recurred over the last four decades.
Normally, spatial patchiness in red tide distributions is a common phenomenon, as observed in previous studies [19,34,37]. In this study, the patterns of the total chl-a concentrations displayed spatially patchy distributions during the two field campaigns on 8 August and 29 August 2022 (Figure 3). The concentrations and compositions of phytoplankton communities significantly differed between stations experiencing peak and non-peak red tide conditions (Figure 4 and Figure 5). Based on the results from HPLC and microscopic analysis in this study, the peak stations exhibited a significantly higher cell abundance of cryptophytes, which are the major prey of M. rubrum [16,34,35], and the dinoflagellate M. polykrikoides on 8 August and 29 August 2022, respectively.
M. rubrum is well known for forming recurrent massive blooms in coastal regions, particularly in river estuaries [38,39]. While M. rubrum demonstrates a remarkable tolerance to sudden changes in salinity [40], its populations can be influenced by freshwater discharge conditions [16]. Unfortunately, no data on salinity were measured in this study for comparison due to the malfunctioning of the salinometer during the observations. The average water temperature at the surface on 8 August 2022 was 27.0 °C, which is close to the maximum temperature (27.1 °C) observed at the red tide sites caused by M. rubrum on the southern coasts of Korea [16].
Detecting M. rubrum red tides can be challenging in Korea due to their small spatial extent and short duration (unpublished data). However, in our study, we observed significant positive relationships between alloxanthin concentrations, a marker pigment derived from cryptophytes, and the density of M. rubrum (r = 0.830, p < 0.01) (Figure 6). These results indicate that HPLC-derived alloxanthin concentrations can serve as an indicator of the presence of M. rubrum red tides. Furthermore, based on the relationship between the alloxanthin concentration and the observed cell density (r = 0.757, p < 0.01), it is possible to estimate the approximate cell density of M. rubrum using HPLC analysis. Therefore, HPLC analysis could be useful for determining the occurrence of M. rubrum red tides and assessing their intensity. However, it should be noted that M. rubrum does not exclusively consume cryptophytes, and the relationship between prey and predator may not always be positively correlated, especially as the bloom progresses and the abundance of prey decreases [34,38]. M. rubrum has been reported to feed on other prey sources, such as the cyanobacterium Synechococcus sp. and heterotrophic bacteria [41,42,43]. Nevertheless, previous studies have demonstrated that M. rubrum does exhibit a preference for cryptophytes as a major prey source [44,45,46,47]. Genetic analysis has revealed that the primary prey of M. rubrum in coastal regions of the Americas is the free-living Geminigera cryophila and its closest relative [44], while on the Japanese coast, Teleauulax amphioxeia is identified as a significant prey source [46]. Both Geminigera cryophila and Teleaulax amphioxeia belong to the cryptophyte group. Moreover, studies by [45,47] have demonstrated that M. rubrum fed on cryptophyte prey species when offered various algal prey species. As such, while alloxanthin can be a useful indicator for monitoring M. rubrum when cryptophytes are the predominant prey source in seawater, its reliability may be limited in situations where other prey sources are available. It is crucial to consider this limitation when interpreting the results of our study. Future investigations should explore the influence of different prey types and their availability on the validity of using alloxanthin as an indicator of M. rubrum red tides. Additionally, the temporal limitations of this method should be considered, as it may be more effective for detecting M. rubrum red tides at their initial stage of growth when the relationship between prey and predator is more likely to show a positive correlation. The photosynthetic activities of M. rubrum depend on biotic and abiotic conditions, although the major environmental trigger for M. rubrum red tides is unclear in Korea ([16] and references therein). M. rubrum is a mixotrophic ciliate that relies on phototrophs and cryptophyte prey to sustain its photosynthesis and population growth [16,34,35,48]. In a previous study [49], a positive relationship between cryptomonads and M. rubrum populations in nature was observed. M. rubrum is known to ingest various kinds of cryptophytes, as demonstrated in field and laboratory studies ([16,34] and references therein). Therefore, localized formations of M. rubrum red tides are closely linked to the availability of suitable cryptophytes in the estuary and bay environments [38,50,51]. In line with these observations, our study found significantly higher concentrations and compositions of cryptophytes in chl-a peaks dominated by M. rubrum compared to non-chl-a peaks dominated by the diatom L. danicus on 8 August 2022 (Figure 4, Table 1) (t-test, p < 0.01). Cryptophytes accounted for the majority (>~75% of total chl-a) of the phytoplankton community on that day based on pigment analysis. Normally, diatoms and dinoflagellates are the primary contributors to phytoplankton communities, while cryptophytes generally have a low contribution in the southern coastal areas and bays of Korea, although this composition varies seasonally and spatially [17,52,53]. In particular, in the southern part of Yeosu, diatoms such as Skeletonema costatum, Chaetoceros curvisetus, Eucampia zodiacus, Chaetoceros affinis, and Thalassionema nitzschioides are remarkably dominant, ranging from 98.5% to 99.9% throughout all seasons [54]. On 29 July 2022, approximately one week before the red tide event, the main phytoplankton community consisted of diatoms (45.3%), chlorophytes (28.8%), and dinoflagellates (11.1%) (unpublished data). However, cryptophytes are generally observed throughout the seasons, with relatively higher contributions in autumn and winter in the southern coastal waters of Korea [22]. These cryptophyte-dominant waters are characterized by low salinity and high nitrate concentrations [22]. In our second field campaign on 29 August 2022, we also observed lower cryptophyte compositions across all stations (3.1 ± 3.5%). The M. rubrum red tide observed in this study could be attributed to the unusually high dominance of cryptophyte prey on 8 August 2022. Typically, cryptophytes are often dominant in estuarine coastal environments [38,50,51]. However, no obvious drop in surface salinity was detected at the national monitoring stations near our sampling area on 8 August 2022. The potential controlling environmental conditions for the predominant cryptophytes should be further investigated to understand the development of M. rubrum red tides. Furthermore, the presence of other prey sources cannot be ruled out, and the role of different prey types in sustaining M. rubrum populations should be further investigated.
In the second field campaign, we found significant correlations between the peridinin concentration and the density of M. polykrikoides (p < 0.01, r = 0.663) (Figure 7). Some deviations in the relationship may be attributed to the microscopic cell counting, as M. polykrikoides can be easily destroyed during the sampling procedure [19,55]. The strong relationship indicates that peridinin, the major marker pigment for dinoflagellates, could serve as an indicator for the density of M. polykrikoides, the causative agent of red tides. A similar positive correlation between peridinin pigment concentrations and dinoflagellate cell numbers was observed in Tolo Harbor, Hong Kong [21]. Based on these findings, HPLC analysis can be an effective approach for red tides caused by dinoflagellates, especially in Korea, where a significant portion of red tides are attributed to M. polykrikoides [3]. However, it should be noted that peridinin is not exclusively possessed by M. polykrikoides, as many other species of dinoflagellates also contain this pigment. Therefore, the use of peridinin as a specific indicator for detecting red tides caused by M. polykrikoides is applicable only in situations where no other dinoflagellate species are coexisting. While the observed correlation between the peridinin concentration and M. polykrikoides density suggests that peridinin served as an indicator for M. polykrikoides red tides during our observation period in this study, it is important to consider the presence of other dinoflagellate species when interpreting the results. The coexistence of multiple dinoflagellate species may influence the accuracy of using peridinin as a sole indicator for M. polykrikoides density estimation. To address this limitation and improve the specificity of M. polykrikoides biomass estimation, future studies should consider additional markers or analytical techniques that can differentiate M. polykrikoides from other coexisting dinoflagellate species and provide a more specific estimation of M. polykrikoides density in mixed dinoflagellate communities. These approaches would provide a more accurate and specific estimation of M. polykrikoides density in mixed dinoflagellate communities.
M. polykrikoides red tides predominantly occur from late August to September in the coastal waters of Korea, while most mixotrophic dinoflagellate red tides occur during the warm-temperature season (June–September) [7,56]. The development of M. polykrikoides red tides is influenced by various physico-biological and chemical factors ([57] and references therein). However, a clear explanation for the development of M. polykrikoides red tides has not been identified yet, as their occurrence is largely affected by multiple factors [3,4]. Although the frequency of M. polykrikoides red tides increased to 37.7% in the 2010s, the intensity of recent red tides caused by M. polykrikoides has significantly weakened since 2008 [3]. The maximum cell density observed in our study on 29 August 2022 (3.21 × 10³ cells mL−1) is approximately one order lower than that reported in the mid and late 1990s [47,49]. Generally, M. polykrikoides red tides occur in water temperatures ranging from 23 to 26 °C in the coastal waters of Korea [3,58]. The growth of M. polykrikoides appears to be constrained in water temperatures above 26.0 °C [54]. In our study, the average surface water temperature on 29 August 2022 was 23.8 °C (±0.3 °C) (Table 1), which falls within the reported temperature range. On 8 August 2022, when the M. rubrum red tide occurred, the water temperature in our study area was above 26.0 °C, which could inhibit the growth of M. polykrikoides [3,58].
Although the sampling areas on 8 August and 29 August 2022 were rather different, the early M. rubrum red tide on 8 August 2022 was followed by the later M. polykrikoides red tide, which is a rare occurrence in Korea. M. rubrum is considered to be a prey species of dinoflagellate Dinophysis spp. and other predators, suggesting that it could play a crucial linking role between cryptophyte prey and various metazoan consumers [35,41,48]. Our potential scenario for the sequential red tides on 8 August and 29 August 2022 in our study area suggests that the formation of the M. rubrum bloom was initially caused by the unusual dominance of cryptophyte prey on 8 August 2022, with the subsequent bloom formation of M. polykrikoides being due to their feeding on the M. rubrum prey on 29 August 2022. However, this scenario should be further validated in future studies.

5. Summary and Conclusions

In this study, we applied HPLC analysis to investigate red tides caused by M. rubrum and M. polykrikoides along the southern coasts of Korea, where red tides have recurred over several decades. Our findings indicate that HPLC-derived alloxanthin concentrations can serve as an indicator of M. rubrum red tides, while peridinin concentrations can be used as an indicator of M. polykrikoides red tides.
However, we acknowledge the importance of considering the potential constraints and challenges of generalizing our findings to different ecosystems. While our study provides valuable insights into red tides caused by M. rubrum and M. polykrikoides in the specific coastal regions studied, several limitations should be noted when applying our approach to other ecosystems:
Ecosystem Variability: Ecosystems can vary significantly in terms of nutrient availability, hydrodynamics, and species composition. These differences may affect the performance and applicability of our method, as the relationships between marker pigments and species abundance could vary.
Prey–Predator Dynamics: Our study emphasized the importance of cryptophytes as prey for M. rubrum and M. polykrikoides. However, the availability and composition of prey species can differ across ecosystems, potentially impacting the reliability of using marker pigments as indicators.
Species Diversity: While our results demonstrate relationships between marker pigments and species abundance, the presence of multiple coexisting species, including other dinoflagellates, could complicate the interpretation of marker pigment concentrations.
Spatial and Temporal Variability: Our observations were limited to specific campaigns and locations. Variability in red tide dynamics across different seasons and geographic regions should be considered when extrapolating our findings.
In conclusion, while our study contributes valuable insights into red tide dynamics in the studied coastal areas, we emphasize that the applicability of our method to other ecosystems with distinct dynamics requires careful consideration of the aforementioned limitations. Future studies should focus on assessing the suitability of our approach in different contexts, taking into account the specific characteristics of the target ecosystems.

Author Contributions

Conceptualization, Y.K. and S.-H.L.; methodology, Y.K., S.-W.J. and M.S.; validation, Y.K.; formal analysis, Y.K.; investigation, Y.K., S.P., H.-K.J., H.-Y.C., J.-H.L., W.K., S.K., S.-N.K., S.-H.A. and S.A.; data curation, Y.K.; writing—original draft preparation, Y.K.; writing—review and editing, Y.K. and S.-H.L.; visualization, Y.K.; supervision, S.-H.L.; project administration, S.-H.L.; funding acquisition, J.-H.L., S.A. and S.-H.L. All authors have read and agreed to the published version of the manuscript.

Funding

This research was supported by the Korea Institute of Marine Science & Technology Promotion (KIMST), funded by the Ministry of Oceans and Fisheries (20220023; RS-2023-00238486). Research support for J.H. Lee was provided by the project entitled “Survey of coastal fisheries resources and marine environmental ecology in the South Sea (R2023010)”, funded by the National Institute of Fisheries Science (NIFS), Republic of Korea.

Data Availability Statement

Not applicable.

Conflicts of Interest

The authors declare no conflict of interest.

References

  1. Jeong, H.J.; Kang, C.K. Understanding and managing red tides in Korea Preface. Harmful Algae 2013, 30, S1–S2. [Google Scholar] [CrossRef]
  2. National Fisheries Research and Development Institute (NFRDI). Harmful Algal Blooms in Korean Nearshore Waters in 2013. Research Report of National Fisheries Research and Development Institute; National Fisheries Research and Development Institute: Incheon, Republic of Korea, 2014; p. 173. (In Korean)
  3. Lim, W.; Go, W.J.; Kim, K.-Y.; Park, J.-W. Variation in harmful algal blooms in Korean coastal waters since 1970. J. Korean Soc. Mar. Environ. Saf. 2020, 26, 523–530. [Google Scholar] [CrossRef]
  4. Lee, C.K.; Park, T.G.; Park, Y.T.; Lim, W.A. Monitoring and trends in harmful algal blooms and red tides in Korean coastal waters, with emphasis on Cochlodinium polykrikoides. Harmful Algae 2013, 30, S3–S14. [Google Scholar] [CrossRef]
  5. Kim, S.M.; Shin, J.; Baek, S.; Ryu, J.-H. U-Net convolutional neural network model for deep red tide learning using GOCI. J. Coast. Res. 2019, 90, 302–309. [Google Scholar] [CrossRef]
  6. National Institute of Fisheries Science (NIFS). Past Red Tide Occurrence Data; NIFS: Busan, Republic of Korea, 2020; Available online: http://www.nifs.go.kr/red/news/news_2020.jsp (accessed on 22 August 2023).
  7. Park, J.; Jin, H.; Du, Y.; Young, E. Mixotrophic dinoflagellate red tides in Korean waters: Distribution and ecophysiology. Harmful Algae 2013, 30, 28–40. [Google Scholar] [CrossRef]
  8. Lee, C.K.; Kim, H.C.; Lee, S.-G.; Jung, C.S.; Kim, H.G.; Lim, W.A. Abundance of Harmful Algae, Cochlodinium polykrikoides, Â Gyrodinium impudicum and Gymnodinium catenatum in the Coastal Area of South Sea of Korea and Their Effects of Temperature, Salinity, Irradiance and Nutrient on the Growth in Culture. J. Korean Fish. Soc. Pusan 2001, 34, 536–544. [Google Scholar]
  9. Kang, Y.S.; Kim, H.G.; Lim, W.E.; Lee, C.K. An unusual coastal environment and Cochlodinium polykrikoides blooms in 1995 in the South Sea of Korea. J. Korean Soc. Oceanogr. 2002, 37, 212–223. [Google Scholar]
  10. Sarma, Y.V.B.; Al-Hashmi, K.; Smith, S.L. Sea surface warming and its implications for harmful algal blooms off Oman. Int. J. Mar. Sci. 2013, 3, 65–71. [Google Scholar] [CrossRef]
  11. Harun, S.N.; Mohammad-Noor, N.; Ahmad, Z.; Chu, K.B.; Saad, S.; Mohamad Hidayat, N.S.; MuKai, Y. First report of Cochlodinium polykrikoides (Dinophyceae), a harmful algal bloom (HAB) species in the coastal waters of peninsular Malaysia. Malays J. Sci. 2015, 34, 87–92. [Google Scholar] [CrossRef]
  12. NFRDI. Monitoring, management and mitigation of red tide. In Annual Report of NFRDI on Red Tide of Korea; NFRDI: Busan, Republic of Korea, 2012. (In Korean) [Google Scholar]
  13. Park, T.G.; Lim, W.A.; Park, Y.T.; Lee, C.K.; Jeong, H.J. Economic impact, management and mitigation of red tides in Korea. Harmful Algae 2013, 30, 131–143. [Google Scholar] [CrossRef]
  14. Kang, H.E.; Yoon, T.H.; Park, J.W.; Lim, W.A.; Kang, C.K.; Kim, H.W. A Study on the Possibility of Early Warning for Cochlodinium polykrikoides Blooms, Using Molecular Methods. Water 2022, 14, 3115. [Google Scholar] [CrossRef]
  15. Lee, M.O.; Choi, J.H.; Park, I.H. Outbreak conditions for Cochlodinium polykrikoides blooms in the southern coastal waters of Korea. Mar. Environ. Res. 2010, 70, 227–238. [Google Scholar] [CrossRef] [PubMed]
  16. Yih, W.; Kim, H.S.; Myung, G.; Park, J.W.; Yoo, Y.D.; Jeong, H.J. The red-tide ciliate Mesodinium rubrum in Korean coastal waters. Harmful Algae 2013, 30, 53–61. [Google Scholar] [CrossRef]
  17. Kang, J.J.; Lee, J.H.; Kim, H.C.; Lee, W.C.; Lee, D.; Jo, N.; Min, J.-O.; Lee, S.H. Monthly Variations of Phytoplankton Community in Geoje-Hansan Bay of the Southern Part of Korea Based on HPLC Pigment Analysis. J. Coast. Res. 2018, 85, 356–360. [Google Scholar] [CrossRef]
  18. Kim, Y.; Youn, S.H.; Oh, H.J.; Kang, J.J.; Lee, J.H.; Lee, D.; Kim, K.; Jang, H.K.; Lee, J.; Lee, S.H. Spatiotemporal variation in phytoplankton community driven by environmental factors in the northern East China Sea. Water 2020, 12, 2695. [Google Scholar] [CrossRef]
  19. Noh, J.H.; Kim, W.; Son, S.H.; Ahn, J.-H.; Park, Y.-J. Remote quantification of Cochlodinium polykrikoides blooms occurring in the East Sea using geostationary ocean color imager (GOCI). Harmful Algae 2018, 73, 129–137. [Google Scholar] [CrossRef] [PubMed]
  20. Kang, H.E.; Yoon, T.H.; Yoon, S.; Kim, H.J.; Park, H.; Kang, C.K.; Kim, H.W. Genomic analysis of red-tide water bloomed with Heterosigma akashiwo in Geoje. PeerJ 2018, 6, e4854. [Google Scholar] [CrossRef]
  21. Wong, C.K.; Wong, C.K. HPLC pigment analysis of marine phytoplankton during a red tide occurrence in Tolo Harbour, Hong Kong. Chemosphere 2003, 52, 1633–1640. [Google Scholar] [CrossRef]
  22. Sun, Y.; Youn, S.H.; Oh, H.J.; Joo, H.T.; Kim, Y.; Kang, J.J.; Lee, S.H. Spatial and temporal distribution of phytoplankton community in relation to environmental factors in the southern coastal waters of Korea. Front. Mar. Sci. 2022, 9, 950234. [Google Scholar] [CrossRef]
  23. Wright, S.W.; Jeffrey, S.W.; Mantoura, R.F.C.; Llewellyn, C.A.; Bjornland, D.; Repeta, D.; Welschmeyer, N. Improved HPLC method for the analysis of chlorophylls and carotenoids from marine phytoplankton. Mar. Ecol. Prog. Ser. 1991, 77, 183–196. [Google Scholar] [CrossRef]
  24. Jeffrey, S.W.; Mantoura, R.F.C.; Wright, S.W. (Eds.) Phytoplankton Pigments in Oceanography: Guidelines to Modern Methods; UNESCO Publishing: Paris, France, 1997. [Google Scholar]
  25. Mantoura, R.F.C.; Barlow, R.G.; Head, E.J.H. Simple Isocratic HPLC Methods for Chlorophylls and Their Degradation Products; NASA: Washington, DC, USA, 1997.
  26. Zapata, M.; Rodriguez, F.; Garrido, J.L. Separation of chlorophylls and carotenoids from marine phytoplankton: A new HPLC method using a reversed phase C-8 column and pyridine-containing mobile phases. Mar. Ecol. Prog. Ser. 2000, 195, 29–45. [Google Scholar] [CrossRef]
  27. Lee, Y.W.; Park, M.O.; Im, Y.S.; Kim, S.S.; Kang, C.K. Application of photosynthetic pigment analysis using a HPLC and CHEMTAX program to studies of phytoplankton community composition. Sea 2011, 16, 117–124. [Google Scholar] [CrossRef]
  28. Mackey, M.D.; Mackey, D.J.; Higgins, H.W.; Wright, S.W. CHEMTAX—A program for estimating class abundances from chemical markers: Application to HPLC measurements of phytoplankton. Mar. Ecol. Prog. Ser. 1996, 144, 265–283. [Google Scholar] [CrossRef]
  29. Wright, S.W.; Thomas, D.P.; Marchant, H.J.; Higgins, H.W.; Mackey, M.D.; Mackey, D.J. Analysis of phytoplankton of the Australian sector of the Southern Ocean: Comparisons of microscopy and size frequency data with interpretations of pigment HPLC data using the ‘CHEMTAX’ matrix factorization program. Mar. Ecol. Prog. Ser. 1996, 144, 285–298. [Google Scholar] [CrossRef]
  30. Wright, S.W.; van den Enden, R.L. Phytoplankton community structure and stocks in the East Antarctic marginal ice zone (BROKE survey, January–March 1996) determined by CHEMTAX analysis of HPLC pigment signatures. Deep. Sea Res. II 2020, 47, 2363–2400. [Google Scholar] [CrossRef]
  31. Utermöhl, H. Zur Vervollkommnung der quantitativen Phytoplankton Methodik. Int. Ver. Theor. Angew. Limnol. Mitt. 1958, 9, 1–38. [Google Scholar] [CrossRef]
  32. Neukermans, G.; Ruddick, K.; Loisel, H.; Roose, P. Optimization and quality control of suspended particulate matter concentration measurement using turbidity measurements. Limnol. Oceanogr. Methods 2012, 10, 1011–1023. [Google Scholar] [CrossRef]
  33. Kim, Y.; Byun, Y.; Kim, Y.; Eo, Y. Detection of Cochlodinium polykrikoides red tide based on two-stage filtering using modis data. Desalination 2009, 249, 1171–1179. [Google Scholar] [CrossRef]
  34. Peltomaa, E.; Johnson, M.D. Mesodinium rubrum exhibits genus-level but not species-level cryptophyte prey selection. Aquat. Microb. Ecol. 2017, 78, 147–159. [Google Scholar] [CrossRef]
  35. Nishitani, G.; Yamaguchi, M. Seasonal succession of ciliate Mesodinium spp. with red, green, or mixed plastids and their association with cryptophyte prey. Sci. Rep. 2018, 8, 17189. [Google Scholar] [CrossRef]
  36. Kim, W.; Han, T.H.; Jung, S.W.; Kang, D. Analysis on the Optical Absorption Property of Sea Waters Dominated by Alexandrium affine in Coastal Waters off Tongyeong, 2017. J. Korean Soc. Surv. Geod. Photogramm 2019, 37, 563–570. [Google Scholar]
  37. Kwon, H.K.; Kim, G.; Lim, W.A.; Park, J.W. In-situ production of humic-like fluorescent dissolved organic matter during Cochlodinium polykrikoides blooms. Estuar. Coast. Shelf Sci. 2018, 203, 119–126. [Google Scholar] [CrossRef]
  38. Herfort, L.; Peterson, T.D.; McCue, L.A.; Crump, B.C.; Prahl, F.G.; Baptista, A.M.; Campbell, V.; Warnick, R.; Selby, M.; Roegner, G.C.; et al. Myrionecta rubra population genetic diversity and its cryptophyte chloroplast specificity in recurrent red tides in the Columbia River estuary. Aquat. Microb. Ecol. 2011, 62, 85–97. [Google Scholar] [CrossRef]
  39. Johnson, M.D.; Beaudoin, D.J.; Laza-Martínez, A.; Dyhrman, S.T.; Fensin, E.; Lin, S.; Merculief, A.; Nagai, S.; Pompeu, M.; Setälä, O. The genetic diversity of Mesodinium and associated Cryptophytes. Front. Microbiol. 2016, 7, 2017. [Google Scholar] [CrossRef] [PubMed]
  40. Kim, H.S.; Kim, Y.G.; Yang, J.S.; Yih, W. Comparative population dynamics of photosynthetic ciliate Mesodinium rubrum (=Myrionecta rubra) in Gomso Bay and the Geum River Estuary, Korea. Sea J. Korean Soc. Oceanogr. 2004, 9, 164–172, (In Korean with English Abstract). [Google Scholar]
  41. Yoo, Y.D.; Seong, K.A.; Myung, G.; Kim, H.S.; Jeong, H.J.; Palenik, B.; Yih, W. Ingestion of the unicellular cyanobacterium Synechococcus by the mixotrophic red tide ciliate Mesodinium rubrum. Algae 2015, 30, 281–290. [Google Scholar] [CrossRef]
  42. Yih, W.; Kim, H.S.; Jeong, H.A.; Myung, G.; Kim, Y.G. Ingestion of cryptophyte cells by the marine photosynthetic ciliate Mesodinium rubrum. Aquat. Microb. Ecol. 2004, 36, 165–170. [Google Scholar] [CrossRef]
  43. Myung, G.; Yih, W.; Kim, H.S.; Park, J.S.; Cho, B.C. Ingestion of bacterial cells by the marine photosynthetic ciliate Myrionecta rubra. Aquat. Microb. Ecol. 2006, 44, 175–180. [Google Scholar] [CrossRef]
  44. Johnson, M.D.; Tengs, T.; Oldach, D.; Stoecker, D.K. Sequestration, performance, and functional control of cryptophyte plastids in the ciliate Myrionecta rubra (Ciliophora). J. Phycol. 2006, 42, 1235–1246. [Google Scholar] [CrossRef]
  45. Park, J.S.; Myung, G.; Kim, H.S.; Cho, B.C.; Yih, W. Growth responses of the marine photosynthetic ciliate Myrionecta rubra to different cryptomonad strains. Aquat. Microb. Ecol. 2007, 48, 83–90. [Google Scholar] [CrossRef]
  46. Nishitani, G.; Nagai, S.; Baba, K.; Kiyokawa, S.; Kosaka, Y.; Miyamura, K.; Nishikawa, T.; Sakurada, K.; Shinada, A.; Kamiyama, T. High-level congruence of Myrionecta rubra prey and Dinophysis species plastid identities as revealed by genetic analyses of isolates from Japanese coastal waters. Appl. Environ. Microbiol. 2010, 76, 2791–2798. [Google Scholar] [CrossRef]
  47. Myung, G.; Kim, H.S.; Park, J.W.; Park, J.S.; Yih, W. Sequestered plastids in Mesodinium rubrum are functionally active up to 80 days of phototrophic growth without cryptomonad prey. Harmful Algae 2013, 27, 82–87. [Google Scholar] [CrossRef]
  48. Myung, G.O.; Kim, H.S.; Jang, K.G.; Park, J.W.; Yih, W.H. Importance of the mixotrophic ciliate Myrionecta rubra in marine ecosystems. Sea Korean Soc. Oceanogr. 2007, 12, 178–185, (In Korean with English Abstract). [Google Scholar]
  49. Kim, H.S. Population Dynamics and Environmental Conditions for the Continuous Growth of the Phototrophic Ciliate, Mesodinium rubrum in Korean West Coast. Ph.D. Thesis, Graduate School, Kunsan National Crob. Ecol., Gunsan, Republic of Korea, 2002. (In Korean with English Abstract). [Google Scholar]
  50. Herfort, L.; Peterson, T.D.; Prahl, F.G.; McCue, L.A.; Needoba, J.A.; Crump, B.C.; Roegner, G.C.; Campbell, V.; Zuber, P. Red Waters of Myrionecta rubra are Biogeochemical Hotspots for the Columbia River Estuary with Impacts on Primary/Secondary Productions and Nutrient Cycles. Estuaries Coasts 2012, 35, 878–891. [Google Scholar] [CrossRef]
  51. Johnson, M.D.; Stoecker, D.K.; Marshall, H.G. Seasonal dynamics of Mesodinium rubrum in Chesapeake Bay. J. Plankton Res. 2013, 35, 877–893. [Google Scholar] [CrossRef]
  52. Lee, E.; Son, M.; Kim, J.B.; Lee, W.C.; Jeon, G.E.; Lee, S.H. A study of variation characteristics of the phytoplankton community by UPLC located in the Jinju Bay, Korea. Korean J. Environ. Biol. 2018, 36, 62–72, (In Korean with English Abstract). [Google Scholar] [CrossRef]
  53. Kang, J.-J.; Min, J.-O.; Kim, Y.; Lee, C.-H.; Yoo, H.; Jang, H.-K.; Kim, M.-J.; Oh, H.-J.; Lee, S.-H. Vertical Distribution of Phytoplankton Community and Pigment Production in the Yellow Sea and the East China Sea during the Late Summer Season. Water 2021, 13, 3321. [Google Scholar] [CrossRef]
  54. Noh, I.H.; Yoon, Y.H.; Park, J.S.; Kang, I.S.; An, Y.K.; Kim, S.H. Seasonal fluctuations of marine environment and phytoplankton community in the southern part of Yeosu, southern sea of Korea. J. Korean Soc. Mar. Environ. Energy 2010, 13, 151–164. [Google Scholar]
  55. Kudela, R.M.; Gobler, C.J. Harmful dinoflagellate blooms caused by Cochlodinium sp.: Global expansion and ecological strategies facilitating bloom formation. Harmful Algae 2012, 14, 71–86. [Google Scholar] [CrossRef]
  56. Lim, W.A.; Jung, C.S.; Lee, C.K.; Cho, Y.C.; Lee, S.G.; Kim, H.G.; Chung, I.K. The outbreak, maintenance and decline of the red tide dominated by Cochlodinium polykrikoides in the coastal waters off southern Korea from August to October, 2000. Korean Soc. Oceanogr. 2002, 7, 68–77. [Google Scholar]
  57. Lim, W.; Lee, Y.S.; Park, J.G. Characteristics of Cochlodinium polykrikoides bloom in southeast coastal waters of Korea, 2008. The Sea. Korean Soc. Oceanogr. 2009, 14, 155–162, (In Korean with English Abstract). [Google Scholar]
  58. Kim, H.C.; Lee, C.K.; Lee, S.G.; Kim, H.G.; Park, C.K. Physico-chemical factors on the growth of Cochlodinium polykrikoides and nutrient utilization. J. Korean Fish. Soc. 2001, 34, 445–456, (In Korean with English Abstract). [Google Scholar]
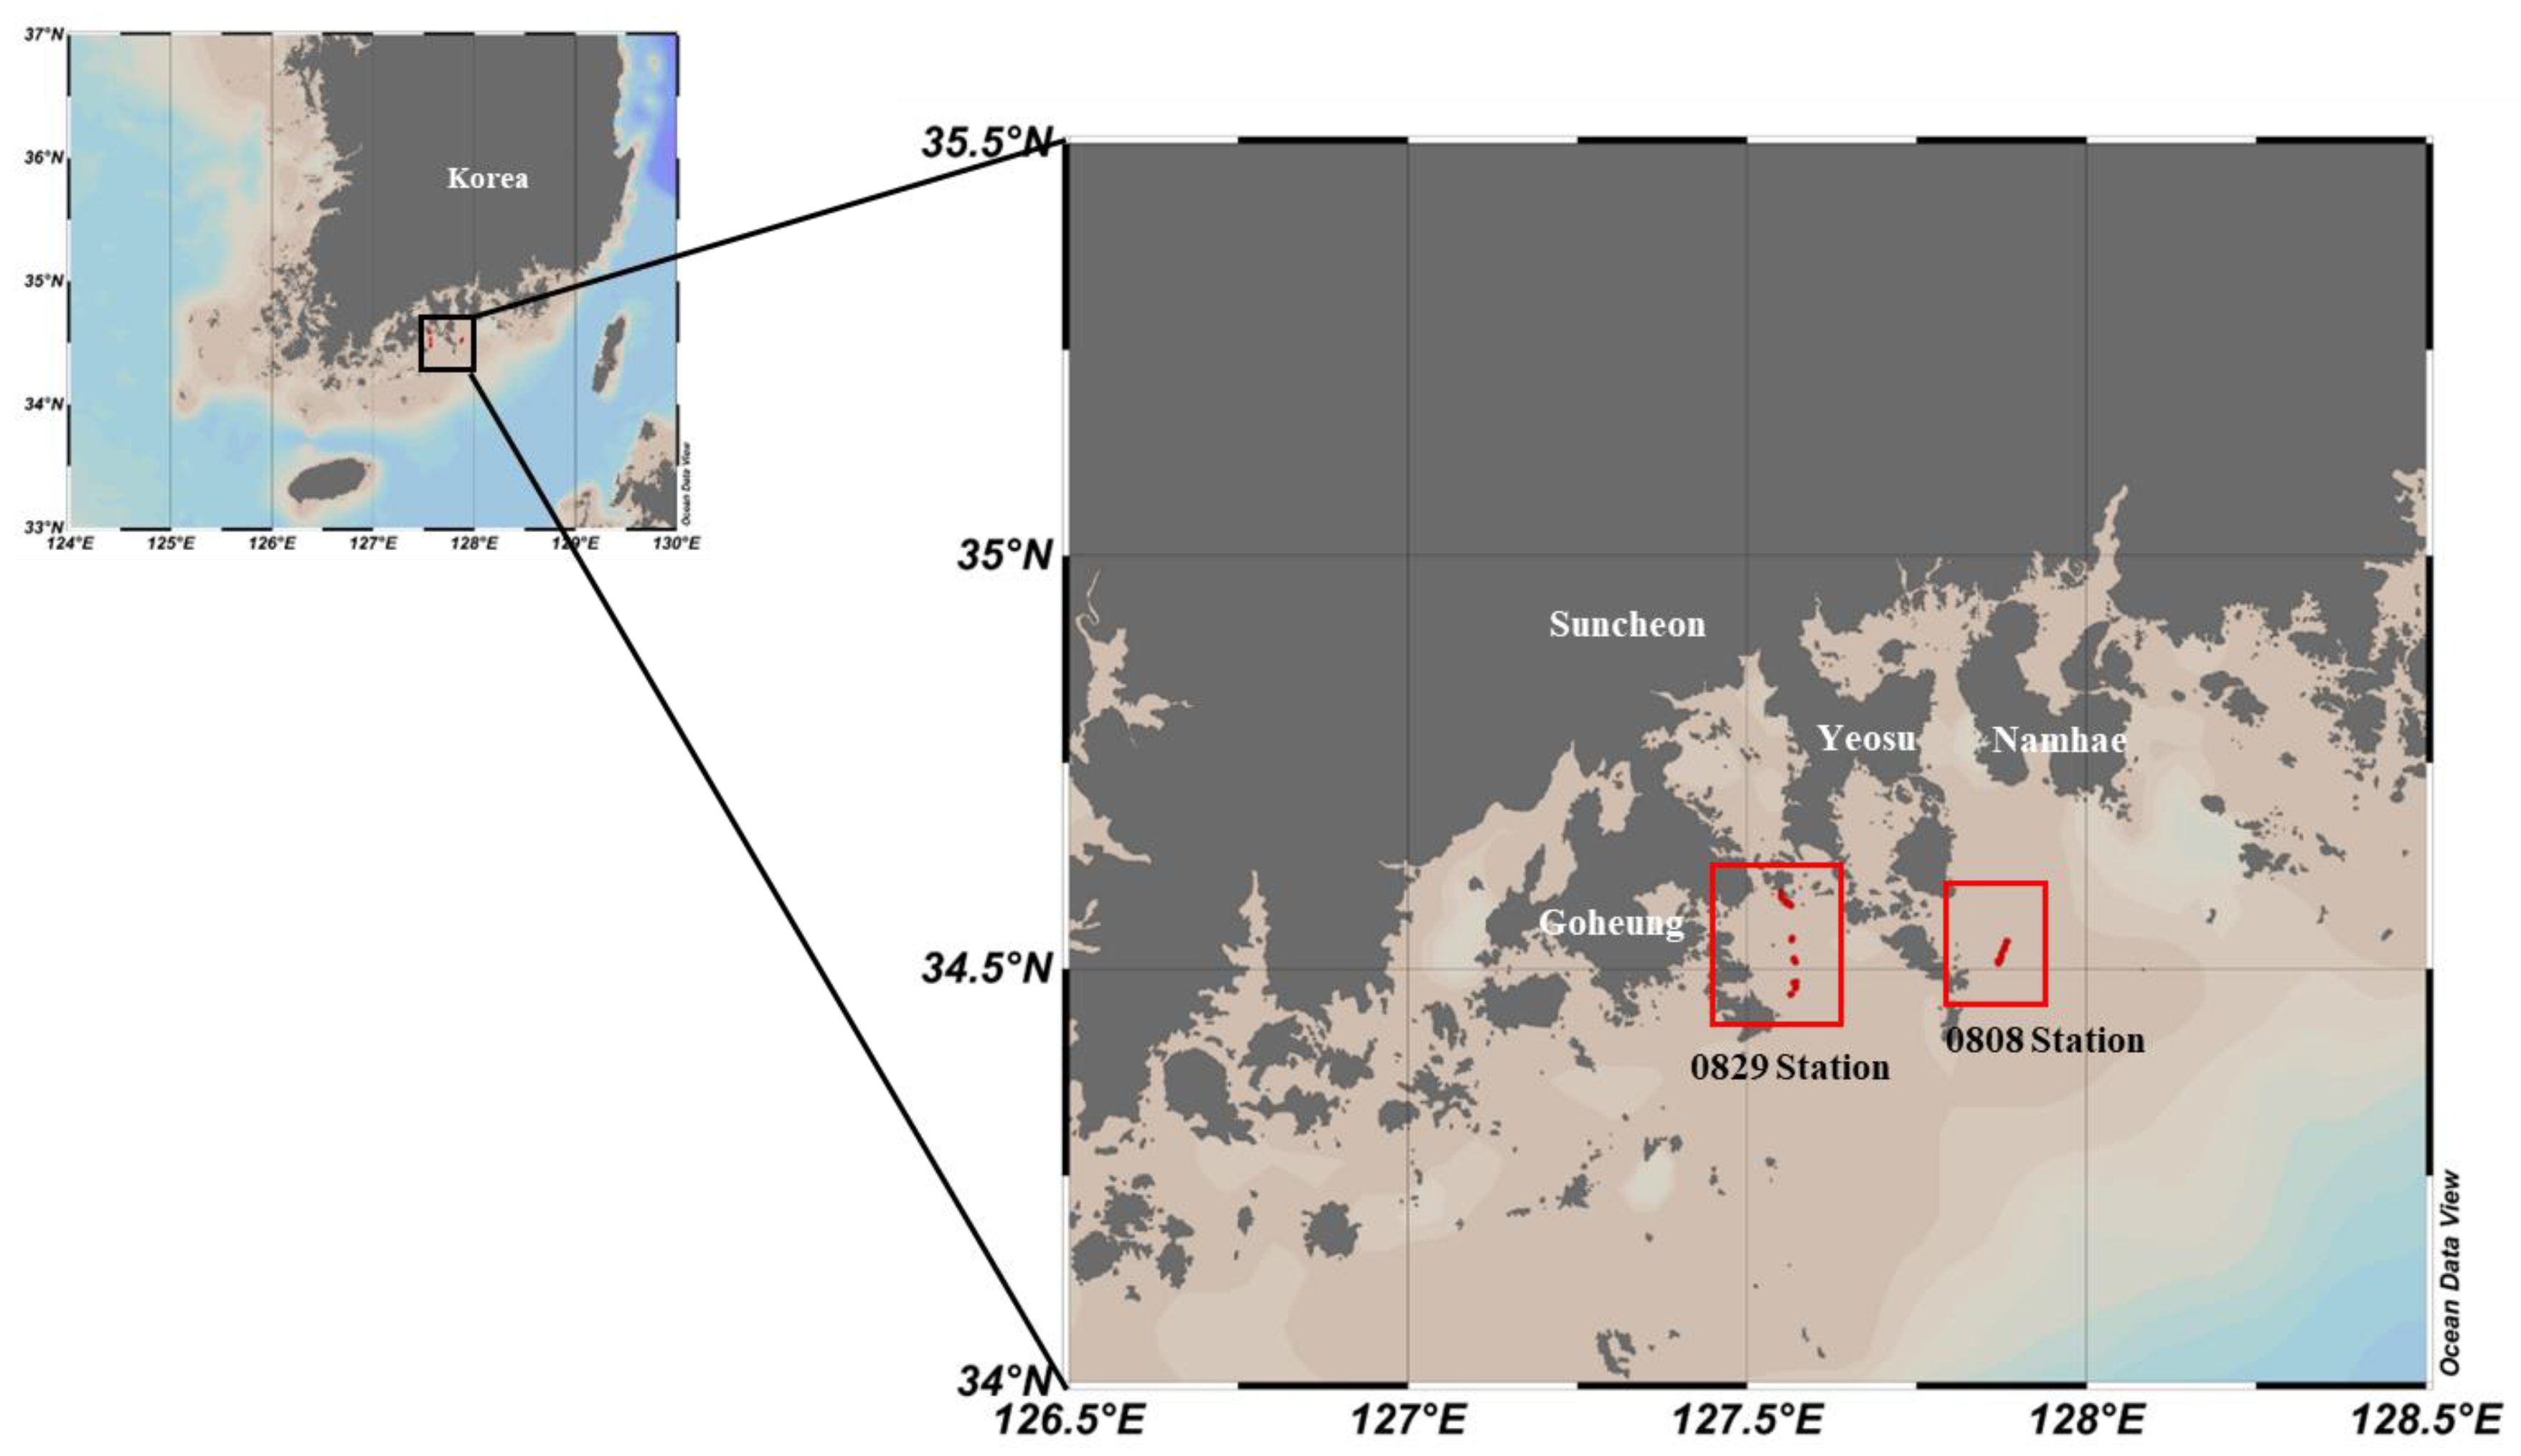
Figure 1. Sampling stations in the southern coastal waters of Korea during the two field campaigns on 8 August and 29 August 2022.
Water 15 03050 g001
Figure 2. Cell abundances of major phytoplankton species in the southern coastal waters of Korea during the study periods on (a) 8 August 2022 and (b) 29 August 2022. L. danicus: Leptocylindrus danicus.
Water 15 03050 g002
Figure 3. Relative contributions of phytoplankton communities and chlorophyll a concentrations in the southern coastal waters of Korea during the study periods on (a) 8 August 2022 and (b) 29 August 2022. The line graph indicates the chlorophyll a concentration in each field campaign.
Water 15 03050 g003
Figure 4. Comparison of (a) concentrations and (b) relative abundances of phytoplankton compositions between non-peak and peak stations in the southern coastal waters of South Korea during the first field campaign on 8 August 2022.
Water 15 03050 g004
Figure 5. Comparison of (a) concentrations and (b) relative abundances of phytoplankton compositions between non-peak and peak stations in the southern coastal waters of Korea during the second field campaign on 29 August 2022.
Water 15 03050 g005
Figure 6. Linear relationships between the cell abundance of M. rubrum obtained from microscopic counting and (a) HPLC-derived alloxanthin pigment concentration and (b) CHEMTAX-derived cryptophyte concentration on 8 August 2022 (** p < 0.01).
Water 15 03050 g006
Figure 7. Linear relationships between the cell abundance of M. polykrikoides obtained from microscopic counting and (a) HPLC-derived peridinin concentration and (b) CHEMTAX-derived dinoflagellate concentration on 29 August 2022 (** p < 0.01).
Water 15 03050 g007
Table 1. Description of the sampling sites in the southern coastal waters of Korea for each sampling period in 2022. (-) indicates no data.
DayStationLatitudeLongitudeDepthTemperature (°C)SPM
(g/m3)
chl-a
(µg/L)
Dominant Species (%)
8 August 2022A1-134.5335127.882525.526.88.41615.413L. danicus (79.6)
A1-234.5335127.883525.526.84.0789.114L. danicus (92.8)
A2-134.5274127.8802--19.52229.925M. rubrum (99.2)
A3-134.5241127.878926.827.010.01617.944M. rubrum (96.6)
A3-234.5241127.878226.827.022.77054.802M. rubrum (97.2)
A4-134.5181127.874826.527.06.71617.302L. danicus (73.0)
A4-234.5140127.874226.527.035.77235.189L. danicus (49.7)
A4-334.5141127.874328.027.033.58852.021L. danicus (58.5)
A5-134.5125127.873428.527.036.01277.447M. rubrum (82.9)
A5-234.5125127.873728.527.026.264130.540M. rubrum (57.8)
A6-134.5107127.872929.027.230.86470.024M. rubrum (89.1)
A6-234.5101127.872429.027.223.86447.033M. rubrum (91.6)
A6-334.5094127.869629.027.210.24017.845M. rubrum (45.8)
A6-434.5092127.869529.027.28.17416.672M. rubrum (75.6)
A7-134.5078127.870529.027.022.64063.398M. rubrum (99.0)
A7-234.5070127.870130.027.023.91650.484M. rubrum (94.9)
29 August 2022Y0134.5934127.549913.023.15.99313.368M. polykrikoides (97.7)
Y0234.5876127.549916.023.59.1334.200M. polykrikoides (100.0)
Y0334.5854127.550916.023.56.10023.836M. polykrikoides (100.0)
Y0434.5817127.557216.023.66.56730.934M. polykrikoides (100.0)
Y0534.5802127.558116.023.76.06715.601M. polykrikoides (98.7)
Y0634.5793127.5583--7.1004.755M. polykrikoides (70.0)
Y0734.5792127.560715.023.715.53357.675M. polykrikoides (99.8)
Y0834.5789127.563014.523.84.1676.760M. polykrikoides (96.2)
Y0934.5765127.564814.223.88.46755.109M. polykrikoides (99.8)
Y1034.5374127.566212.324.16.73352.662M. polykrikoides (100.0)
Y1134.5350127.565812.224.111.40019.618M. polykrikoides (95.7)
Y1234.5122127.5688--11.467144.047M. polykrikoides (99.9)
Y1334.5112127.569212.0249.06753.884M. polykrikoides (96.7)
Y1434.5086127.5713--14.267197.619M. polykrikoides (99.5)
Y1534.4779127.571612.02414.733161.699M. polykrikoides (100.0)
Y1634.4767127.5711--7.33350.790M. polykrikoides (100.0)
Y1734.4695127.565211.724.16.20067.441M. polykrikoides (99.7)
Y1834.4692127.5642--4.86719.871M. polykrikoides (98.3)
Y1934.4844127.572511.82422.4678.795M. polykrikoides (95.1)
Y2034.4832127.568311.823.825.9338.764M. polykrikoides (88.7)
Notes: SPM, suspended particulate matter; chl-a, chlorophyll a.
Disclaimer/Publisher’s Note: The statements, opinions and data contained in all publications are solely those of the individual author(s) and contributor(s) and not of MDPI and/or the editor(s). MDPI and/or the editor(s) disclaim responsibility for any injury to people or property resulting from any ideas, methods, instructions or products referred to in the content.