
Temporal and Spatial Analysis of Water Resources under the Influence of Coal Mining: A Case Study of Yangquan Basin, China
 and
and
Abstract
:1. Introduction
2. Materials and Methods
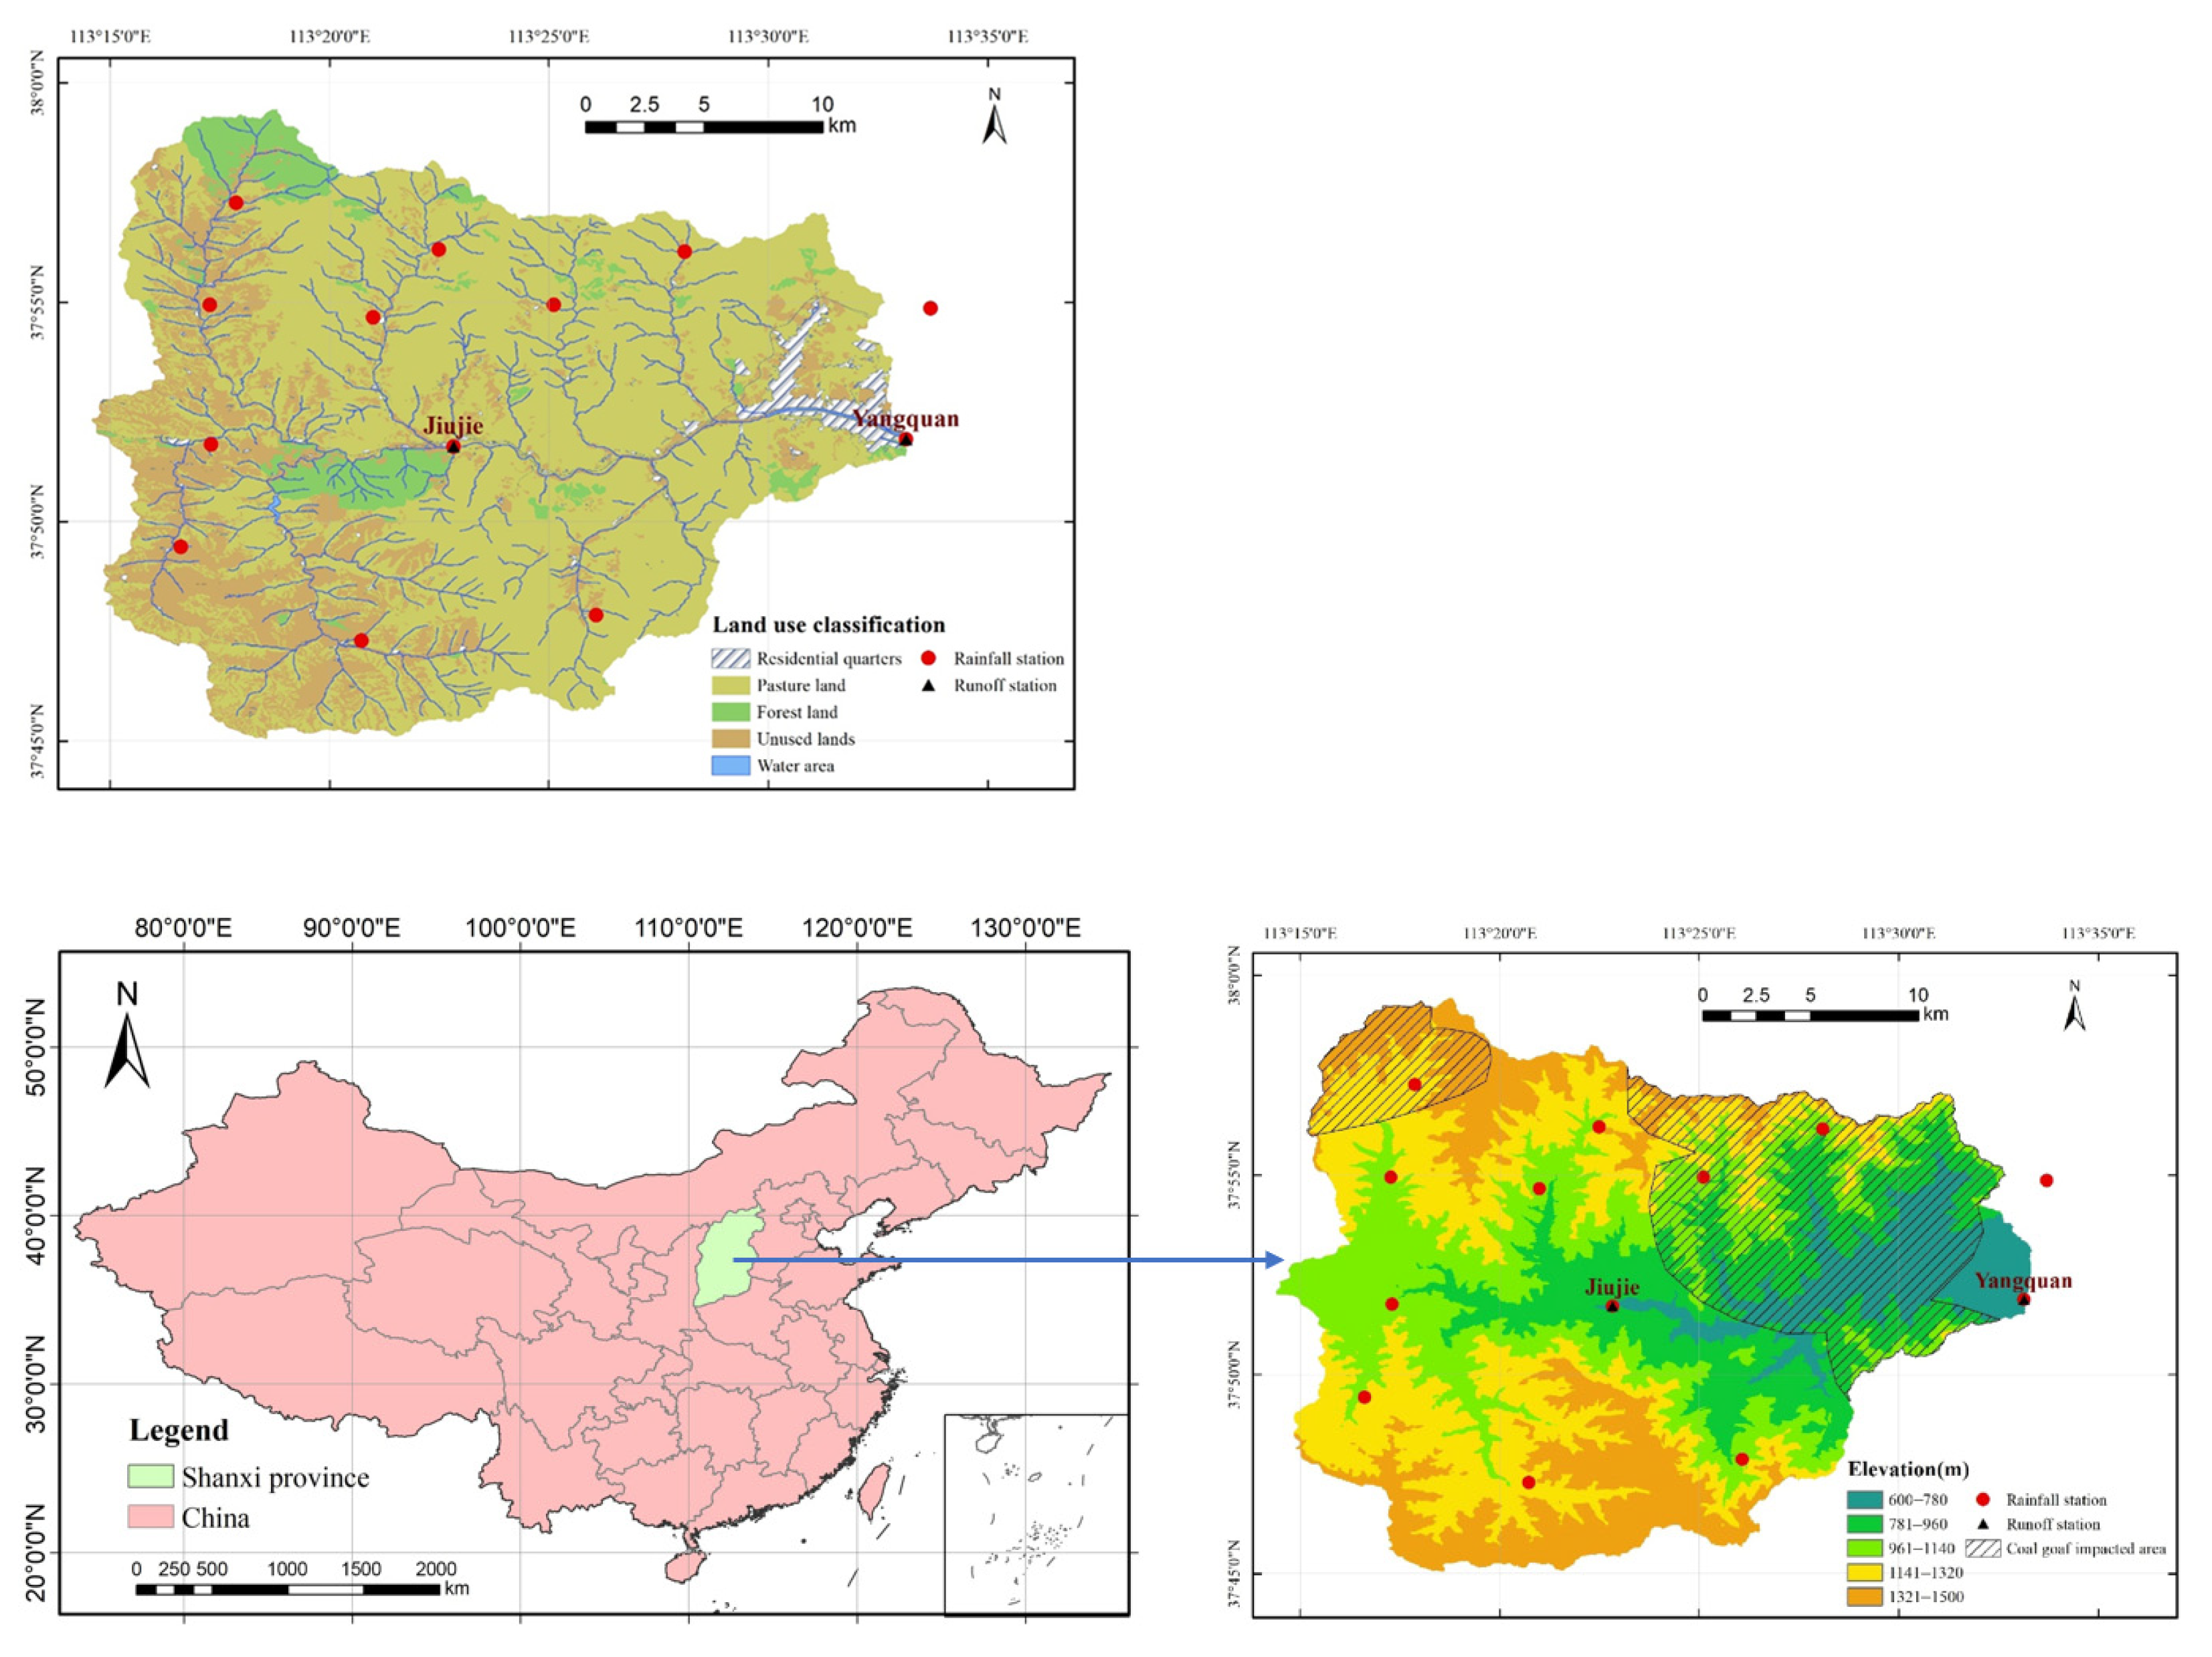
2.1. Study Area
2.2. Modeling Approach
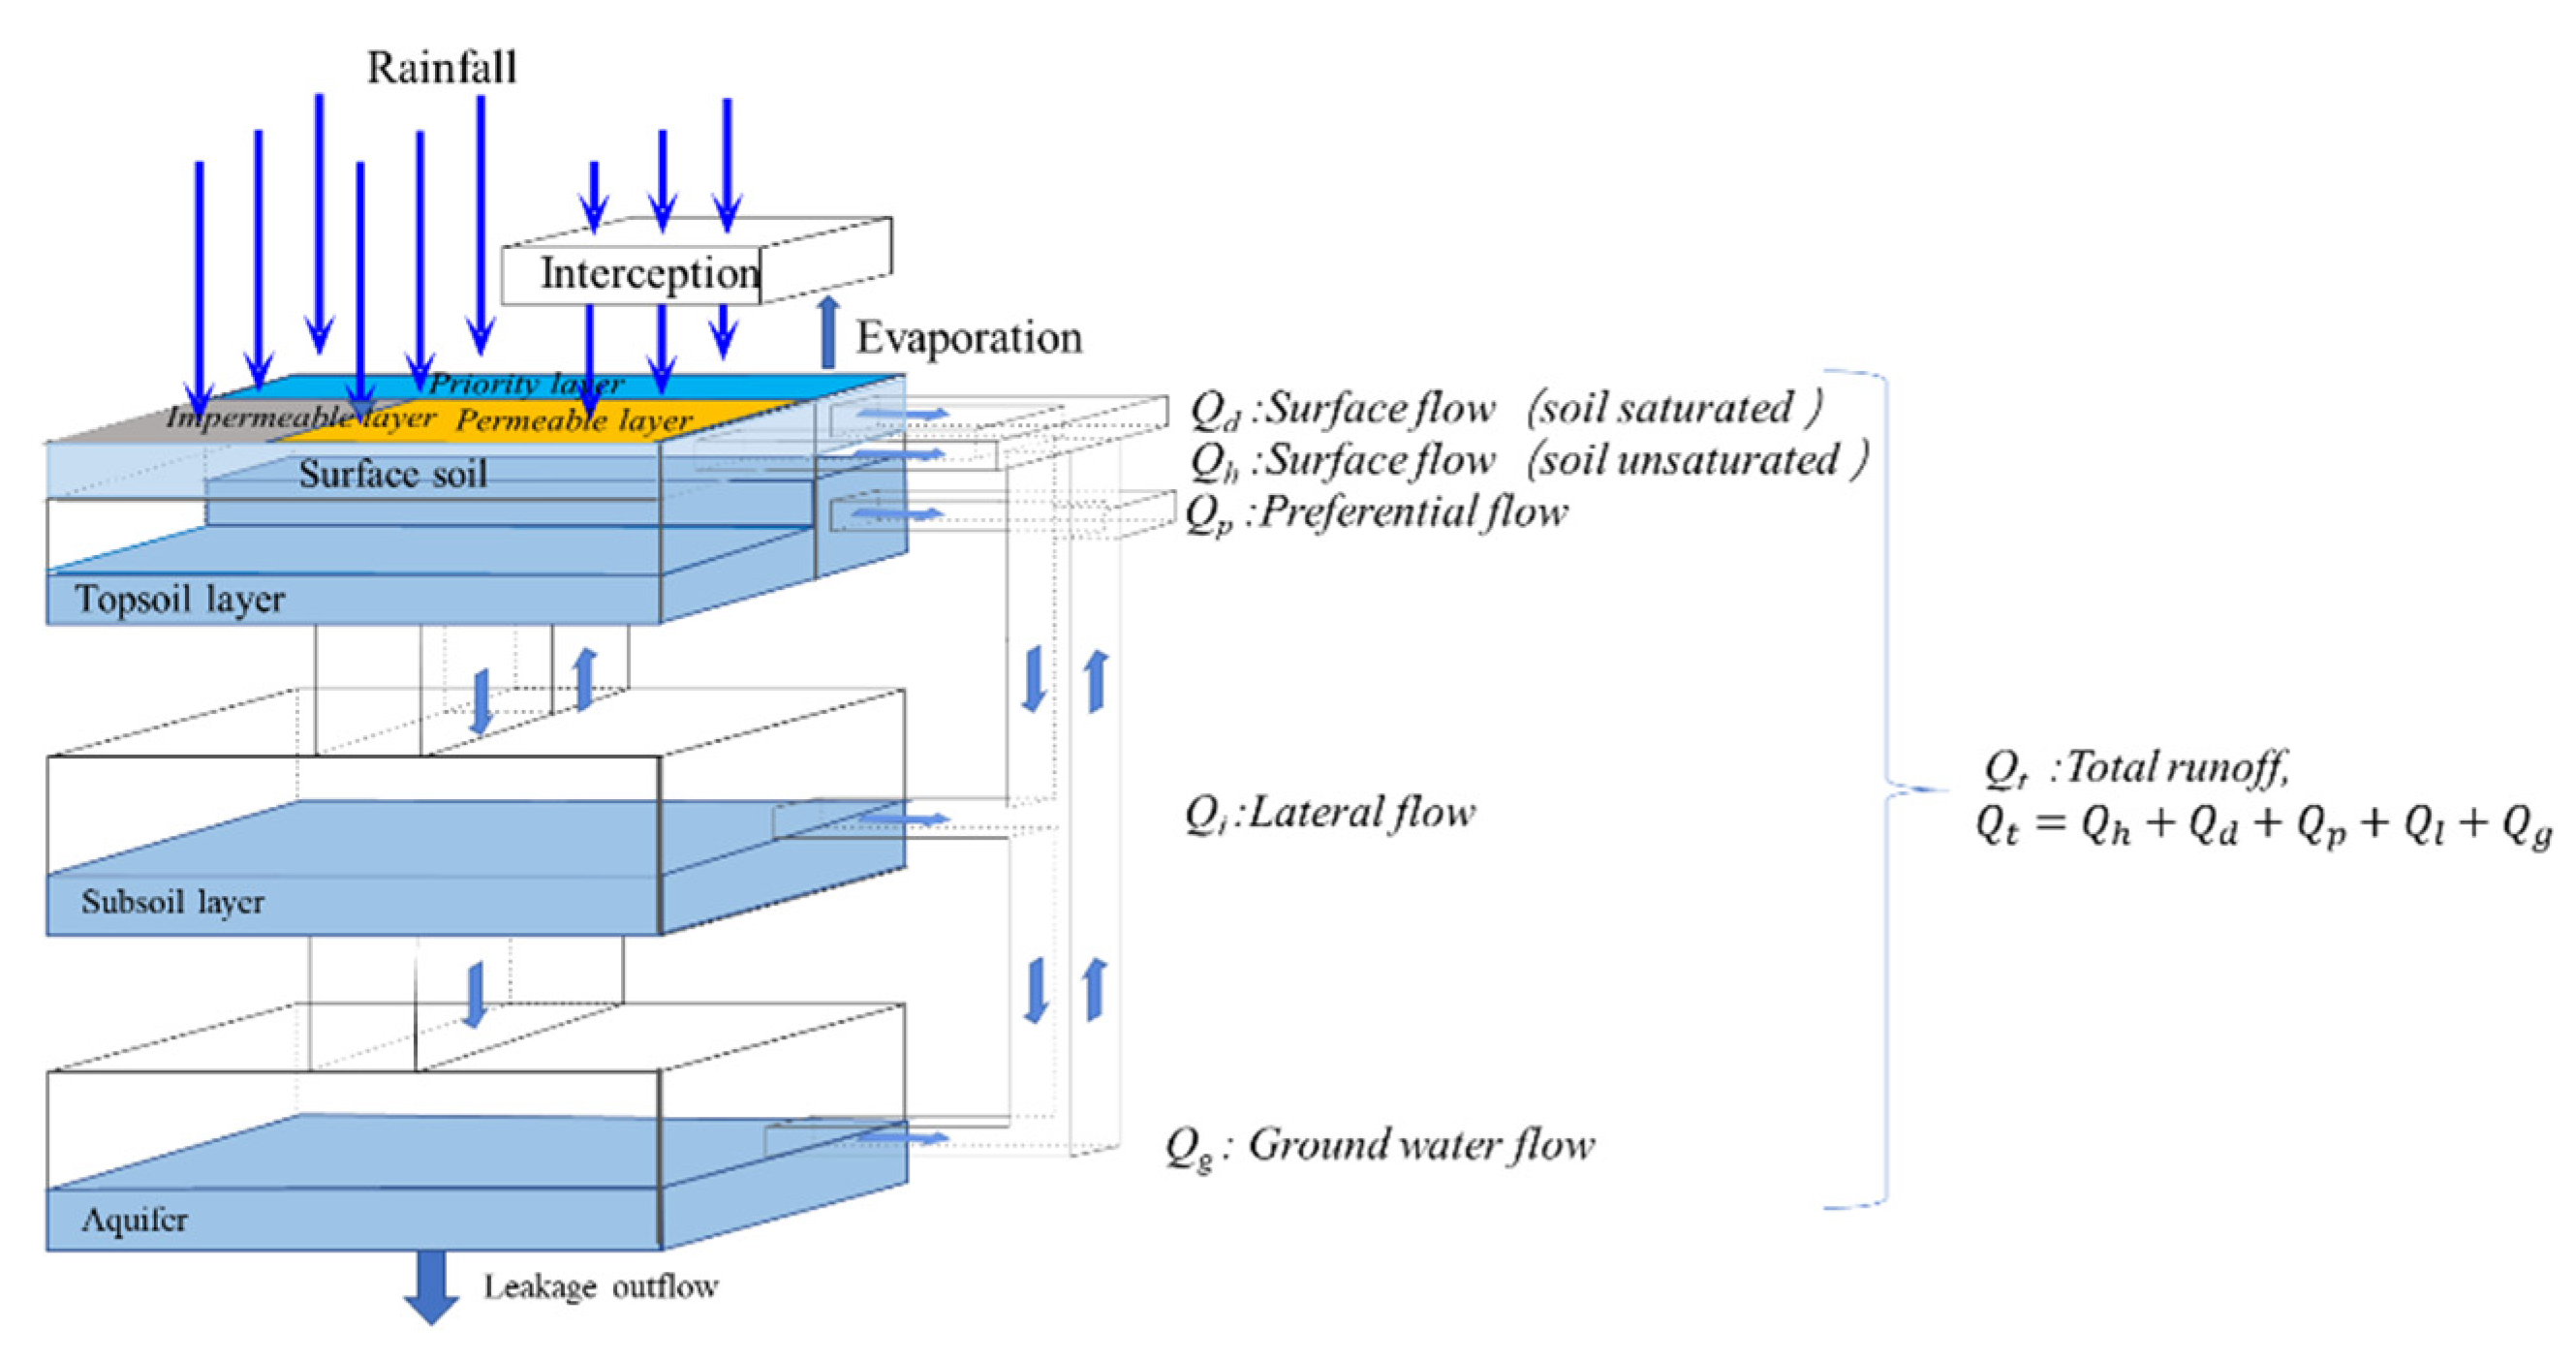
2.2.1. SVSMR Model
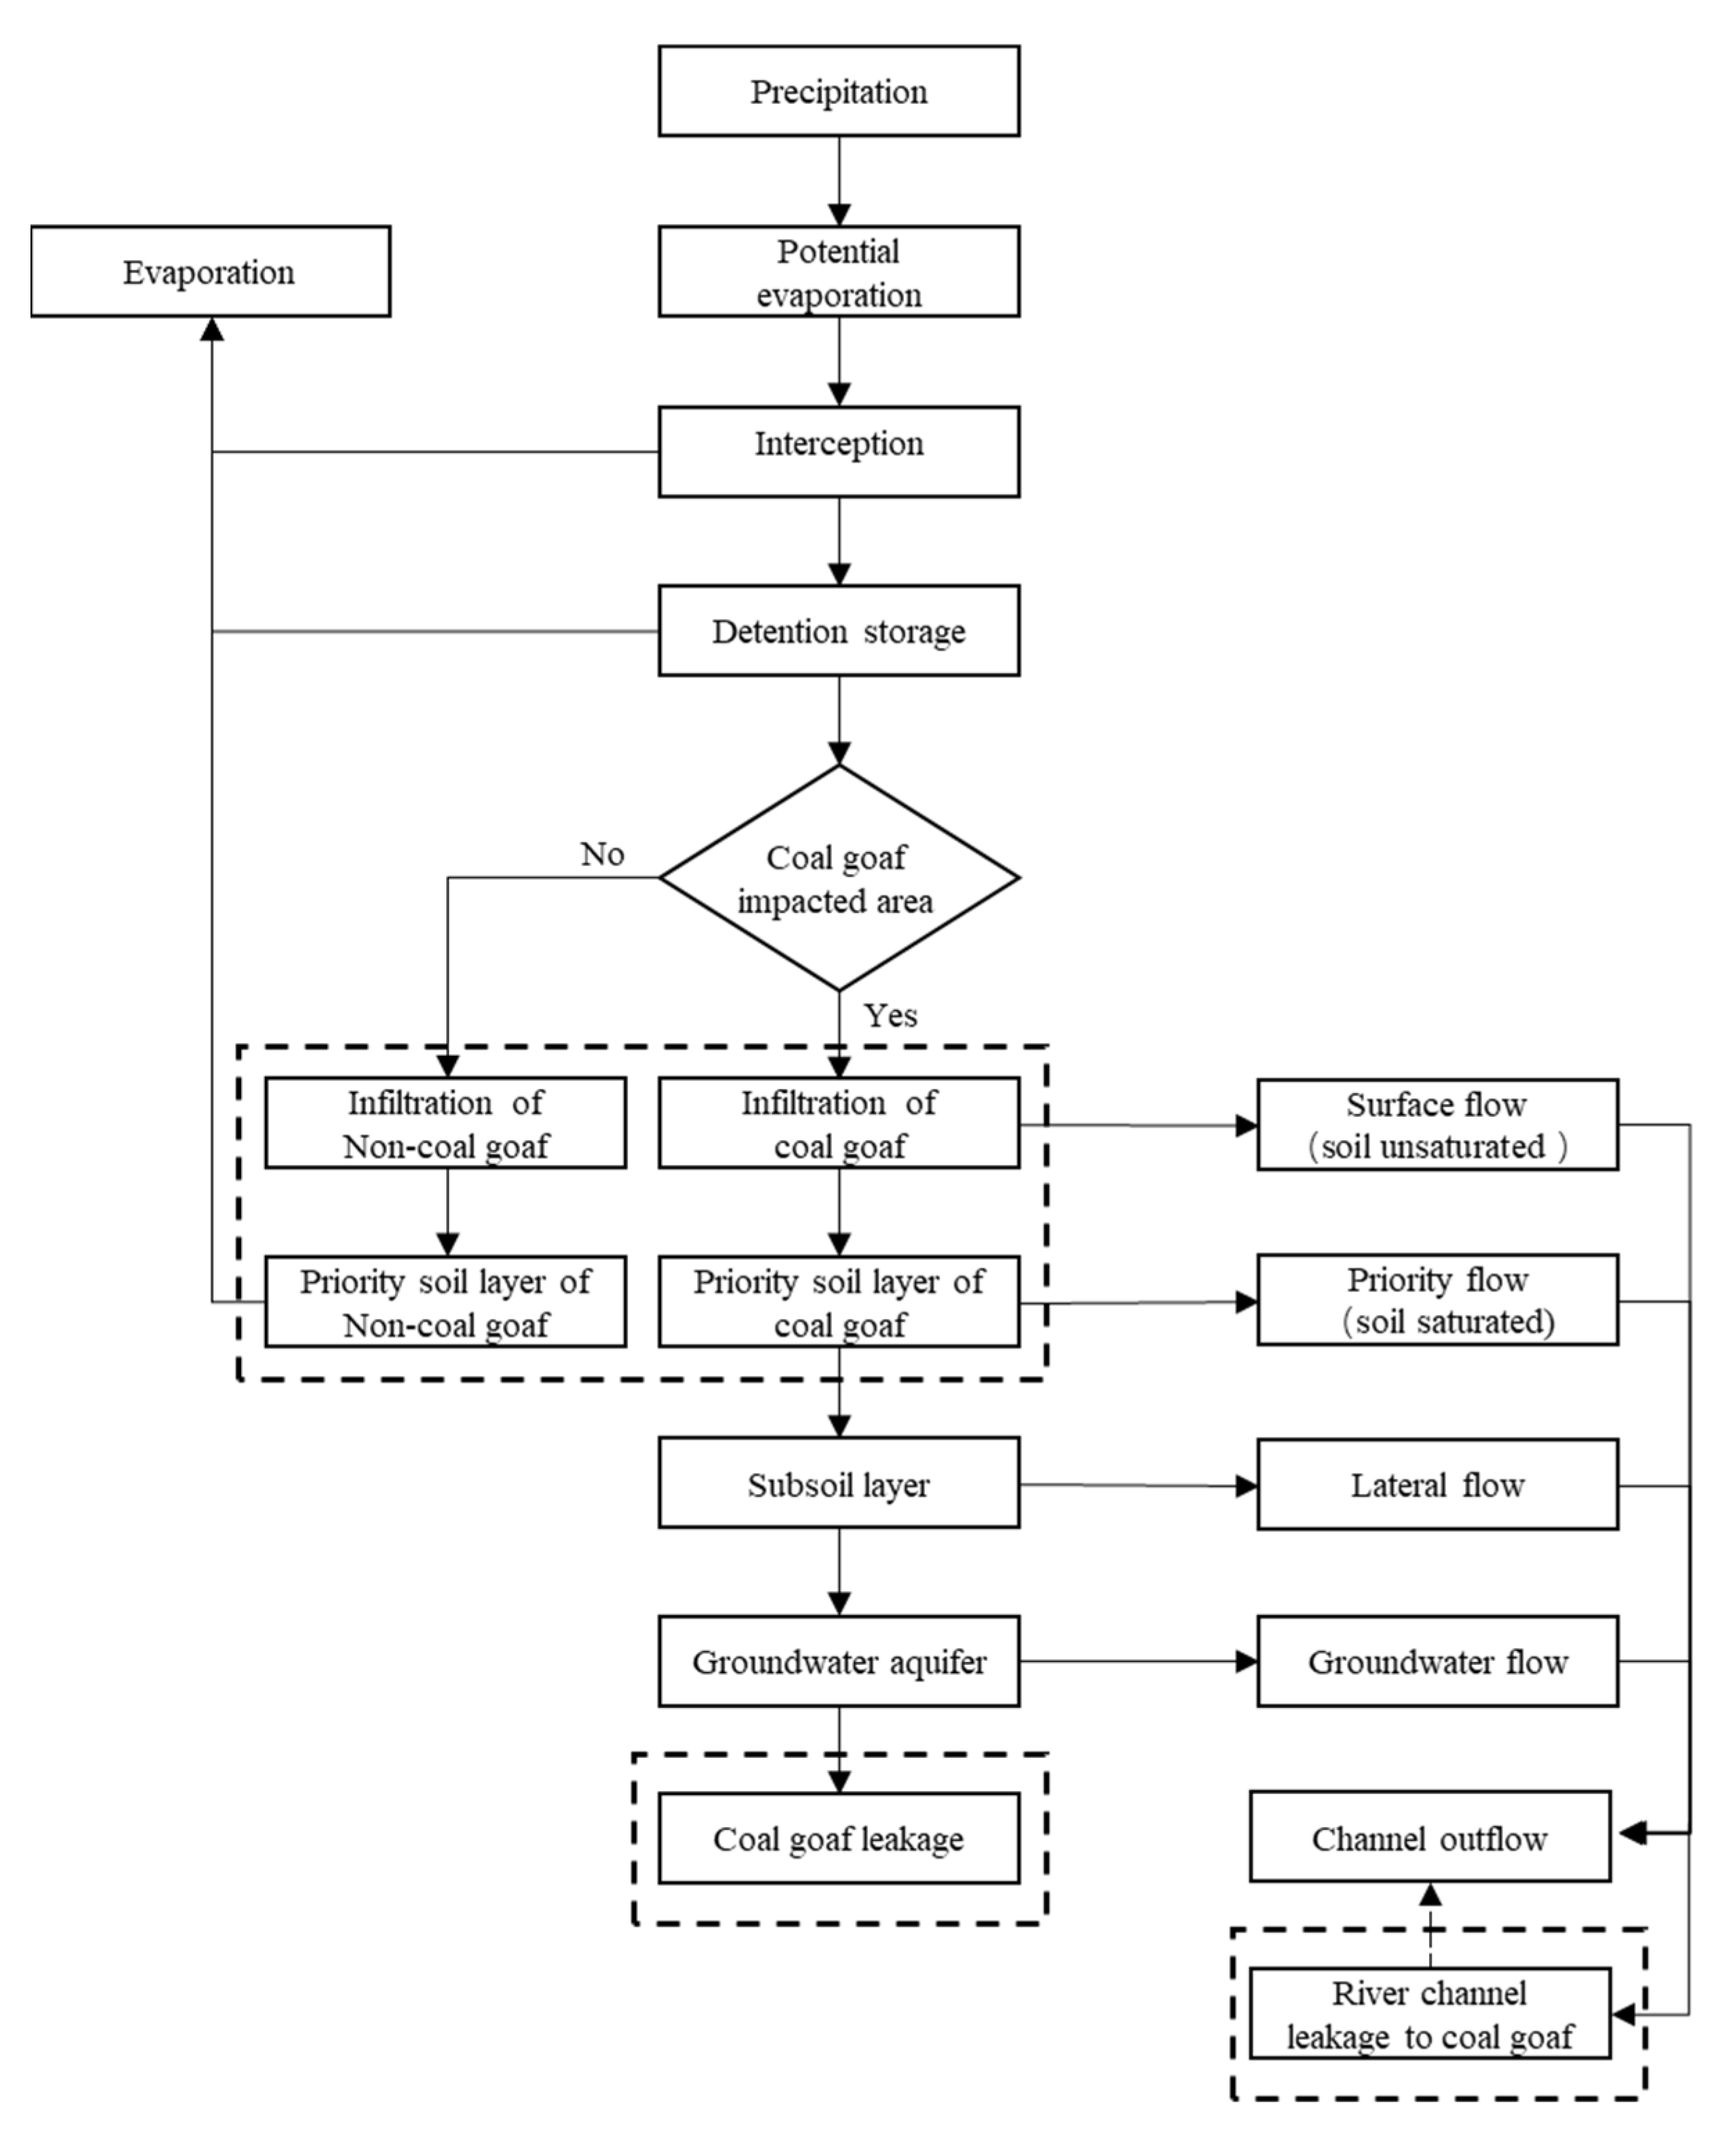
2.2.2. Model Improvement
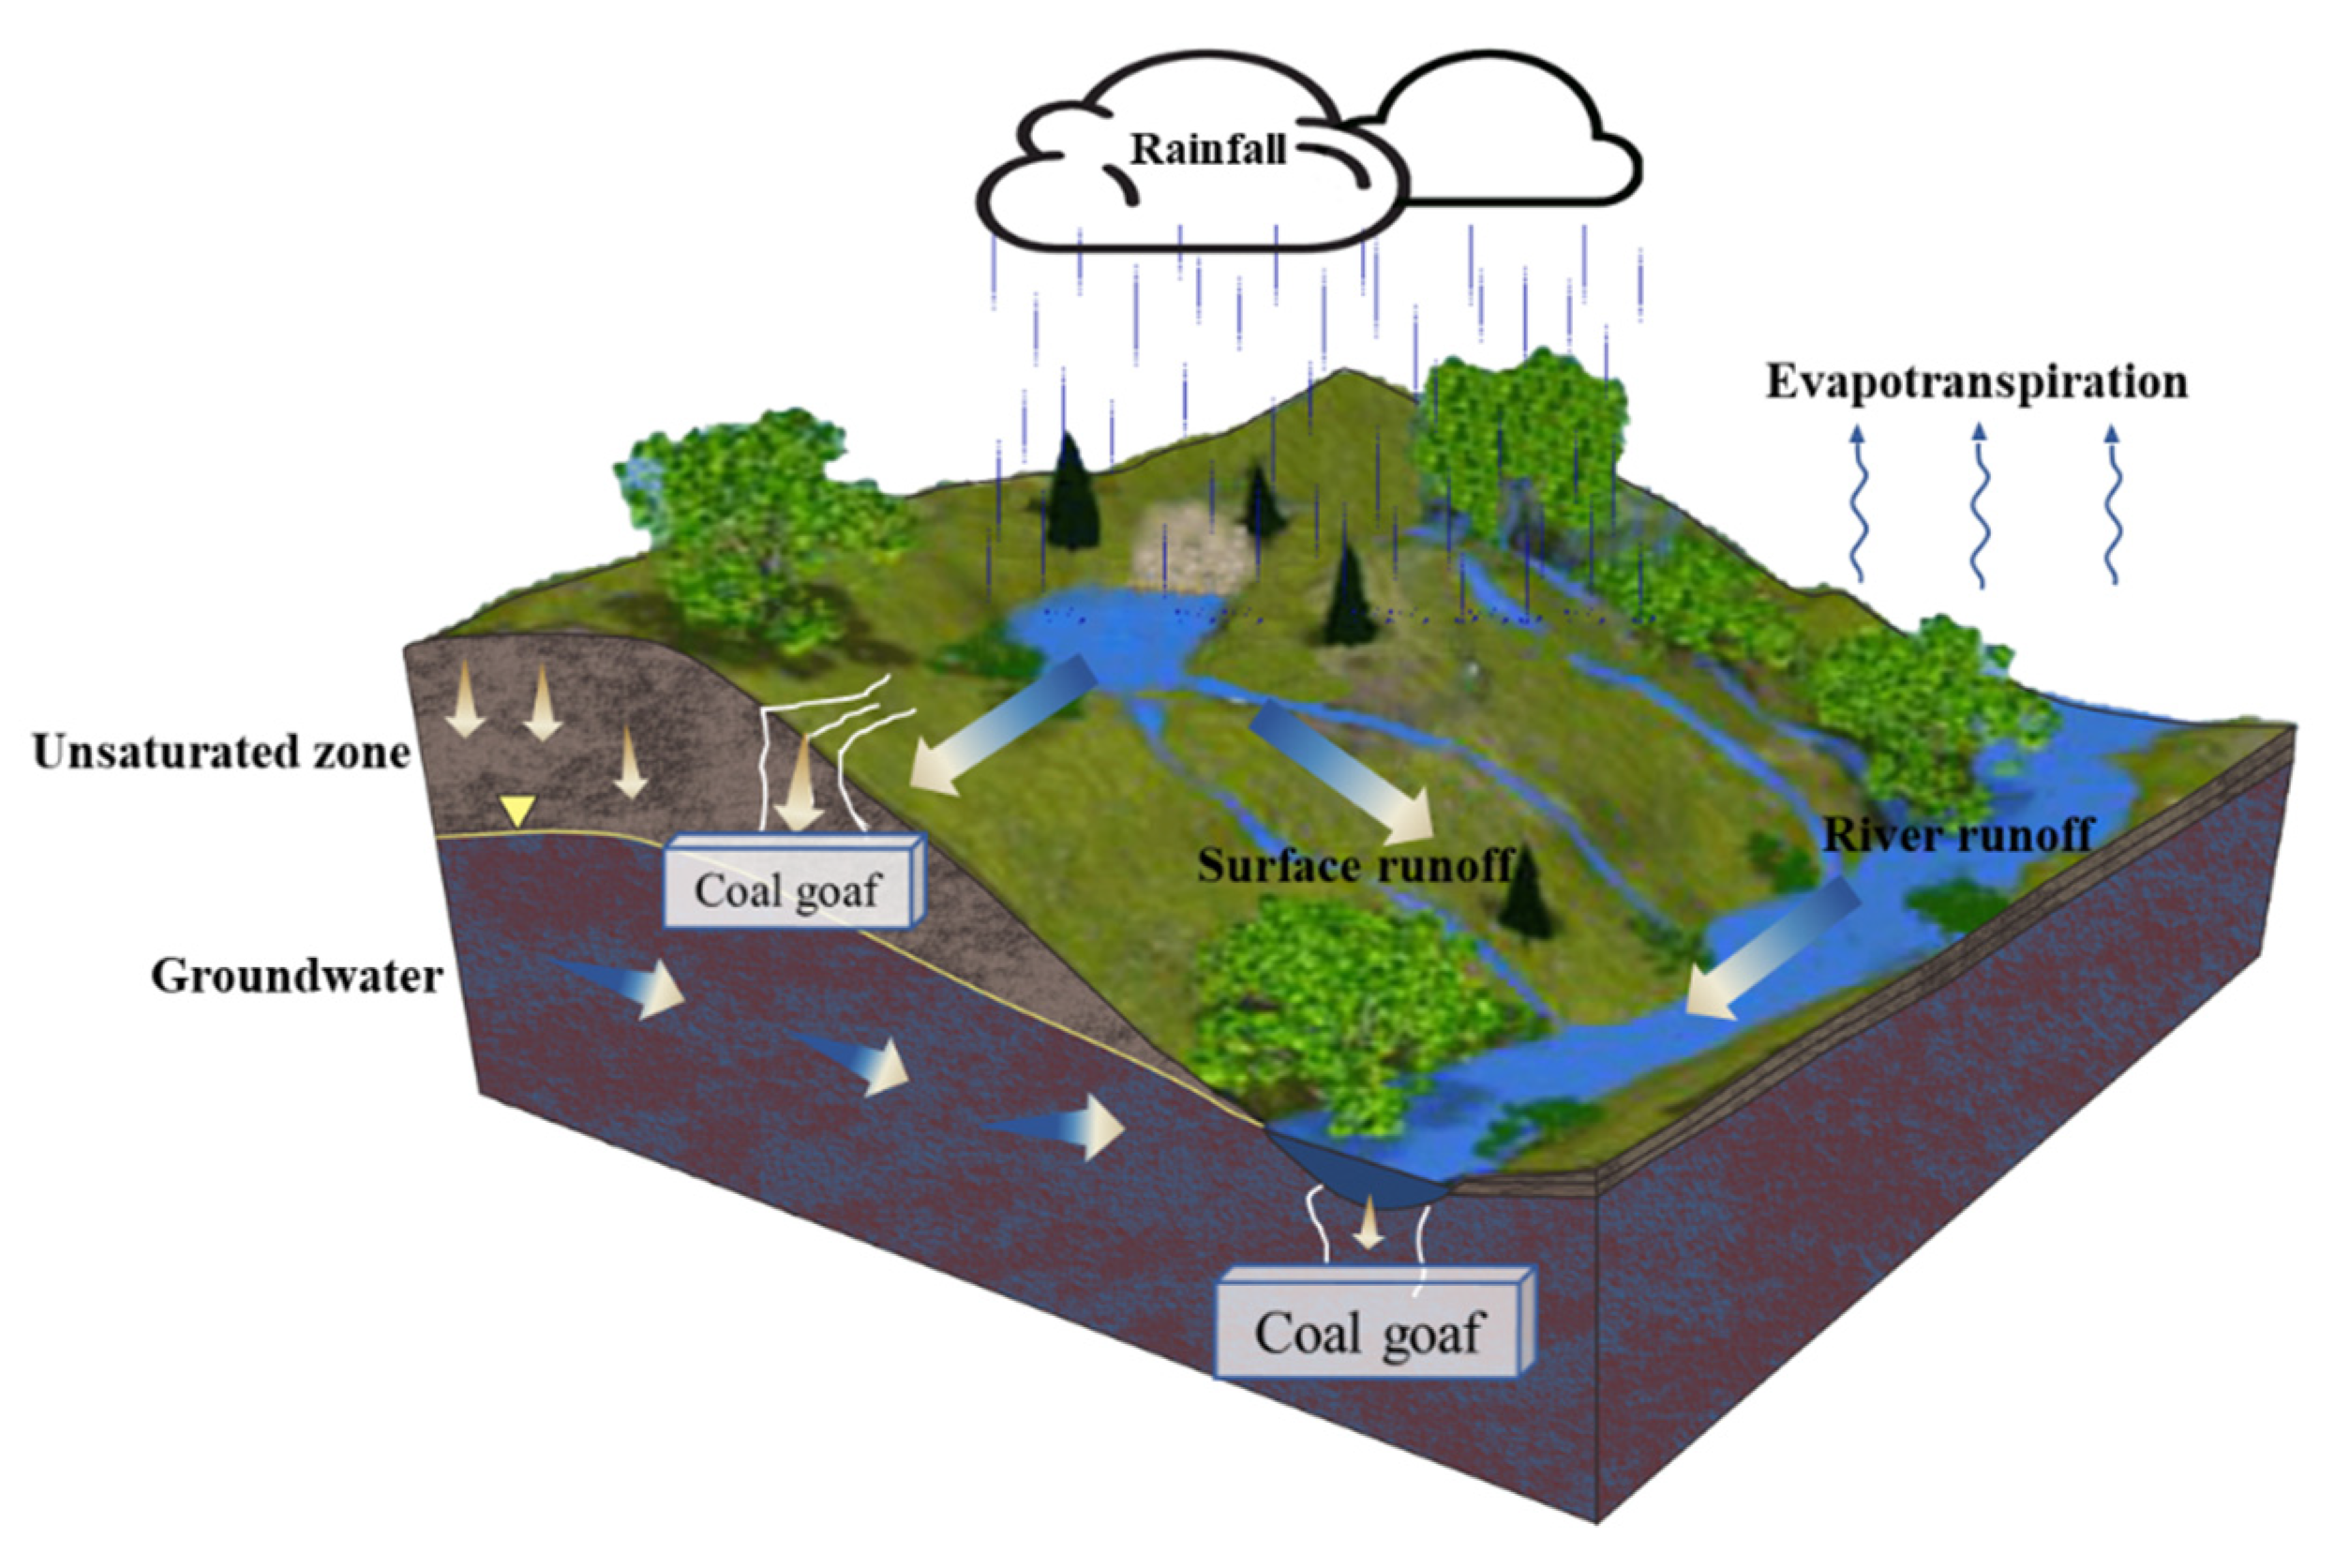
- When the goaf area is located under the land surface:
- 2.
- When the goaf area is located under the riverbed:
2.3. Modeling Setup
2.3.1. Validation of the Improved Model
2.3.2. Scenario Analysis
- Scenario 1: 2009–2018 mining area and reduce 5% rainfall in 2009–2018
- Scenario 2: 2009–2018 mining area and reduce 10% rainfall in 2009–2018
- Scenario 3: 2009–2018 mining area and increase 5% rainfall in 2009–2018
- Scenario 4: 2009–2018 mining area and increase 10% rainfall in 2009–2018
- Scenario 5: 2009–2018 rainfall and reduce 5% mining area in 2009–2018
- Scenario 6: 2009–2018 rainfall and reduce 10% mining area in 2009–2018
- Scenario 7: 2009–2018 rainfall and increase 5% mining area in 2009–2018
- Scenario 8: 2009–2018 rainfall and increase 10% mining area in 2009–2018
3. Results
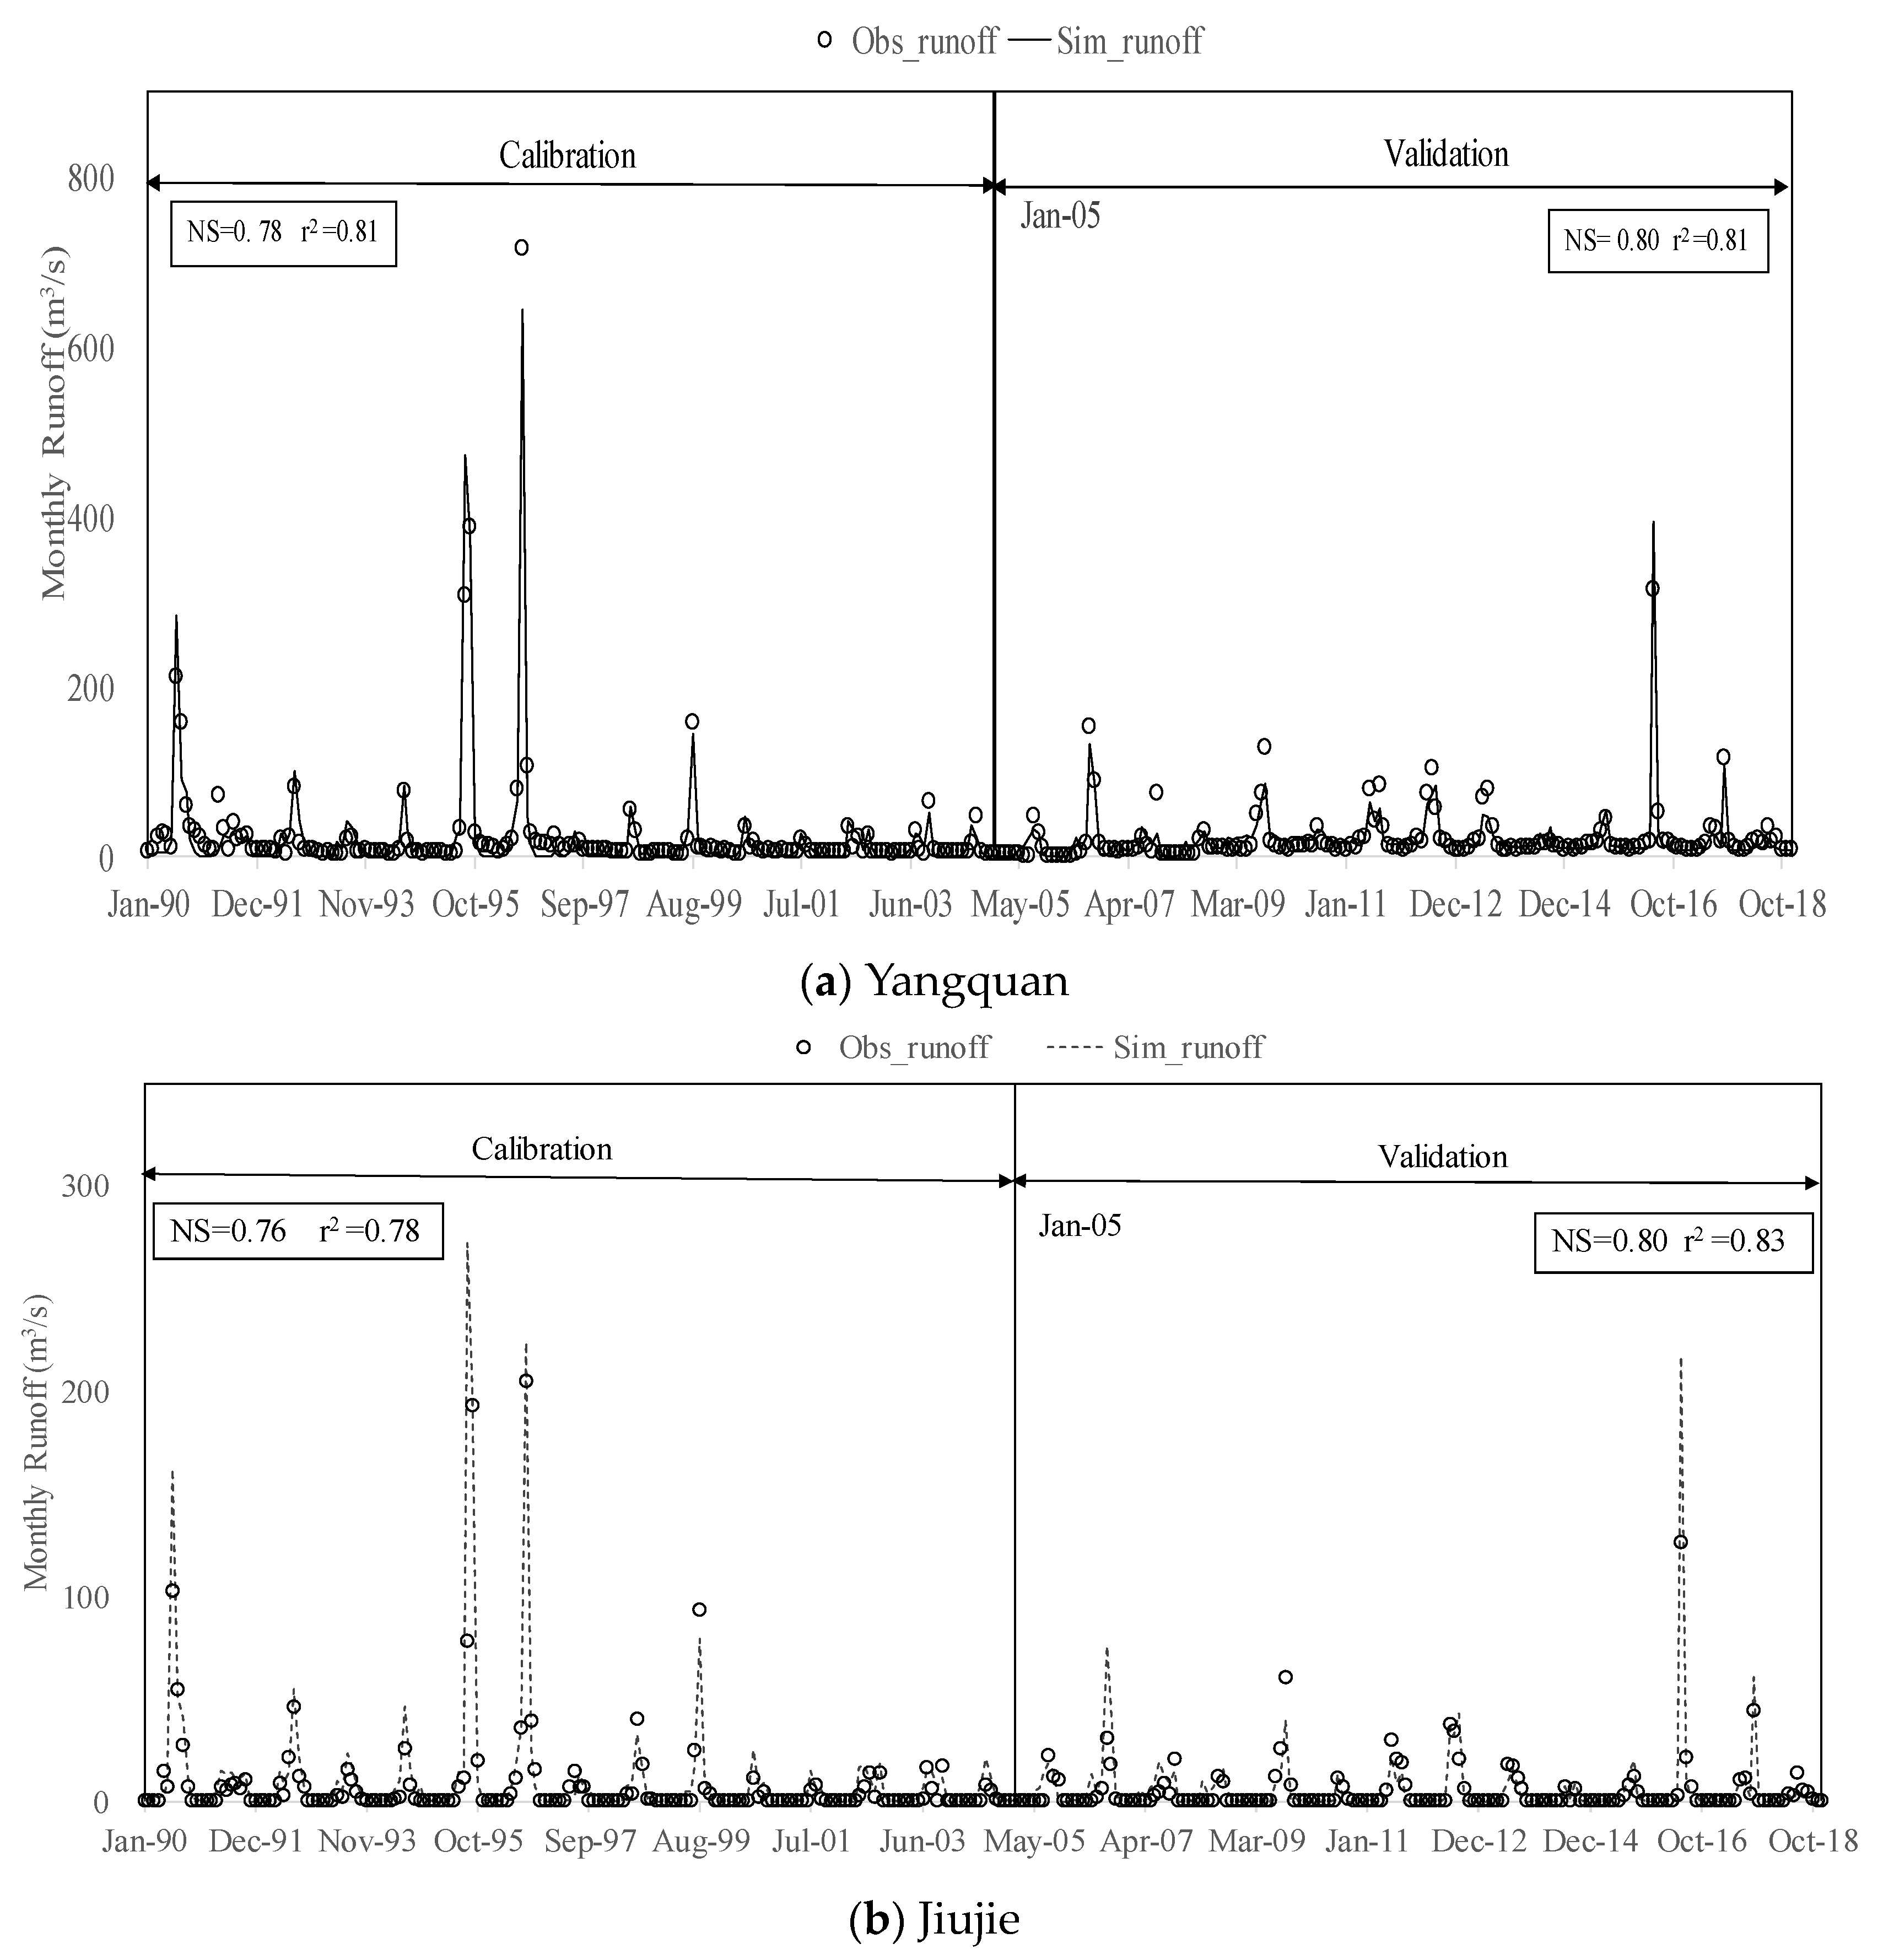
3.1. Model Calibration and Validation
3.2. Time–Space Response of Runoff under Scenarios
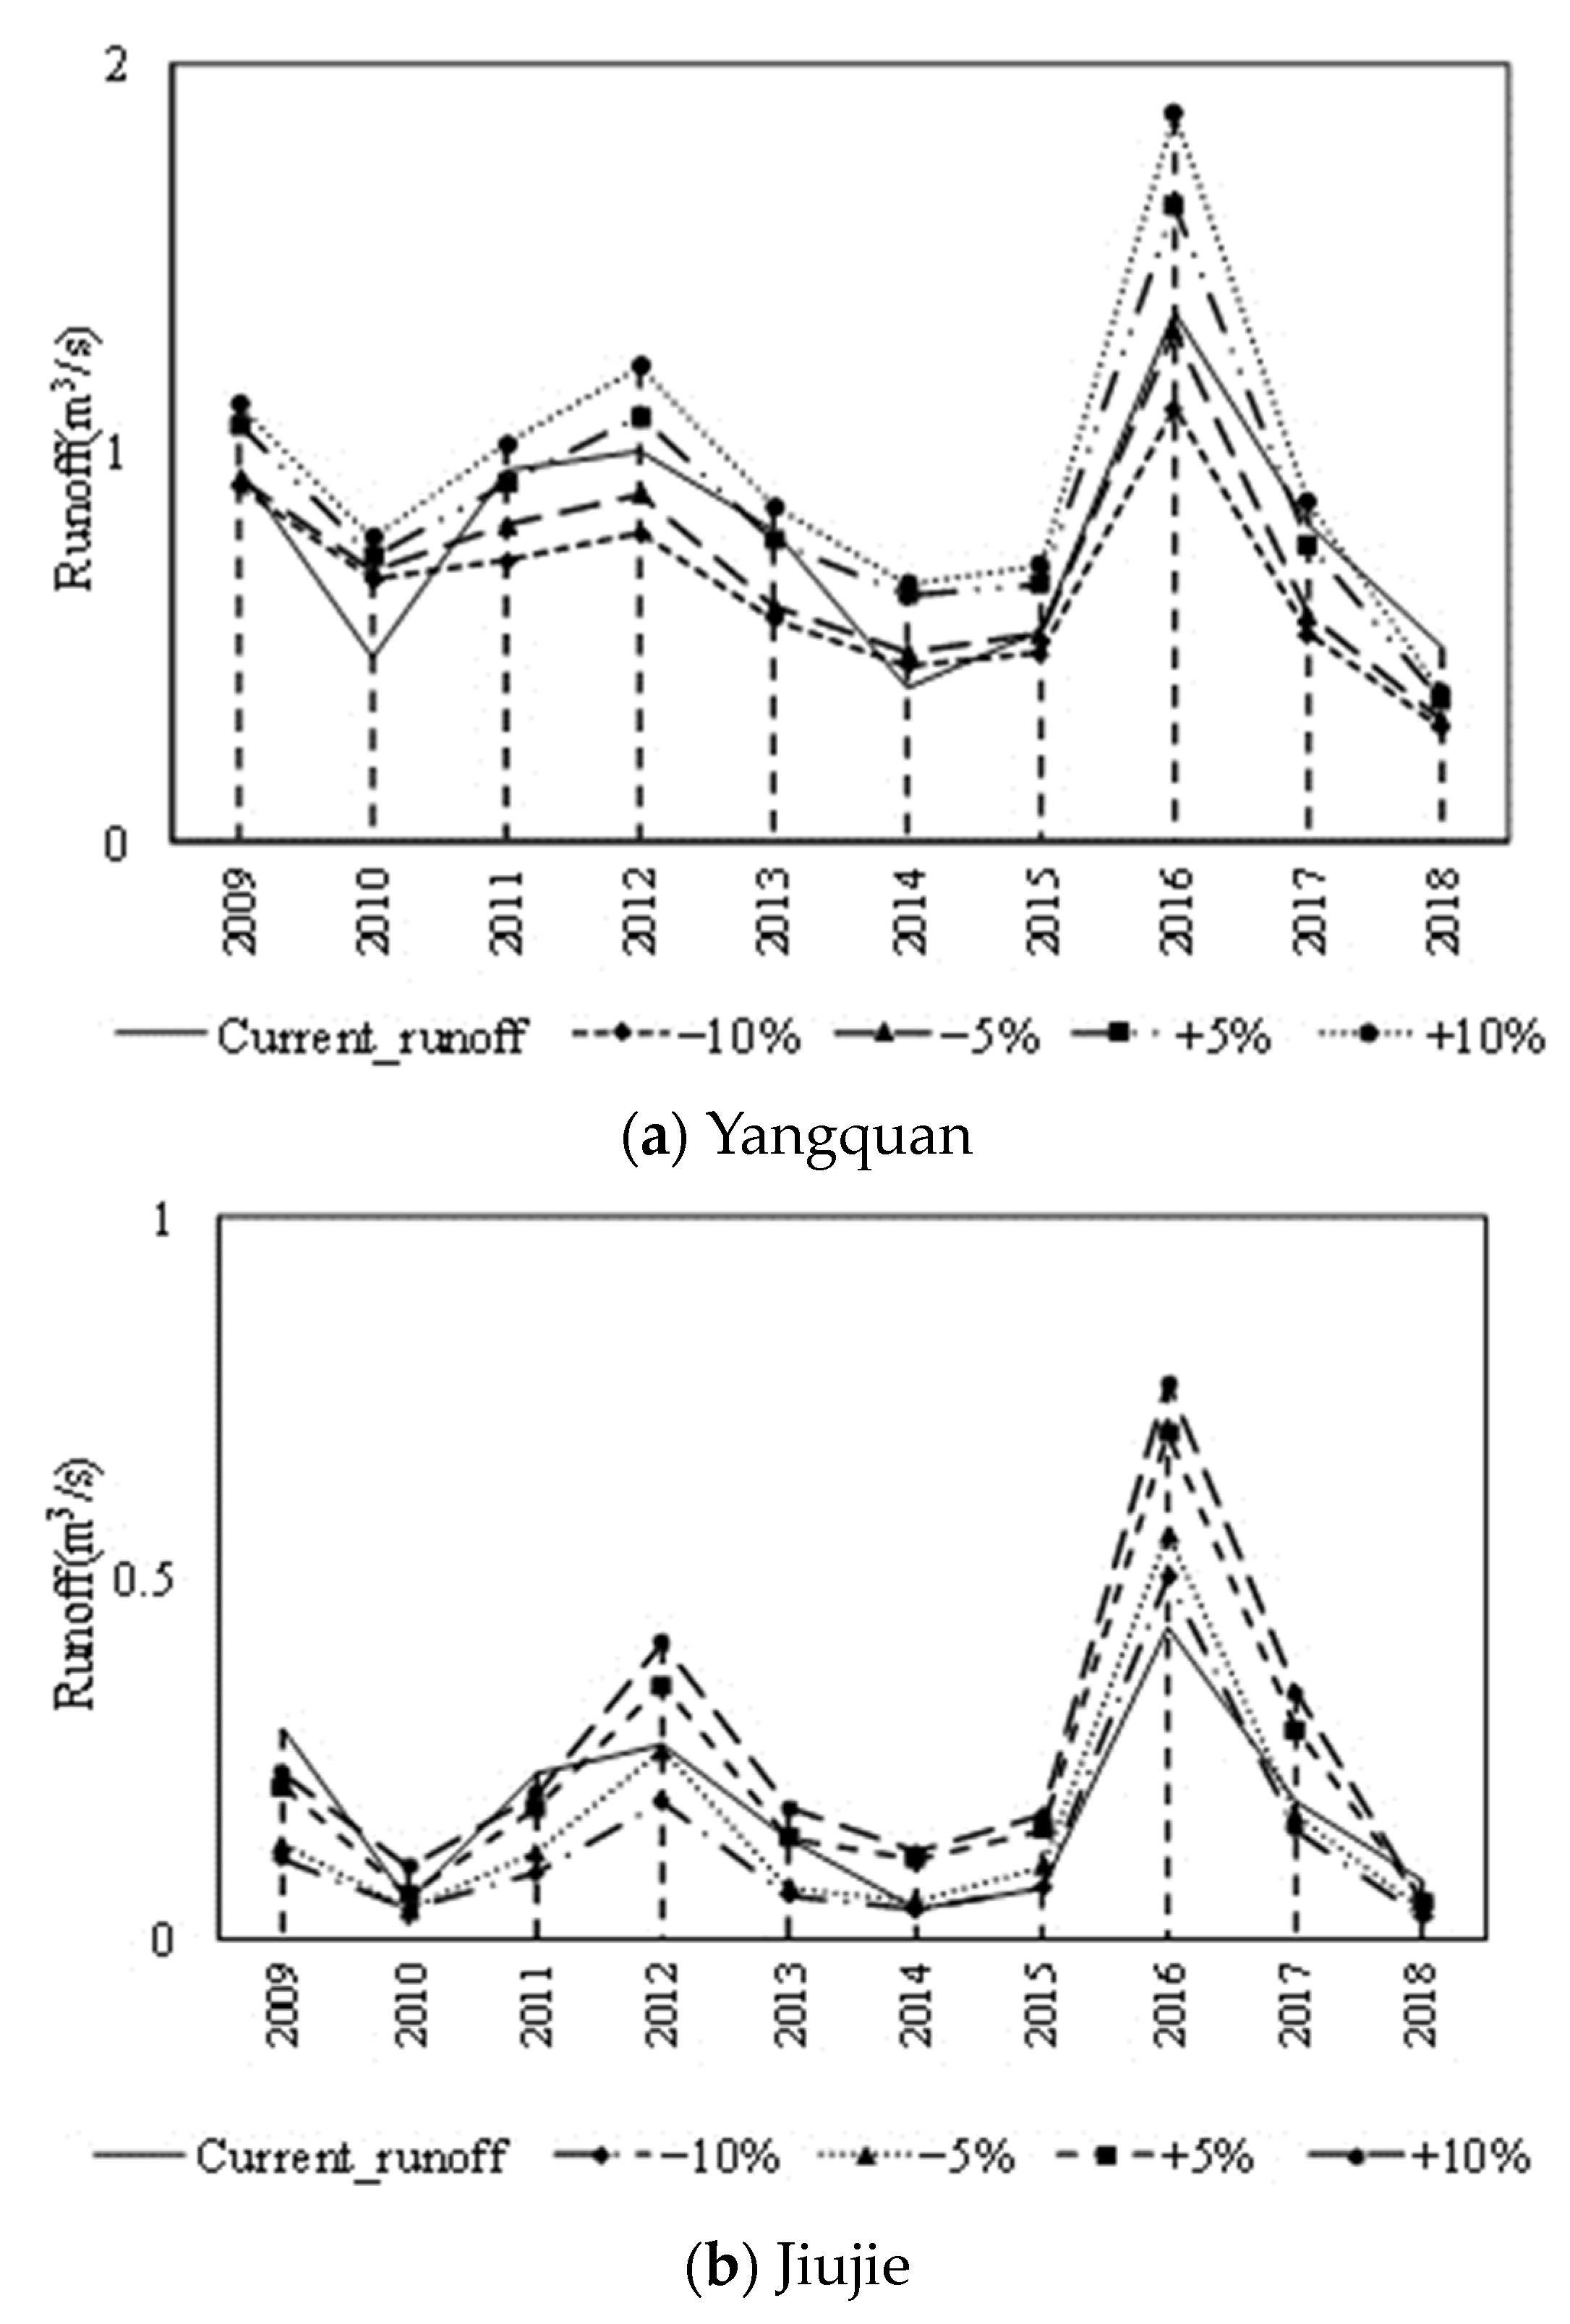
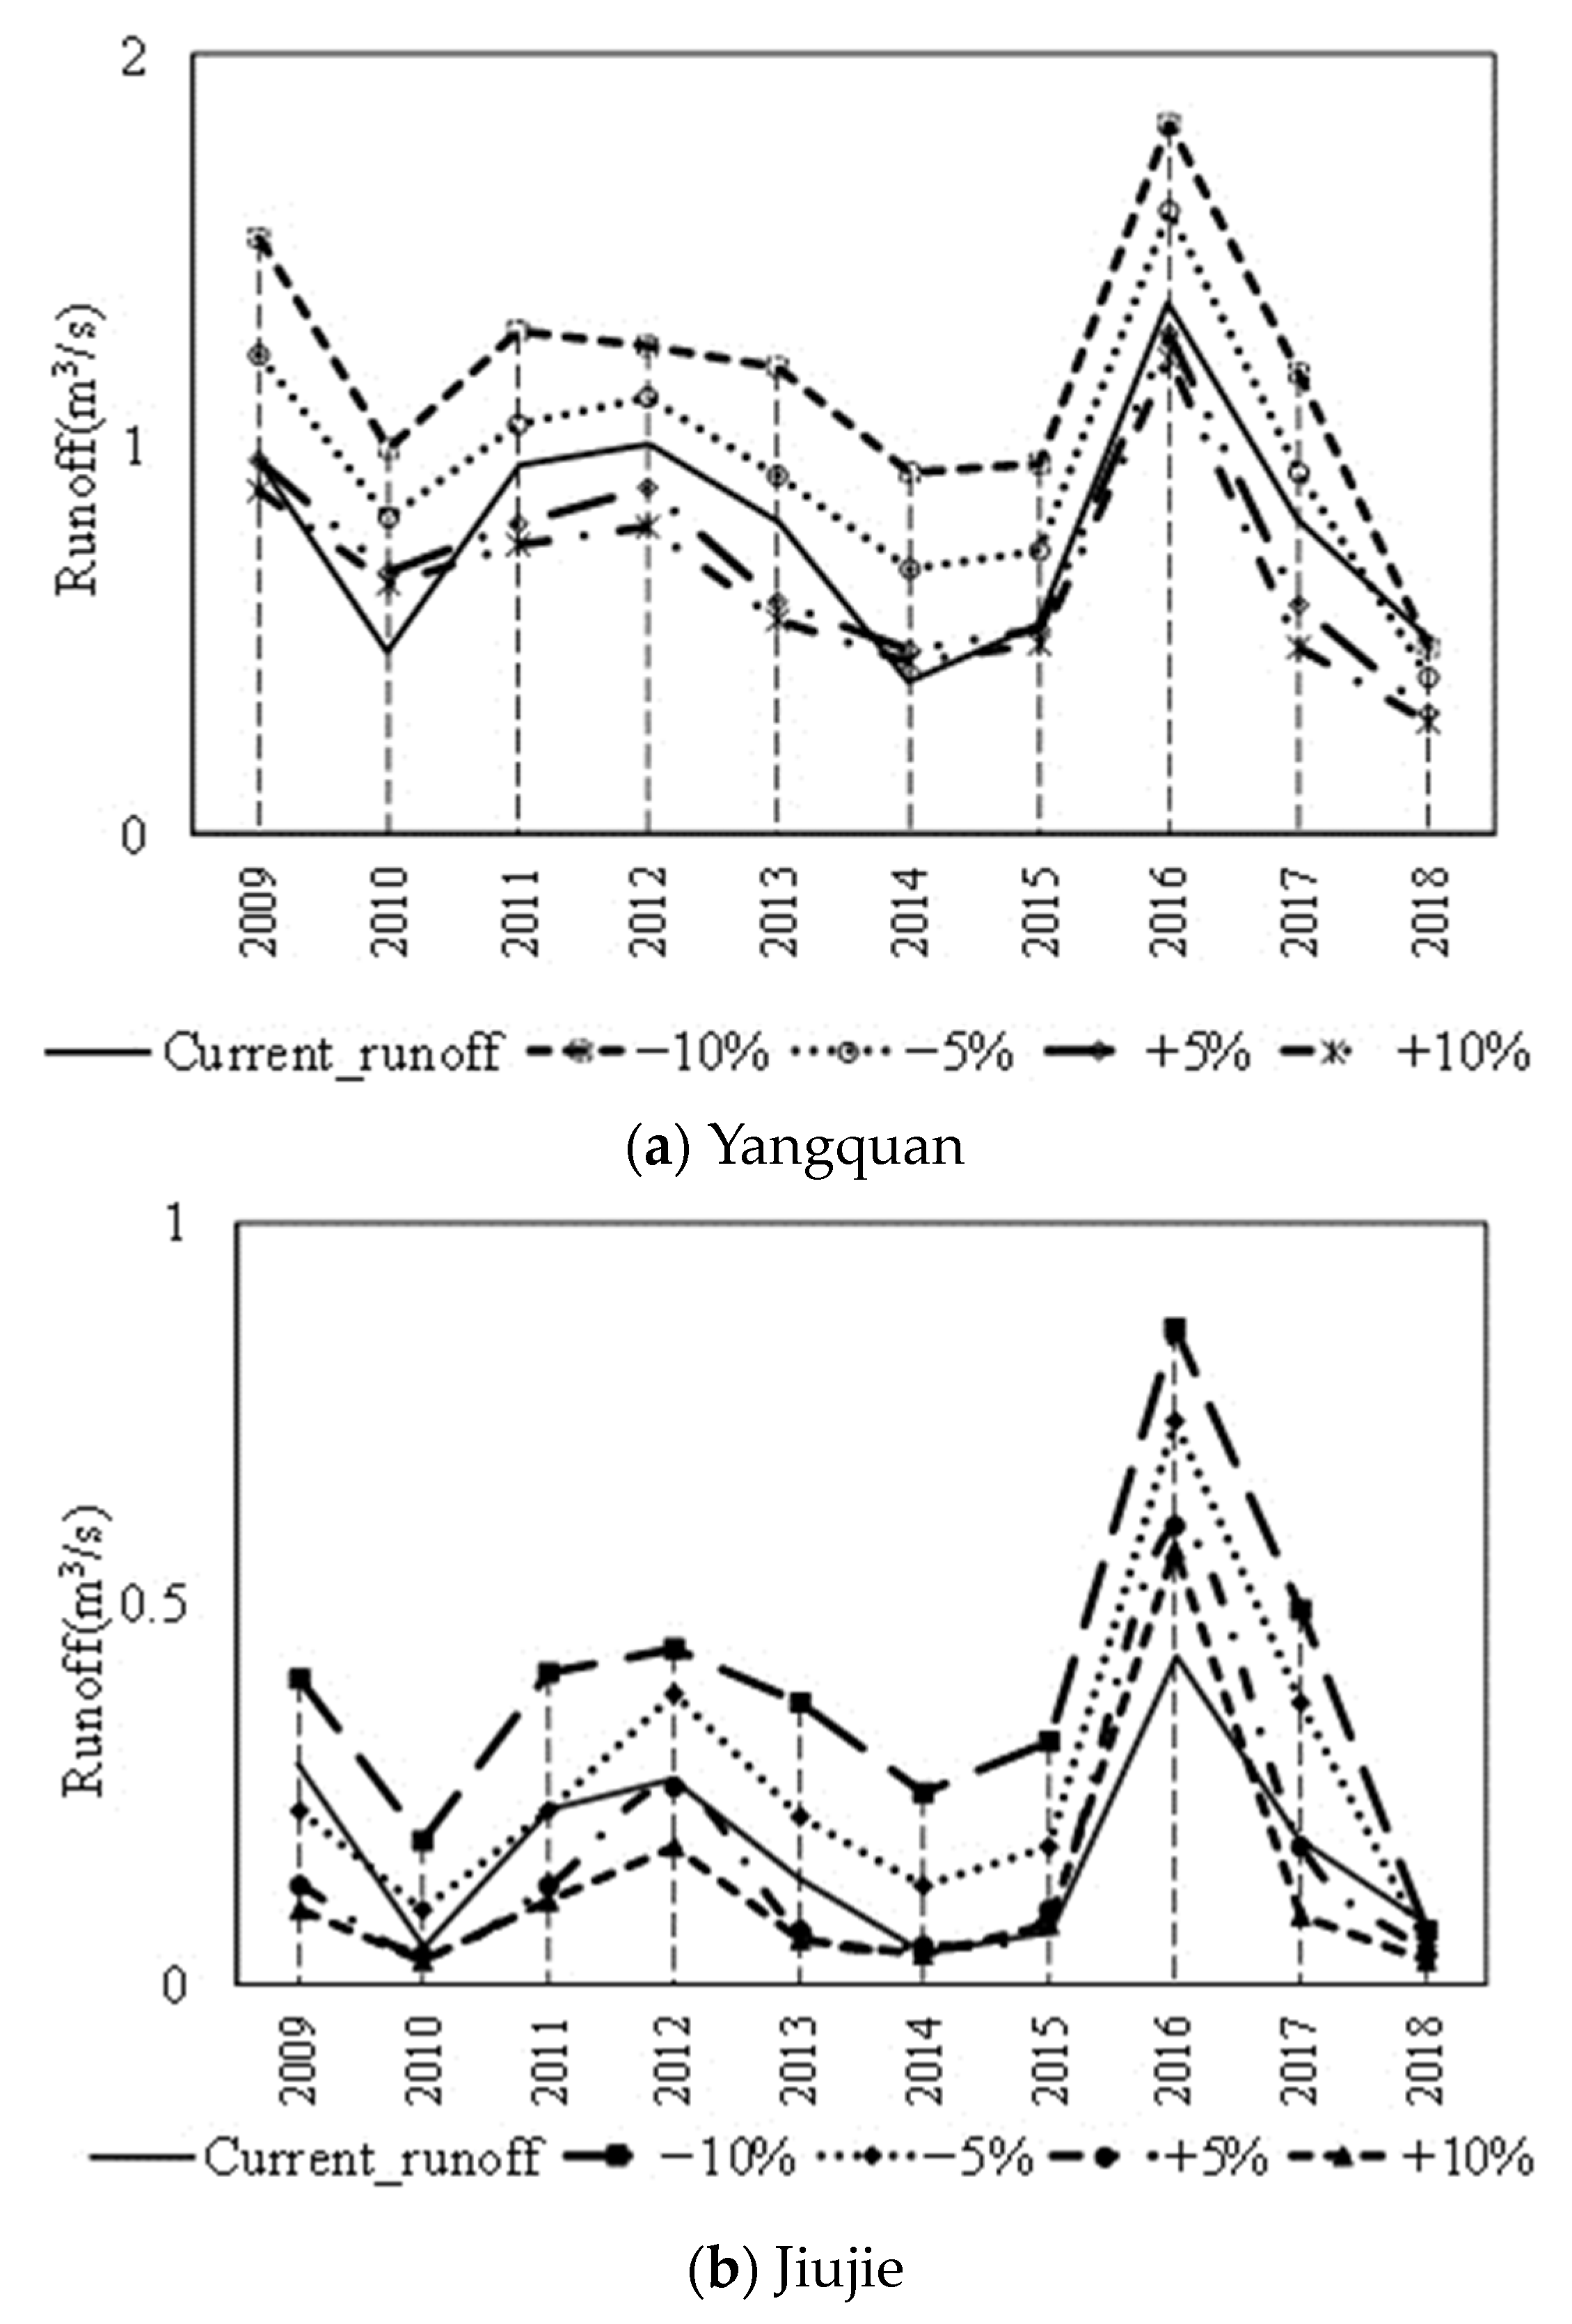
3.2.1. Annual Runoff Response Results
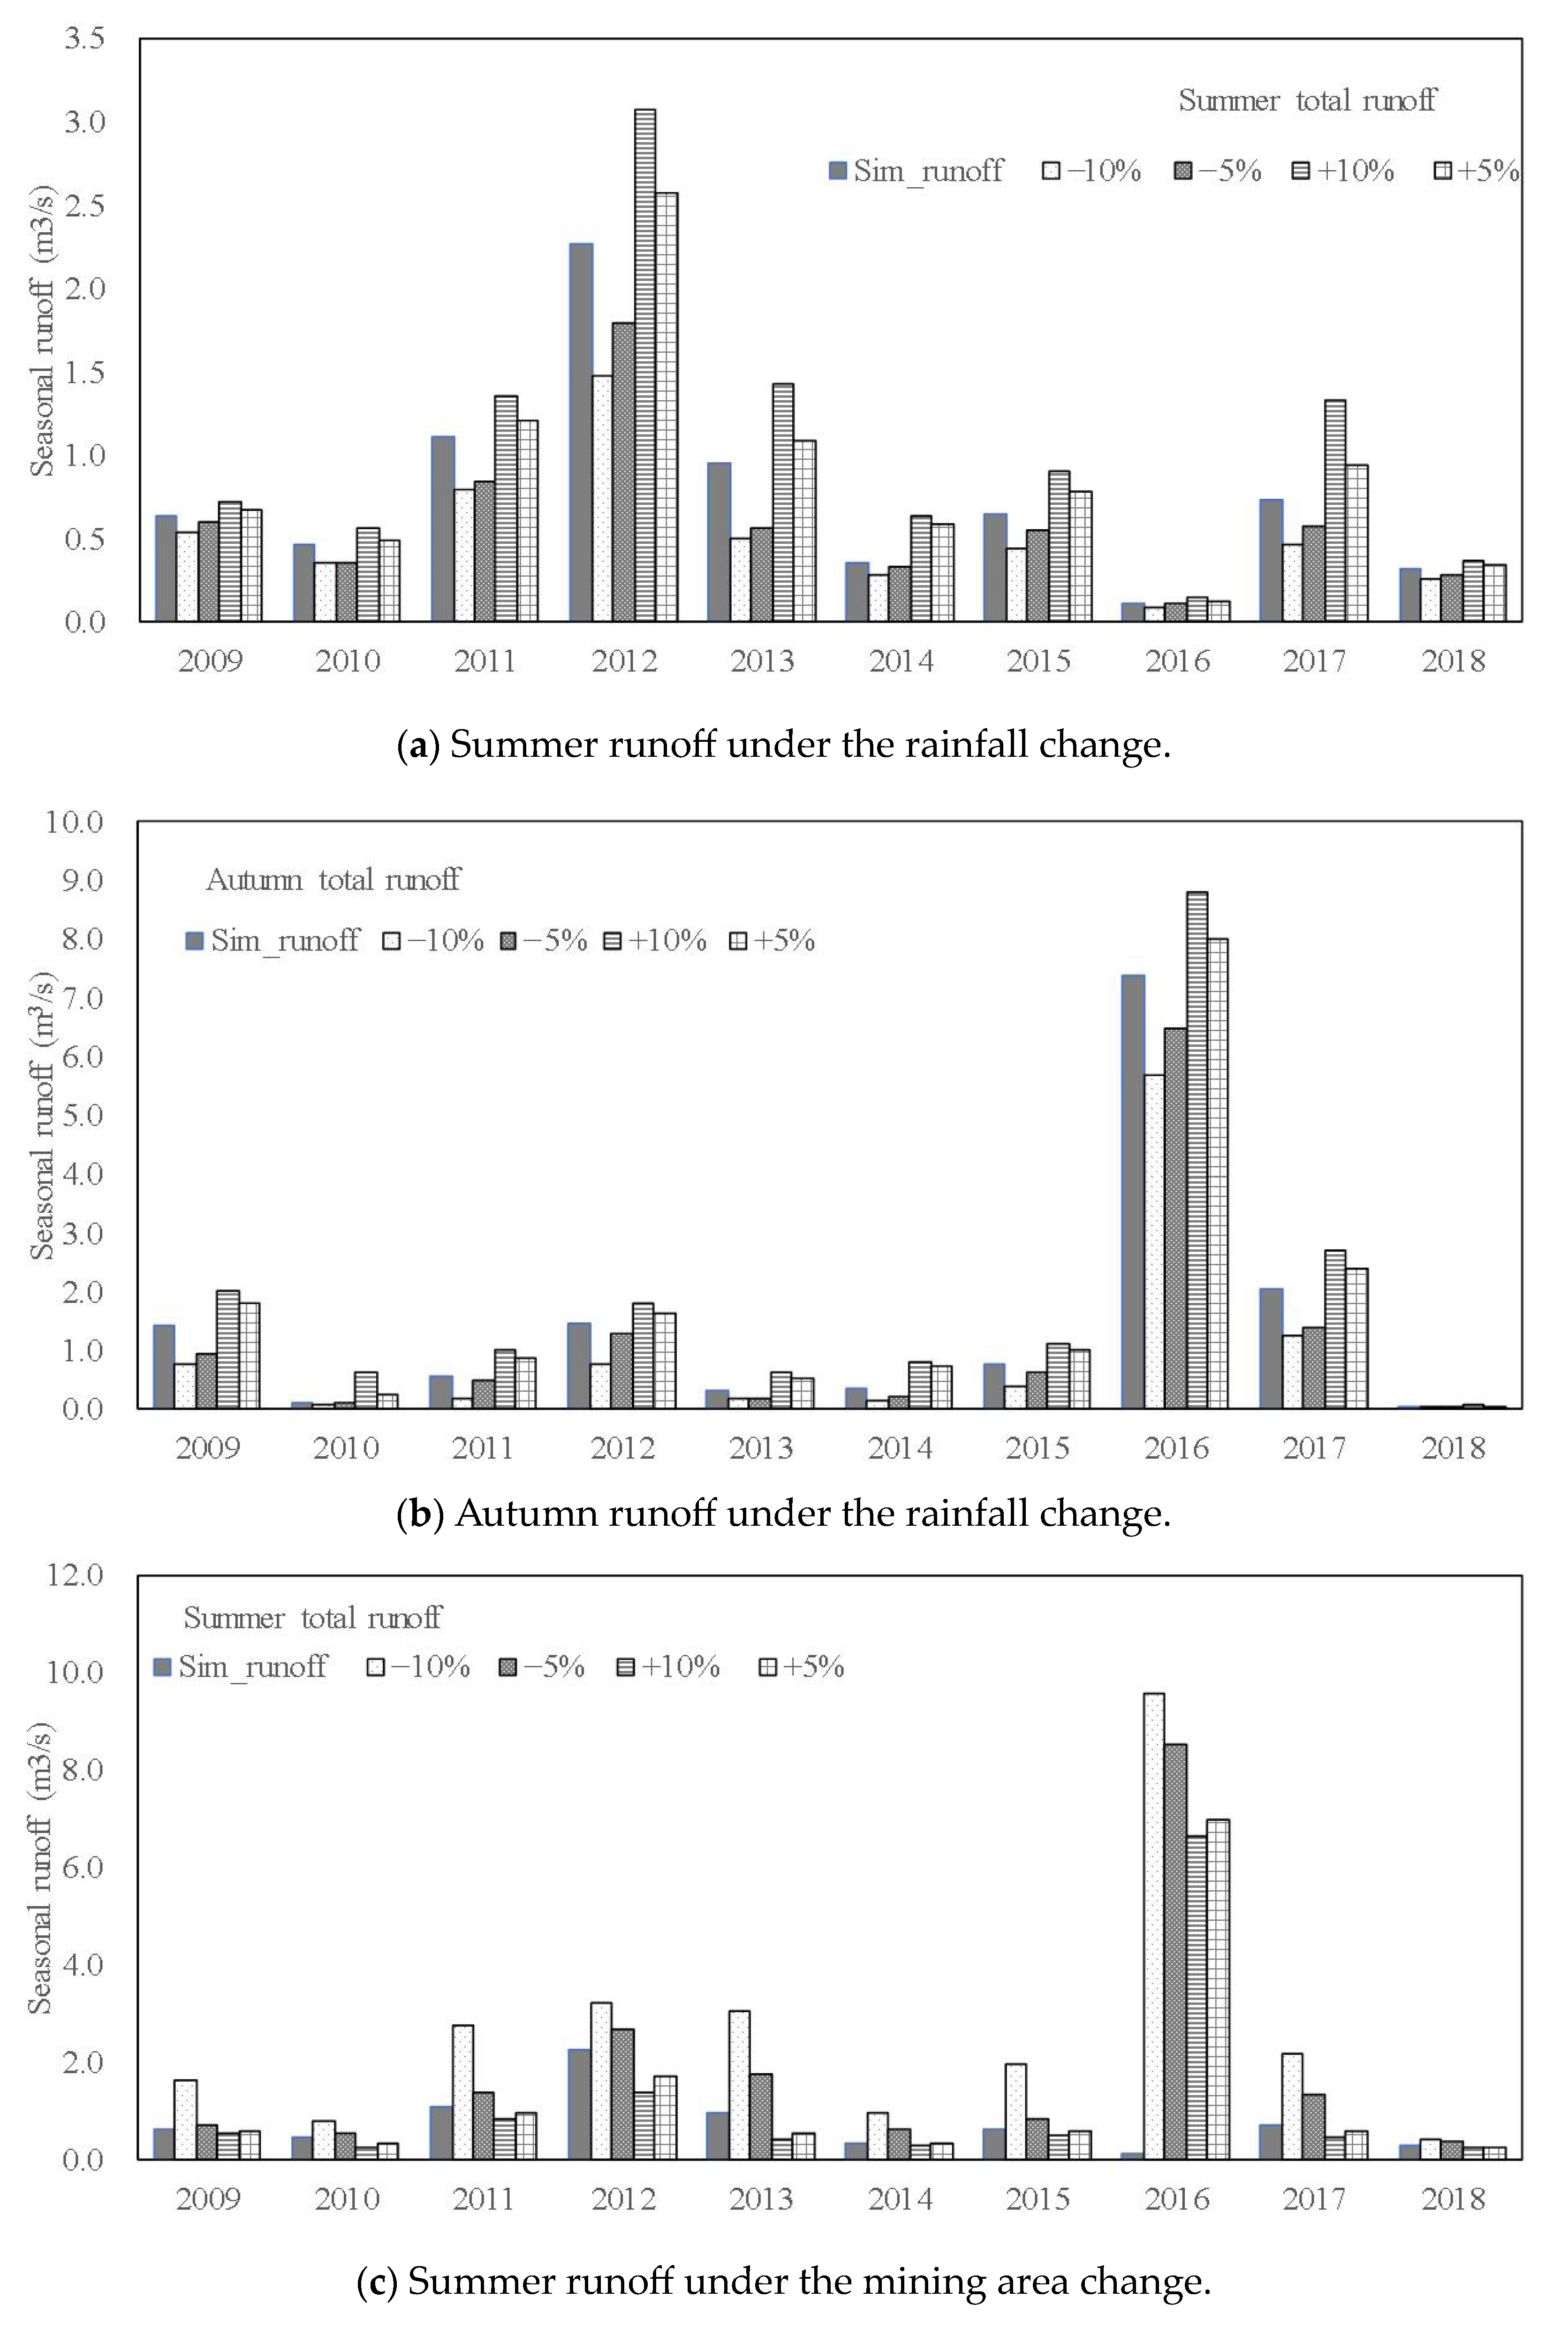
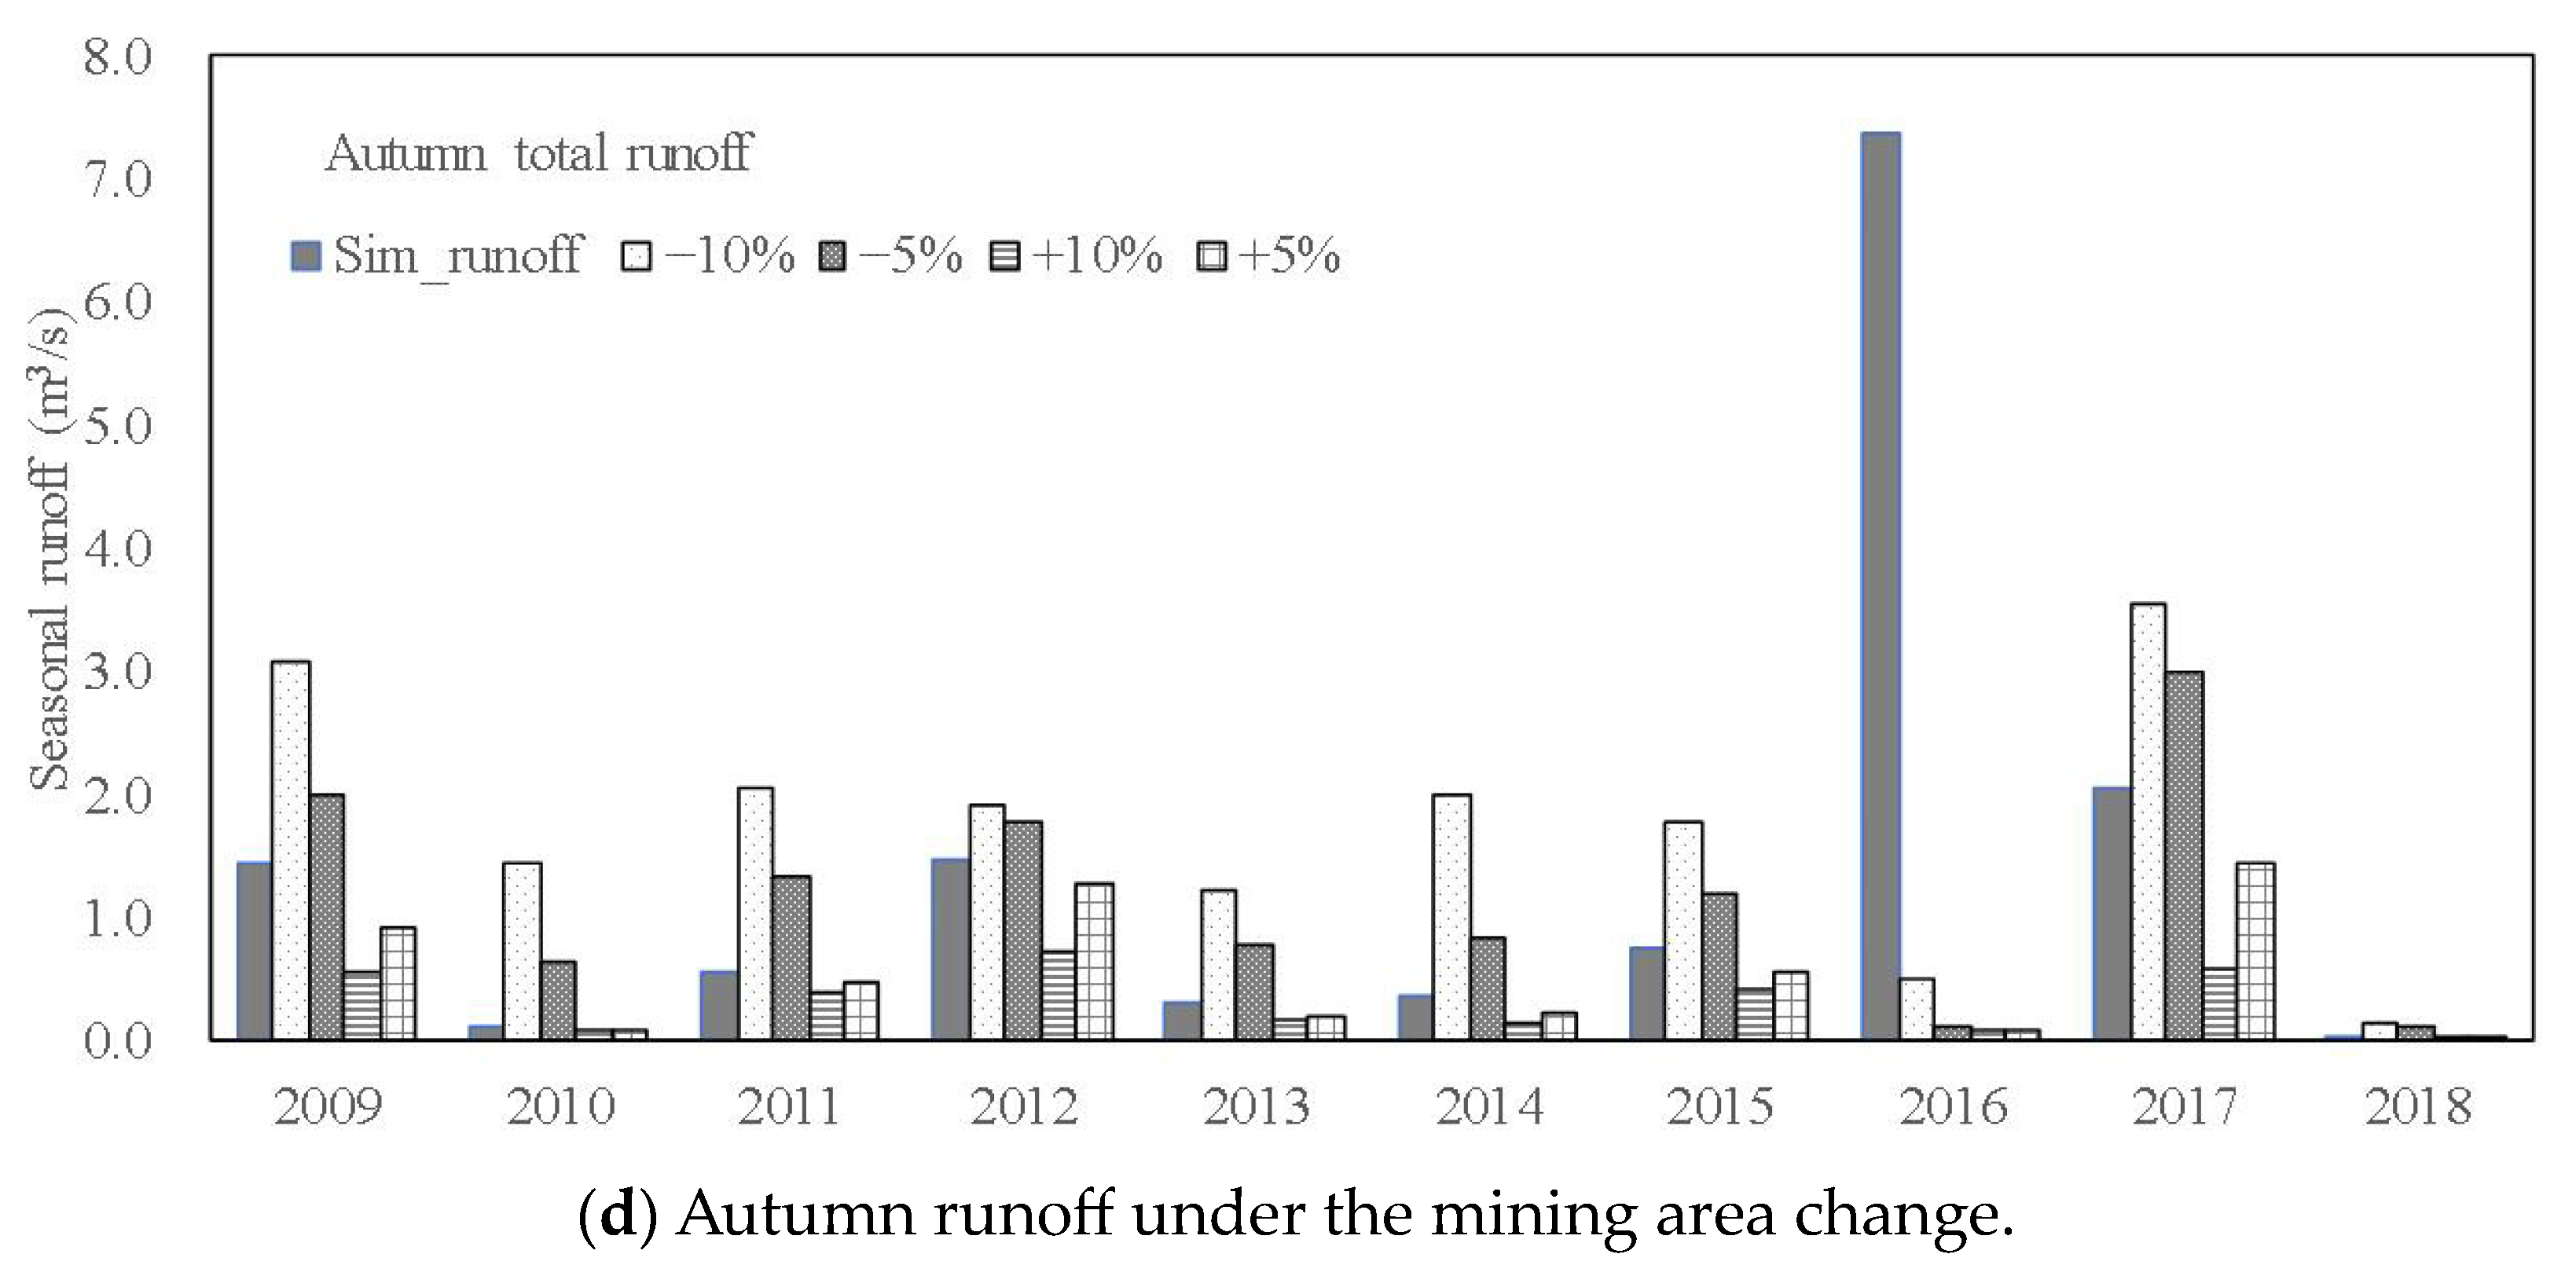
3.2.2. Seasonal Runoff Response Results
4. Discussion
5. Conclusions
Author Contributions
Funding
Data Availability Statement
Acknowledgments
Conflicts of Interest
References
- Wang, F. Study on the influence of coal mining on water resources in Shanxi. Henan Water Conserv. S. N. Water Transf. 2015, 19, 50–51. [Google Scholar]
- Hu, W.; Zhao, C. Evolution of Water Hazard Control Technology in China’s Coal Mines. Mine Water Environ. 2021, 40, 334–344. [Google Scholar] [CrossRef]
- Zhao, T. Study on the relationship between coal resources exploitation and water resources in Shanxi Province. Product. Res. 2016, 1, 40–44. [Google Scholar]
- Wei, Q.; Li, W.; Li, T.; Chang, J.; Wang, Q. Effects of Coal Mining on Shallow Water Resources in Semiarid Regions: A Case Study in the Shennan Mining Area, Shaanxi, China. Mine Water Environ. 2017, 36, 104–113. [Google Scholar]
- Knighton, J.; Walter, M. Critical rainfall statistics for predicting watershed flood responses: Rethinking the design storm concept. Hydrol. Process. 2016, 30, 3788–3803. [Google Scholar] [CrossRef]
- Zhang, L.; Karthikeyan, R.; Bai, Z.; Srinivasan, R. Analysis of streamflow responses to climate variability and land use change in the Loess Plateau region of China. Catena 2017, 154, 1–11. [Google Scholar] [CrossRef]
- Anand, J.; Gosain, A.K.; Khosa, R.; Srinivasan, R. Regional scale hydrologic modeling for prediction of water balance, analysis of trends in streamflow and variations in streamflow: The case study of the Ganga River basin. J. Hydrol. Reg. Stud. 2018, 16, 32–53. [Google Scholar] [CrossRef]
- Phung, Q.A.; Thompson, A.L.; Baffaut, C.; Costello, C.; Sadler, E.J.; Svoma, B.M.; Lupo, A.; Gautam, S. Climate and Land Use Effects on Hydrologic Processes in a Primarily Rain-Fed, Agricultural Watershed. J. Am. Water Resour. Assoc. 2019, 55, 1196–1215. [Google Scholar] [CrossRef]
- Jiang, X.; Gu, X.; He, H. The Influence of Coal Mining on Water Resources in the Kuye River Basin. J. Nat. Resour. 2010, 2, 126–133. [Google Scholar]
- Wu, X.; Dong, Y. Recognition of runoff changes in mining area based on SWAT model. Environ. Sci. Technol. 2018, 41, 175–180. [Google Scholar]
- Li, T.; Zhang, Y. Study on simulation of special underlying surface runoff in goaf area. Water Resour. Hydropower Eng. 2022, 53, 31–42. [Google Scholar]
- Leavesley, G.; Lichty, R.; Troutman, B. Precipitation-Runoff Modeling System: User’s Manual. J. Landolt-Börnstein—Group II Mol. Radic. 1991, 4, 206–207. [Google Scholar]
- Li, J.; Qiao, Y.; Lei, X.; Kang, A.; Wang, M.; Liao, W.; Wang, H.; Ma, Y. A two-stage water allocation strategy for developing regional economic-environment sustainability. J. Environ. Manag. 2019, 244, 189–198. [Google Scholar] [CrossRef] [PubMed]
- Xu, Z.; Cheng, L. Progress on studies and applications of the Distributed Hydrological Models. J. Hydraul. Eng. 2010, 41, 1009–1017. [Google Scholar]
- Zhao, R. The Xinanjiang Model Applied in China. J. Hydrol. 1992, 135, 371–381. [Google Scholar]
- Lin, K.; Lv, F.; Chen, L.; Singh, V.P.; Zhang, Q.; Chen, X. Xinanjiang model combined with Curve Number to simulate the effect of land use change on environmental flow. J. Hydrol. 2004, 519, 3142–3152. [Google Scholar] [CrossRef]
- Ma, H.; Yang, D.; Tan, S.K.; Gao, B.; Hu, Q. Impact of climate variability and human activity on streamflow decrease in the Miyun Reservoir catchment. J. Hydrol. 2010, 389, 317–324. [Google Scholar] [CrossRef]
- Yang, D.; Herath, S.; Musiake, K. Hillslope-based hydrological model using catchment area and width functions. Hydrol. Sci. J. 2002, 47, 49–65. [Google Scholar] [CrossRef]
- Liu, C.J.; Wen, L.; Zhou, J.; Zhao, X.T.; Guo, L.; Wei, Y.Q. Comparative analysis of hydrological and hydrodynamic calculation method for flash flood in small watershed. J. China Inst. Water Resour. Hydropower Res. 2019, 17, 262–270. [Google Scholar]
- Wen, L.; Liu, C. Development of hydrological model considering the coal mined-out area special underlying surface and its application in small basins of Shanxi Province. J. Glaciol. Geocryol. 2017, 39, 375–383. [Google Scholar]
- Guo, L.; Ding, L.; Sun, D.; Liu, C.; He, B.; Liu, R. Key techniques of flash flood disaster prevention in China. J. Hydraul. Eng. 2018, 49, 101–114. [Google Scholar]
- Niu, X.; Li, Z.; Yang, Z. Effects of Coal Mining on Water Resources in Shanxi Province; Shanxi Coalfield Hydrogeology Team, 2003. [Google Scholar]
- Guo, Q.; Han, Y.; Yang, Y.; Fu, G.; Li, J. Quantifying the Impacts of Climate Change, Coal Mining and Soil and Water Conservation on Streamflow in a Coal Mining Concentrated Watershed on the Loess Plateau, China. Water 2019, 11, 1054. [Google Scholar] [CrossRef]
- Li, P.; Qian, H.; Howard, K.; Wu, J. Building a new and sustainable “Silk Road economic belt”. Environ. Earth Sci. 2015, 74, 7267–7270. [Google Scholar] [CrossRef]
- Li, P.; Wu, J.; Qian, H.; Lyu, X.; Liu, H. Origin and assessment of groundwater pollution and associated health risk: A case study in an industrial park, northwest China. Environ. Geochem. Health 2014, 36, 693–712. [Google Scholar] [CrossRef] [PubMed]
- Rong, X.; Pang, J.; Han, J. Distribution trends of drought and flood disasters and climate background from 1958 to 2012 in Shanxi province. J. Arid. Land Resour. Environ. 2018, 32, 97–102. [Google Scholar]
- Gu, P. Impact Studies on the Mechanism and Quantitative Model of Coal Mining on River Runoff in Gujiao City of Shanxi Province. Master’s Thesis, Zhengzhou University, Zhengzhou, China, 2015. [Google Scholar]
- Li, P.; Li, X.; Meng, X.; Li, M.; Zhang, Y. Appraising groundwater quality and health risks from contamination in a semiarid region of northwest China. Expo. Health 2016, 8, 361–379. [Google Scholar] [CrossRef]
- Li, P.; Qian, H.; Wu, J.; Zhang, Y.; Zhang, H. Major ion chemistry of shallow groundwater in the Dongsheng coalfield, Ordos basin, China. Mine Water Environ. 2013, 32, 195–206. [Google Scholar] [CrossRef]
- Li, P.; Tian, R.; Xue, C.; Wu, J. Progress, opportunities, and key fields for groundwater quality research under the impacts of human activities in China with a special focus on western China. Environ. Sci. Pollut. Res. 2017, 24, 13224–13234. [Google Scholar] [CrossRef]
- Chang, J. On Influence of Coal Mining in Coal-mining Areas in Shanxi Province on Water Resource. Product. Res. 2015, 2, 63–67+161. [Google Scholar]
- Liu, S.; Li, W.; Wang, Q. Zoning method for environmental engineering geological patterns in underground coal mining areas. Sci. Total Environ. 2018, 634, 1064–1076. [Google Scholar] [CrossRef]
- Lai, W.; Ogden, F.L.; Steinke, R.C.; Talbot, C.A. An efficient and guaranteed stable numerical method for continuous modeling of infiltration and redistribution with a shallow dynamic water table. Water Resour. Res. 2015, 51, 1514–1528. [Google Scholar] [CrossRef]
- Talbot, C.; Ogden, F. A method for computing infiltration and redistribution in a discretized moisture content domain. Water Resour. Res. 2008, 44, 8. [Google Scholar] [CrossRef]
- Green, W.; Ampt, G. Studies on soil physics 1: The flow of air and water through soils. J. Agric. Sci. 1911, 4, 1–24. [Google Scholar]
- Andreas, K.; Nikola, R. Sustainable development of energy, water and environment systems. Water Resour. Manag. 2011, 10, 33–39. [Google Scholar]
- Sridhar, V.; Kang, H.; Ali, S.A. Human-Induced Alterations to Land Use and Climate and Their Responses for Hydrology and Water Management in the Mekong River Basin. Water 2019, 11, 1307. [Google Scholar] [CrossRef]
- Research and Application on Key Technologies of Dynamic Flood Warning in Henan Province; China Institute of Water Resources and Hydropower Research: Beijing, China, 2015.
- Abbaspour, K.C.; Yang, J.; Maximov, I.; Siber, R.; Bogner, K.; Mieleitner, J.; Zobrist, J.; Srinivasan, R. Modelling hydrology and water quality in the pre-alpine/alpine Thur watershed using SWAT. J. Hydrol. 2007, 333, 413–430. [Google Scholar] [CrossRef]
- Bieger, K.; Hörmann, G.; Fohrer, N. Detailed spatial analysis of SWAT-simulated surface runoff and sediment yield in a mountainous watershed in China. Hydrol. Sci. J. 2014, 60, 784–800. [Google Scholar] [CrossRef]
- Ghaffari, R.; Aranyosi, A.J.; Richardson, G.P.; Freeman, D.M. Tectorial membrane travelling waves underlie abnormal hearing in Tectb mutant mice. Nat. Commun. 2010, 1, 96. [Google Scholar] [CrossRef]
- Nash, J.; Sutcliffe, J. River flow forecasting through conceptual models part I—A discussion of principles. J. Hydrol. 1970, 10, 282–290. [Google Scholar] [CrossRef]
- Moriasi, D.N.; Arnold, J.G.; Van Liew, M.W.; Bingner, R.L.; Harmel, R.D.; Veith, T.L. Model evaluation guidelines for systematic quantification of accuracy in watershed simulations. Am. Soc. Agric. Biol. Eng. 2007, 50, 885–900. [Google Scholar] [CrossRef]
- Xin, Z.; Li, Y.; Zhang, L.; Ding, W.; Ye, L.; Wu, J.; Zhang, C. Quantifying the relative contribution of climate and human impacts on seasonal streamflow. J. Hydrol. 2019, 574, 936–945. [Google Scholar] [CrossRef]
- Kendorski, F. Effect of High-Extraction Coal Mining on Surface and Ground Waters. In Proceedings of the 12th Conference on Ground Control in Mining, Morgantown, WV, USA, 3–5 August 1993. [Google Scholar]
- Chiew, F.; Fu, G.; Post, D.; Zhang, Y.; Wang, B.; Viney, N. Impact of coal resource development on streamflow characteristics: Influence of climate variability and climate change. Water 2018, 10, 1161. [Google Scholar] [CrossRef]
- Sun, S.; Chen, H.; Ju, W.; Song, J.; Zhang, H.; Sun, J.; Fang, Y. Effects of climate change on annual streamflow using climate elasticity in Poyang Lake Basin, China. Theor. Appl. Climatol. 2013, 112, 169–183. [Google Scholar] [CrossRef]
- Wu, J.; Sun, Z. Evaluation of shallow groundwater contamination and associated human health risk in an alluvial plain impacted by agricultural and industrial activities, mid-west China. Expo. Health 2016, 8, 311–329. [Google Scholar] [CrossRef]

| Period | Year | Characteristic | Influence |
|---|---|---|---|
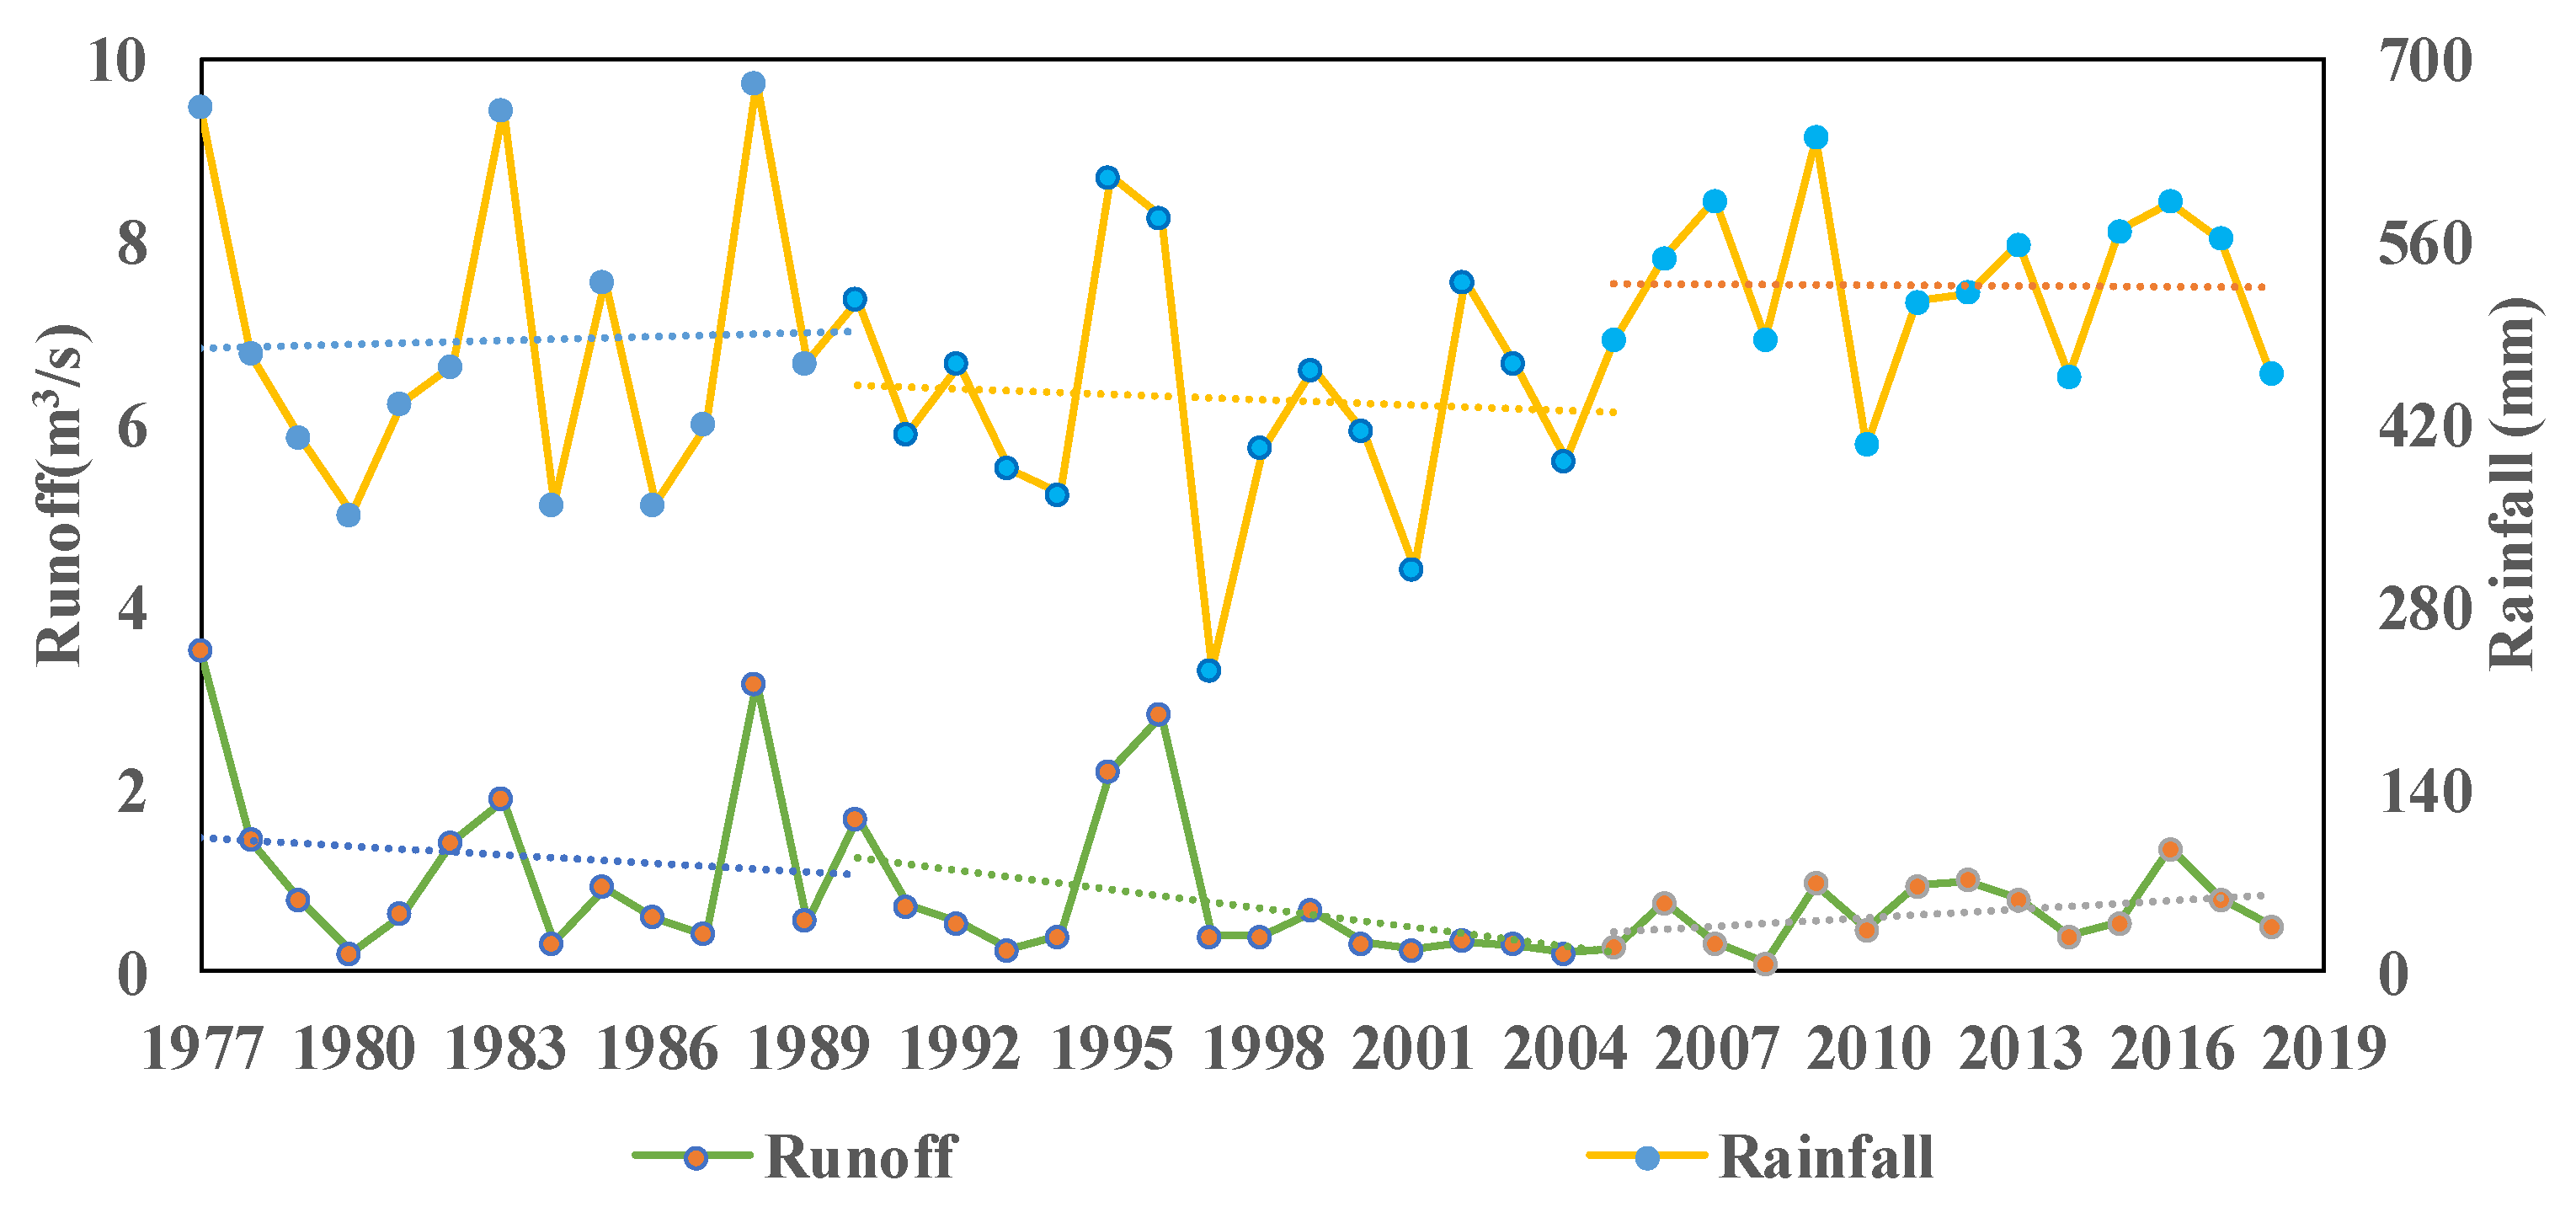
| Before mining | 1977–1990 | No mining activities | Little influence |
| Mining | 1991–2004 | Unreasonable activities | Influence on the underlying surface |
| After mining | 2005–2018 | Sustainable mining activities | Reduced influence on the underlying surface |
| Names | Descriptions | Calibration Results |
|---|---|---|
| Daily evaporation coefficient [-] | 0.85 | |
| Interception capacity of major vegetation types in summer [mm] | 6.32 | |
| Percentage of watershed [%] | 0.13 | |
| Mean water storage in depression [mm] | 4.92 | |
| Soil hydraulic conductivity (mm/s) of the coal goaf [m/s] | 1.14 × 10 −5 | |
| Saturated hydraulic conductivity [m/s] | 1.14 × 10 −6 | |
| Porosity [-] | 0.43 | |
| Residual water content [-] | 0.078 | |
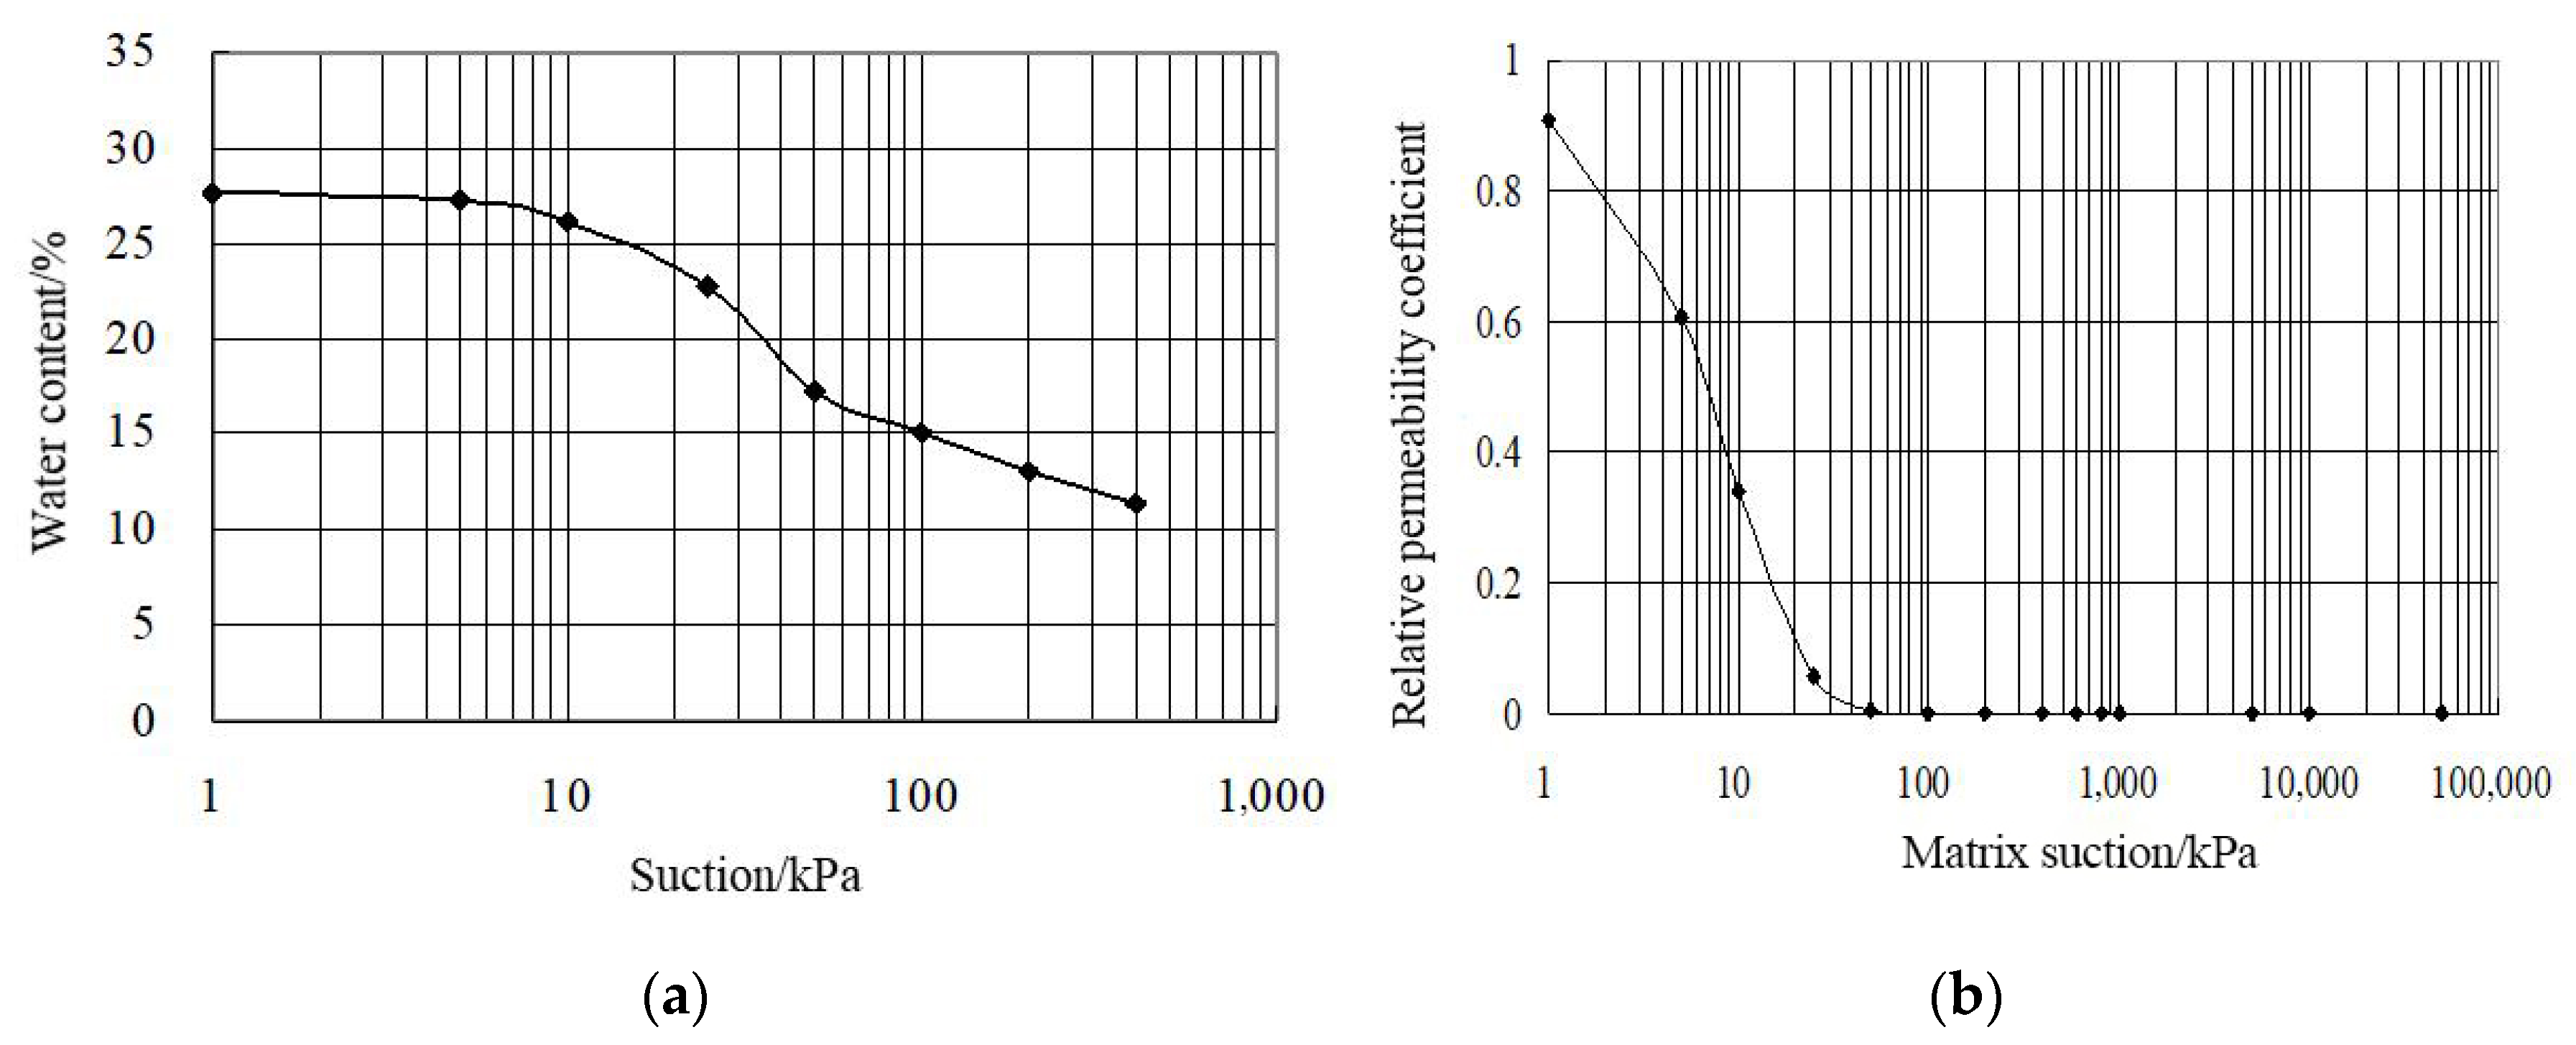
| VG model parameter [-] | 0.036 | |
| VG model parameter [-] | 1.56 | |
| Initial water content of soil [-] | 0.12 | |
| Field water holding rate [-] | 0.40 | |
| Soil leakage coefficient to groundwater [m/d] | 0.15 | |
| Percentage of impervious area [-] | 0.10 | |
| Priority flow area percentage [-] | 0.16 | |
| Priority outflow linear coefficient [-] | 0.079 | |
| Priority outflow nonlinear coefficient [-] | 0.14 | |
| Linear coefficient of effluent flow in soil [-] | 0.62 | |
| Nonlinear coefficient of effluent flow in soil [-] | 0.72 | |
| Groundwater reservoir leakage coefficient [-] | 0.0027 | |
| Lateral outflow coefficient [-] | 0.0041 | |
| k | equivalent leakage coefficient [-] | 0.4023 |
| Kinematic parameter alpha for overland flow routing [-] | 1.10 | |
| Kinematic parameter m for overland flow routing [-] | 1.75 | |
| Kinematic parameter alpha for channel flow routing [-] | 1.20 | |
| Kinematic parameter m for channel flow routing [-] | 1.56 |
| Season | Year | Δ Rainfall | Δ Mining Area | ||||||
|---|---|---|---|---|---|---|---|---|---|
| −10% | −5% | +5% | +10% | −10% | −5% | +5% | +10% | ||
| 2009 | −0.79% | −0.40% | 0.40% | 0.79% | 6.86% | 3.86% | −3.91% | −6.92% | |
| 2010 | −1.00% | −0.50% | 0.50% | 1.51% | 10.54% | 5.02% | −4.01% | −7.03% | |
| 2011 | −1.78% | −1.17% | 0.57% | 1.18% | 11.81% | 5.90% | −3.55% | −6.50% | |
| 2012 | −3.88% | −1.94% | 1.28% | 2.55% | 14.14% | 7.10% | −5.15% | −8.37% | |
| Spring | 2013 | −4.96% | −2.81% | 2.15% | 3.55% | 15.61% | 7.85% | −4.30% | −7.11% |
| 2014 | −4.02% | −2.42% | 2.42% | 4.02% | 19.32% | 8.86% | −4.02% | −8.03% | |
| 2015 | −6.69% | −3.34% | 3.34% | 7.57% | 24.72% | 12.74% | −4.22% | −8.52% | |
| 2016 | −6.80% | −3.84% | 2.96% | 5.92% | 27.36% | 12.72% | −5.76% | −9.76% | |
| 2017 | −6.53% | −3.27% | 3.27% | 7.61% | 31.51% | 13.07% | −4.31% | −7.57% | |
| 2018 | −9.57% | −4.90% | 5.68% | 9.57% | 32.41% | 15.04% | −4.90% | −8.80% | |
| 2009 | −17.87% | −15.99% | −12.71% | −9.37% | 36.04% | 10.27% | −7.34% | −13.65% | |
| 2010 | −3.18% | −1.94% | 1.75% | 3.69% | 26.10% | 7.01% | −4.25% | −7.19% | |
| 2011 | −19.28% | −10.25% | 0.85% | 17.50% | 55.09% | 17.33% | −10.40% | −15.78% | |
| 2012 | −19.77% | −11.05% | 14.99% | 34.70% | 31.96% | 15.19% | −10.14% | −17.22% | |
| Summer | 2013 | −25.11% | −18.44% | 11.76% | 31.22% | 88.49% | 37.31% | −17.68% | −25.63% |
| 2014 | −12.56% | −7.45% | 22.50% | 28.71% | 69.84% | 30.36% | −7.06% | −13.12% | |
| 2015 | −15.92% | −8.29% | 14.59% | 23.97% | 70.20% | 22.64% | −7.05% | −12.67% | |
| 2016 | −15.92% | −7.05% | 8.91% | 18.32% | 26.81% | 12.25% | −8.32% | −11.63% | |
| 2017 | −21.94% | −11.95% | 14.41% | 43.30% | 114.80% | 47.73% | −12.35% | −19.55% | |
| 2018 | −12.50% | −8.23% | 9.27% | 18.02% | 47.81% | 22.81% | −8.23% | −13.02% | |
| 2009 | −14.63% | −11.25% | 8.38% | 13.48% | 56.00% | 13.97% | −14.79% | −22.47% | |
| 2010 | −8.67% | −7.02% | 7.05% | 22.89% | 76.73% | 29.16% | −9.57% | −12.91% | |
| 2011 | −19.62% | −6.12% | 8.81% | 15.11% | 45.84% | 24.39% | −8.48% | −18.04% | |
| 2012 | −14.22% | −4.66% | 4.66% | 8.61% | 19.38% | 10.87% | −6.80% | −18.12% | |
| 2013 | −14.00% | −11.41% | 16.78% | 23.33% | 75.25% | 38.48% | −13.23% | −17.25% | |
| Autumn | 2014 | −18.72% | −11.96% | 21.53% | 29.39% | 105.30% | 34.85% | −14.69% | −20.90% |
| 2015 | −17.73% | −8.52% | 9.62% | 16.22% | 49.20% | 21.83% | −10.11% | −17.30% | |
| 2016 | −8.70% | −4.47% | 4.24% | 6.64% | 79.04% | 12.94% | −6.30% | −10.04% | |
| 2017 | −21.87% | −15.43% | 13.51% | 32.12% | 67.52% | 40.45% | −15.28% | −30.19% | |
| 2018 | −13.08% | −7.68% | 8.55% | 14.84% | 51.97% | 25.66% | −9.94% | −13.08% | |
| 2009 | 0.00% | 0.00% | 0.51% | 0.51% | 8.48% | 4.18% | −3.68% | −6.46% | |
| 2010 | −0.57% | −0.57% | 1.02% | 1.02% | 10.06% | 5.28% | −3.76% | −6.37% | |
| 2011 | −2.45% | −1.81% | 0.00% | 1.23% | 10.86% | 5.43% | −4.21% | −7.24% | |
| 2012 | −2.04% | −1.39% | 2.04% | 2.77% | 13.65% | 6.86% | −4.09% | −6.80% | |
| Winter | 2013 | −3.83% | −1.54% | 1.57% | 3.05% | 15.34% | 7.64% | −3.83% | −7.61% |
| 2014 | −3.52% | −1.76% | 2.59% | 5.19% | 19.91% | 10.37% | −3.52% | −7.78% | |
| 2015 | −5.79% | −3.82% | 1.97% | 4.86% | 25.12% | 10.65% | −4.75% | −7.64% | |
| 2016 | −6.39% | −4.31% | 2.08% | 5.28% | 25.56% | 11.67% | −6.39% | −9.58% | |
| 2017 | −6.05% | −4.77% | 2.47% | 6.09% | 30.26% | 13.34% | −6.05% | −8.39% | |
| 2018 | −10.86% | −6.80% | 2.78% | 6.85% | 35.30% | 14.98% | −6.80% | −10.86% | |
| Year | Average Qobs | Average Qsim | Rainfall Changes | Mining Activities | ||
|---|---|---|---|---|---|---|
| ΔQ | Δ% | ΔQ | Δ% | |||
| (m3/s) | (m3/s) | (m3/s) | (%) | (m3/s) | (%) | |
| 1977–1990 | 1.26 | 1.27 | ||||
| 1991–2004 | 0.7 | 1.19 | −0.08 | −14.04% | −0.49 | −85.96% |
| 2005–2018 | 0.66 | 0.9 | −0.37 | −60.66% | −0.24 | −39.34% |
Disclaimer/Publisher’s Note: The statements, opinions and data contained in all publications are solely those of the individual author(s) and contributor(s) and not of MDPI and/or the editor(s). MDPI and/or the editor(s) disclaim responsibility for any injury to people or property resulting from any ideas, methods, instructions or products referred to in the content. |
© 2023 by the authors. Licensee MDPI, Basel, Switzerland. This article is an open access article distributed under the terms and conditions of the Creative Commons Attribution (CC BY) license (https://creativecommons.org/licenses/by/4.0/).
Share and Cite
Xu, Z.; Li, J.; Hao, S.; Wen, L.; Ma, Q.; Liu, C.; Shen, W. Temporal and Spatial Analysis of Water Resources under the Influence of Coal Mining: A Case Study of Yangquan Basin, China. Water 2023, 15, 3058. https://doi.org/10.3390/w15173058
Xu Z, Li J, Hao S, Wen L, Ma Q, Liu C, Shen W. Temporal and Spatial Analysis of Water Resources under the Influence of Coal Mining: A Case Study of Yangquan Basin, China. Water. 2023; 15(17):3058. https://doi.org/10.3390/w15173058
Chicago/Turabian StyleXu, Zheyi, Jiahong Li, Sijia Hao, Lei Wen, Qiang Ma, Changjun Liu, and Wei Shen. 2023. "Temporal and Spatial Analysis of Water Resources under the Influence of Coal Mining: A Case Study of Yangquan Basin, China" Water 15, no. 17: 3058. https://doi.org/10.3390/w15173058