Article

A Bayesian Network-Based Inhibition Model of the Rainstorm–Landslide–Debris Flow Disaster Chain in Mountainous Areas: The Case of the Greater Bay Area, China

1
State Key Laboratory of Simulation and Regulation of Water Cycle in River Basin, China Institute of Water Resources and Hydropower Research, Beijing 100038, China
2
College of Water Conservancy and Hydropower Engineering, HoHai University, Nanjing 210098, China
*
Author to whom correspondence should be addressed.
Water 2023, 15(17), 3124; https://doi.org/10.3390/w15173124
Submission received: 31 July 2023 / Revised: 27 August 2023 / Accepted: 29 August 2023 / Published: 31 August 2023

Abstract

:
In this study, a Bayesian network (BN)-based inhibition model is developed for the rainstorm–landslide–debris flow (R-L-D) disaster chain in the mountainous area of the Greater Bay Area (GBA), China, using the historical disaster data. Twelve nodes are selected for the inhibition model, which are classified into four types, including Hazardous Factor, Response Operation, Disaster Evolution, and Disaster Result. By combining the proposed inhibition with the scenario analysis method, the probabilities of the BN nodes under different rainfall scenarios are analyzed, and then the inhibitory effects of the environmental geological conditions and rescue speed on the R-L-D disaster chain under the most unfavorable rainfall scenario are investigated. On this basis, an inhibition framework consisting of the early warning, inhibition, and measures layers is proposed for the R-L-D disaster chain. The results reveal that under the most unfavorable rainfall scenarios, where the rainfall intensity is greater than 100 mm/d and the rainfall duration is greater than 24 h, the probability of landslides and debris flow is 0.930 and 0.665, respectively. Improving the environmental geological conditions such as slope, lithology and geological structure can greatly inhibit the occurrence of the R-L-D disaster chain. Moreover, the improvement of geological structure conditions is the most significant, and reduces the probability of landslides and debris flow by 0.684 and 0.430, respectively, as well as reducing the probability of death and direct economic loss by 0.411 and 0.619, respectively. Similarly, increasing the rescue speed leads to a reduction in the probability of death and direct economic loss by 0.201 and 0.355, respectively. This study can provide theoretical and practical insights into the prevention and inhibition of the R-L-D disaster chain.

1. Introduction

Rainstorms are often accompanied by secondary geological and hydrological disasters due to the complex topographic and geological conditions in mountainous areas, causing severe damage to human lives, assets and ecosystems. For example, the continuous rainstorm that occurred on 21 July 2013 triggered a debris flow disaster over a 1.9 × 10⁵ m3 area of Tianshui City, Gansu Province, China, and led to 25 deaths [1]. A record-breaking rainstorm occurred in early July, 2018, in Hiroshima, Okayama, and Ehime Prefecture, Japan, causing landslides and flooding and, consequently, huge casualties and economic losses [2]. The rainstorm that occurred on 31 January 2022, in the north of Quito, the capital of Ecuador, triggered a landslide disaster and led to 24 deaths and severe damage to a large number of houses.
The formation, outbreak and development processes of rainstorms in mountainous areas are very complex. A series of secondary disasters are likely to occur in the same region following a rainstorm event, which means that these disasters are spatially correlated with each other [3,4]. However, previous research tends to assume that rainstorm-induced secondary disasters are homogeneous, linear and independent of each other [5]. Clearly, this assumption is not always valid, and the complex interrelations of multiple disasters, including disaster chains, disaster encounters, multi-disaster or disaster groups, have become a major concern in disaster research [6,7,8]. Previous studies on the rainstorm disaster chain have focused on three key themes, including case studies on the types, structures, causes and preventive measures of the rainstorm disaster chain [9,10,11]; the physical or numerical modelling of the triggering or formation mechanisms of the rainstorm disaster chain [12,13,14]; and the integration of remote sensing and GIS for determining the influence range of the rainstorm disaster chain [15].
There are few studies on the inhibition models of the rainstorm disaster chain in mountainous areas. Such models can be used to quantitatively analyze the inhibitory effect of improvement measures on the rainstorm disaster chain. In comparison to inhibition models developed based on fuzzy logic [16], the neural network [17], and expert systems [18], the Bayesian network (BN)-based model is more appealing in that it can not only describe the structure and uncertainty of the rainstorm disaster chain, but it can also combine the probability and causality between BN nodes by using visual graphs. Many BN-based inhibition models have been proposed for the typhoon disaster chain in coastal areas [19,20] and the earthquake disaster chain in mountainous areas [21,22,23], while few models are proposed for the rainstorm disaster chain in mountainous areas. It is evident that, because of the increasing occurrence of extreme weather, mountainous areas are particularly vulnerable to rainstorms and subsequent secondary disasters. Therefore, it is of great significance to develop BN-based inhibition models for the risk assessment of the rainstorm disaster chain in mountainous areas.
In this study, an inhibition model is proposed for the rainstorm–landslide–debris flow (R-L-D) disaster chain in the mountainous area of the Greater Bay Area (GBA), China, and its feasibility is verified. In response to the frequent occurrence of the R-L-D disaster chain in Wentouling (WTL), Nanhai District, Foshan City, GBA, the inhibition model is used to analyze the changes in the probabilities of BN nodes under different rainfall scenarios. The inhibitory effects of the environmental geological condition and the rescue speed on the R-L-D disaster chain are investigated under the most unfavorable scenario, and an inhibition strategy based on the early warning inhibition measures is proposed.

2. Materials and Methods

2.1. Description of the Study Area

WTL (Figure 1) is a small mountainous area located in Nanhai District, Foshan City, Guangdong Province; there are about 3,667,247 people in Nanhai District. The land-use types of WTL mainly include forest land, bare land, and construction land, among which the construction land mainly consists of some factories at the foot of the mountain. According to the detailed survey report of the WTL regional geological disaster, WTL has a complex terrain comprising mainly weathered limestone and argillaceous siltstone. The thickness of the regolith ranges from 1.5 to 4 m, with an average of 3 m; the average slope is about 25°, and landslides occur when the slip surface between the regolith and the underlying bedrock is out of balance. For instance, the landslide and debris flow disaster that occurred on 7 June 2005 led to one death and a direct economic loss of about RMB 20,000. Other landslides or debris flow disasters, which occurred on 9 June 2008, 21 September 2010, in the rainy season of 2012, 17 August 2013, and 7 May 2017, also caused severe casualties and economic losses.
The Guangdong Foshan Geological Engineering Survey Institute has identified 7 geological risk-prone regions in WTL, which are mainly distributed on both sides of the mountain, where the slope is between 30° and 40° and the surface is almost covered by talus accumulation resulting from the weathering of the bedrock. In Figure 1, the red dotted area is the most susceptible to the R-L-D disaster chain, and it has a higher frequency of landslides and slope debris flow disasters than the other six regions. For this reason, this region is selected as the study area.

2.2. Data Source

The data of interest in this study include environmental geological data and disaster data. The environmental geological data (e.g., lithological characteristics and geological structures) were collected from the Guangdong Geological Survey Bureau for the period 2013–2020. The disaster data (e.g., rainfall intensity, rainfall duration, landslide volume, disaster-related death, and direct economic loss) were collected from the GBA Emergency Management Bureau for the period of 2005–2020. Disaster data were extracted from 315 disaster events, part of which are shown in Table 1.

2.3. Methods

BN is an inferential model based on probability analysis and graphical theory, and it can not only quantitatively analyze the probabilities of BN nodes, but it can also save a lot of time for probabilistic reasoning [24,25,26]. Conceptually, a Bayesian network is a directed acyclic graph (DAG) composed of nodes representing variables and directed edges connecting these nodes. More precisely, for DAG, G = (V,E), where V represents a set of nodes and E is a set of directed edges between nodes.
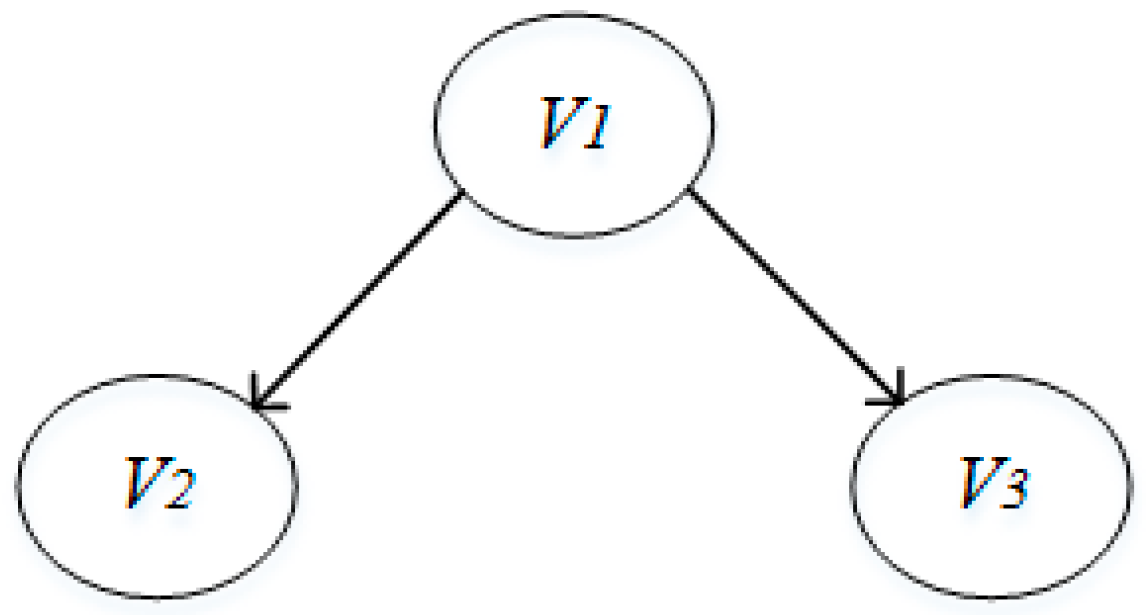
Figure 2 is a simple and typical example of a Bayesian network, where V 1 is the parent node of V 2 and V 3 . Given the conditional independence of BN nodes [27], the joint probability distribution of a set of variables can be expressed as
P X = p X 1 , X 2 , X 3 , . X n = i = 1 n P X i / P a X i
where X = X 1 , X 2 , X 3 , .   X n represents a set of variables composed of BN nodes, n is the number of BN variables, and P a X i is the probability of X i parent node.
In this example, V 2 and V 3 are the conditional independence, according to Formula (1),
P V 1 , V 2 , V 3 = P V 1 P V 2 / V 1 P V 3 / V 1
where P V 2 / V 1 and P V 3 / V 1 represent the probabilities of V 2 and V 3 occurring under the condition of V 1 occurring, respectively.

2.3.1. Steps for Developing the Inhibition Model of the R-L-D Disaster Chain

Step 1: Determining BN Nodes. BN nodes are the main components of the BN model, and each node represents a variable. BN nodes are generally determined by combining expert experience and the actual situation of the study area.
Step 2: Determining the BN structure. The BN structure can be represented using a visual graphical structure, and can be obtained through expert experience or parameter learning.
Step 3: Determining the conditional probability tables of the BN. The conditional probability tables of the BN can represent the dependence of BN nodes, and it can also be obtained through expert experience or parameter learning.
Step 4: Validating the BN model. The feasibility of the BN model is the basis of the model’s application.
The inhibition model proposed in this study is intended to provide proper ideas for inhibiting the R-L-D disaster chain. The inference and prediction of the inhibition model were performed using GeNIe (GeNIe 4.0, Decision Systems Laboratory, University of Pittsburgh, Pittsburgh, PA, USA), because it supports graphics and programming interfaces and has the advantages of simplicity, reliability, and efficiency.

2.3.2. Determining BN Nodes

In this study, an R-L-D disaster chain with 12 nodes was summarized based on the historical disaster data of the GBA. The nodes were classified into four types, including Hazardous Factor, Response Operation, Disaster Evolution and Disaster Result, as shown in Table 2. Most Hazardous Factor-type nodes represent the uncertainty in triggering the R-L-D disaster chain. When the Hazardous Factor was in an unfavorable state, there would be a high possibility for the occurrence of the R-L-D disaster chain. The Response Operation-type nodes are important for disaster reduction, and a proper emergency response would help to reduce death and direct economic loss. The Disaster Evolution-type nodes are related to the evolutionary process of the disaster chain. For example, landslides will provide the loose debris that is necessary for the occurrence of debris flow. The Disaster Result-type nodes represent the consequences of the disaster chain, including death and direct economic loss. The 12 nodes are briefly introduced as follows:
(a)
Rainfall intensity (mm·d−1). Rainfall intensity is an important parameter describing the rainstorm. In this study, rainfall intensity is divided into three states, ([0~50), [50~100], and (100,~)) mm·d−1, each having different consequences.
(b)
Rainfall duration (h). Rainfall duration refers to any continuous period of rainfall. The longer the rainfall duration is, the more the moisture accumulates in the soil, and, consequently, the higher the probability of disaster will be. In this study, rainfall duration is divided into two states ([0~24] and (24,~)) h.
(c)
Lithology weakness. According to the detailed survey report of the WTL regional geological disaster, we can classify rocks as strongly weathered rocks and weakly weathered rocks based on their composition, so “Lithology weakness” is divided into two states (No and Yes).
(d)
Geological structure. Geological structure describes the deformation and fracture development of rocks; if there are obvious deformations and fracture developments in rocks in the mountain, the Geological structural node state is Instability, otherwise, it is Stability.
(e)
Slope (°). Slope is the ratio of the vertical height to the horizontal width of the slope. In this study, slope is divided into two states ([0~30] and (30,~))°.
(f)
Emergency rescue. Emergency rescue is divided into two states (Effective Response, characterized by a timely arrival at the disaster site and effective rescue, and Poor Response, characterized by a failure to implement a successful rescue at the earliest possible time).
(g)
Landslide occurrence. It is divided into two states (No and Yes).
(h)
Landslide volume (104 m3). Landslide volume is divided into three states (0, (0~10], and (10,~))104 m3 according to the historical disaster data of the GBA and the classification standard of landslides proposed by the China Geological Survey.
(i)
Debris flow occurrence. It is divided into two states (No and Yes).
(j)
Debris flow volume (104 m3). It is divided into three states (0, (0~2] and (2,~)) 104 m3 according to the historical disaster data of the GBA and the classification standard of debris flow proposed by the China Geological Survey.
(k)
Death (persons). Death is the most important factor for evaluating Disaster Result. It is divided into three states (0, (0~3], and (3,~)) persons according to the historical disaster data of the GBA and the governmental classification standard of disaster proposed by the China Geological Survey.
(l)
Direct economic loss (104 RMB). Direct economic loss is a quantitative measure of the consequence of a disaster, and it is divided into three states (0, (0~100) and (100,~)) 104 RMB.

2.3.3. Determining BN Structure

An extensive literature search was conducted in the Web of Sciences and China National Knowledge Infrastructure (CNKI) databases using keywords related to R-L-D disasters such as rainfall, landslide, and debris flow. Then, the influencing factors of the BN nodes were identified, and the BN structure of the R-L-D disaster chain was obtained (Figure 3). It is found that the rainfall intensity, rainfall duration, geological structure, lithology and slope are the main influencing factors of landslides, and the loose materials provided by landslides, as well as the rainfall intensity, rainfall duration and slope, are the main influencing factors of debris flow. Landslide and debris flow may cause death and direct economic loss.

2.3.4. Determining the Conditional Probability Table of BN Nodes

In order to analyze the evolution of the R-L-D disaster chain, the dependence of BN nodes is characterized using a conditional probability table (CPT). According to the parent–child relationship, the BN nodes in Figure 3 can be divided into three types; the nodes belonging to Hazardous Factor and Response Operation have no parent nodes and their prior probabilities are given based on the environmental geological data and the disaster data of the GBA. The nodes belonging to Disaster Evolution have both parent and child nodes, while the nodes belonging to Disaster Result only have a parent node. These two types of nodes are affected by their parent nodes. For example, the conditional probability distributions of the three states of the Death nodes are affected by the combination of the different states of nodes related to emergency rescue, the landslide volume and the debris flow volume. In this study, an expectation maximization algorithm (EM) is implemented using the GeNIe software for parameter learning according to the historical disaster data of the GBA, and the CPT that indicates the probability between the parent and child nodes is obtained. The CPTs of the Death nodes are shown in Table 3 as an example. When the CPTs of all nodes are obtained, the initial BN model with the CPTs can be obtained for inference and validation. In Figure 4, I, II and III represent the three states of the node. For example, for the rainfall intensity node, I, II and III represent [0~50), [50~100] and (100,~), respectively.

2.3.5. Validating BN Model

In order to guarantee the inference accuracy of the proposed BN model, the model was verified using the Brier score [28,29,30]. The introduction of the Brier score method is as follows:
The Brier score method is often used to evaluate the accuracy of variable probability prediction in network models. We assume that the target variable to be evaluated in the network model is N i (1 ≤ im), where N i has u possible states (u ≥ 2), i.e., N i 1 ,   N i 2 , …,   N i u , N i j (1 ≤ ju), the inference probability of   N i j is P i j , and the actual value is S i j , when N i j is the actual value of N i , S i j = 1 , or else S i j = 0 .
B represents the average prediction bias of m target variables in a BN,
B = 1 m i = 1 m j = 1 u P i j S i j 2
where, B ∈ [0, 2], the smaller the B value, the smaller the network prediction deviation, and the better the network prediction effect. If B ≤ 0.6, the BN prediction effect meets the requirements; on the contrary, it does not meet the requirements.
(1)
The typical R-L-D disaster chain event. On 7 May 2017, a rainstorm occurred in the geological risk-prone regions of WTL and triggered landslides and debris flow, causing 2 deaths, the collapse of more than 50 houses, damage to numerous public facilities such as roads and electricity infrastructures, and a direct economic loss of approximately RMB 883,000.
(2)
Inference and validation. According to the environmental geological data and the disaster data in this event, the nodes of Hazardous Factor and Response Operation are set as follows: (a) rainfall intensity is set at (100,~) mm.d−1; (b) rainfall duration is set at (24,~) h; (c) Lithology weakness is set at Yes; (d) Geological structure is set at Instability; (e) Slope is set at (30,~)°; and (f) Emergency rescue is set at Poor response. The BN model is used to infer the posterior probability of other nodes (Table 4). The maximum posterior probabilities in Table 4 are taken as the predicted values, which are then compared with the measured values (Table 5). It is seen from Table 4 that there is a good agreement between the predicted and measured values, and the B value (0.207) calculated using the Brier score is lower than 0.6, which indicates that the proposed inhibition model is reliable and therefore it can be used for subsequent scenario analysis.

3. Results and Discussion

In this study, the typical geological risk-prone region in WTL (the red dotted area in Figure 1) is taken as the study area. Different combinations of Hazardous Factor and Response Operation node types are used for the scenario analysis of the R-L-D disaster chain, and the inhibition strategy for the R-L-D disaster chain is further proposed.

3.1. Impact of Rainfall Scenario on the R-L-D Disaster Chain

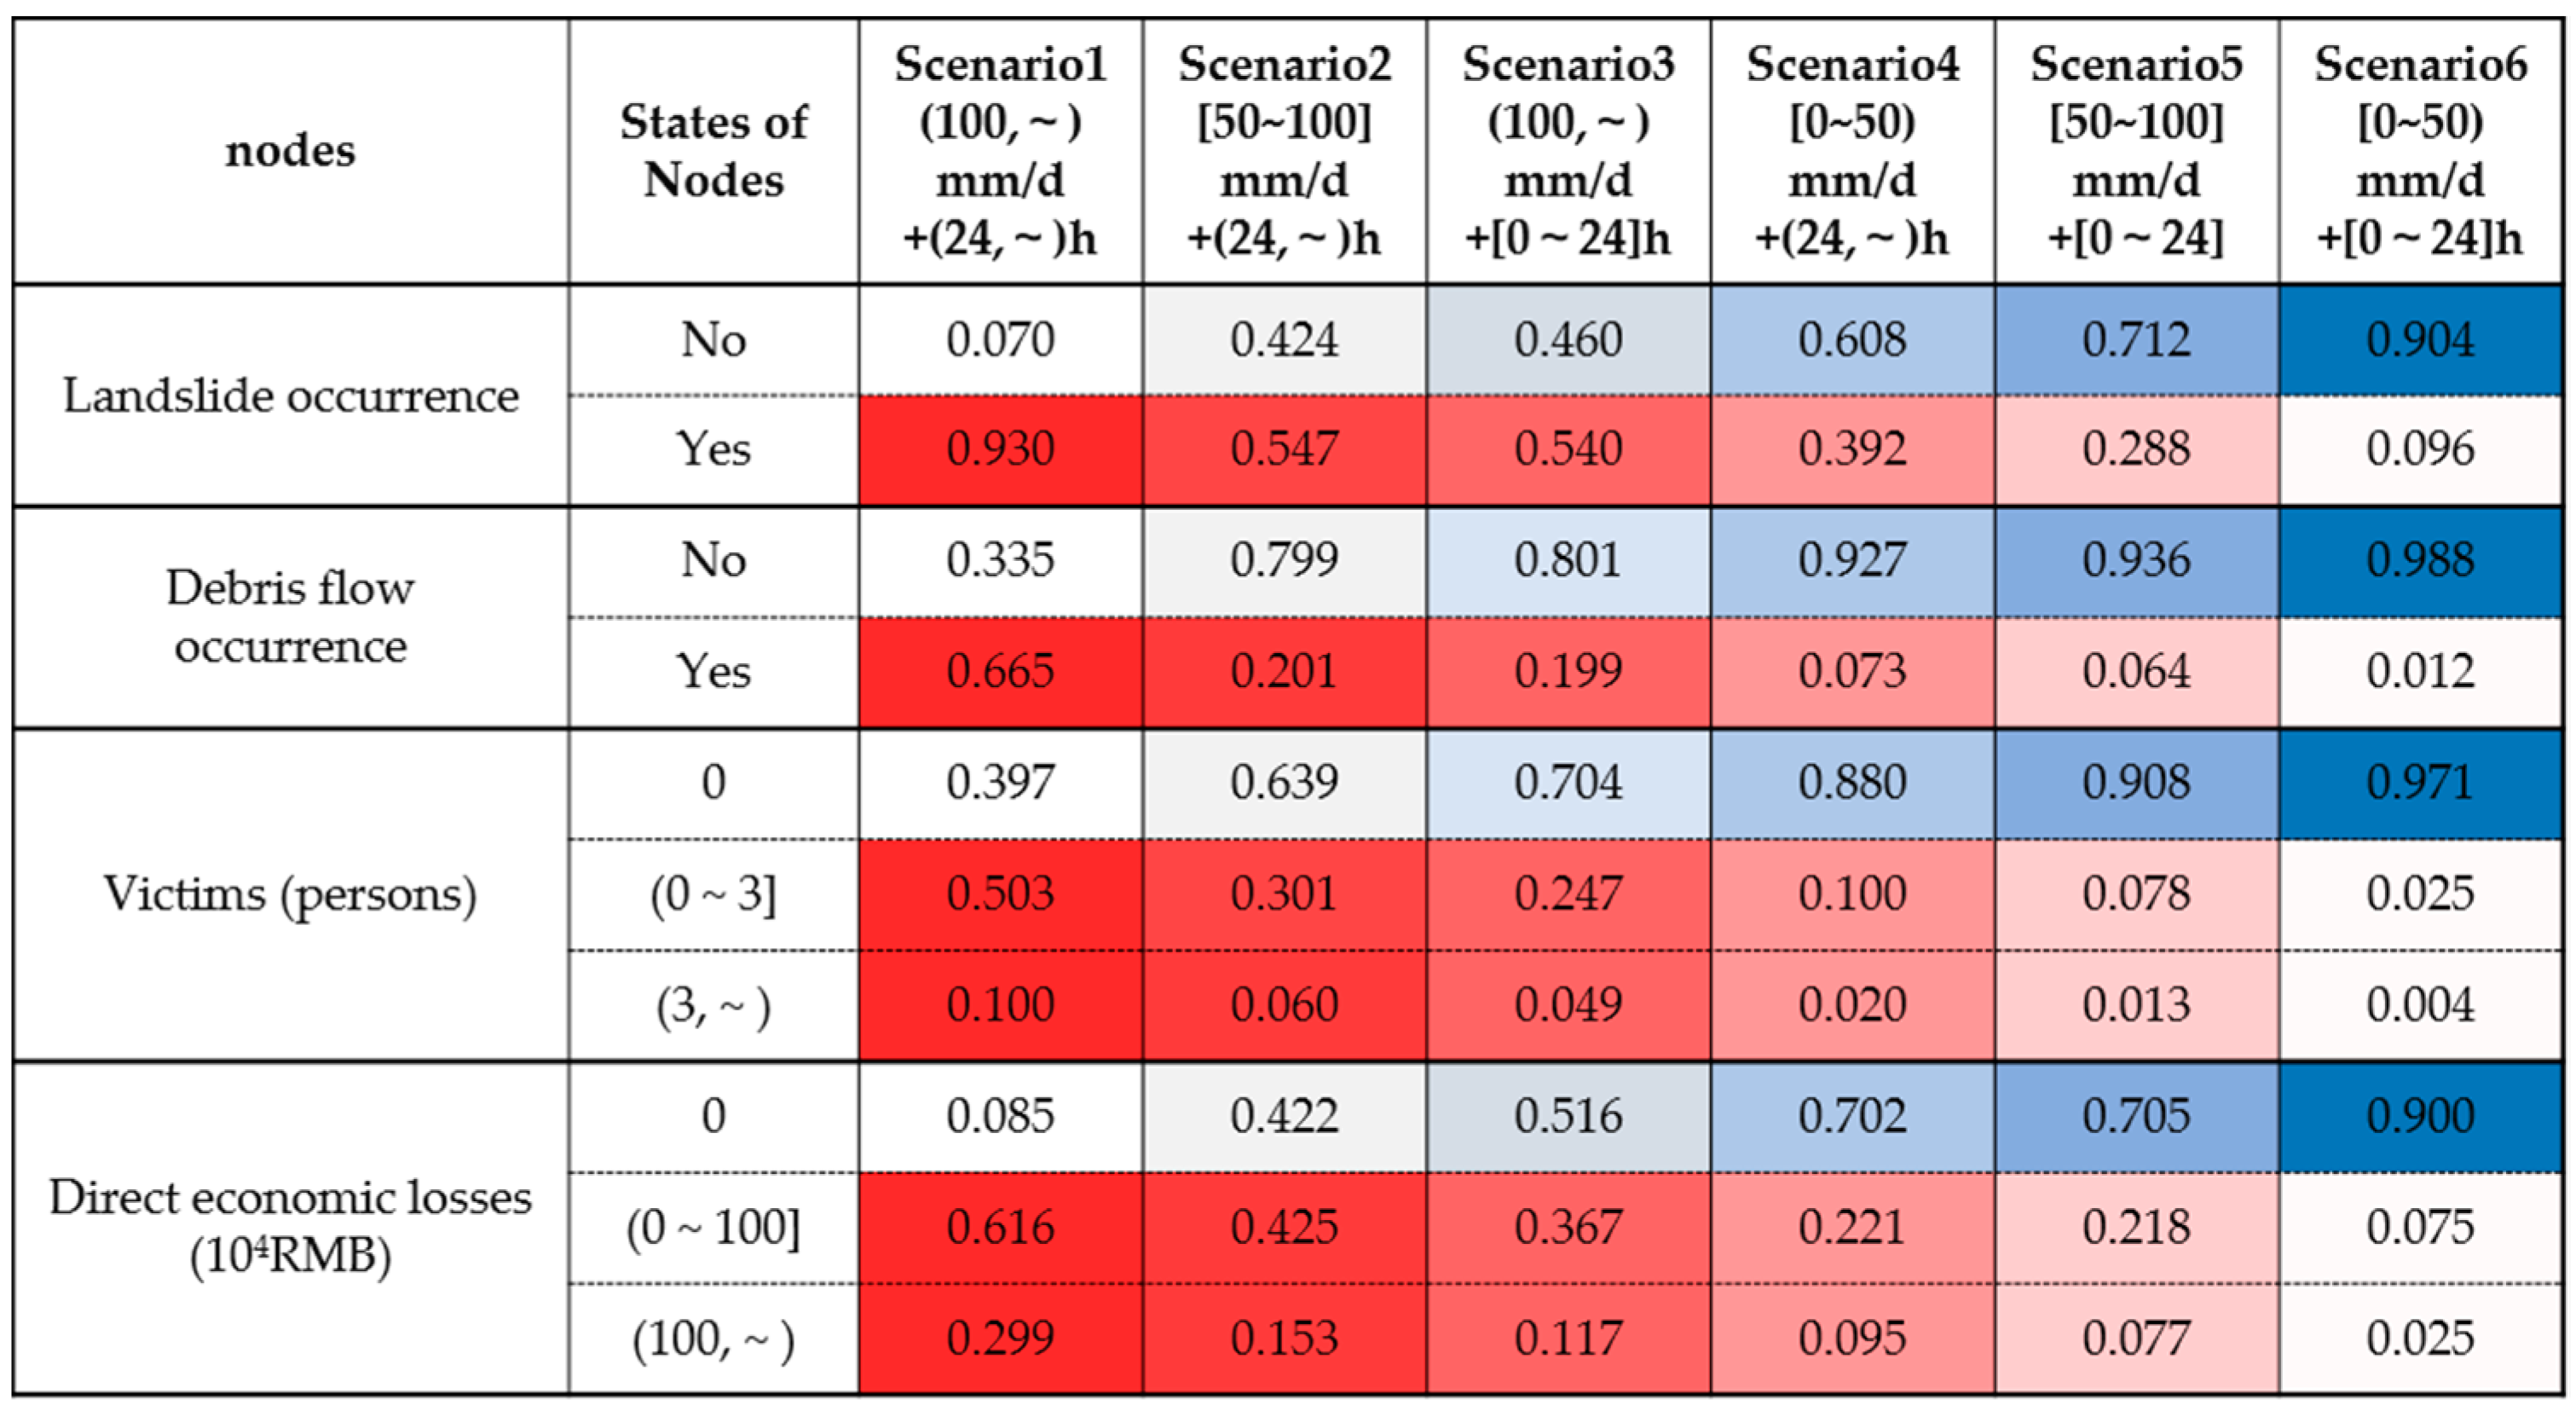
In order to quantitatively evaluate the impact of the rainfall scenario on the evolution of the R-L-D disaster chain, six scenarios are set in this study (Figure 5). In Scenario 1, rainfall intensity is set at (100,~) mm/d and rainfall duration is set at (24,~) h. Similar settings are made for other scenarios. The types of other Hazardous Factor and Response Operation nodes are set as follows based on the historical disaster data of WTL: (a) Lithology weakness is set at Yes; (b) Geological structure is set at Instability; (c) Slope is set at (30,~); (d) Emergency rescue is set at Poor response. The final inference results for different rainfall scenarios are shown in Figure 5.
In Figure 5, a darker blue color indicates a higher probability of no landslides, debris flow, death or direct economic loss. It is found that the probability of no landslides, debris flow, death or direct economic loss reaches a maximum of 0.904, 0.988, 0.971, and 0.900, respectively, in Scenario 6 ([0–50) mm/d + [0–24] h). A darker red color indicates a higher probability of landslides, debris flow, death and direct economic loss. It is found that the probability of landslides, debris flow, death and direct economic loss reaches a maximum of 0.930, 0.665, 0.603, and 0.915, respectively, in Scenario 1 ((100,~) mm/d + (24,~) h). A comparison between Scenario 1 and Scenario 4 reveals that, given the rainfall duration of (24,~) h, increasing rainfall intensity can increase the probability of death from 0.120 to 0.603 and the probability of direct economic loss from 0.316 to 0.915. Similarly, a comparison between Scenario 1 and Scenario 3 reveals that, given a rainfall intensity of (100,~) mm/d, increasing rainfall duration can increase the probability of death from 0.296 to 0.603 and the probability of direct economic loss from 0.484 to 0.915. Heavy rainfall significantly increases the occurrence of landslides and debris flow, which is consistent with the results of previous research [31]. Thus, it is concluded that Scenario 6 is the most favorable scenario and Scenario 1 is the most unfavorable scenario, and that both rainfall intensity and duration have a great impact on the evolution of the R-L-D disaster chain.
Next, the inhibitory effects of improved environmental geological conditions and rescue speed on the R-L-D disaster chain under the most unfavorable scenario ((100,~) mm/d + (24,~) h) are analyzed.

3.2. The Inhibitory Effects of Environmental Geological Conditions on the R-L-D Disaster Chain

The environmental geological conditions of interest in this study include slope, lithology, and geological structure. In order to quantitatively analyze their inhibitory effects on the R-L-D disaster chain in the typical geological risk-prone region under the most unfavorable rainfall scenario ((100,~) mm/d + (24,~) h), four scenarios were set by combining the Slope, Lithology weakness, and Geological structure nodes (Figure 6). Scenario 1 ((30,~)° + Yes + Instability) represents the current environmental geological condition. In Scenario 2, the slope is reduced. In Scenario 3, the lithology is improved. In Scenario 4, the geological structure is improved. The types of other Hazardous Factor and Response Operation nodes are set as follows: (a) Rainfall intensity is set at (100,~) mm·d−1; (b) Rainfall duration is set at (24,~) h; and (c) Emergency rescue is set at Poor response.
Figure 6 shows that, compared to Scenario 1, the probabilities of landslides, debris flow, death and direct economic loss are greatly reduced in other scenarios. The lighter the red color is, the greater the inhibitory effect on the R-L-D disaster chain will be, while the lighter the blue color is, the lesser the inhibitory effect on the R-L-D disaster chain will be. It is found that the most significant inhibitory effect is obtained by improving the geological structure, and the probability of landslides, debris flow, death and direct economic loss is reduced from 0.930, 0.665, 0.603 and 0.915 to 0.246, 0.235, 0.192 and 0.297, respectively. It is worth noting that the lowest probability of debris flow is obtained by reducing the slope, which may be attributed to the effect of the slope on both landslides and debris flow. A comparison of the red colors in Scenario 2, Scenario 3 and Scenario 4 reveals that the inhibitory effect follows the order of geological structure > slope > lithology. Thus, improving the environmental geological conditions such as the slope, lithology and geological structure can greatly inhibit the occurrence of the R-L-D disaster chain.

3.3. The Inhibitory Effect of Rescue Speed on the R-L-D Disaster Chain

In order to quantitatively analyze the inhibitory effect of rescue speed on the R-L-D disaster chain in the typical geological risk-prone region under the most unfavorable scenario ((100,~) mm/d + (24,~) h), two scenarios (Poor response and Effective response) are considered. The types of Hazardous Factor nodes are set as follows: (a) Rainfall intensity is set at (100,~) mm·d−1; (b) Rainfall duration is set at (24,~) h; (c) Lithology weakness is set at Yes; (d) Geological structure is set at Instability; and (e) Slope is set at (30,~)°.
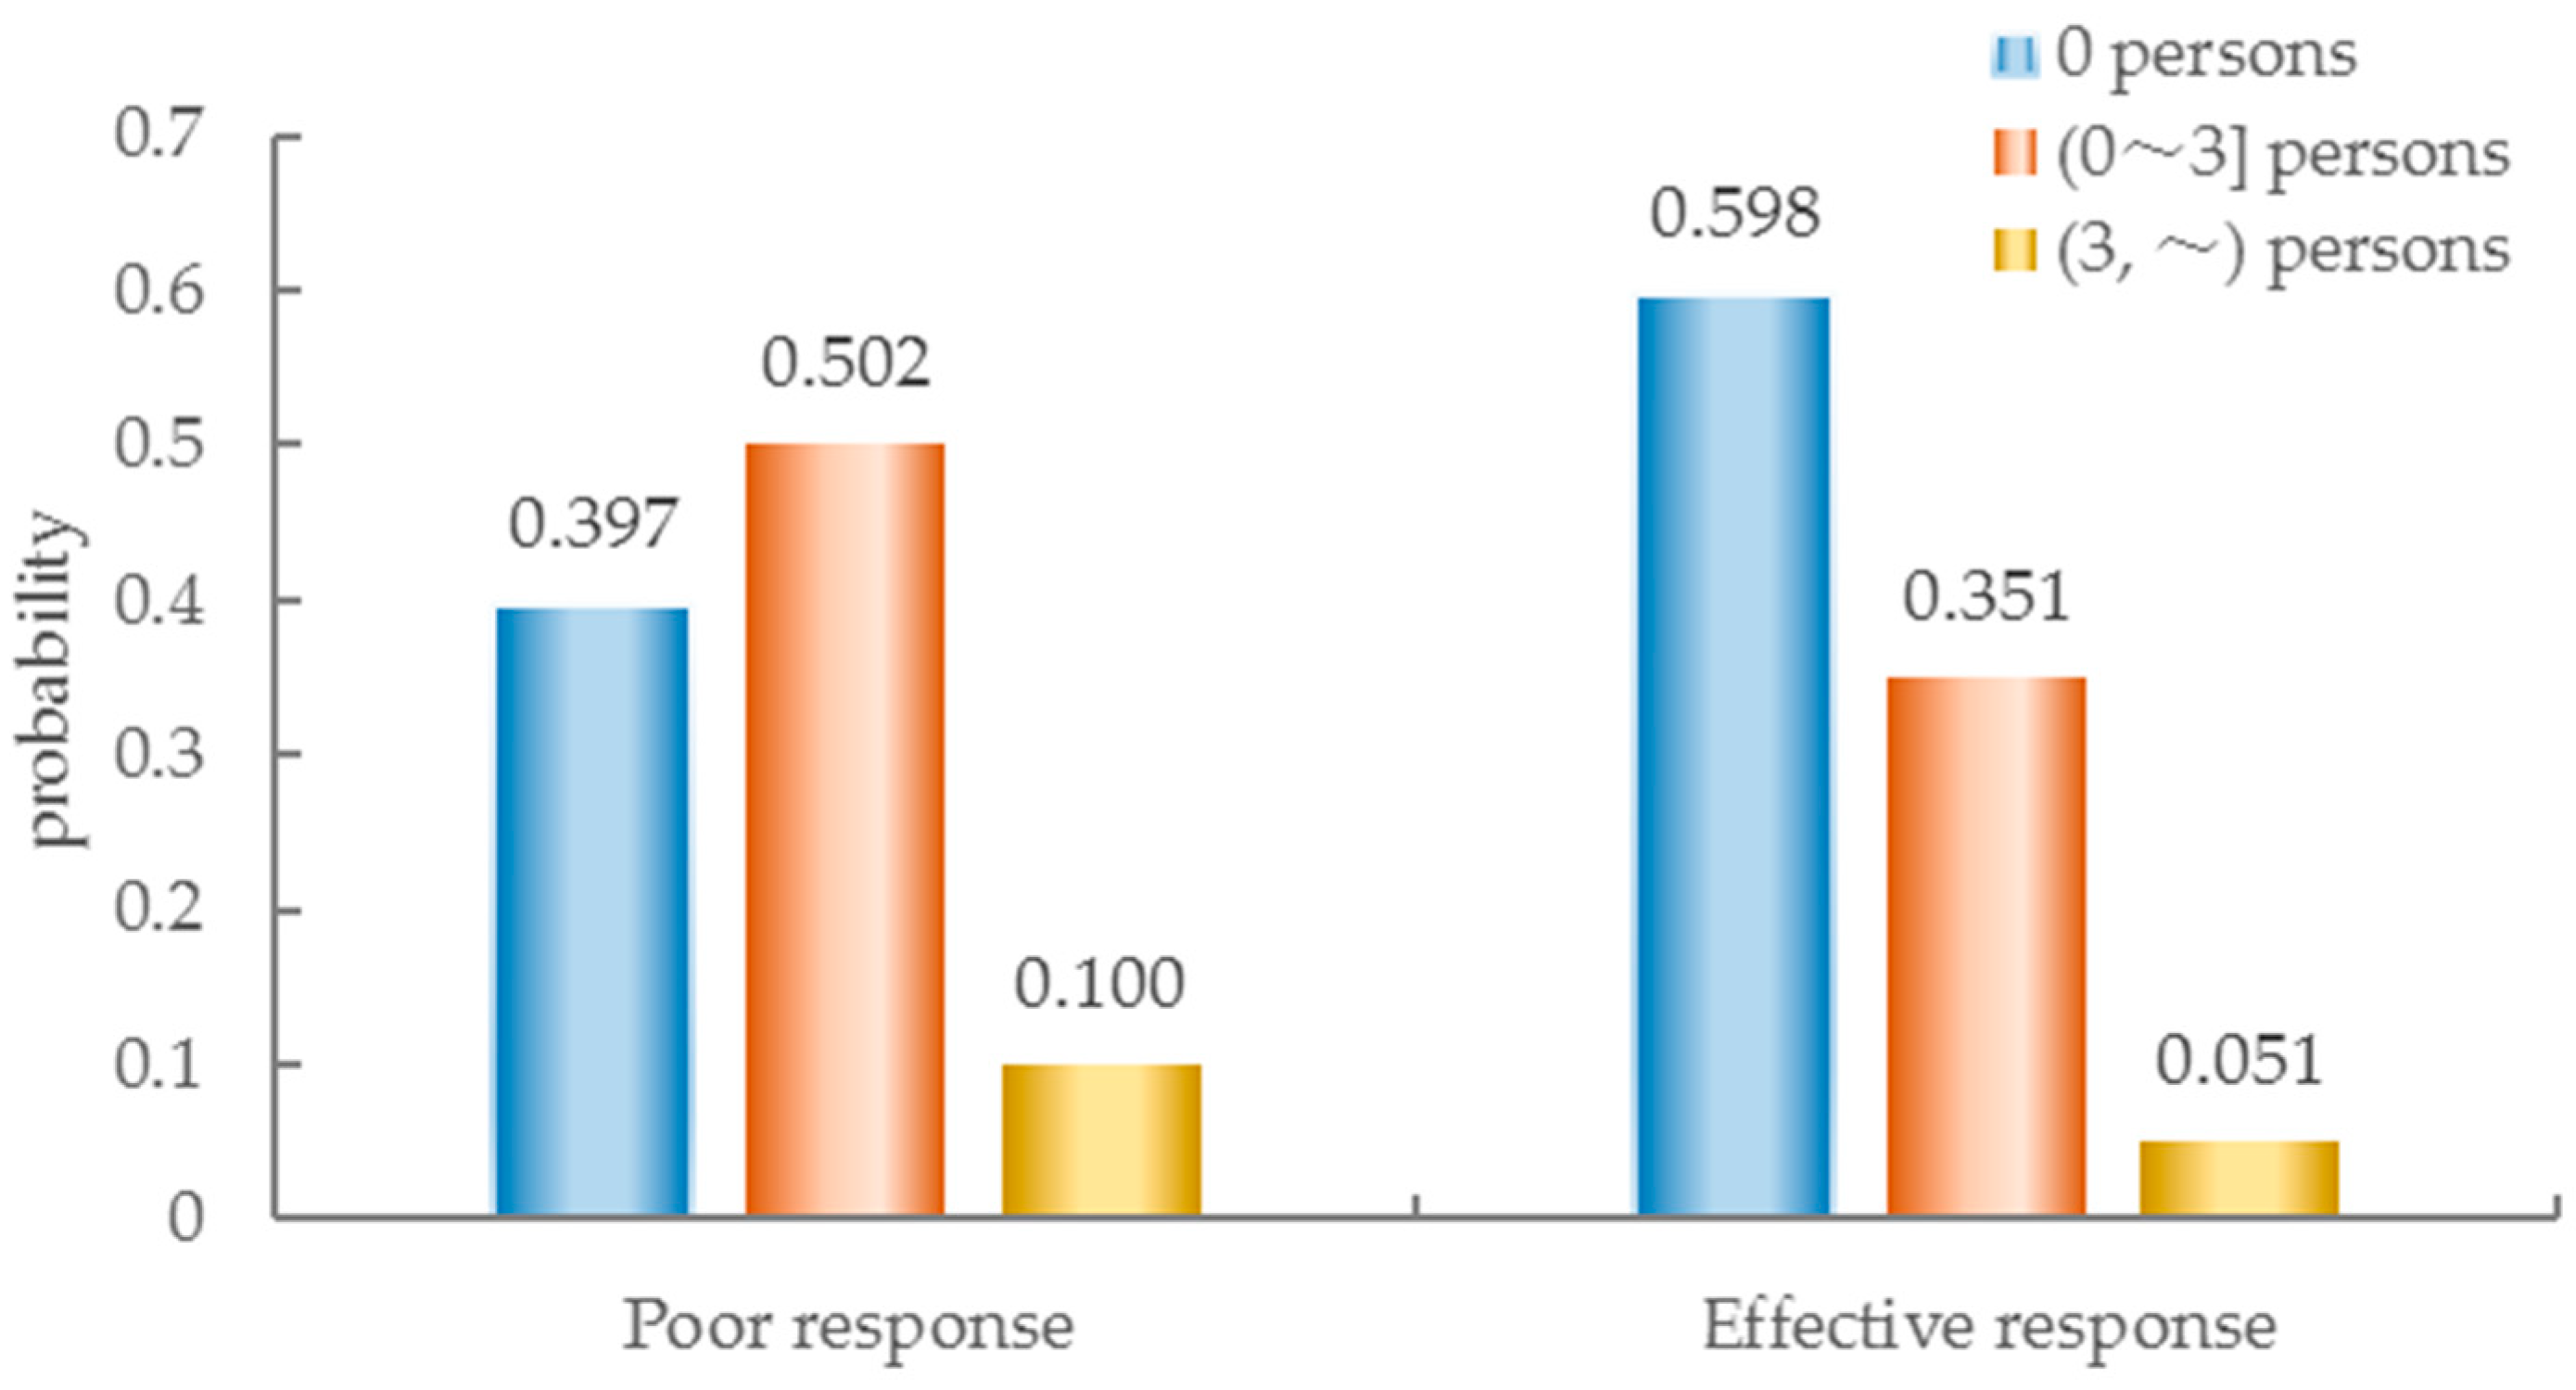
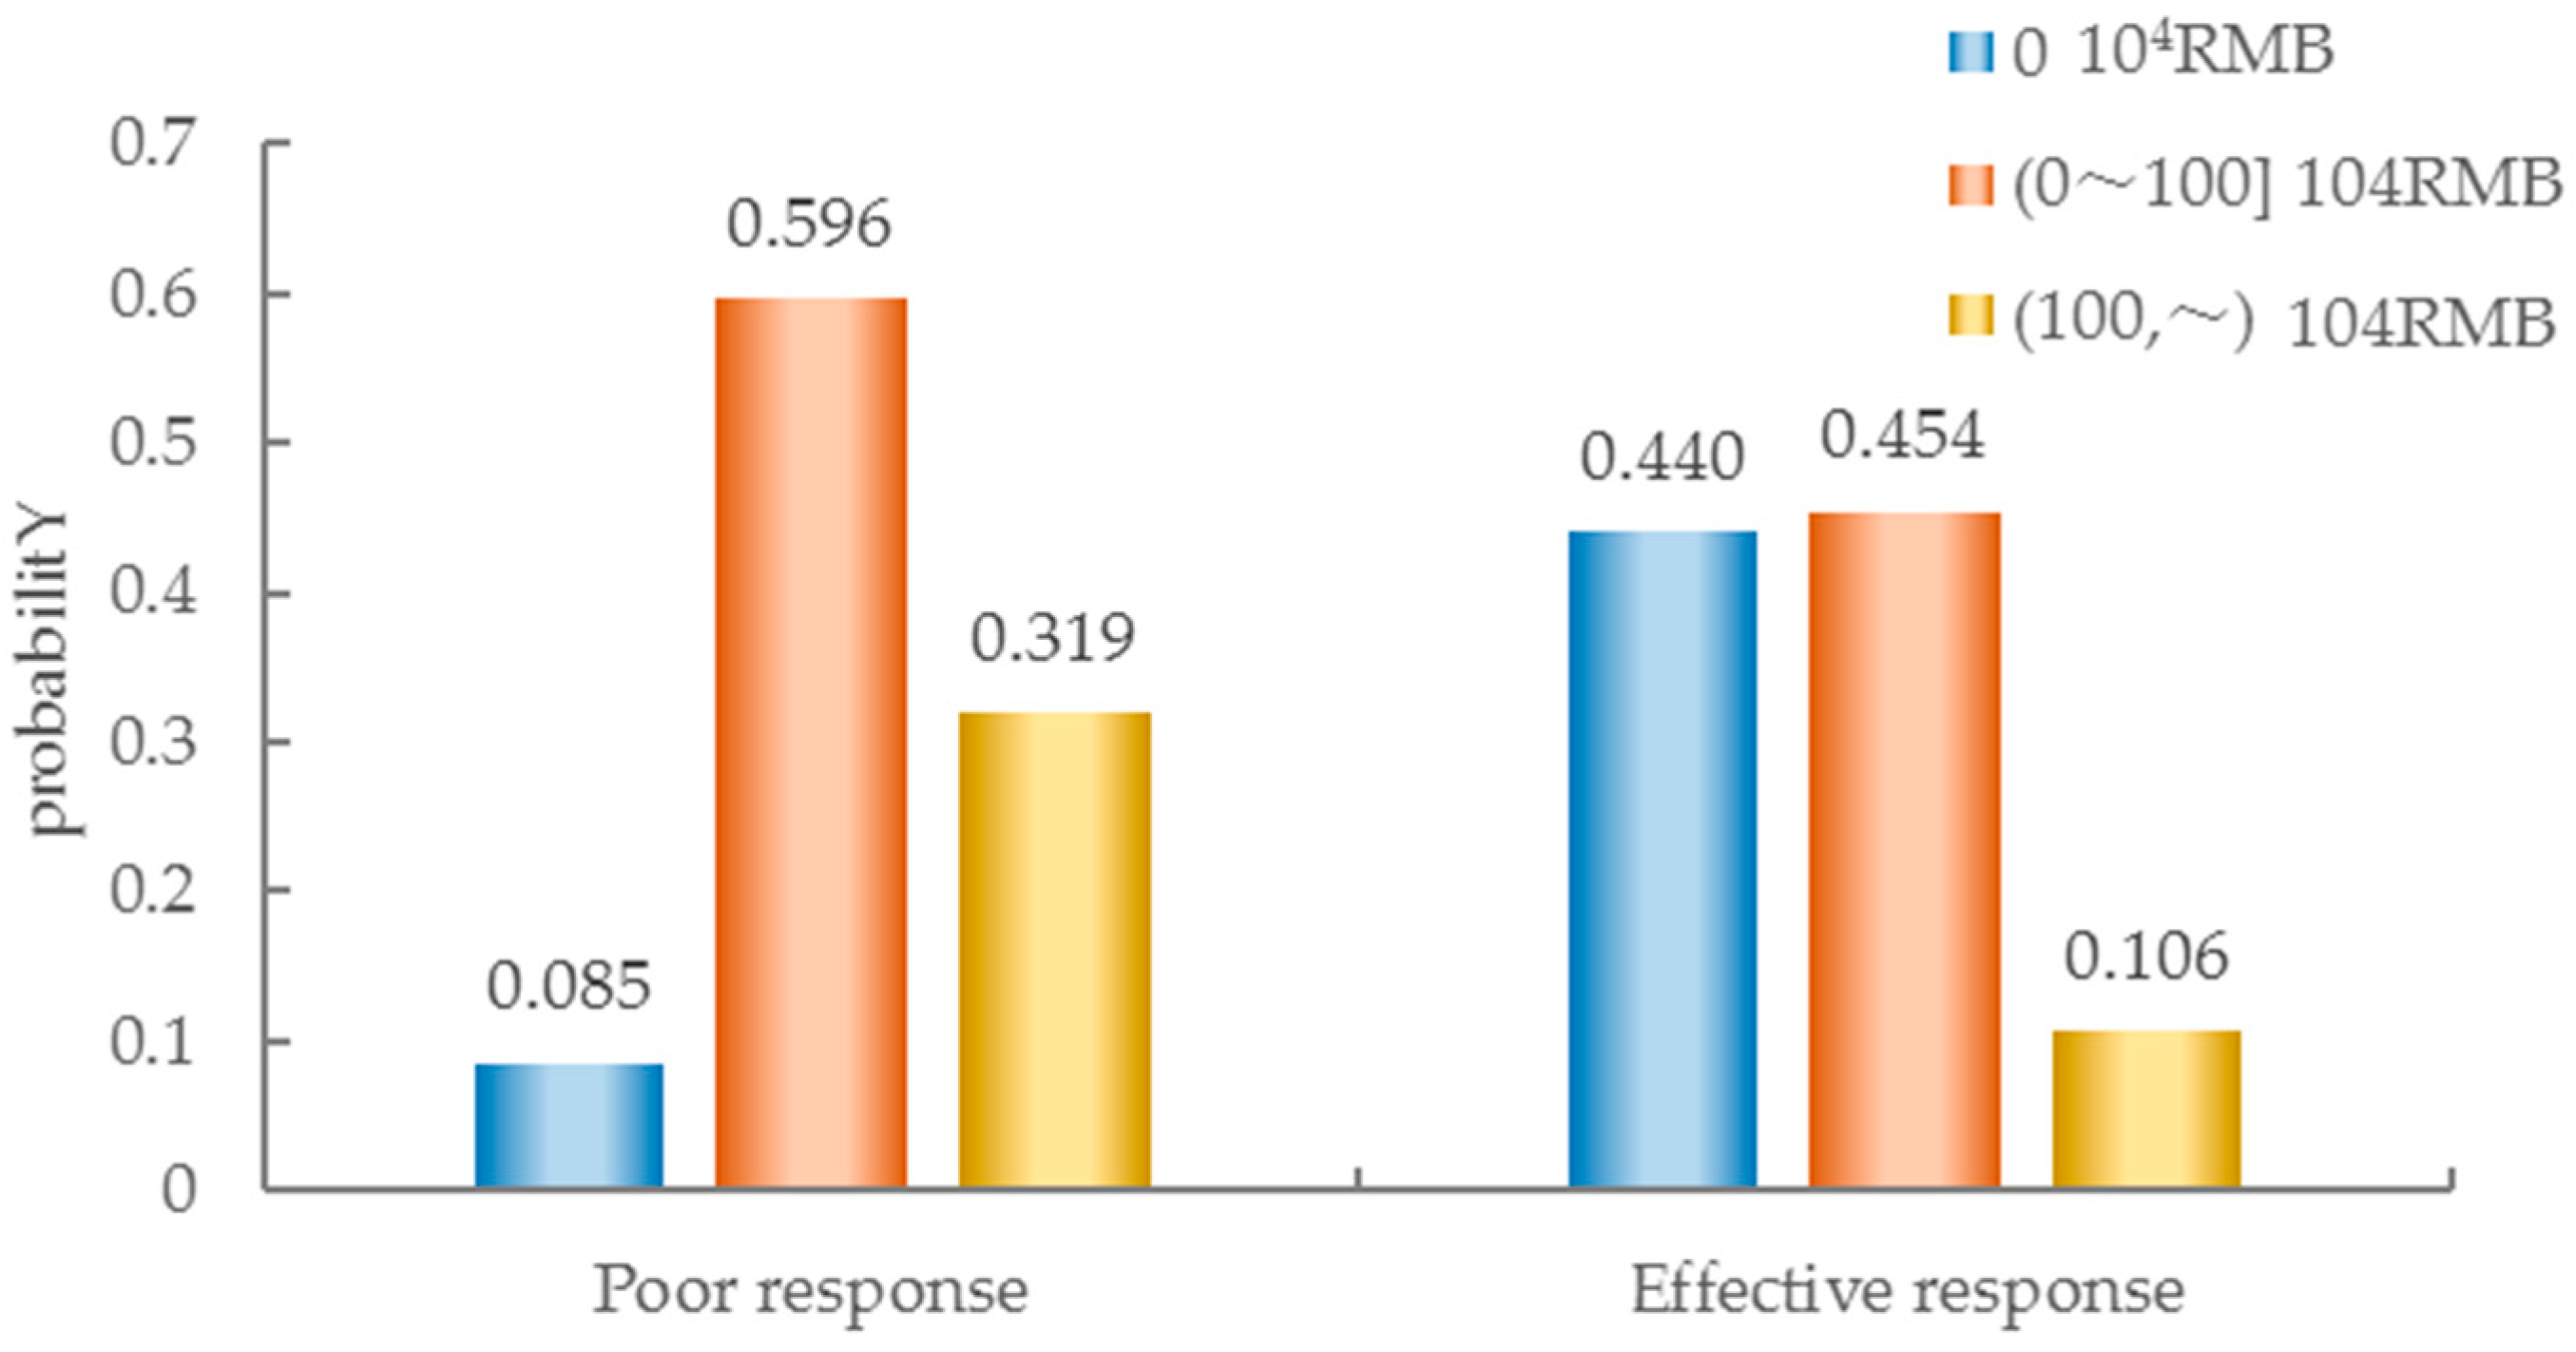
The probabilities for different scenarios are shown in Figure 7 and Figure 8. It is found that increasing the rescue speed from Poor response to Effective response significantly reduces the probability of deaths of (0~3] and (3,~) persons from 0.502 and 0.100 to 0.351 and 0.051, and the probability of the direct economic loss of (0~100] 104 RMB and (100,~)104 RMB from 0.596 and 0.319 to 0.454 and 0.106, respectively. The overall probability of death and direct economic loss is decreased from 0.603 and 0.915 to 0.402 and 0.560, respectively. These results indicate that rescue speed plays a critical role in inhibiting death and direct economic loss in the R-L-D disaster chain.

3.4. Inhibition Framework for the R-L-D Disaster Chain

In this study, from the perspective of disaster system theory [32], an inhibition framework consisting of the early warning, inhibition, and measures layers is proposed for the R-L-D disaster chain (Figure 9).
Early warning layer: Under the most favorable rainfall scenarios (i.e., [0~50) mm/d + [0~24] h, [50~100] mm/d + [0~24], and [0~50) mm/d + (24,~) h), the probability of landslides and debris flow is lower than 0.5, indicating a low probability of the R-L-D disaster chain. Under moderate rainfall scenarios (i.e., [50~100] mm/d + (24,~) h and (100,~) mm/d + [0~24] h), the probability of landslides is higher than 0.5 and that of debris flow is lower than 0.5, indicating a low probability of the R-L-D disaster chain. Under the most unfavorable rainfall scenarios (i.e., (100,~) mm/d + (24,~) h), the probability of landslides and debris flow is higher than 0.5, indicating a high probability of the R-L-D disaster chain. Therefore, landslides are likely to occur in the scenarios of [50~100] mm/d + (24,~) h and (100,~) mm/d + [0~24] h, while the R-L-D disaster chain should be warned of and predicted in the scenarios of (100,~) mm/d + (24,~) h.
Inhibition layer: Under the most unfavorable rainfall scenario, improving the environmental geological conditions and rescue speed can greatly reduce the probability of death and direct economic loss. For example, the probability of death and direct economic loss is reduced by 0.411 and 0.619 when the environmental geological condition is improved, while it is reduced by 0.201 and 0.355 when the rescue speed is increased, respectively.
Measures layer: non-engineering and engineering measures are proposed to inhibit the R-L-D disaster chain. Non-engineering measures are intended to improve the early warning and forecasting of rainstorm disasters and safety awareness, while engineering measures are intended to improve the slope (e.g., anti-skid piles, anchor cables, and anchor rods), drainage channels, and roads.

4. Conclusions

In this study, a BN-based inhibition model is proposed for the R-L-D disaster chain. Based on the scenario analysis, an inhibition framework consisting of the early warning, inhibition, and measures layers is proposed for the R-L-D disaster chain. The main conclusions of this study are presented as follows:
(1)
On the basis of the B value (0.207 < 0.6) calculated using the Brier score method, the feasibility of the inhibition model is verified.
(2)
Different rainfall scenarios are set by combining the types of Hazardous Factor and Response Operation nodes in a typical geological risk-prone region of WTL, and the probabilities of BN nodes under different rainfall scenarios are analyzed. Under the most unfavorable rainfall scenario ((100,~) mm/d + (24,~) h), the probability of landslides and debris flow is 0.930 and 0.665, respectively. Improving environmental geological conditions such as slope, lithology, and geological structure can greatly inhibit the occurrence of the R-L-D disaster chain. Moreover, the improvement of the geological structure condition is the most significant, and reduces the probability of landslides and debris flow by 0.684 and 0.430, respectively, as well as reducing the probability of death and direct economic loss by 0.411 and 0.619, respectively. The inhibitory effect follows the order of geological structure > slope > lithology. Increasing the rescue speed reduces the probability of death and direct economic loss from 0.603 and 0.915 to 0.402 and 0.560, respectively.
However, given the difficulties in collecting environmental geological data in mountainous areas, this study has focused on the inhibition of the R-L-D disaster chain in a small-scale geological risk-prone region. As more environmental geological data accumulate in the future, the proposed inhibition model can be applied to a larger scale.

Supplementary Materials

The following supporting information can be downloaded at: https://www.mdpi.com/article/10.3390/w15173124/s1.

Author Contributions

All authors contributed significantly to this manuscript. T.W. was responsible for the original idea and the theoretical aspects of the paper. Y.T. and X.X. were responsible for the methodology design. J.Y. was responsible for proofreading the article. X.T. and H.C. were responsible for the data collection and preprocessing. P.X. drafted the manuscript. All authors have read and agreed to the published version of the manuscript.

Funding

This work was supported by the National Key R&D Program of China (Grant No. 2021YFC3001000) and the National Natural Science Foundation of China (Grant No. 52209042).

Data Availability Statement

Data is contained within the article or Supplementary Material.

Acknowledgments

The authors are grateful to the anonymous reviewers for their insightful and helpful comments to improve the manuscript.

Conflicts of Interest

The authors declare no conflict of interest.

References

  1. Peng, J.B.; Fan, Z.J.; Wu, D.; Zhuang, J.Q.; Dai, F.C.; Chen, W.W.; Zhao, C. Heavy rainfall triggered loess–mudstone landslide and subsequent debris flow in Tianshui, China. Eng. Geol. 2015, 186, 79–90. [Google Scholar] [CrossRef]
  2. Mori, S.; Ono, K. Landslide disasters in Ehime Prefecture resulting from the July 2018 heavy rain event in Japan—ScienceDirect. Soils Found. 2019, 59, 2396–2409. [Google Scholar] [CrossRef]
  3. Shi, P.J. Theory and practice of disaster study. J. Nat. Disasters 1996, 5, 8–19. [Google Scholar]
  4. Zhang, T.T.; Yin, Y.P.; Li, B.; Liu, X.J.; Wang, M.; Gao, Y.; Wan, J.W.; Gnyawali, K.R. Characteristics and dynamic analysis of the February 2021 long-runout disaster chain triggered by massive rock and ice avalanche at Chamoli, Indian Himalaya. J. Rock Mech. Geotech. Eng. 2023, 15, 296–308. [Google Scholar] [CrossRef]
  5. Selva, J. Long-term multi-risk assessment: Statistical treatment of interaction among risks. Nat. Hazards 2013, 67, 701–722. [Google Scholar] [CrossRef]
  6. Kappes, M.S.; Keiler, M.; Elverfeldt, K.V.; Glade, T. Challenges of dealing with multi-hazard risk: A review. Nat. Hazards 2012, 64, 1925–1958. [Google Scholar] [CrossRef]
  7. Xu, L.F.; Meng, X.W.; Xu, X.G. Natural hazard chain research in China: A review. Nat. Hazards 2014, 70, 1631–1659. [Google Scholar] [CrossRef]
  8. Niu, X.D.; Hou, K.P.; Sun, H.F. Study on the Prevention and Control of Downhole Debris Flows Based on Disaster Chain Theory. Water 2023, 15, 2367. [Google Scholar] [CrossRef]
  9. Chen, H.; Dadson, S.; Chi, Y.G.C. Recent rainfall-induced landslides and debris flow in northern Taiwan. Geomorphology 2006, 77, 112–125. [Google Scholar] [CrossRef]
  10. Kim, S.-W.; Chun, K.-W.; Otsuki, K.; Shinohara, Y.; Kim, M.; Kim, M.; Lee, D.; Seo, J.; Choi, B. Heavy rain types for triggering shallow landslides in South Korea. J. Fac. Agric. Kyushu Univ. 2015, 60, 243–249. [Google Scholar] [CrossRef]
  11. Du, W.J.; Sheng, Q.; Fu, X.D.; Chen, J.; Wei, P.F.; Zhou, Y.Q. Post-failure analysis of landslide blocking river using the two-phase double-point material point method: A case of western Hubei. China. Bull. Eng. Geol. Environ. 2023, 82, 98. [Google Scholar] [CrossRef]
  12. Cui, Y.; Kong, J.M.; Tian, S.J.; A, F.Y. The Critical Role for Heavy Rainfall in the Evolution of the Mountain Hazards Chains. J. Mt. Sci. 2011, 29, 87–94. [Google Scholar]
  13. Iida, T. A stochastic hydro-geomorphological model for shallow landsliding due to rainstorm. Catena 1999, 34, 293–313. [Google Scholar] [CrossRef]
  14. Li, C.R.; Wang, M.; Chen, F.; Coulthard, T.J.; Wang, L. Integrating the SLIDE model within CAESAR-Lisflood: Modeling the ? rainfall-landslide-flash flood? disaster chain mechanism under landscape evolution in a mountainous area. Catena 2023, 227, 107124. [Google Scholar] [CrossRef]
  15. Miura, T.; Nagai, S. Landslide Detection with Himawari-8 Geostationary Satellite Data: A Case Study of a Torrential Rain Event in Kyushu, Japan. Remote Sens. 2020, 12, 1734. [Google Scholar] [CrossRef]
  16. Iuliis, M.D.; Kammouh, O.; Cimellaro, P.; Tesfamariam, S. Quantifying restoration time of pipelines after earthquakes: Comparison of Bayesian belief networks and fuzzy models. Int. J. Disaster Risk Reduct. 2021, 64, 102491. [Google Scholar] [CrossRef]
  17. Chen, Z.G.; Song, J.; Yang, Y.P. Similarity Measurement of Metadata of Geospatial Data: An Artificial Neural Network Approach. ISPRS Int. J. Geo-Inf. 2018, 7, 90. [Google Scholar] [CrossRef]
  18. Buendia-Buendia, F.S.; Buendia, G.; Andina, D. Determining geostrophic wind direction in a rainfall forecast expert system. Integr. Comput. Aided Eng. 2019, 26, 111–121. [Google Scholar] [CrossRef]
  19. Qiu, J.G.; Wang, Z.Q.; Ye, X.; Liu, L.L.; Dong, L.L. Modeling method of cascading crisis events based on merging Bayesian Network. Decis. Support Syst. 2014, 62, 94–105. [Google Scholar] [CrossRef]
  20. Dong, L.L. Modeling Emergency Events Chain Based on Bayesian Networks. Master’s Thesis, Dalian University of Technology, Dalian, China, 2009. [Google Scholar]
  21. Han, L.N.; Zhang, J.Q.; Zhang, Y.C.; Lang, Q.L. Applying a Series and Parallel Model and a Bayesian Networks Model to Produce Disaster Chain Susceptibility Maps in the Changbai Mountain area, China. Water 2019, 11, 2144. [Google Scholar] [CrossRef]
  22. Wang, J.X.; Gu, X.Y.; Huang, T.R. Using Bayesian networks in analyzing powerful earthquake disaster chains. Nat. Hazards 2013, 68, 509–527. [Google Scholar] [CrossRef]
  23. Han, L.N.; Zhang, J.Q.; Zhang, Y.C.; Ma, Q. Hazard Assessment of Earthquake Disaster Chains Based on a Bayesian Network Model and ArcGIS. ISPRS Int. J. Geo-Inf. 2019, 8, 210. [Google Scholar] [CrossRef]
  24. Weber, P.; Medina-Oliva, G.; Simon, C.; Lung, B. Overview on Bayesian networks applications for dependability, risk analysis and maintenance areas. Eng. Appl. Artif. Intell. 2012, 25, 671–682. [Google Scholar] [CrossRef]
  25. Abbasnejadfard, M.; Bastami, M.; Abbasnejadfard, M.; Borzoo, S. Novel deterministic and probabilistic resilience assessment measures for engineering and infrastructure systems based on the economic impacts. Int. J. Disaster Risk Reduct. 2022, 75, 102956. [Google Scholar] [CrossRef]
  26. Awla, H.Q.; Kareem, S.W.; Mohammed, A.S. A Comparative Evaluation of Bayesian Networks Structure Learning Using Falcon Optimization Algorithm. Int. J. Interact. Multimed. Artif. Intell. 2023, 8, 81–87. [Google Scholar] [CrossRef]
  27. Ghosh, J.K. Bayesian Networks and Influence Diagrams: A Guide to Construction and Analysis by Uffe B. Kjaerulff, Anders L. Madsen. Int. Stat. Rev. 2010, 76, 461–462. [Google Scholar] [CrossRef]
  28. Li, S.Y.; Liang, D.; Wei, Y.F.; Zhang, X. Quantitative modeling of drought-forest fire disaster chain based on the Bayesian network. J. Nat. Disasters 2023, 32, 38–46. [Google Scholar]
  29. Ha, S.; Zhang, J.Q.; Guo, E.L.; Wu, R.N.; Ma, Q.Y.; Wang, Y.F. Study on inference model of the grassland drought and snow disaster chain based on Bayesian networks. J. Nat. Disasters 2016, 25, 20–29. [Google Scholar]
  30. Lauritzen, S.L.; Spiegelhalter, D.J. Local Computations with Probabilities on Graphical Structures and Their Application to Expert Systems. J. R. Stat. Soc. 1988, 50, 157–224. [Google Scholar] [CrossRef]
  31. Floris, M.; Bozzano, F. Evaluation of landslide reactivation: A modified rainfall threshold model based on historical records of rainfall and landslides. Geomorphology 2008, 94, 40–54. [Google Scholar] [CrossRef]
  32. Chen, F.J.; Liu, J.G.; Chen, J.Y. Earthquake Disaster Rescue Model Based on Complex Adaptive System Theory. Complexity 2021, 2021, 6655574. [Google Scholar] [CrossRef]
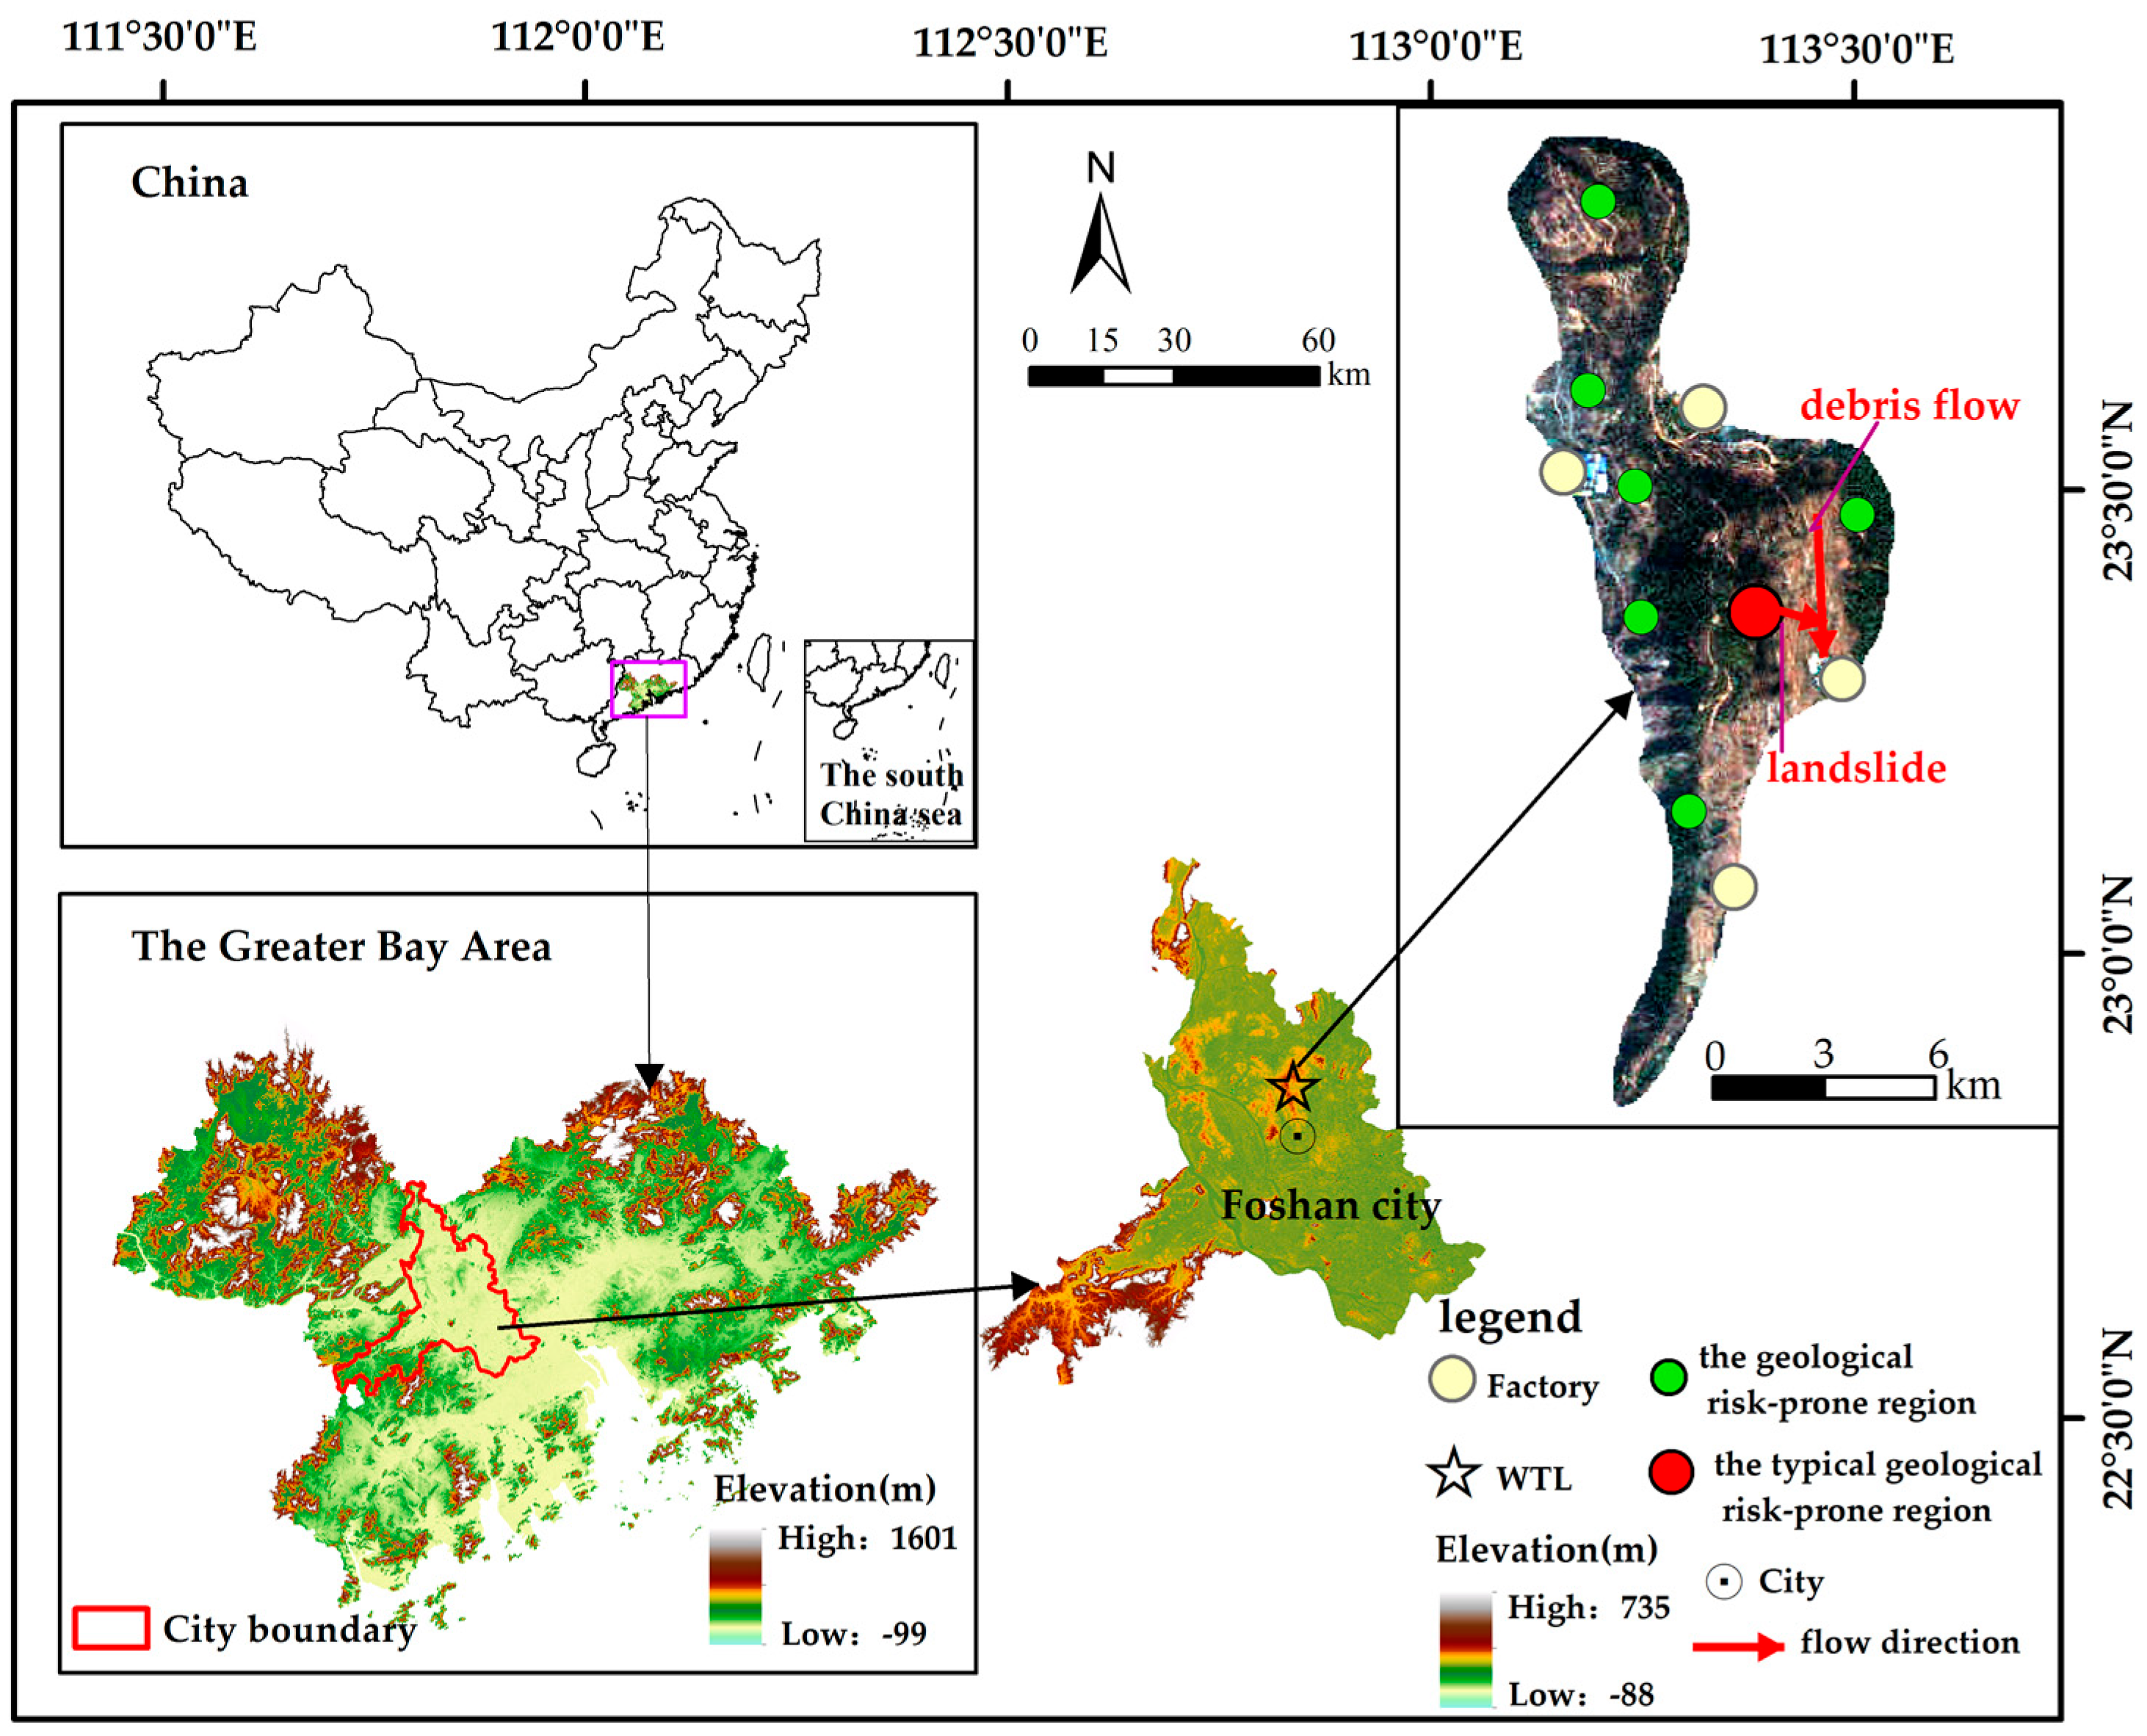
Figure 1. Location of the study area.
Water 15 03124 g001
Figure 2. Example of BN.
Water 15 03124 g002
Figure 3. BN structure of the R-L-D disaster chain.
Water 15 03124 g003
Figure 4. Initial BN model with CPTs.
Water 15 03124 g004
Figure 5. Inference probabilities for different rainfall scenarios.
Water 15 03124 g005
Figure 6. Inference probabilities for different environmental geological conditions.
Water 15 03124 g006
Figure 7. Estimated probabilities of death for different scenarios.
Water 15 03124 g007
Figure 8. Estimated probabilities of direct economic losses for different scenarios.
Water 15 03124 g008
Figure 9. The inhibition framework for the R-L-D disaster chain.
Water 15 03124 g009
Table 1. A collection of disaster data.
TimeSceneRainfall Intensity (mm·d−1)Rainfall
Duration (h)
Landslide
Volume (104 m3)
Debris Flow Volume (104 m3)Death
(Persons)
Direct
Economic Losses (104 RMB)
5 May 2005Zhaoqing City128.5122.30110.3
28 May 2005Jiangmen City2523618.51.85253
9 June 2005Foshan City167.2188.50235.8
… …… …… …… …… …… …… …… …
7 May 2020Foshan City98.5283.50012.5
9 May 2020Guangzhou City224.21510.30178
20 May 2020Guangzhou City382.62625.53.54236
Table 2. States of nodes.
Node TypeNodesStates of Nodes
Hazardous FactorRainfall intensity (mm·d−1)[0~50)/[50~100]/(100,~)
Rainfall duration (h)[0~24]/(24,~)
Lithology weaknessNo/Yes
Geological structureInstability/Stability
Slope (°)[0~30]/(30,~)
Response OperationEmergency rescuePoor response/Effective response
Disaster EvolutionLandslide occurrenceNo/Yes
Landslide volume (104 m3)0/(0~10]/(10,~)
Debris flow occurrenceNo/Yes
Debris flow volume (104 m3)0/(0~2]/(2,~)
Disaster ResultDeath (persons)0/(0~3]/(3,~)
Direct economic losses (104 RMB)0/(0~100]/(100,~)
Table 3. CPT of “Victims” node.
Emergency RescueLandslide Volume (104 m3)Debris Flow Volume (104 m3)Death (Persons)
0(0~3](3,~)
Poor response001.0000.0000.000
(0~2]0.4620.4480.09
(2,~)0.3080.5770.115
(0~10)00.4460.4620.092
(0~2]0.3690.5260.105
(2,~)0.2150.6540.131
[10,~)00.2690.6090.122
(0~2]0.1920.6730.135
(2,~)0.0380.8020.160
Effective response001.0000.0000.000
(0~2]0.6230.3140.063
(2,~)0.5150.4040.081
(0,~10)00.6120.3230.065
(0~2]0.5580.3680.074
(2,~)0.4510.4570.092
[10,~)00.4870.4280.085
(0~2]0.4350.4710.094
(2,~)0.3270.5610.112
Table 4. Posterior probabilities of R-L-D disaster chain BN nodes.
NodesNode StatesPosterior Probability of Nodes
Rainfall intensity (mm·d−1)[0~50)/[50~100]/(100,~)(0, 0, 1)
Rainfall duration (h)[0~24]/(24,~)(0, 1)
Lithology weaknessNo/Yes(0, 1)
Geological structureInstability/Stability(1, 0)
Slope (°)[0~30]/(30,~)(0, 1)
Emergency rescuePoor response/Effective response(1, 0)
Landslide occurrenceNo/Yes(0.070, 0.930)
Landslide volume (104 m3)0/(0~10]/(10,~)(0.070, 0.807, 0.123)
Debris flow occurrenceNo/Yes(0.335, 0.665)
Debris flow volume (104 m3)0/(0~2]/(2,~)(0.335, 0.587, 0.078)
Death (persons)0/(0~3]/(3,~)(0.397, 0.502, 0.101)
Direct economic losses (104 RMB)0/(0~100]/(100,~)(0.085, 0.616, 0.299)
Table 5. Comparison between predicted and measured values for the typical R-L-D disaster chain.
NodesPredicted Values of NodesMeasured Values of NodesContrast
Landslide occurrenceYesYesconsistent
Landslide volume (104 m3)(0~10]8.3consistent
Debris flow occurrenceYesYesconsistent
Debris flow volume (104 m3)(0~2]1.5consistent
Death (persons)(0~3]2consistent
Direct economic losses (104 RMB)(0~100]88.3consistent
Disclaimer/Publisher’s Note: The statements, opinions and data contained in all publications are solely those of the individual author(s) and contributor(s) and not of MDPI and/or the editor(s). MDPI and/or the editor(s) disclaim responsibility for any injury to people or property resulting from any ideas, methods, instructions or products referred to in the content.