Joint Optimal Dispatch of Complex Urban Raw Water Supply: A Case Study of Lanxi City, Zhejiang Province, China
Abstract
:1. Introduction
2. Materials and Methods
2.1. General Process of Optimal Dispatching of Urban Raw Water
- (1)
- Problem identification. Identifying the issues with the existing raw water scheduling system is the fundamental work for optimization scheduling. From this perspective, we can analyze multiple factors, including the spatial distribution of the water source and its alignment with water demand, the compatibility of incoming water conditions with reservoir storage capacity, the severity of water shortage in key areas, and the status of water supply assurance. If the aforementioned problems exist, measures such as scheduling multiple water sources and implementing cross-area water replenishment and regulation can be considered.
- (2)
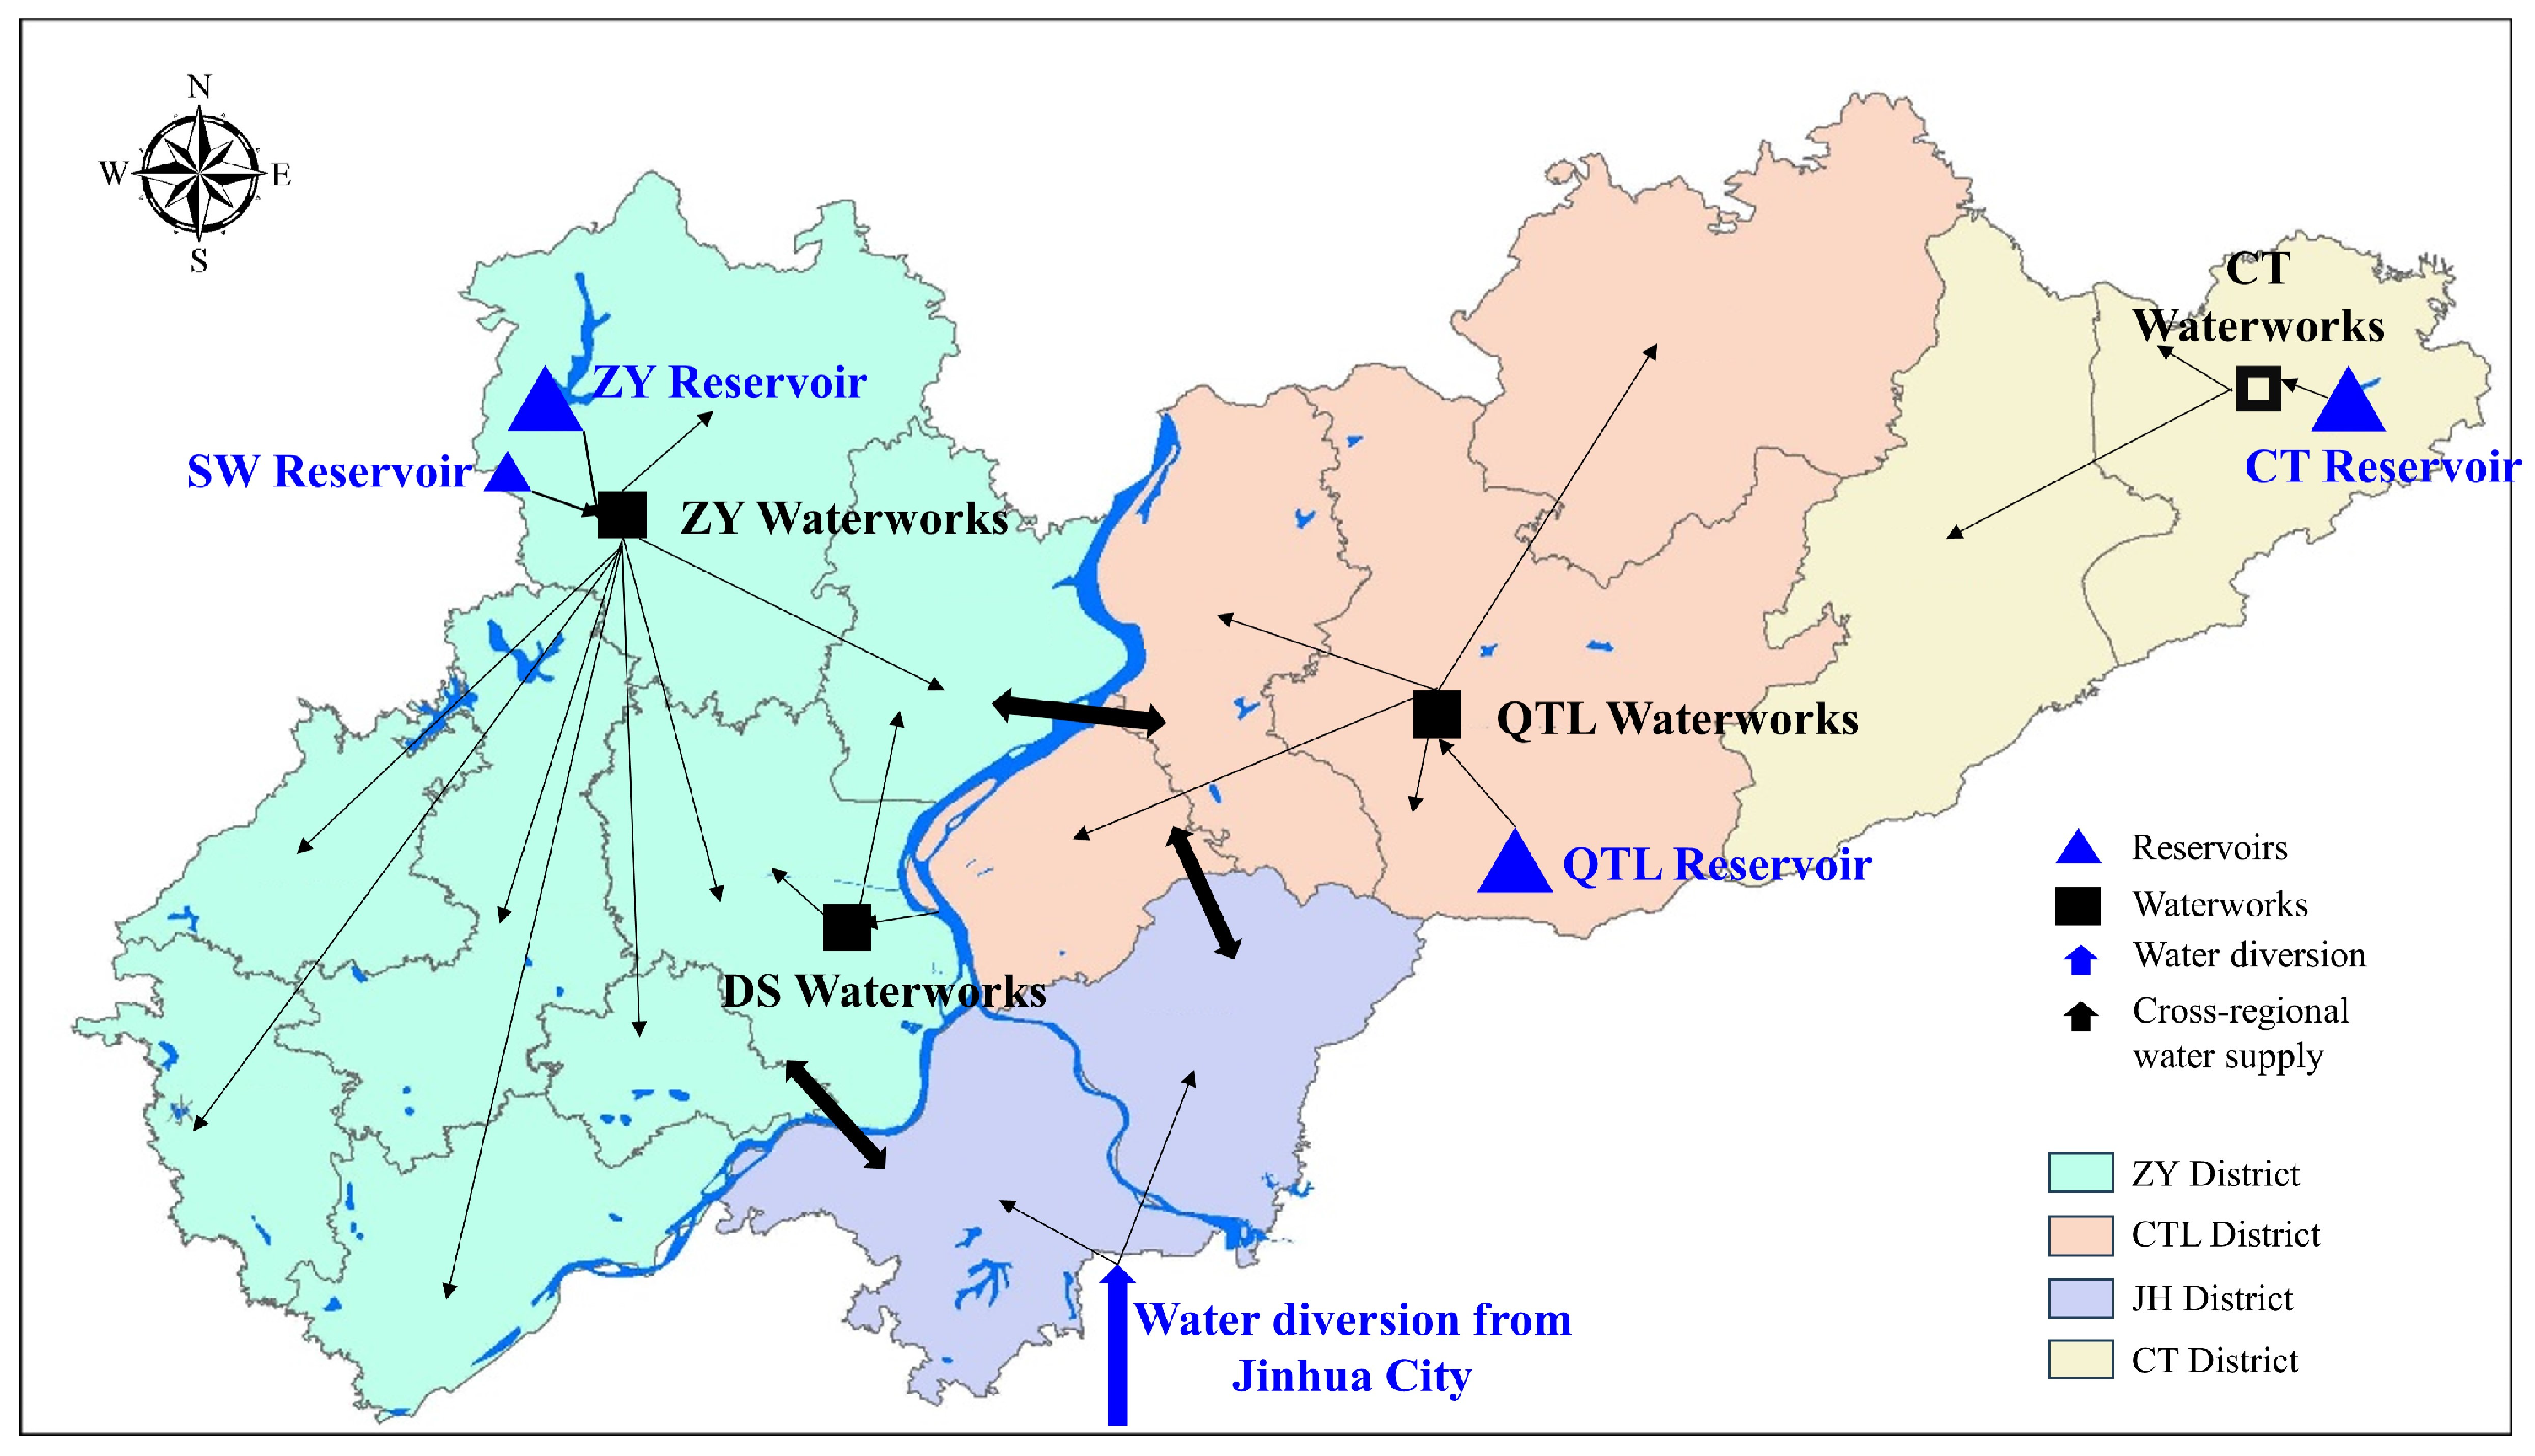
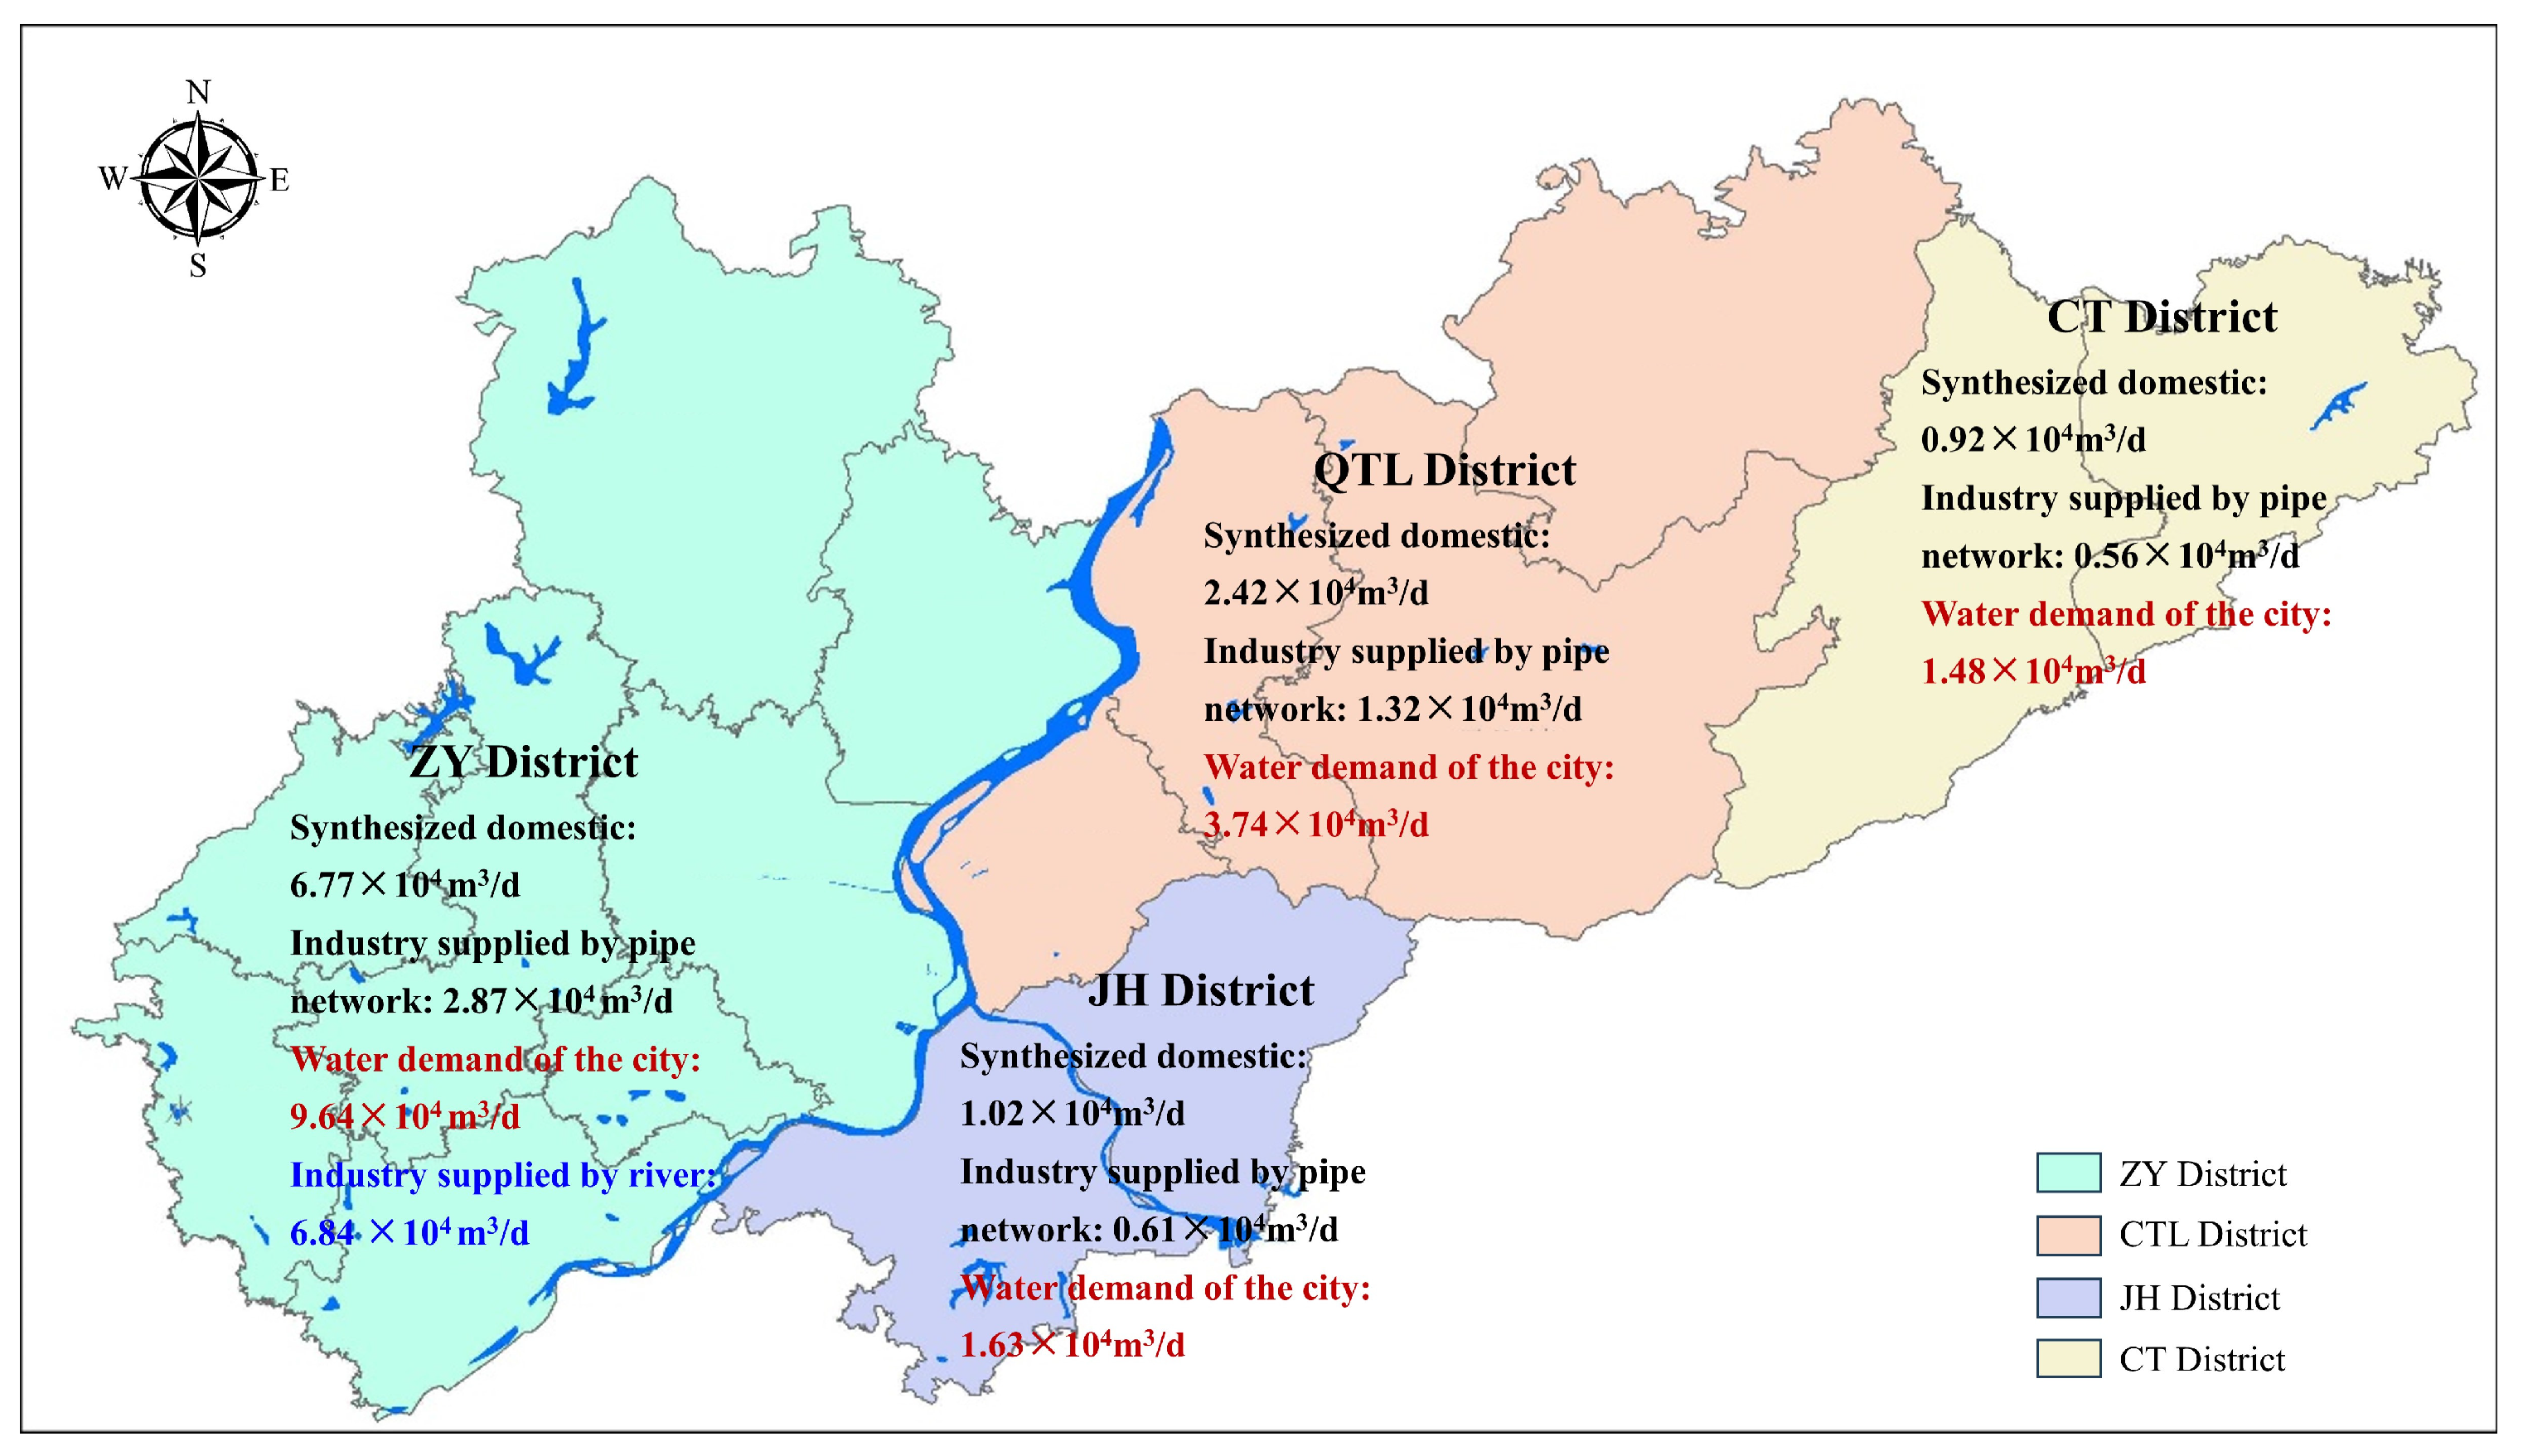
- System generalization. By conducting investigations to understand the spatial distribution and connections between the raw water source, water treatment plants, distribution networks, and users, we can merge smaller water supply zones into several larger zones based on the characteristics of the service scope of the treatment plants and distribution networks and establish a one-to-many connection relationship between the raw water source and the supply zones. This study aims to analyze the feasibility of providing water supply to other districts by integrating the variations in urban topography and the connectivity of the pipeline network to construct a water supply topology network consisting of raw water sources and water supply zones.
- (3)
- Rule formulation. Considering the issues in the current water supply system and the water supply topological network diagram, it is feasible to effectively improve the localized or overall water supply regulations, primarily including the water supply sequence and scheduling diagram, etc. If only a few regions are experiencing water shortage issues, the emphasis should be on optimizing water supply regulations tailored to those regions. If the issue remains unresolved, introducing cross-zone water supply regulations could be considered. When faced with a significant water shortage in the infrastructure, where the capacity of the water sources is inadequate, it becomes imperative to explore additional resources from other territories and establish a comprehensive joint scheduling mechanism. Additionally, it is crucial to systematically optimize the regulations governing multiple water sources.
- (4)
- Model construction and solution formulation. The objective function should comprehensively consider the minimum water shortage of the entire city, the maximum partition guarantee rate, and the minimum reservoir wastewater discharges to balance the supply level, guarantee, and waste of resources. When considering the capacity constraints of water treatment plants and distribution networks, it is necessary to consider them. If cross-regional water supply regulations are implemented, it is necessary to carefully consider the constraints on the water balance. Accurately defining the specific content of decision variables is imperative for solving the problem. When considering the scheduling scheme for a specific year as the central component, the decision variables consist of the monthly water supply for each water source. When considering the scheduling rules as the foundation, it encompasses the sequencing of water supply and the scheduling chart for reservoirs and other water sources. The widely used multi-objective intelligent solution method that can be used includes NSGA-II [21], NSGA-III [22], MOEA/D (Multi-Objective Particle Swarm Optimization) [23], LMPSO (large-scale many-objective particle swarm optimizer) [24], etc. When choosing a method, it is necessary to consider the number of objective functions and decision variables while striking a balance between efficiency and accuracy.
2.2. Study Area and Data
2.2.1. Study Area
2.2.2. Data
- (1)
- Socio-economic data. Based on statistical yearbooks and bulletins (http://www.lanxi.gov.cn/col/col1229637865/, accessed on 5 July 2023), we have collected significant data points, including permanent population, urbanization rate, GDP, and proportions of industrial structures across different towns and streets. We have also collected data from the seventh national population census of Lanxi City.
- (2)
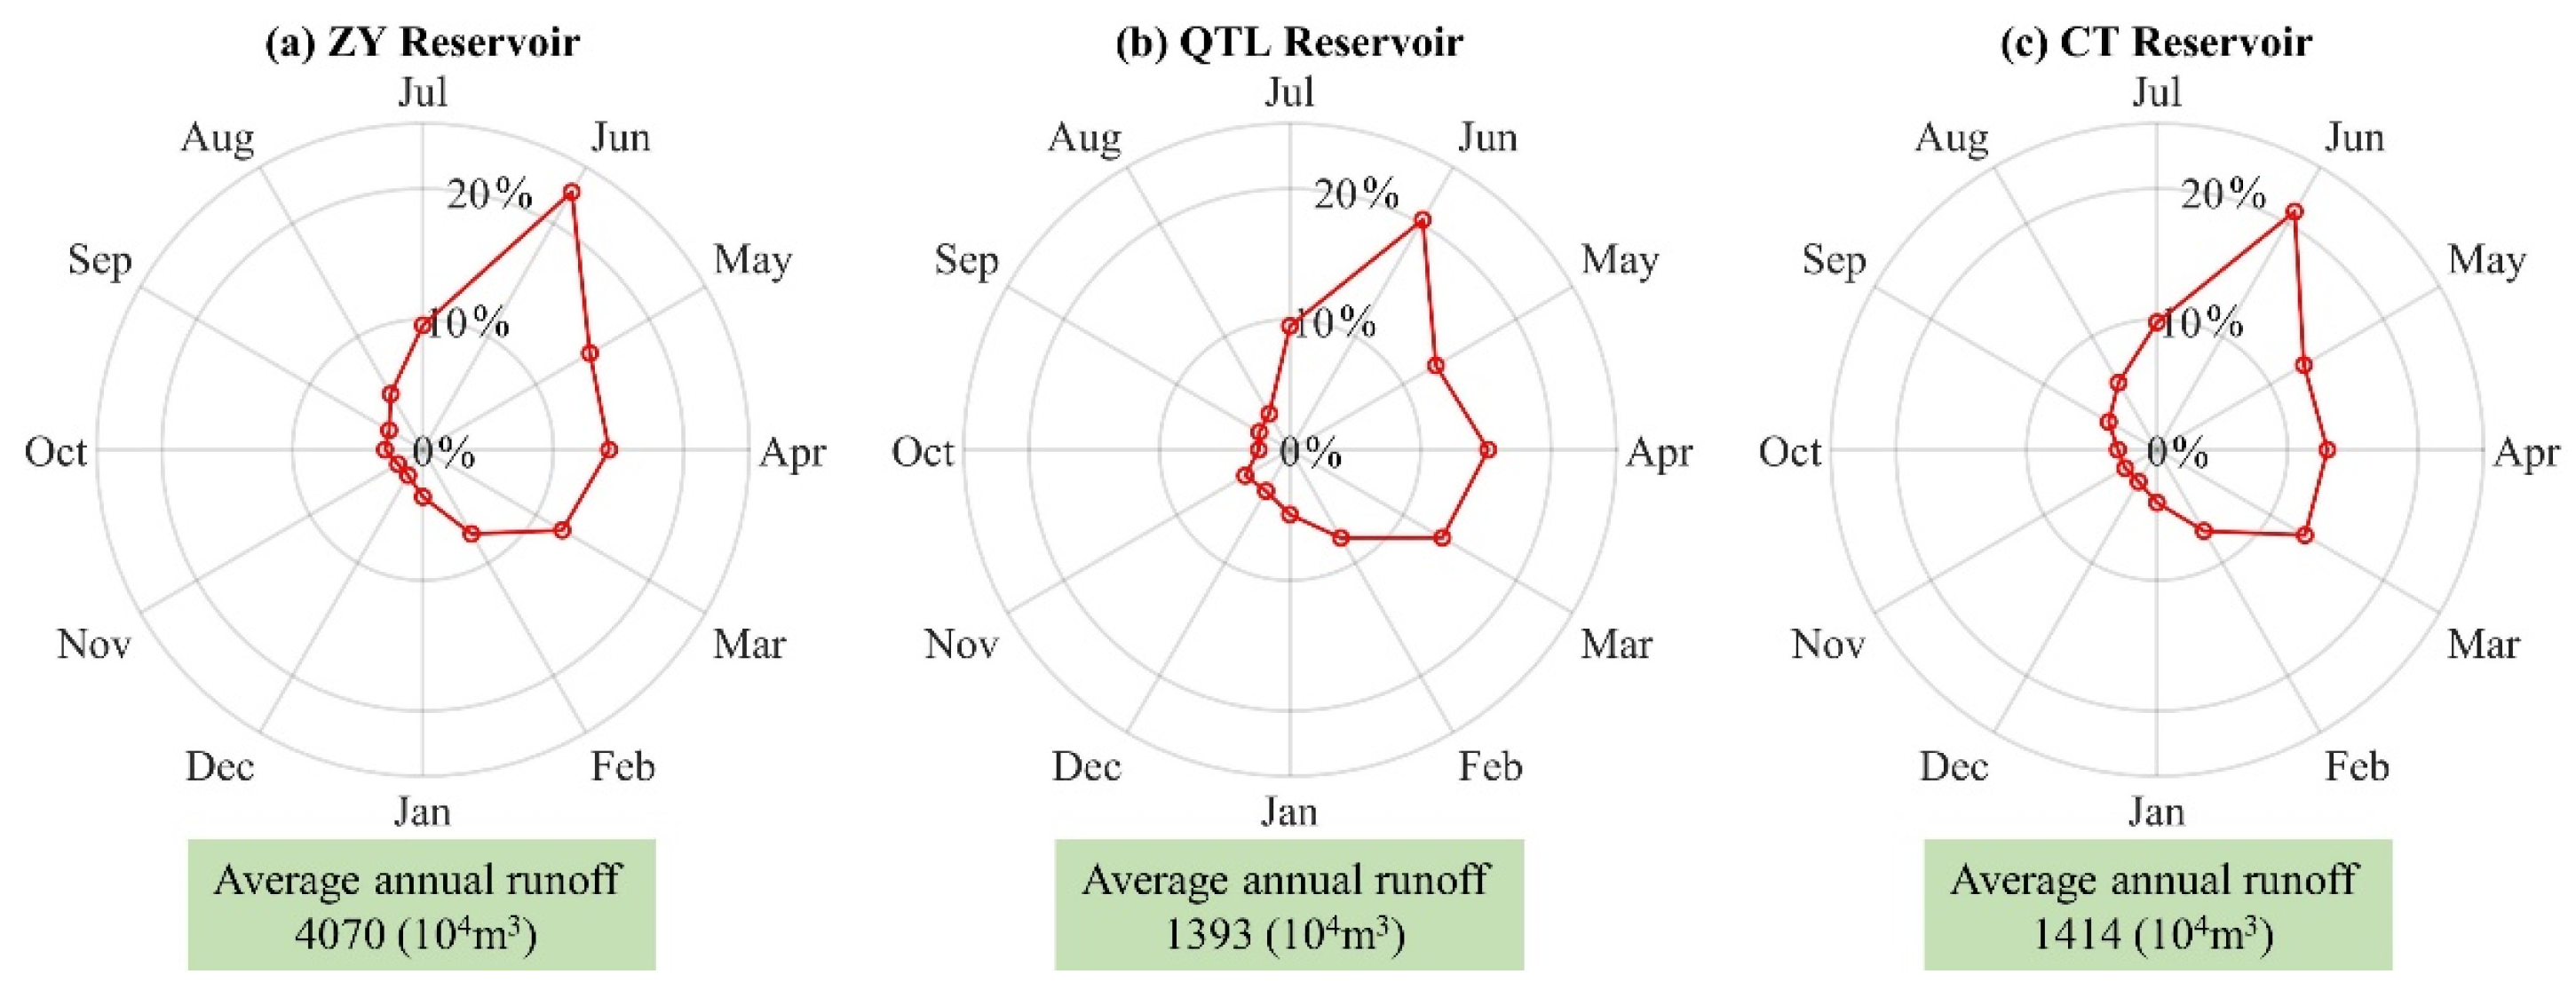
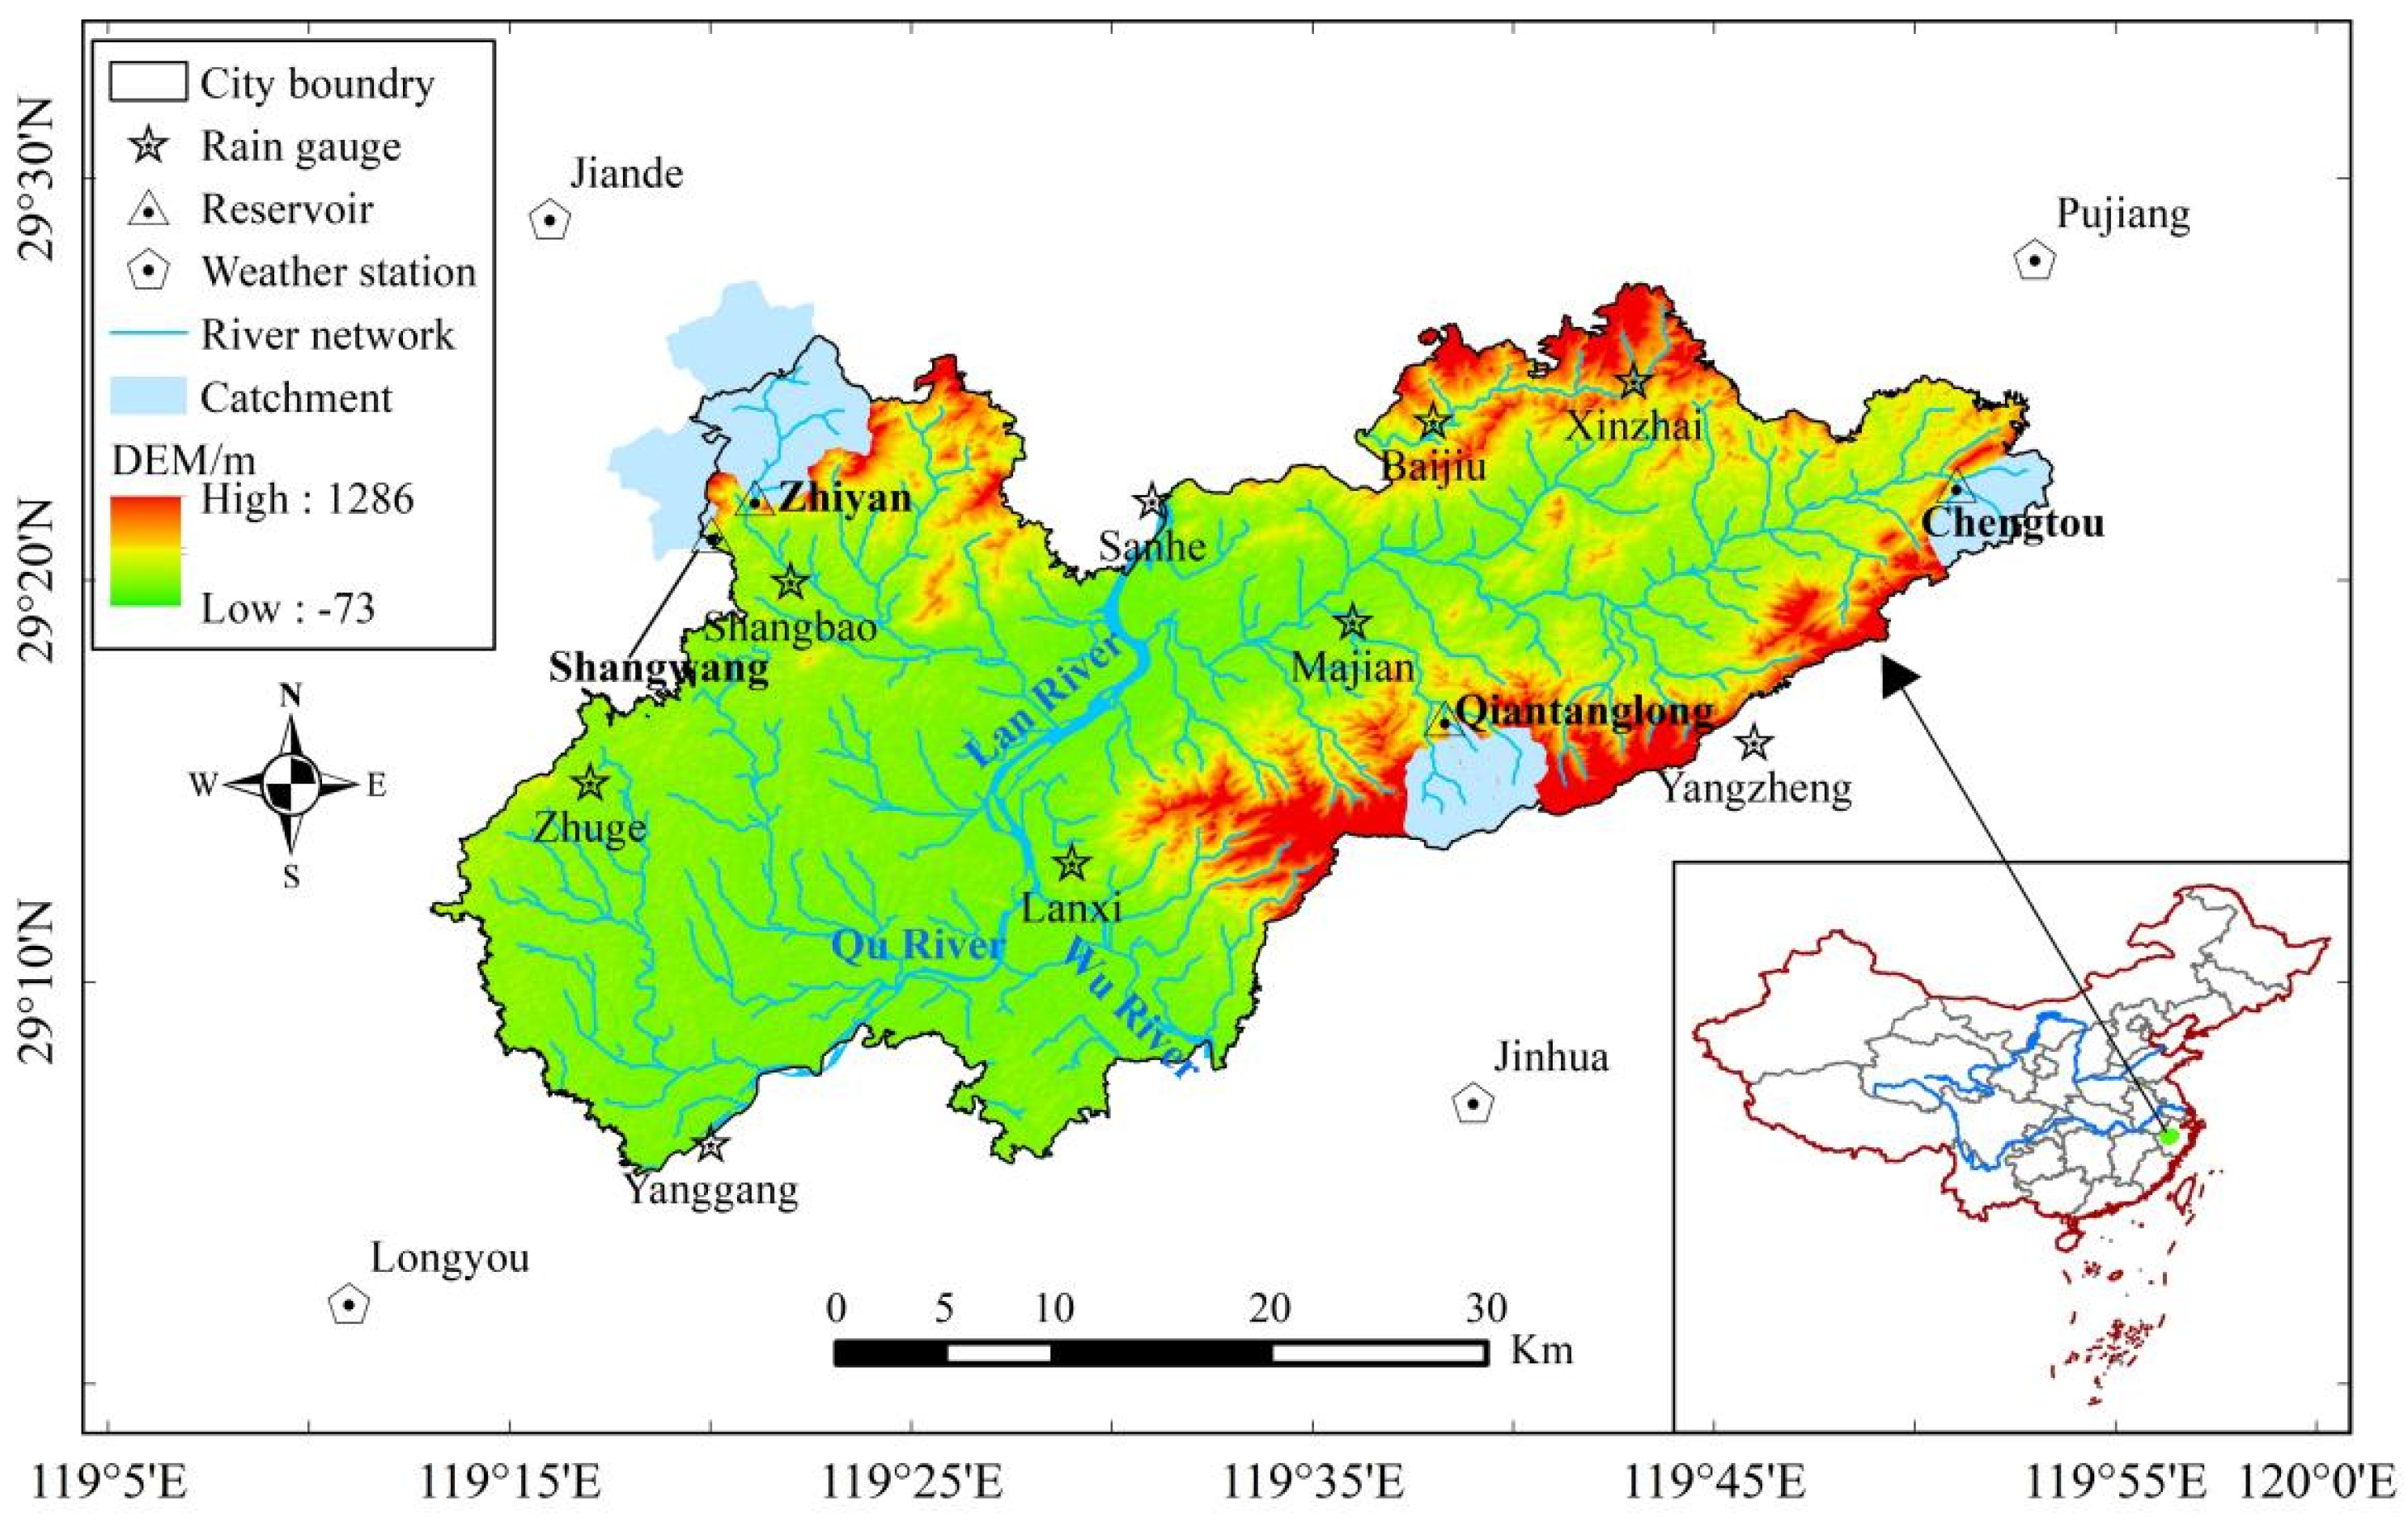
- Meteorological and hydrological data. Precipitation, evaporation, and runoff data were collected from meteorological stations, rainfall stations, and hydrological stations in and around Lanxi City. The data were obtained from hydrological almanacs and the China Meteorological Data Network (http://data.cma.cn/) (Figure 1). The reservoir management department obtained the incoming runoff data of the ZY, QTL, and CT reservoirs. The data’s basic information is shown in Table 1. The remaining three reservoirs have strong regulating capacity except for the SW reservoir. The dispatch cycle starts at the beginning of the flood season and ends at the end of the dry season. Given that the flood season in Lanxi City is from 15 April to 15 October, this study restructures the runoff sequence by organizing the monthly runoff data spanning from 1960 to 2020 (a total of 61 years), covering the period from April to March of the following year. Figure 2 presents the three reservoirs’ average annual runoff volumes and intra-annual distribution processes. The charts show that the inflow distribution patterns of different reservoirs exhibit a similar pattern, which can be described as a temporal sequence of increasing, decreasing, and then increasing again. Specifically, the highest consecutive four months are concentrated between March and June, with the cumulative inflow accounting for 56.9% to 64.1% and the peak occurring in June. There are variations in the distribution of the lowest four consecutive months among different reservoirs, primarily between August and January of the following year. The cumulative inflow percentage ranges from 10.3% to 16.6%.
- (3)
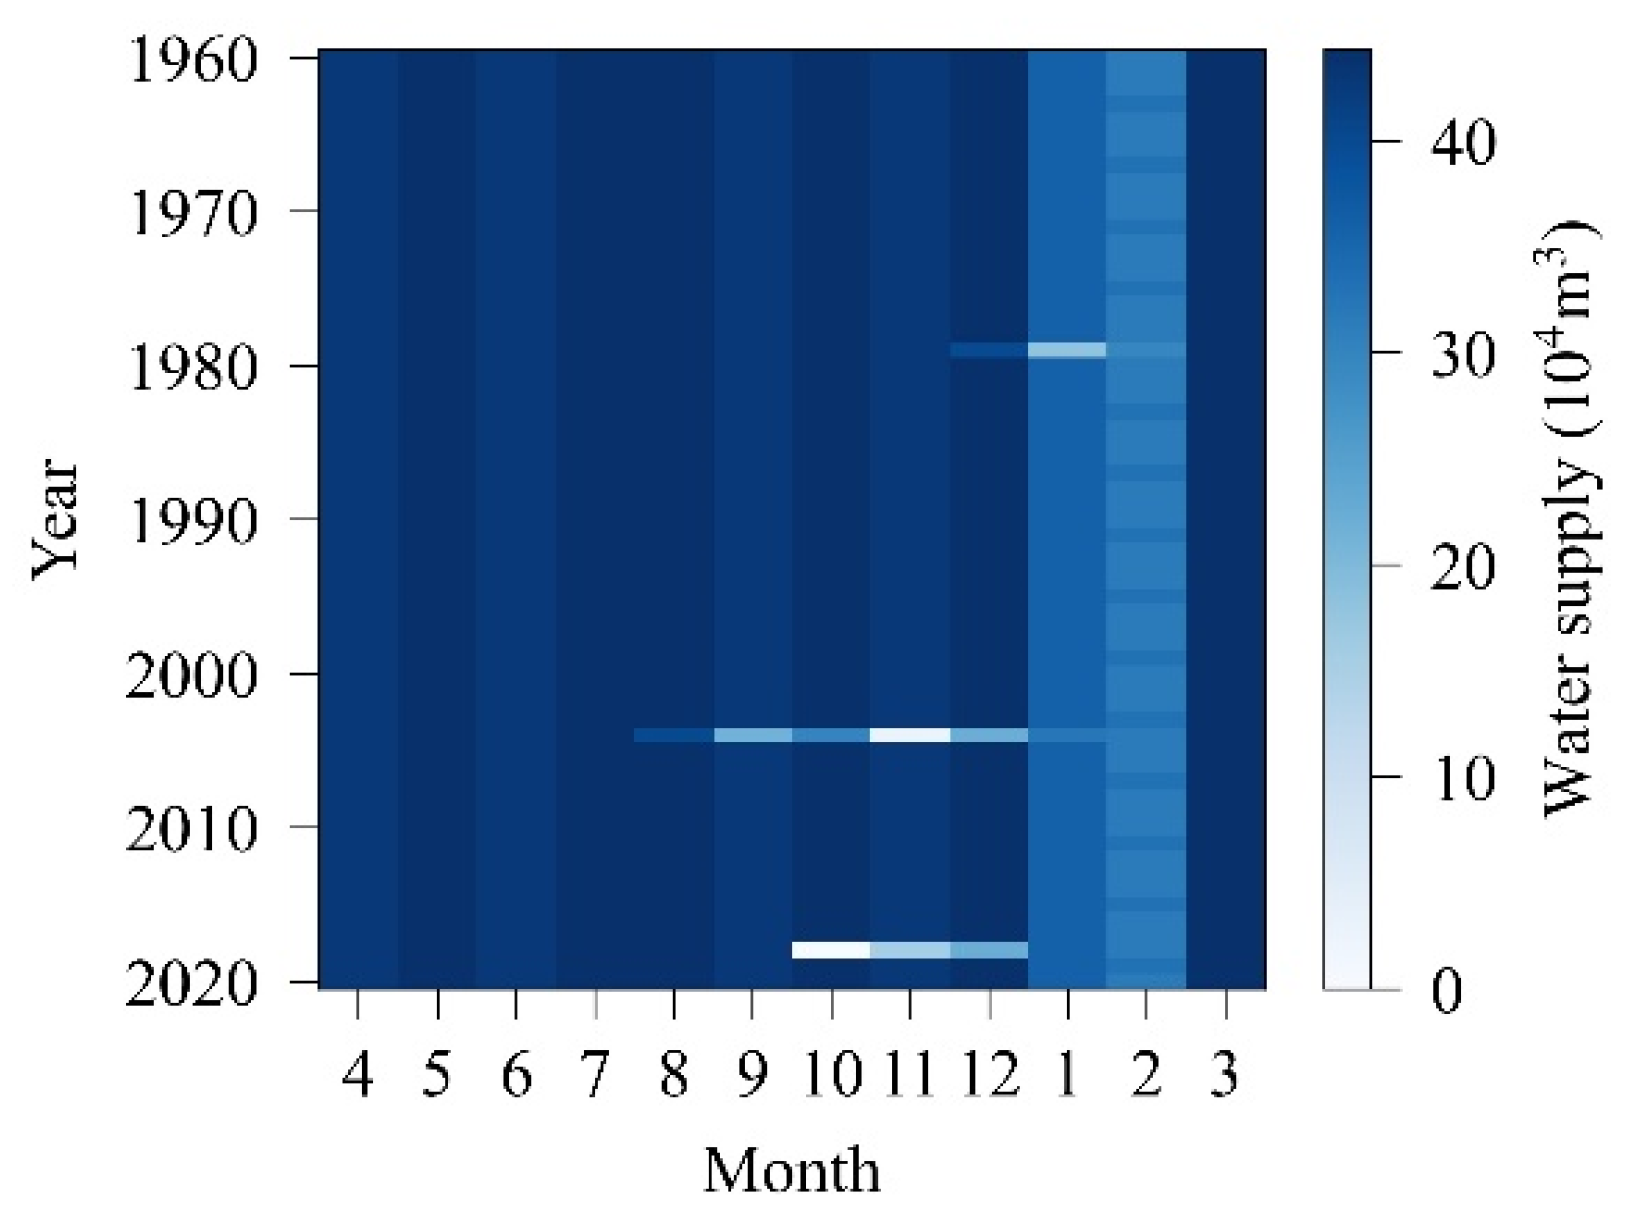
- Water supply project. We collected the characteristic parameters and the water level–area–capacity curves of the ZY, SW, QTL, and CT reservoirs. We obtained the water supply capacity data for ZY, QTL, and CT waterworks, as well as the JH district.
| Variable | Gauge Name | Type | Length of Series | Temporal Scale |
|---|---|---|---|---|
| Precipitation | Shangbao; Zhuge; Yanggang; Lanxi; Majian; Baijiu; Xinzhai; Yangzheng; Sanhe | Rain gauge | 1960–2021 | Month |
| Jiandel; Longyou; Jinhua; Pujiang | Weather station | 1960–2021 | Month | |
| Evaporation | Lanxi | Weather station | 1960–2021 | Month |
| Runoff | Zhiyan (ZY); Shangwang (SW); Qiantanglong (QTL); Chengtou (CT) | Reservoir | 1960–2021 | Month |
2.3. Model Construction and Solution Method of Lanxi City
2.3.1. Generalization of Water Supply System
2.3.2. Joint Dispatching Rules of Water Supply System
- (1)
- Sequence of water supply for different users
- (2)
- Multi-source water supply regulations and cross-district water supply regulations
- Stage I: From March to July
- Stage II: From August to October
- Stage III: From November to February of the following year
- (3)
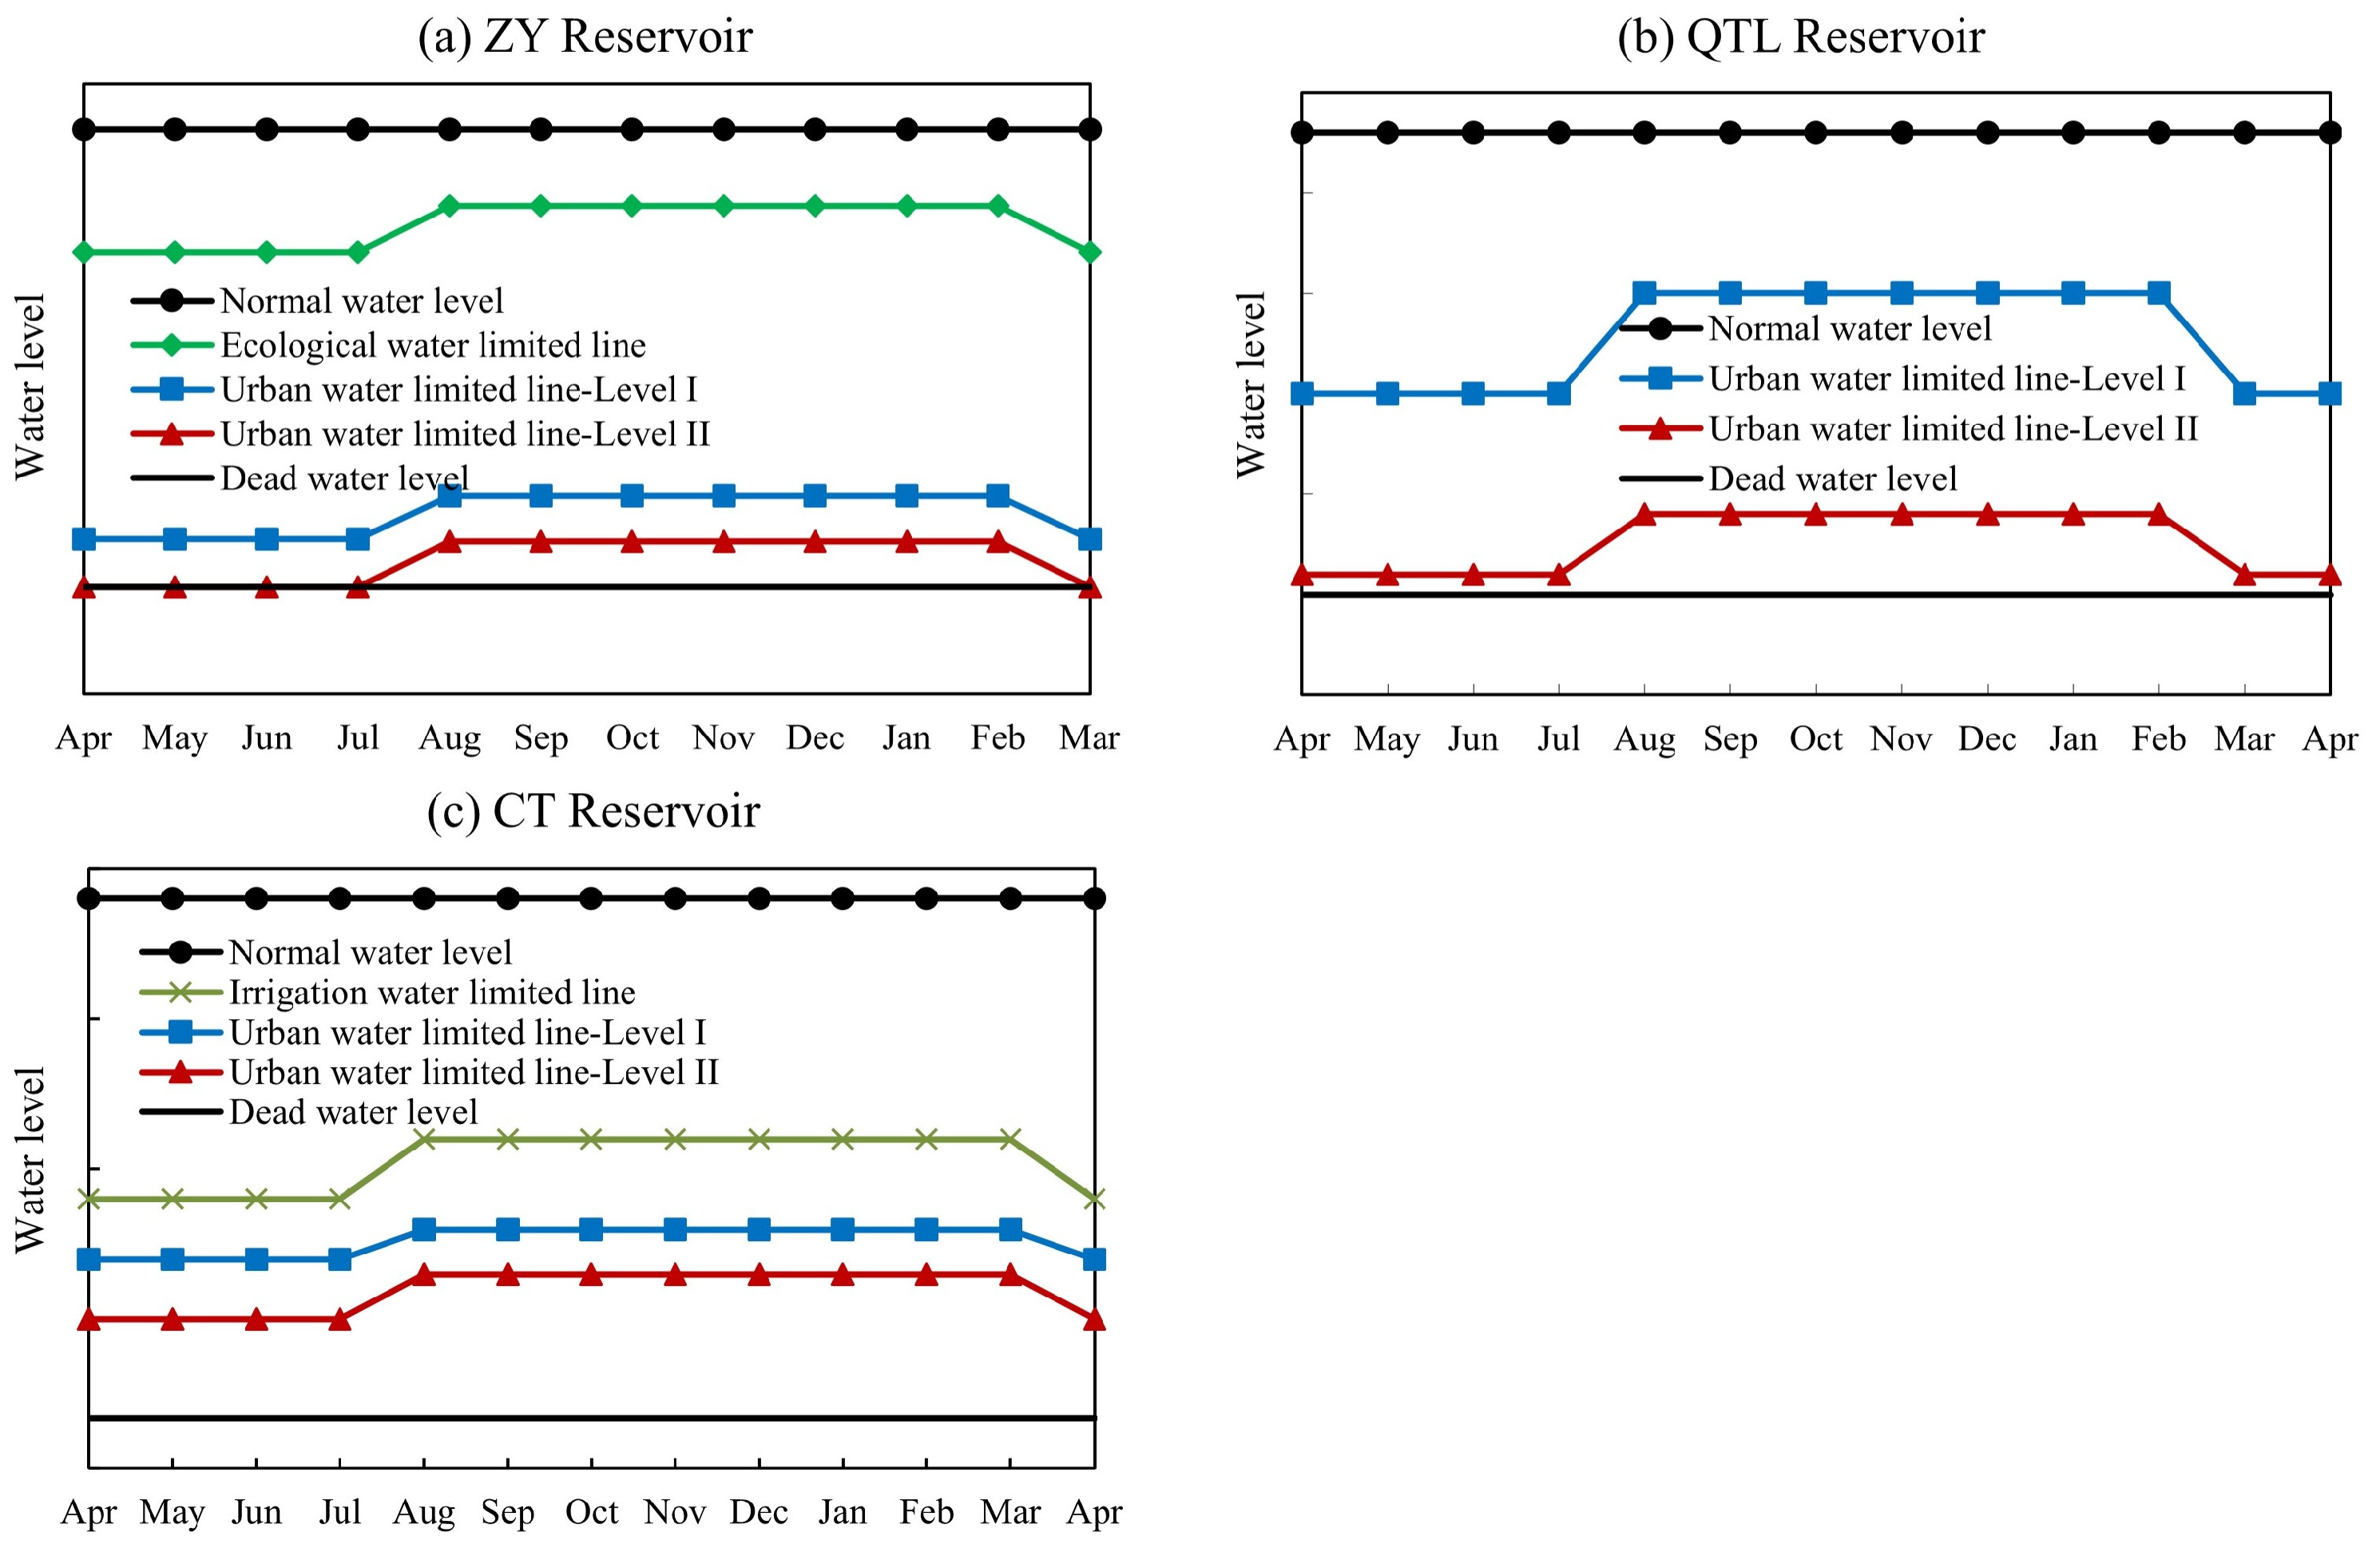
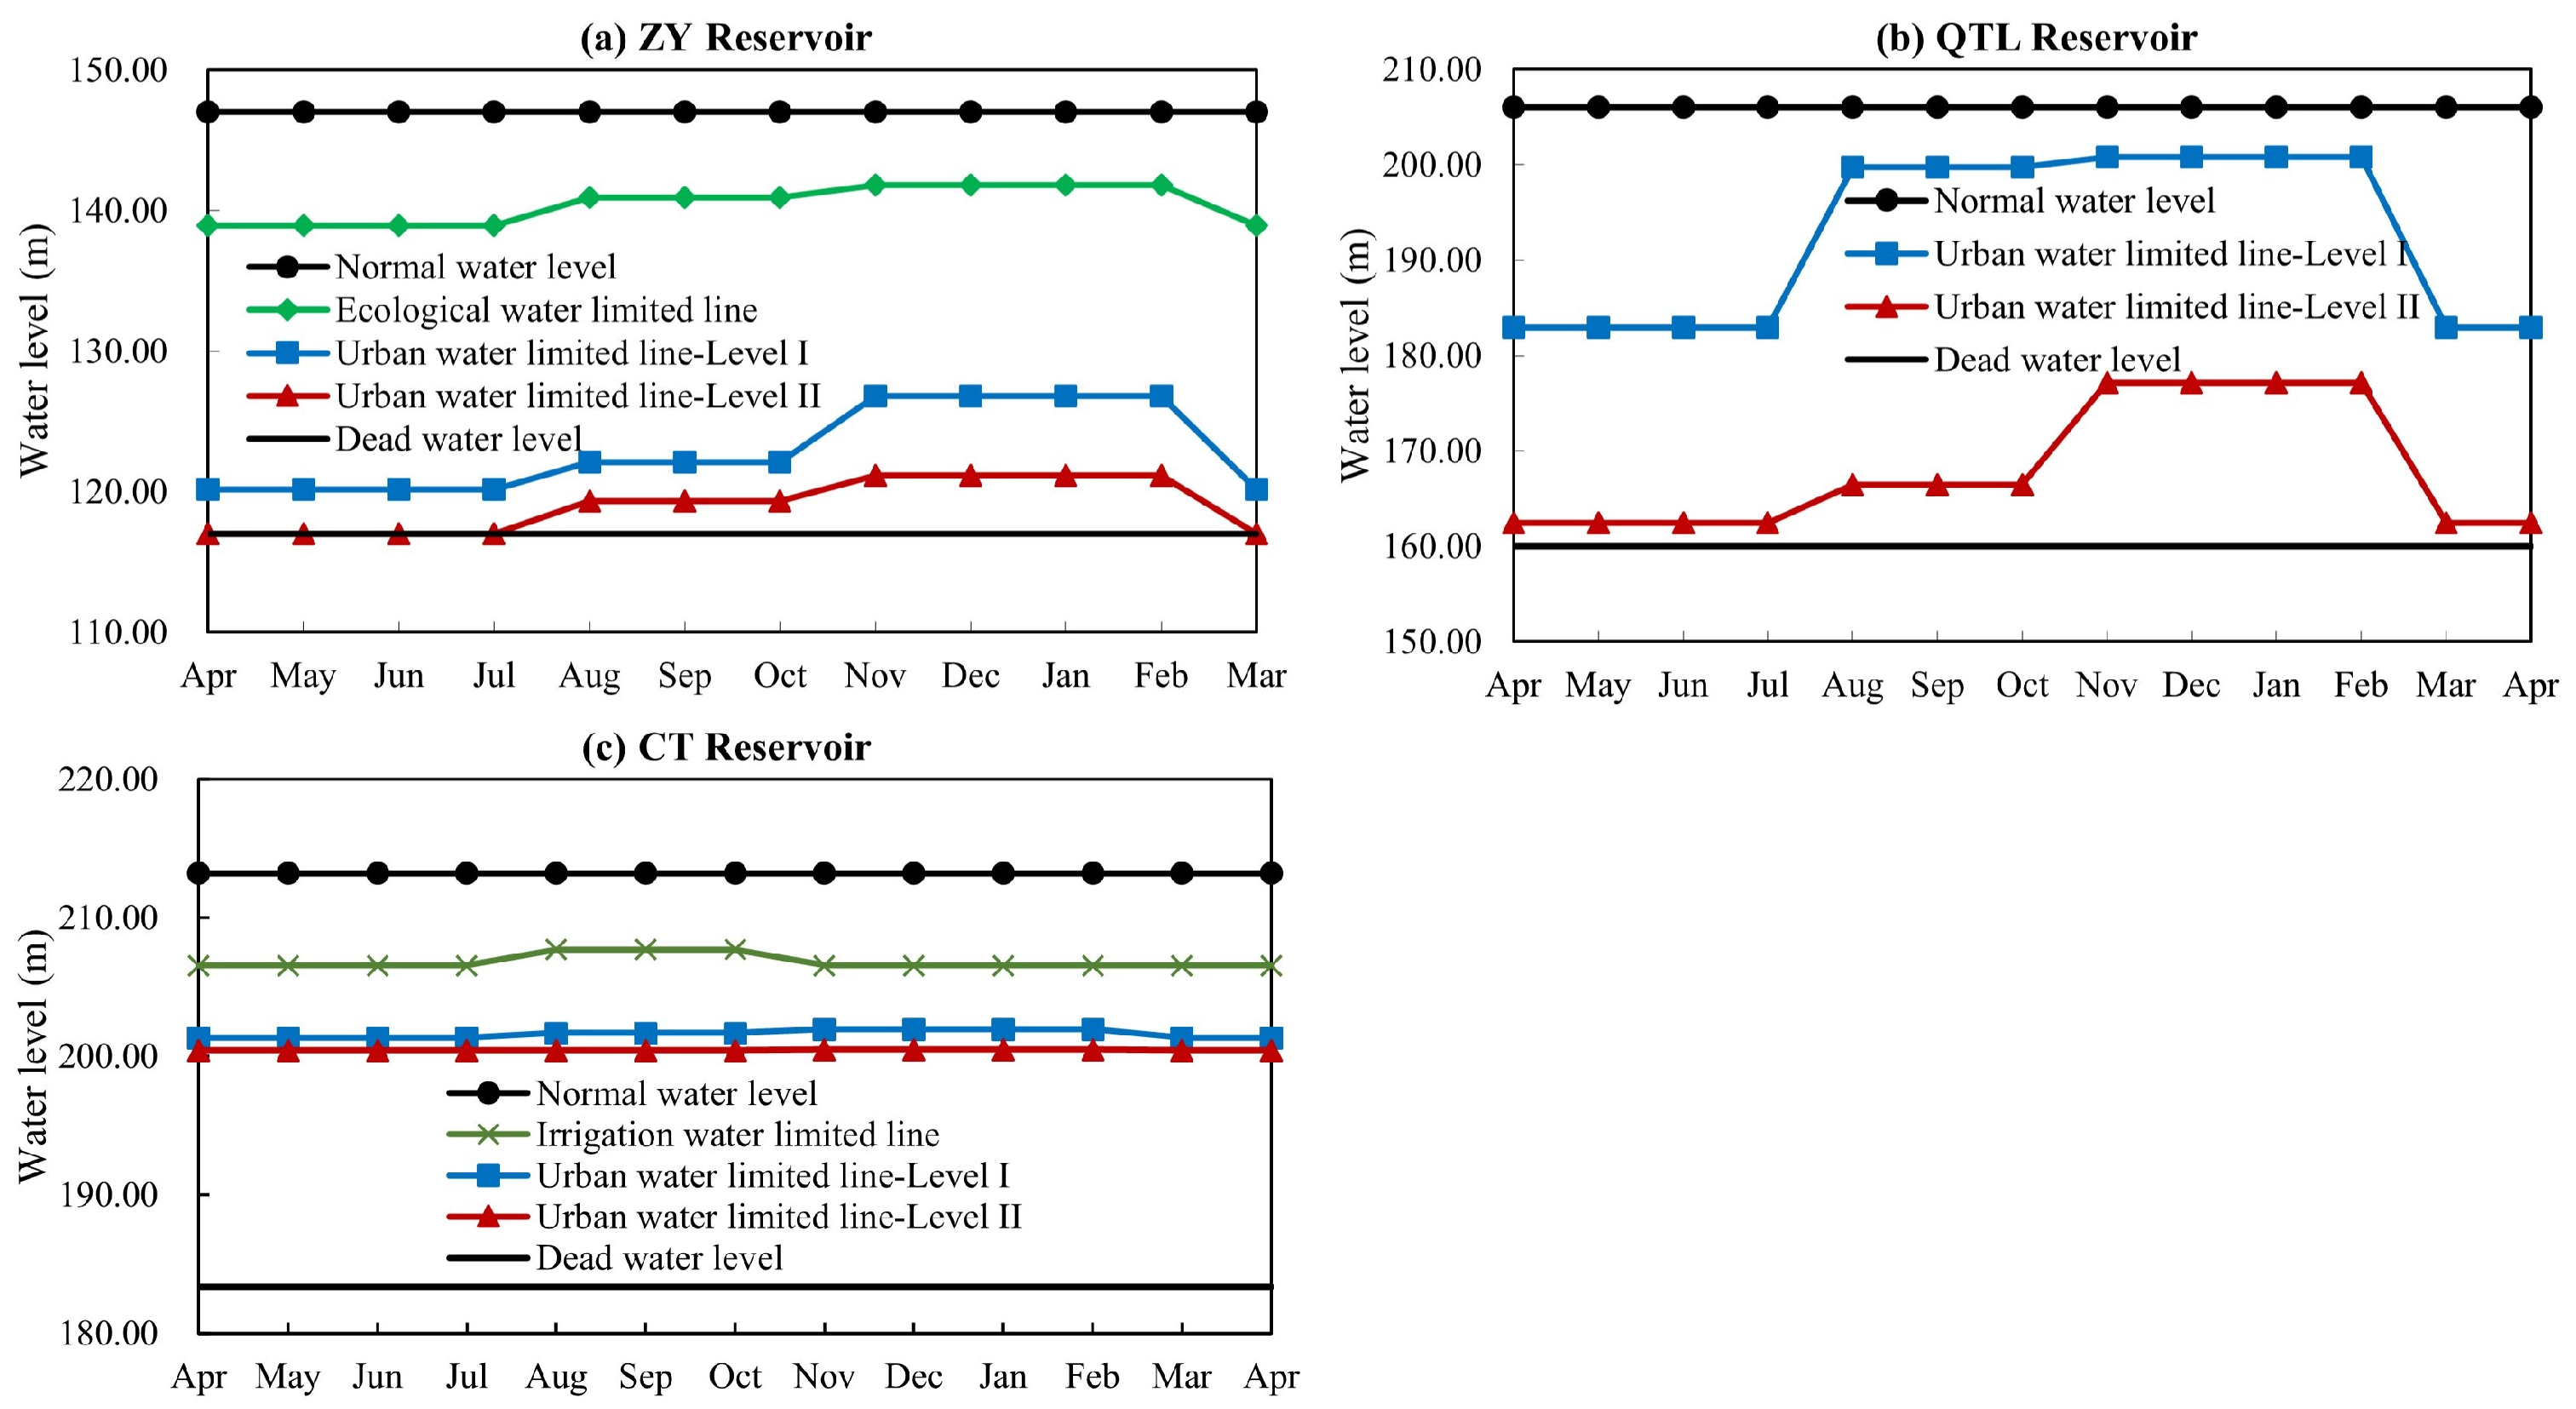
- Establishing the reservoir scheduling diagram. The reservoir scheduling diagram is an important basis for water supply in various regions. Currently, ZY, QTL, and CT reservoirs have their scheduling diagrams, but joint scheduling with the neighboring SW reservoir has yet to be considered. Furthermore, considering the substantial shifts in water demand across economic and social sectors, it becomes imperative to redesign a reservoir operation schedule that caters to coordinated scheduling needs. Based on the priority order of water supply tasks and water use objects [25,26], we can determine the relative order of the lines in the dispatch graph as follows: the upper limit of operating water level (including normal water storage level and flood control water level), agricultural restricted or ecological restricted water supply line, urban restricted water supply line, and dead water level. Furthermore, we suggest implementing a two-tier urban restricted water supply system to enhance the effectiveness of urban water supply scheduling. The first level corresponds to a relatively mild drought situation, whereas the second level corresponds to a more severe drought situation, with varying reduction ratios for water supply. The water supply for the ZY, QTL, and CT reservoirs will be regulated based on the following scheduling guidelines (Figure 4).
2.3.3. Objective Function and Constraints
- (1)
- Objective function
- (2)
- Decision variables
- (3)
- Constraints
2.3.4. Multi-objective Optimization Solution
- (1)
- Simulation of scheduling hours
- (2)
- Runoff into reservoirs and water demand data
3. Results
3.1. Optimal Reservoir Scheduling Diagram and Its Rationality
3.2. Simulation Results for Water Supply Districts
- (1)
- ZY District
- (2)
- QTL District
- (3)
- JH District
- (4)
- CT district
3.3. Comparison of Water Supply Benefits with Relevant Dispatching Schemes
4. Conclusions
- (1)
- This paper introduces a general approach and methodology for optimizing and scheduling urban raw water supply systems. The process consists of four steps: problem identification, system generalization, rule formulation, and model construction and solution. The problem identification and rule formulation differ from existing research. The former serves as the basis for the scientific formulation of rules for multiple water sources and cross-zoning water supply. Therefore, it cannot be overlooked in research.
- (2)
- We applied a general analytical process to study the coordinated scheduling of raw water in the urban water supply system in Lanxi City, Zhejiang Province. We formulated joint scheduling and cross-regional water supply rules for major water reservoirs’ water discharge and urban water shortage problems and established a mathematical model for multi-source joint optimization scheduling to optimize the reservoir scheduling chart for water demand by 2025.
- (3)
- Based on extensive long-term scheduling simulations, we determined that the total cumulative water shortage in the city is 70.78 million m3, and the annual maximum water shortage is 12.73 million m3. At the district scale, the annual maximum water shortage in the ZY district is higher than in other districts. The urban water supply guarantee rate of the QTL and CT districts exceed 95%, while those of the ZY and JH districts are 90.6% and 94.5%, respectively.
- (4)
- Compared with the current independent scheduling scheme and the multi-water source joint dispatching scheme based on the current dispatch diagram, the joint optimization of multiple water sources and reservoir scheduling graph reduced the cumulative water shortage in the city by 68.04 million m3 and 29.72 million m3, respectively, during the simulation period. The guarantee rate in the ZY district increased by 11.2%, while the guarantee rates in the QTL and CT districts reached over 98%.
Author Contributions
Funding
Data Availability Statement
Conflicts of Interest
References
- Wang, Y.; Qin, D. Influence of Climate Change and Human Activity on Water Resources in Arid Region of Northwest China: An Overview. Adv. Clim. Change Res. 2017, 8, 268–278. [Google Scholar] [CrossRef]
- Ramos, H.; McNabola, A.; López-Jiménez, P.; Pérez-Sánchez, M. Smart Water Management towards Future Water Sustainable Networks. Water 2019, 12, 58. [Google Scholar] [CrossRef]
- Duan, K.; Caldwell, P.V.; Sun, G.; McNulty, S.G.; Qin, Y.; Chen, X.; Liu, N. Climate Change Challenges Efficiency of Inter-Basin Water Transfers in Alleviating Water Stress. Environ. Res. Lett. 2022, 17, 044050. [Google Scholar] [CrossRef]
- Wei, C.; Wang, X.; Jiang, F.; Wang, Z.; Li, C.; Liu, Q.; Yu, J. A New Method for Estimating Multi-Source Water Supply Considering Joint Probability Distributions under Uncertainty. Front. Earth Sci. 2023, 10, 929613. [Google Scholar] [CrossRef]
- Zhu, C.F.; Li, H.W.; Dong, S.; Liu, J. The Raw Water System Combinatorial Optimization Research Based on Arsenic Control. Adv. Mater. Res. 2012, 610–613, 2472–2477. [Google Scholar] [CrossRef]
- Wang, Y.; Wang, Y.; Su, X.; Qi, L.; Liu, M. Evaluation of the Comprehensive Carrying Capacity of Interprovincial Water Resources in China and the Spatial Effect. J. Hydrol. 2019, 575, 794–809. [Google Scholar] [CrossRef]
- Zhang, L.; Li, S.; Loáiciga, H.A.; Zhuang, Y.; Du, Y. Opportunities and Challenges of Interbasin Water Transfers: A Literature Review with Bibliometric Analysis. Scientometrics 2015, 105, 279–294. [Google Scholar] [CrossRef]
- Rollason, E.; Sinha, P.; Bracken, L.J. Interbasin Water Transfer in a Changing World: A New Conceptual Model. Prog. Phys. Geogr. 2021, 46, 371–397. [Google Scholar] [CrossRef]
- Sun, S.; Zhou, X.; Liu, H.; Jiang, Y.; Zhou, H.; Zhang, C.; Fu, G. Unraveling the Effect of Inter-Basin Water Transfer on Reducing Water Scarcity and Its Inequality in China. Water Res. 2021, 194, 116931. [Google Scholar] [CrossRef]
- Yi, L.; Jiao, W.; Chen, X.; Chen, W. An Overview of Reclaimed Water Reuse in China. J. Environ. Sci. 2011, 23, 1585–1593. [Google Scholar] [CrossRef]
- Paton, F.L.; Dandy, G.C.; Maier, H.R. Integrated Framework for Assessing Urban Water Supply Security of Systems with Non-Traditional Sources under Climate Change. Environ. Model. Softw. 2014, 60, 302–319. [Google Scholar] [CrossRef]
- Sapkota, M.; Arora, M.; Malano, H.; Moglia, M.; Sharma, A.; George, B.; Pamminger, F. An Integrated Framework for Assessment of Hybrid Water Supply Systems. Water 2015, 8, 4. [Google Scholar] [CrossRef]
- Roozbahani, R.; Schreider, S.; Abbasi, B. Optimal Water Allocation through a Multi-Objective Compromise between Environmental, Social, and Economic Preferences. Environ. Model. Softw. 2015, 64, 18–30. [Google Scholar] [CrossRef]
- Guo, X.; Hu, T.; Zhang, T.; Lv, Y. Bilevel Model for Multi-Reservoir Operating Policy in Inter-Basin Water Transfer-Supply Project. J. Hydrol. 2012, 424–425, 252–263. [Google Scholar] [CrossRef]
- Liu, D.; Liu, W.; Fu, Q.; Zhang, Y.; Li, T.; Imran, K.M.; Abrar, F.M. Two-Stage Multi-Water Sources Allocation Model in Regional Water Resources Management under Uncertainty. Water Resour. Manag. 2017, 31, 3607–3625. [Google Scholar] [CrossRef]
- Yu, B.; Liang, G.; He, B.; Dong, L.; Zhou, H. Modeling of joint operation for urban water-supply system with multi-water sources and its application. Adv. Water Sci. 2015, 26, 874–884. [Google Scholar] [CrossRef]
- Zhang, S.; Yang, J.; Wan, Z.; Yi, Y. Multi-Water Source Joint Scheduling Model Using a Refined Water Supply Network: Case Study of Tianjin. Water 2018, 10, 1580. [Google Scholar] [CrossRef]
- Ji, L.; Sun, P.; Ma, Q.; Jiang, N.; Huang, G.-H.; Xie, Y.-L. Inexact Two-Stage Stochastic Programming for Water Resources Allocation under Considering Demand Uncertainties and Response—A Case Study of Tianjin, China. Water 2017, 9, 414. [Google Scholar] [CrossRef]
- Zhang, S.; Yang, J.; Xu, Z.; Zhang, C. Effect of Frequency of Multi-Source Water Supply on Regional Guarantee Rate of Water Use. Water 2019, 11, 1356. [Google Scholar] [CrossRef]
- Song, P.; Wang, C.; Zhang, W.; Liu, W.; Sun, J.; Wang, X.; Lei, X.; Wang, H. Urban Multi-Source Water Supply in China: Variation Tendency, Modeling Methods and Challenges. Water 2020, 12, 1199. [Google Scholar] [CrossRef]
- Deb, K.; Pratap, A.; Agarwal, S.; Meyarivan, T. A Fast and Elitist Multiobjective Genetic Algorithm: NSGA-II. IEEE Trans. Evol. Comput. 2002, 6, 182–197. [Google Scholar] [CrossRef]
- Jain, H.; Deb, K. An Evolutionary Many-Objective Optimization Algorithm Using Reference-Point Based Nondominated Sorting Approach, Part II: Handling Constraints and Extending to an Adaptive Approach. IEEE Trans. Evol. Comput. 2014, 18, 602–622. [Google Scholar] [CrossRef]
- Zhang, Q.; Li, H. MOEA/D: A Multiobjective Evolutionary Algorithm Based on Decomposition. IEEE Trans. Evol. Comput. 2007, 11, 712–731. [Google Scholar] [CrossRef]
- Cheng, S.; Li, M.; Yao, H.; Fan, H.; Liu, Y. Large-Scale Many-Objective Particle Swarm Optimizer with Fast Convergence Based on Alpha-Stable Mutation and Logistic Function. Appl. Soft Comput. 2021, 99, 106947. [Google Scholar] [CrossRef]
- Zeng, X.; Hu, T.; Guo, X.; Li, X. Water Transfer Triggering Mechanism for Multi-Reservoir Operation in Inter-Basin Water Transfer-Supply Project. Water Resour. Manag. 2014, 28, 1293–1308. [Google Scholar] [CrossRef]
- Ai, Y.; Ma, Z.; Xie, X.; Huang, T.; Cheng, H. Optimization of Ecological Reservoir Operation Rules for a Northern River in China: Balancing Ecological and Socio-Economic Water Use. Ecol. Indic. 2022, 138, 108822. [Google Scholar] [CrossRef]
- Niu, K.; Hu, Q.; Wang, Y.; Yang, H.; Liang, C.; Wang, L.; Li, L.; Li, X.; Du, Y.; Li, C. Analysis on the Variation of Hydro-Meteorological Variables in the Yongding River Mountain Area Driven by Multiple Factors. Remote Sens. 2021, 13, 3199. [Google Scholar] [CrossRef]
- Li, H.; Ma, J.; Yang, Y.; Niu, L.; Lu, X. Performance of Frequency-Corrected Precipitation in Ungauged High Mountain Hydrological Simulation. Water 2023, 15, 1461. [Google Scholar] [CrossRef]
- Tang, X.; He, Y.; Qi, P.; Chang, Z.; Jiang, M.; Dai, Z. A New Multi-Objective Optimization Model of Water Resources Considering Fairness and Water Shortage Risk. Water 2021, 13, 2648. [Google Scholar] [CrossRef]
- Gulishengmu, A.; Yang, G.; Tian, L.; Pan, Y.; Zhou, H.; Xu, X.; Gao, Y.; Li, Y. Analysis of Water Resource Carrying Capacity and Obstacle Factors Based on GRA-TOPSIS Evaluation Method in Manas River Basin. Water 2023, 15, 236. [Google Scholar] [CrossRef]
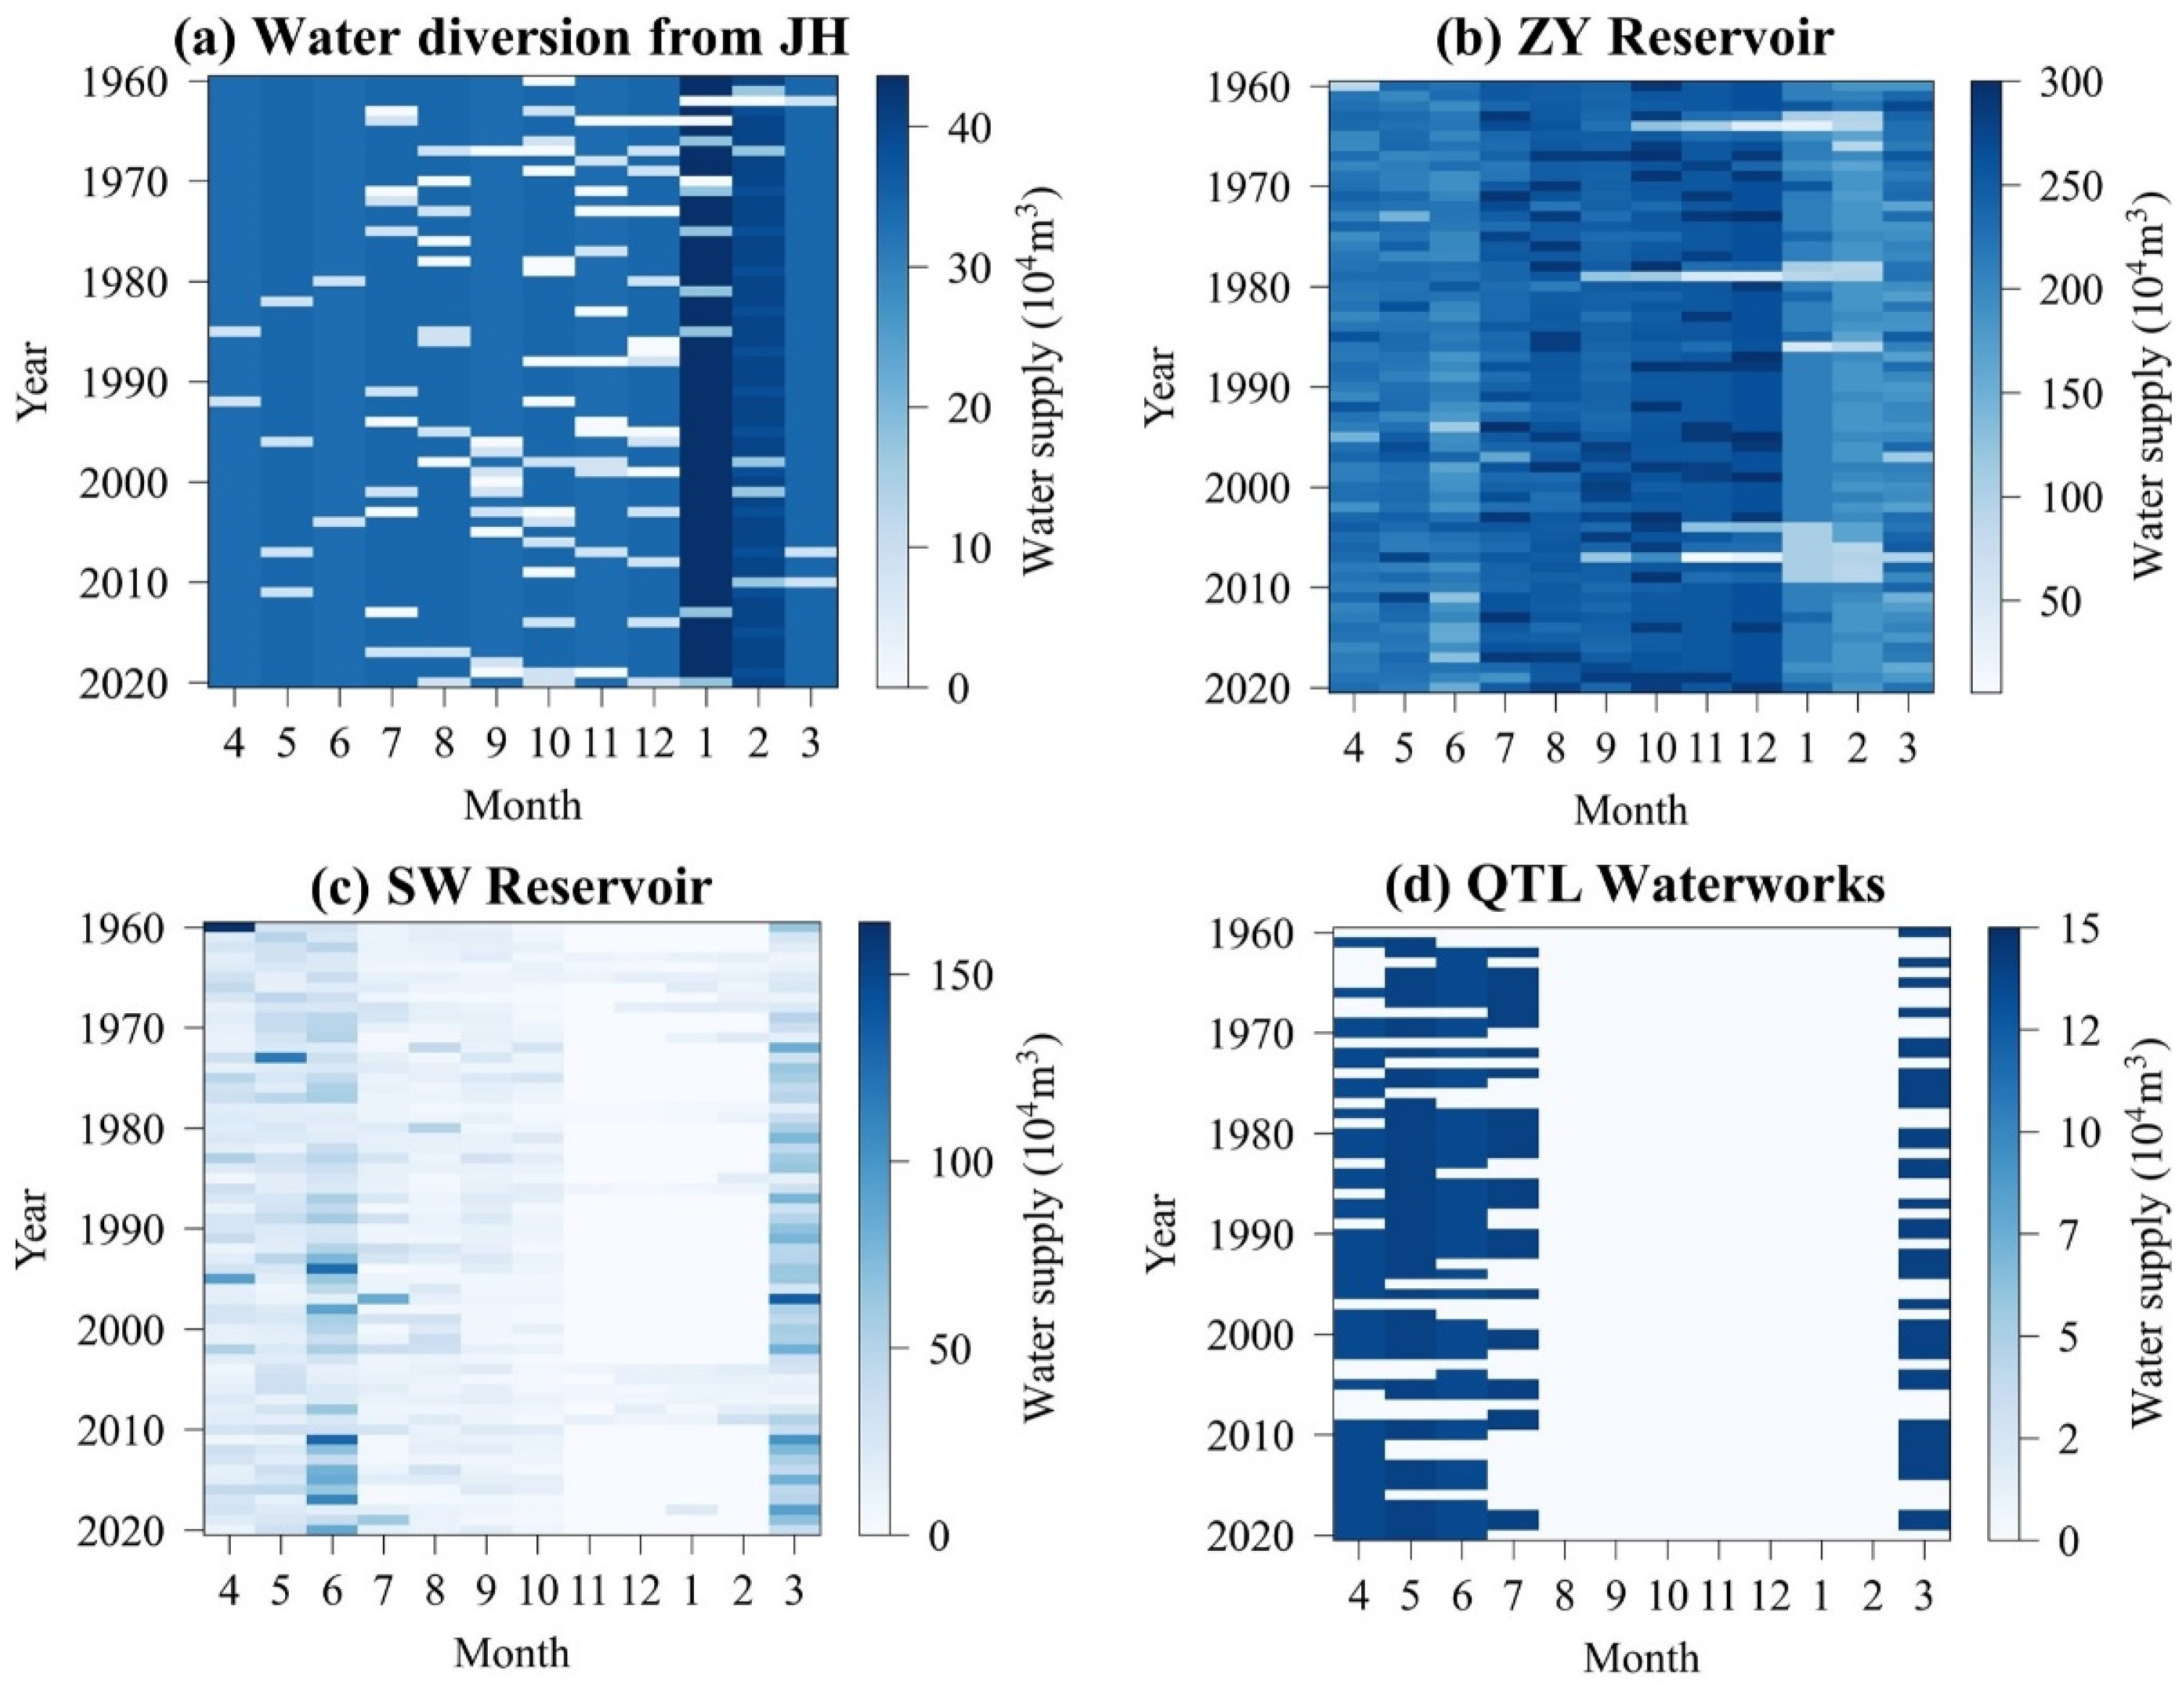
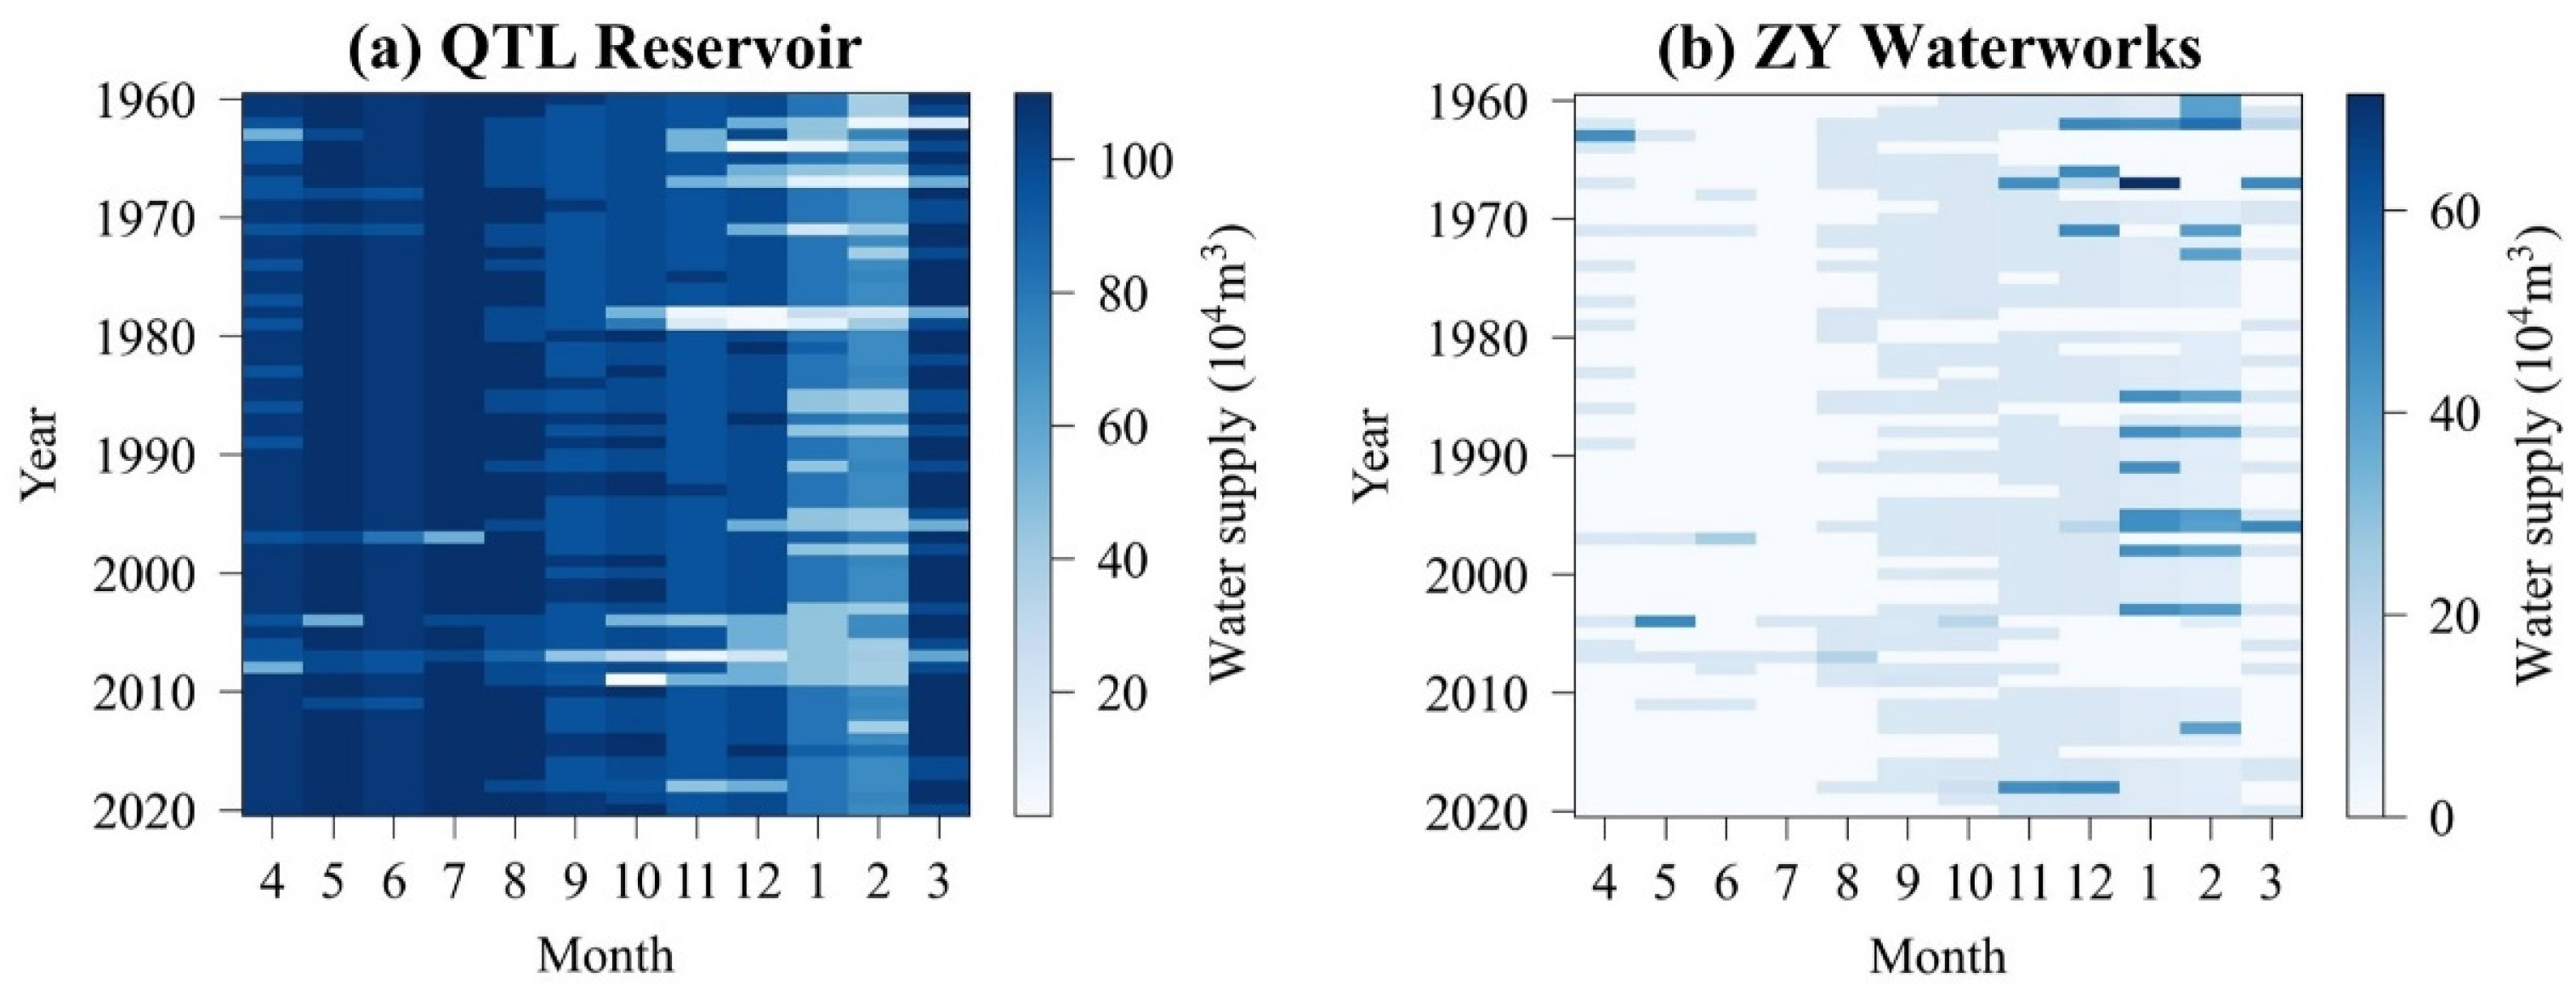

| District | Month | April | May | June | July | August | September | |
|---|---|---|---|---|---|---|---|---|
| Water Supply Project | Water Supply Percentage (%) | |||||||
| ZY | Water diversion from JH | 11.3 | 11 | 11.3 | 9.8 | 9.8 | 10 | / |
| ZY Reservoir | 76.3 | 76.3 | 70.1 | 82.8 | 85.7 | 85.6 | ||
| SW Reservoir | 9.2 | 9.1 | 15.3 | 5.1 | 4.5 | 4.4 | ||
| QTL Waterworks | 3.2 | 3.6 | 3.3 | 2.3 | 0 | 0 | ||
| QTL | QTL Reservoir | 97 | 98.5 | 98.8 | 99.7 | 96.1 | 93 | |
| ZY Waterworks | 3 | 1.5 | 1.2 | 0.3 | 3.9 | 7 | ||
| JH | Water diversion from JH | 100 | 100 | 100 | 95.5 | 96.5 | 95.5 | |
| QTL Waterworks | 0 | 0 | 0 | 2.4 | 2.3 | 3.9 | ||
| ZY Waterworks | 0 | 0 | 0 | 2.1 | 1.2 | 0.6 | ||
| Month | October | November | December | January | February | March | Year | |
| District | Water Supply Project | Water Supply Percentage (%) | ||||||
| ZY | Water diversion from JH | 8.9 | 9.8 | 9.7 | 16.5 | 17.4 | 11.3 | 11.2 |
| ZY Reservoir | 88.1 | 89.8 | 89.7 | 82.3 | 80.8 | 69.9 | 81.4 | |
| SW Reservoir | 3 | 0.4 | 0.6 | 1.2 | 1.8 | 16 | 6.1 | |
| QTL Waterworks | 0 | 0 | 0 | 0 | 0 | 2.8 | 1.3 | |
| QTL | QTL Reservoir | 92 | 90 | 88.8 | 84.5 | 82.7 | 95.4 | 93.6 |
| ZY Waterworks | 8 | 10 | 11.2 | 15.5 | 17.3 | 4.6 | 6.4 | |
| JH | Water diversion from JH | 94.3 | 93.4 | 95.5 | 97.2 | 100 | 100 | 97.3 |
| QTL Waterworks | 5 | 6.3 | 3.9 | 2.2 | 0 | 0 | 2.1 | |
| ZY Waterworks | 0.7 | 0.3 | 0.6 | 0.6 | 0 | 0 | 0.6 | |
| Metrics | Spatial Scale | CIS | MWSJD-CDD | MWSJD-ODD |
|---|---|---|---|---|
| Accumulated urban water shortage during the simulation period (104 m3) | Lanxi City | 16,854 | 10,050 | 7078 |
| ZY District | 14,678 | 7624 | 5352 | |
| QTL District | 30 | 367 | 327 | |
| JH District | 1668 | 1581 | 1161 | |
| CT District | 478 | 478 | 237 | |
| Annual maximum urban water shortage during the simulation period (104 m3) | Lanxi City | 1628 | 1396 | 1273 |
| ZY District | 1568 | 1064 | 1102 | |
| QTL District | 4 | 157 | 113 | |
| JH District | 129 | 148 | 143 | |
| CT District | 131 | 131 | 112 | |
| Guarantee rate of urban water supply during the simulation period (%) | ZY District | 55.9% | 67.1% | 90.6% |
| QTL District | 98.1% | 98.6% | 98.4% | |
| JH District | 94.4% | 94.5% | 94.5% | |
| CT District | 89.5% | 89.5% | 98.4% | |
| Accumulated abandoned water of reservoirs (104 m3) | ZY Reservoir | 18,729 | 30,688 | 31,321 |
| QTL Reservoir | 12,935 | 2705 | 2632 | |
| CT Reservoir | 23,982 | 23,982 | 23,573 | |
| Summation | 55,645 | 57,374 | 57,527 |
Disclaimer/Publisher’s Note: The statements, opinions and data contained in all publications are solely those of the individual author(s) and contributor(s) and not of MDPI and/or the editor(s). MDPI and/or the editor(s) disclaim responsibility for any injury to people or property resulting from any ideas, methods, instructions or products referred to in the content. |
© 2023 by the authors. Licensee MDPI, Basel, Switzerland. This article is an open access article distributed under the terms and conditions of the Creative Commons Attribution (CC BY) license (https://creativecommons.org/licenses/by/4.0/).
Share and Cite
Li, L.; Wang, L.; Gao, X.; Su, X.; Wang, Y.; Gao, R. Joint Optimal Dispatch of Complex Urban Raw Water Supply: A Case Study of Lanxi City, Zhejiang Province, China. Water 2023, 15, 3136. https://doi.org/10.3390/w15173136
Li L, Wang L, Gao X, Su X, Wang Y, Gao R. Joint Optimal Dispatch of Complex Urban Raw Water Supply: A Case Study of Lanxi City, Zhejiang Province, China. Water. 2023; 15(17):3136. https://doi.org/10.3390/w15173136
Chicago/Turabian StyleLi, Lingjie, Leizhi Wang, Xuan Gao, Xin Su, Yintang Wang, and Rui Gao. 2023. "Joint Optimal Dispatch of Complex Urban Raw Water Supply: A Case Study of Lanxi City, Zhejiang Province, China" Water 15, no. 17: 3136. https://doi.org/10.3390/w15173136
APA StyleLi, L., Wang, L., Gao, X., Su, X., Wang, Y., & Gao, R. (2023). Joint Optimal Dispatch of Complex Urban Raw Water Supply: A Case Study of Lanxi City, Zhejiang Province, China. Water, 15(17), 3136. https://doi.org/10.3390/w15173136


