Article

A Probabilistic Analysis of Drought Areal Extent Using SPEI-Based Severity-Area-Frequency Curves and Reanalysis Data

by
Nunziarita Palazzolo
1,*,
David J. Peres
1,
Brunella Bonaccorso
2 and
Antonino Cancelliere
1
1
Department of Civil Engineering and Architecture, University of Catania, 95123 Catania, Italy
2
Department of Engineering, University of Messina, 98158 Messina, Italy
*
Author to whom correspondence should be addressed.
Water 2023, 15(17), 3141; https://doi.org/10.3390/w15173141
Submission received: 4 August 2023 / Revised: 26 August 2023 / Accepted: 30 August 2023 / Published: 1 September 2023
(This article belongs to the Special Issue Drought Monitoring and Risk Assessment)

Abstract

:
Assessing and monitoring the spatial extent of drought is of key importance to forecasting the future evolution of drought conditions and taking timely preventive and mitigation measures. A commonly used approach in regional drought analysis involves spatially interpolating meteorological variables (e.g., rainfall depth during specific time intervals, deviation from long-term average rainfall) or drought indices (e.g., Standardized Precipitation Index, Standardized Precipitation Evapotranspiration Index) computed at specific locations. While plotting a drought descriptor against the corresponding percentage of affected areas helps visualize the historical extent of a drought, this approach falls short of providing a probabilistic characterization of the severity of spatial drought conditions. That can be overcome by identifying drought Severity-Area-Frequency (SAF) curves over a region, which establishes a link between drought features with a chosen probability of recurrence (or return period) and the corresponding proportion of the area experiencing those drought conditions. While inferential analyses can be used to estimate these curves, analytical approaches offer a better understanding of the main statistical features that drive the spatial evolution of droughts. In this research, a technique is introduced to mathematically describe the Severity-Area-Frequency (SAF) curves, aiming to probabilistically understand the correlation between drought severity, measured through the SPEI index, and the proportion of the affected region. This approach enables the determination of the area’s extent where SPEI values fall below a specific threshold, thus calculating the likelihood of observing SAF curves that exceed the observed one. The methodology is tested using data from the ERA5-Land reanalysis project, specifically studying the drought occurrences on Sicily Island, Italy, from 1950 to the present. Overall, findings highlight the improvements of incorporating the spatial interdependence of the assessed drought severity variable, offering a significant enhancement compared to the traditional approach for SAF curve derivation. Moreover, they validate the suitability of reanalysis data for regional drought analysis.

1. Introduction

The increasingly frequent occurrence of droughts poses numerous difficulties from both socioeconomic and environmental points of view, leading to detrimental effects on the entire ecosystem [1]. This encouraged all those involved at different levels, i.e., scientists, governments, and decision-makers, to explore innovative approaches and models useful for the mitigation of drought through suitable policies involving both proactive and reactive measures [2]. One of the main challenges is the characterization of drought occurrences, since it can be assumed that every event differs from others due to its specific spatial extent and temporal variability [3,4,5,6]. Moreover, it should be considered that the definition of drought can vary considerably depending on the specific field of study. Droughts are often predominantly characterized by their associated impacts [7]; without taking into account the different methodologies employed for their characterization, monitoring, and spatial delineation [8]. In general, monitoring of droughts is carried out by means of drought indices, which provide a quantitative measure of drought levels by combining several variables such as precipitation and evapotranspiration into a single numerical value [9], or by investigating the probability distribution of their characteristics [10,11,12,13]. While these approaches enable at-site analysis at specific locations for which hydrometeorological time series data are available, regional analysis is required to identify droughts that significantly affect large regions, and besides the duration and severity of drought occurrences, it also provides insights on their spatial extent [14]. Recent studies indicate a notable rise in both global and regional drought areas over the past few decades [15]. According to Dai [16], from 1950 to 2008, there has been a global increase in dry areas, amounting to approximately 1.74% of the world’s total area per decade. One of the simplest approaches to regional drought analysis is the spatial interpolation of either hydrometeorological data related to drought (e.g., rainfall depth during specific time intervals, deviation from long-term average rainfall) or drought indices (e.g., Standardized Precipitation Index SPI, Standardized Precipitation Evapotranspiration Index SPEI), which are point information. This allows for the characterization of spatial variability in drought events and the determination of the extent of historical droughts by plotting a drought descriptor against the corresponding percentage of the affected area [17]. Taking this approach further, more advanced insights can be gained by establishing a relationship between a drought index, its probability of occurrence, and the corresponding areal extent percentage [18,19,20]. Thus, by quantifying the frequency of both severity and areal extent, drought Severity-Area-Frequency curves can be derived [15]. Indeed, these curves provide valuable information regarding the probabilities of the drought’s areal extent at various severity levels across a geographical area, turning out to be a useful tool in drought planning and management [21,22]. According to several studies, the identification of SAF curves can be generally summarized as follows [18,23,24,25,26,27]: (i) estimating drought severity as a function of associated different areal extents and for different threshold values; (ii) selecting the best-fitting probability distribution for the severity data and performing frequency analysis in order to relate its probability of occurrence; (iii) computing the spatial extent of drought occurrence in terms of percentage of area below the considered threshold value of drought severity; (iv) constructing SAF curves linking the values of severity, areal extent, and frequency. Another approach to probabilistically characterizing regional droughts involves analytical methods or approximations of probability distributions related to regional drought characteristics. In this regard, Santos [28] delved into the probabilistic aspects of regional drought features by assuming that precipitation time series remain independent over time and follow a multivariate normal distribution. Specifically, by leveraging the statistical properties of precipitation data, Santos derived key statistical moments and approximated probability density functions (PDFs) for regional drought characteristics such as areal coverage, duration, and intensity. It was assumed that these characteristics follow a normal distribution. Nevertheless, recognizing that some variables may exhibit significant skewness or have boundaries that deviate from normality, Cancelliere [29] used the moments derived by Santos [28] and computed the parameters of probability distributions of regional drought characteristics. Following in the footsteps of Santos [28] and Cancelliere [29], Bonaccorso et al. [30] proposed a novel analytical approach. This approach aimed to probabilistically characterize the relationship between drought severity and areal extent, specifically through the analytical derivation of Severity-Area-Frequency (SAF) curves based on the Standardized Precipitation Index (SPI). Specifically, the authors identified the portion of the studied region where SPI values fall below a predefined threshold and validated the approach through the comparison of the observed areal extents for specific SPI thresholds with the quantiles derived from the analytical approximations. On these grounds, the current study presents a methodological extension building upon the work of Bonaccorso et al. [30]. In more detail, we analytically derived SAF curves for given probabilities and different threshold values of the SPEI [31] index used as a drought severity indicator.
Indeed, SPEI outperforms in identifying drought conditions by considering the monthly variance between precipitation and reference evapotranspiration, representing a fundamental climatic water balance across different time scales [32,33]. Additionally, as SPEI is a standardized index, it maintains the advantage of enabling comparisons of drought characteristics across diverse climatic regions. The methodology is applied to Sicily Island, representing an area of the Mediterranean region often suffering from drought and water scarcity. Gridded reanalysis data of precipitation and temperature provided by the project ERA5-Land (reference) are used to compute the SPEI index at the monthly scale from 1950 to present.
The structure of this paper unfolds as follows: Section 2 outlines the methodology for the probabilistic characterization of drought areal extent. Section 3 introduces this study area, Sicily Island, Italy, along with the ERA5-Land dataset used for this study’s purposes. Section 4 delves into the discussion of results, and Section 5 reports the conclusions of this study.

2. Methodology

In Figure 1, the scheme summarizing the proposed methodology aimed at probabilistically characterizing the drought areal extent and the related derivation of SPEI-based SAF curves, is illustrated.
Assuming a region discretized into m grid points (or m precipitation stations), be s k the relative influence area, i.e., the cell size of the k grid point. Let X k , t and Y k , t be precipitation and temperature data, respectively, at grid point k and at time t. These data are retrieved from the reanalysis project ERA5-Land with a horizontal resolution equal to 0.1° × 0.1° (≅9 km) [34], and at the monthly scale. Recent studies, indeed, have provided evidence that, despite ongoing accuracy issues, the key climate indicators (e.g., soil moisture, temperature, and precipitation) derived from the latest reanalysis projects, such as the ERA5 reanalysis one, have a reasonable level of accuracy in reproducing on-site measurements [35,36]. Precipitation and temperature data are, thus, used to derive the monthly time series of the Standardized Precipitation Evapotranspiration Index (SPEI) Z k , t , for each grid cell of the investigated study area. The SPEI [31] serves as a drought indicator, offering insights into the onset, duration, and intensity of drought conditions, and its calculation relies on the climatic water balance (CWB), which represents the difference between precipitation (PR) and reference evapotranspiration ( E T 0 ) on a monthly scale (k). Specifically, for each grid point k, SPEI series is computed based on X k , t , t = 1 ,   2 ,   n and Y k , t , t = 1,2 ,   n by means of the following procedure [33]: (i) fitting a log-logistic distribution to the CWB time series unbiased probability-weighted moments (PWMs) for parameters’ estimation; (ii) applying an equiprobability transformation from the fitted distribution to the normal one through the inverse of the standard normal cumulative distribution function; and iii) computing the SPEI as the standard normal deviate corresponding to the probability of the CWB value at a given time scale k, usually ranging from 1 to 48 months. Potential evaporation estimates for the SPEI index are derived here from Thornthwaite’s equation [37] as a function of the monthly means of daily averaged temperatures:
P E T = 16 10 T I a
where P E T is in mm month−1 and a is given by a third-order polynomial in the heat index I .This latter is given by Equation (2), and it has for each year 12 monthly means of daily averaged temperature values as input (Equation (2))
I = i = 1 12 T 5 1.514
SPEI values above zero denote moisture conditions that are higher than the average, whereas negative values suggest drier than average conditions. Thus, a drought event is defined as occurring when the SPEI value falls below or equals −1 during a specific period. The drought categories based on SPEI values are listed in Table 1.
Therefore, for a given grid point k, if Z k , t is the SPEI value at time t, and z 0 is a generic SPEI threshold value, then the indicator variable I k , t can be introduced in order to discriminate when Z k , t is either above, or below the z 0 threshold, respectively. Specifically, let I k , t be equal to 0 if and let be equal to 1 if Z k , t z 0 , then the indicator variable I k , t is characterized by the probability p k = P [ Z k , t z 0 ] of being equal to 1 and by the probability of being equal to 0.
Hence, the fraction of the total investigated area A d , t where the SPEI value Z k , t is below a z 0 threshold value at time t, is defined as follows:
A d , t = k = 1 m a k I k , t
where a k represents the area of influence of the grid point k as a fraction of the entire area. According to Santos [28] and Bonaccorso et al. [30], Equations (4) and (5) express the first two moment of the area A d , t , i.e., the expected value and the variance, which are derived as a function of the stochastic properties of the SPEI field and of z 0 :
ε [ A d , t ] = ε k = 1 m a k I k , t = k = 1 m a k p k
V a r [ A d , t ] = k = 1 m a k 2 p k 1 p k + 2 k = 1 m k = 1 + 1 m a k a j ( p k , j p k p j )
with p k p j = P [ z k , t z 0 , z j , t z 0 ] .
At this stage, under the assumption that SPEI is distributed, by definition, according to a standard normal, and thus p k = Φ ( z 0 ) , with Φ ( z 0 ) as the cumulative density function of the standard normal distribution, Equations (4) and (5) are rewritten as functions of Φ ( z 0 ) , as follows:
ε [ A d , t ] = k = 1 m a k Φ z 0 = Φ z 0
V a r [ A d , t ] = k = 1 m a k 2 Φ z 0 1 Φ z 0 + 2 k = 1 m k = 1 + 1 m a k a j [ p k , j Φ 2 z 0 ]
Examining Equations (4)–(7), it is possible to derive key considerations related to the area as well as the spatial correlation of SPEI values at different grid points. Indeed, it should be noted that, whereas ε [ A d , t ] is a function of z 0 (i.e., SPEI) only, is also a function of and of the spatial correlation consequently. More specifically, looking at Equation (7), this means that if there is no spatial correlation between precipitation/temperature fields (or SPEI) in grid points k and j, the term [ p k , j Φ 2 z 0 ] will be equal to zero, while it will be greater than zero in the case of a spatial dependence. As a result, strong spatial dependances of the SPEI field in a region correspond to higher values of the variance of Following the procedure shown in Figure 1, the next step involves finding the exact distribution of A d , t , which could certainly be a difficult task, as evidenced by Santos [28] and Cancelliere [29]. However, assuming the most general case, a beta distribution can be assumed as an approximation for since it is bounded between 0 and 1 (Equation (8)) [29,38,39].
f A d t a = 1 B δ , ξ a δ 1 ( 1 a ) ξ 1
with 0 a 1 , and the parameters δ , ξ . These latter can be estimated as a function of the same moments of A d , t , i.e., μ A = ε [ A d , t ] , and σ A 2 = V a r [ A d , t ] [38]. Thus, once the first moments of the beta distribution are defined, its parameters δ , ξ are defined as well by Equations (9) and (10), respectively.
δ = μ A 2 1 μ A σ A 2 μ A
ξ = ( 1 μ A ) δ μ A
At this stage, through the inverse of the cumulative distribution function of the beta distribution, SAF curves can be finally drawn for a given probability with reference to several values of z 0 . More specifically, for a fixed non-exceedance probability q, the corresponding areal extent A d ( q ) is given by the inverse of the cumulative distribution function of the beta distribution (Equation (11)), which is none other than the integral of Equation (8) that can be easily numerically solved.
q = 0 A d ( q ) 1 B δ , ξ a δ 1 ( 1 a ) ξ 1

3. Study Area and Data

The proposed methodology has been applied to probabilistically characterize drought areal extent in Sicily Island, Italy (Figure 2). Sicily is one of the largest islands in the Mediterranean Sea, with a surface area of ≅25,000 km2. The climate of the island is semiarid, with a mean annual precipitation of around 700 mm and high intra-annual variability from year to year. The climatic features frequently promote the onset of drought conditions, especially during the hottest months [40,41], and these conditions are projected to become more severe in the future [33,42]. Precipitation and temperature data, used for SPEI calculation, are retrieved from the reanalysis project ERA5-Land (https://cds.climate.copernicus.eu/cdsapp#!/dataset/reanalysis-era5-land-monthly-means?tab=overview (accessed on 29 August 2023)). The data are provided as averages on a monthly scale from 1950 to the present (almost 73 years) and with a horizontal resolution of 0.1° × 0.1°.

4. Results and Discussion

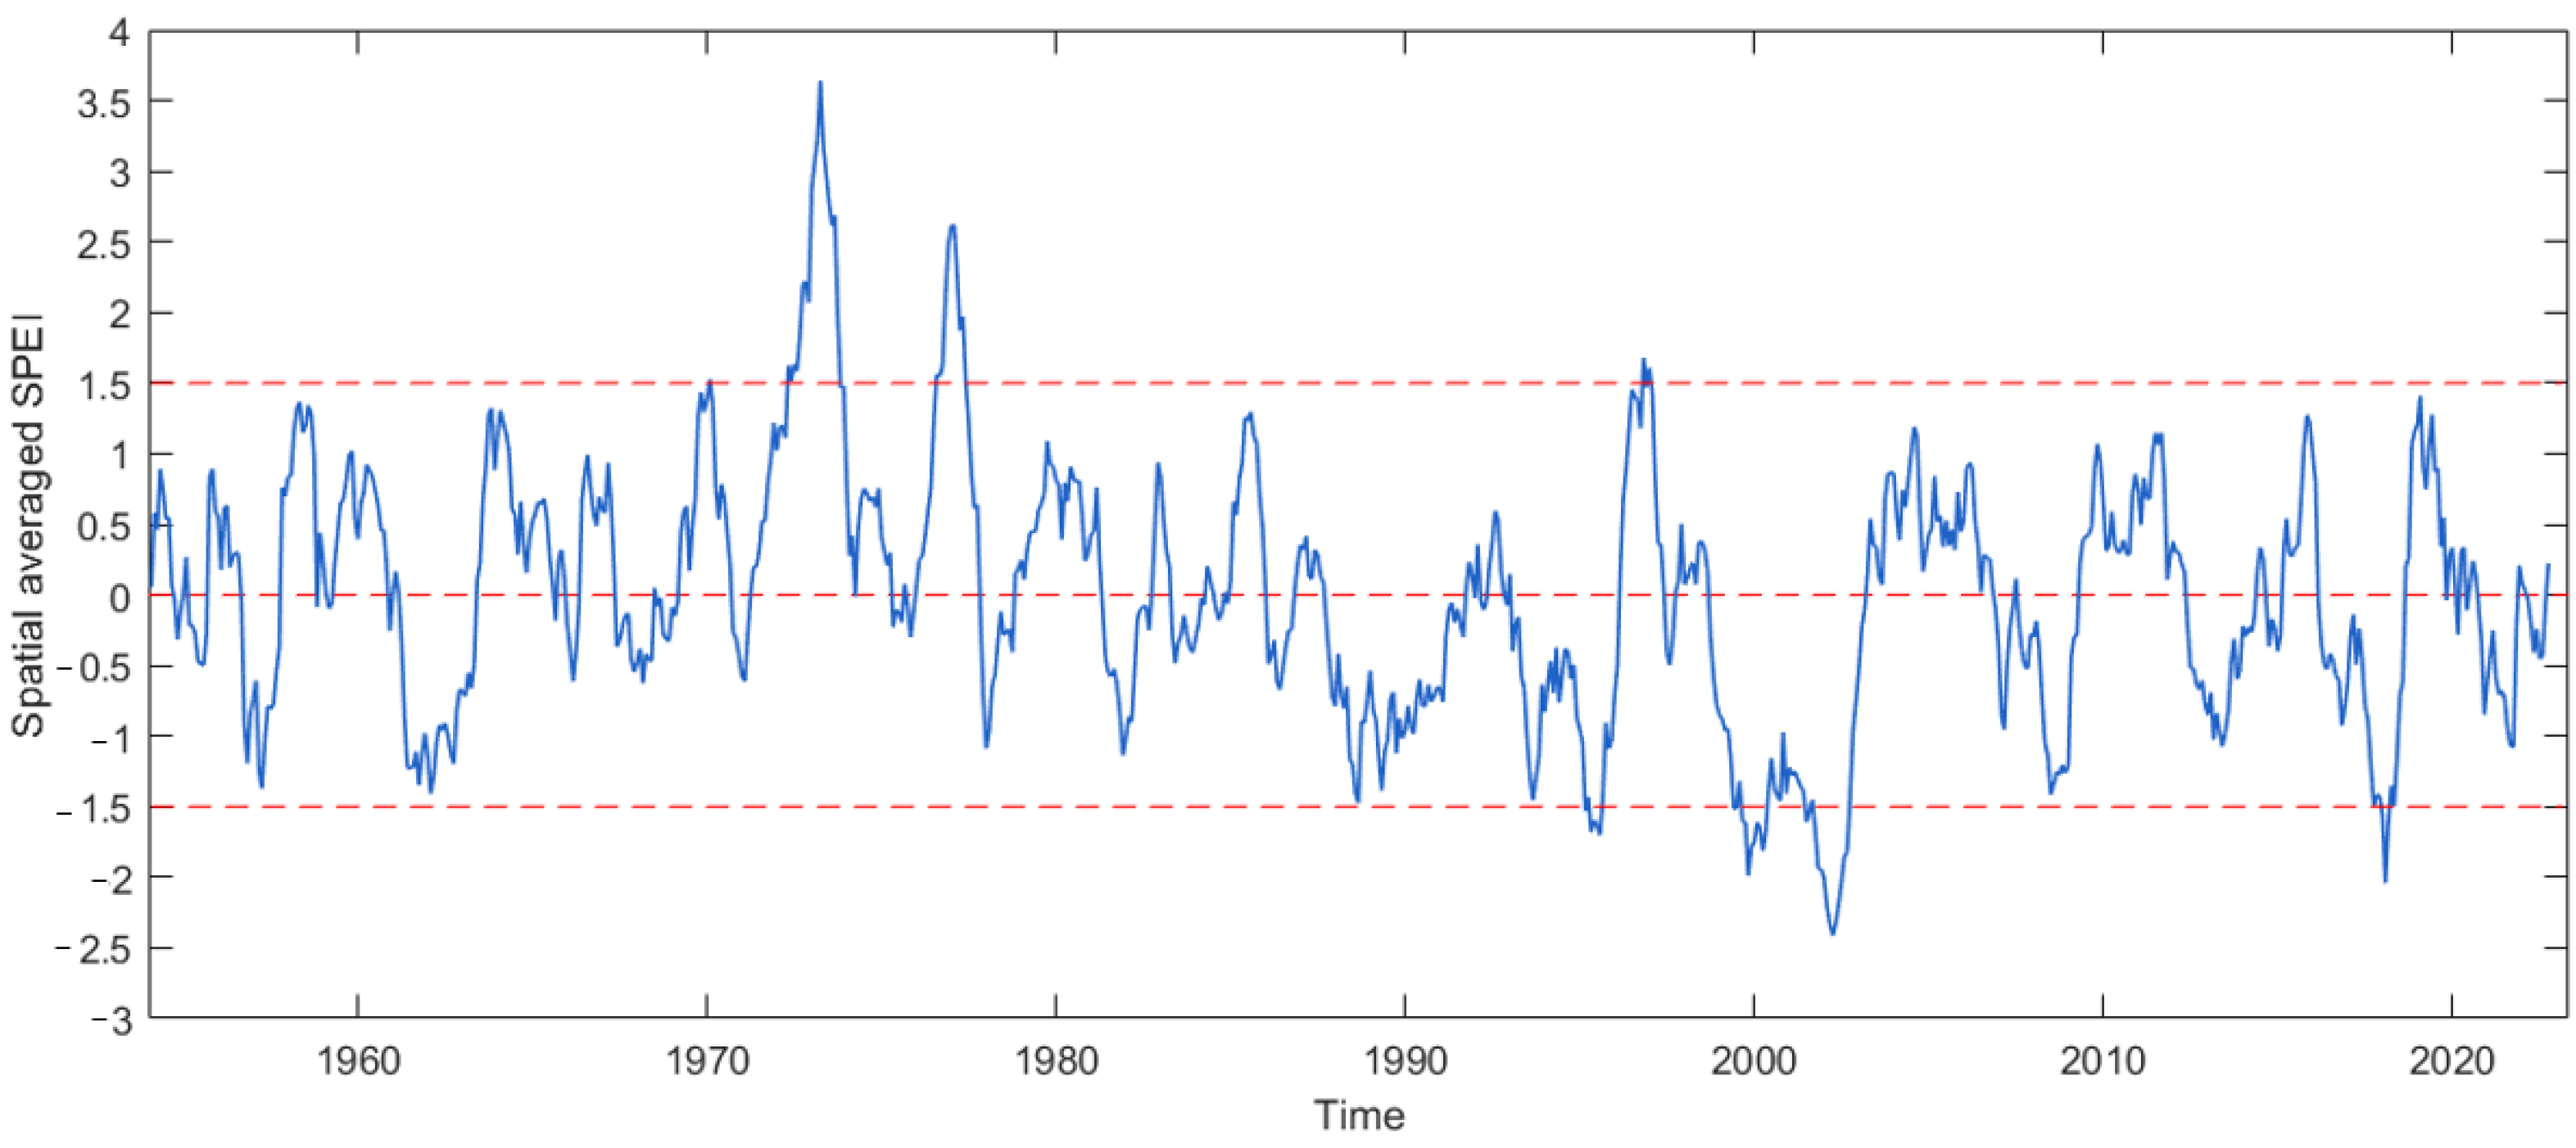
As reported in the Section 2, monthly SPEI series have been computed for each grid point of the investigated study area. The spatial averaged values are shown in Figure 3. As can be noted, over the past 70 years, Sicily island has been interested by averaged SPEI values ranging between −1.5 and 1.5, with sparse both positive and negative peaks. As an example, on March 1973 and on March 2002, SPEI values equal to about 3.5 (extremely wet) and −2.5 (extremely drought) were observed, respectively. SPEI values ranging, instead, around zero indicate near normal conditions.
Then, the observed Severity-Area curves have been derived for each month. Specifically, given a range of several z 0 thresholds, the percentages of the entire study area A d , t ( z 0 ) characterized by SPEI values below z 0 are determined through Equation (3). Figure 4 shows three Severity-Area curves corresponding to the aforementioned three reference events. This Figure depicts three different experienced conditions with respect to drought, and occurred in correspondence of three different years. Severity-Area curve derived for March 2002 indicates that the whole island was interested by extremely dry conditions with SPEI < 2, and that almost 50% of the total area was affected by SPEI values equal to about −3. The second reported Severity-Area curve, i.e., the curve referred to May 1997, is representative of a near normal condition, where almost the 80% of the entire island yielded SPEI values around 0. Finally, the curve derived for March 1973 is representative of an extremely wet condition observed throughout the island, with only positive SPEI values between 2 and 4.
At this stage, the probabilistic characterization of Severity-Area curves has been carried out. Firstly, assuming the SPEI follows a multivariate normal, the expected value (Equation (4)) and the variance (Equation (5)) of the percentage of area A d , t ( z 0 ) characterized by SPEI values below z 0 are computed corresponding to given z 0 threshold values, ranging between −4 and 4. Therefore, since a beta distribution can be assumed for A d , t ( z 0 ) , parameters’ values δ (Equation (9)) and ξ (Equation (10)) are derived, and the probability plot is drawn for different z 0 threshold (Figure 5). More in detail, the empirical area is plotted (x-axis) vs. its analytical counterpart (y-axis). In this regard, it should be highlighted that, since the distribution’s parameters are derived analytically as a function of the stochastic properties of the SPEI field, there is no need to fit a parametric distribution. Overall, Figure 5 discloses a general good agreement between theoretically derived distributions and empirical ones. This indicates the feasibility of the proposed approach.
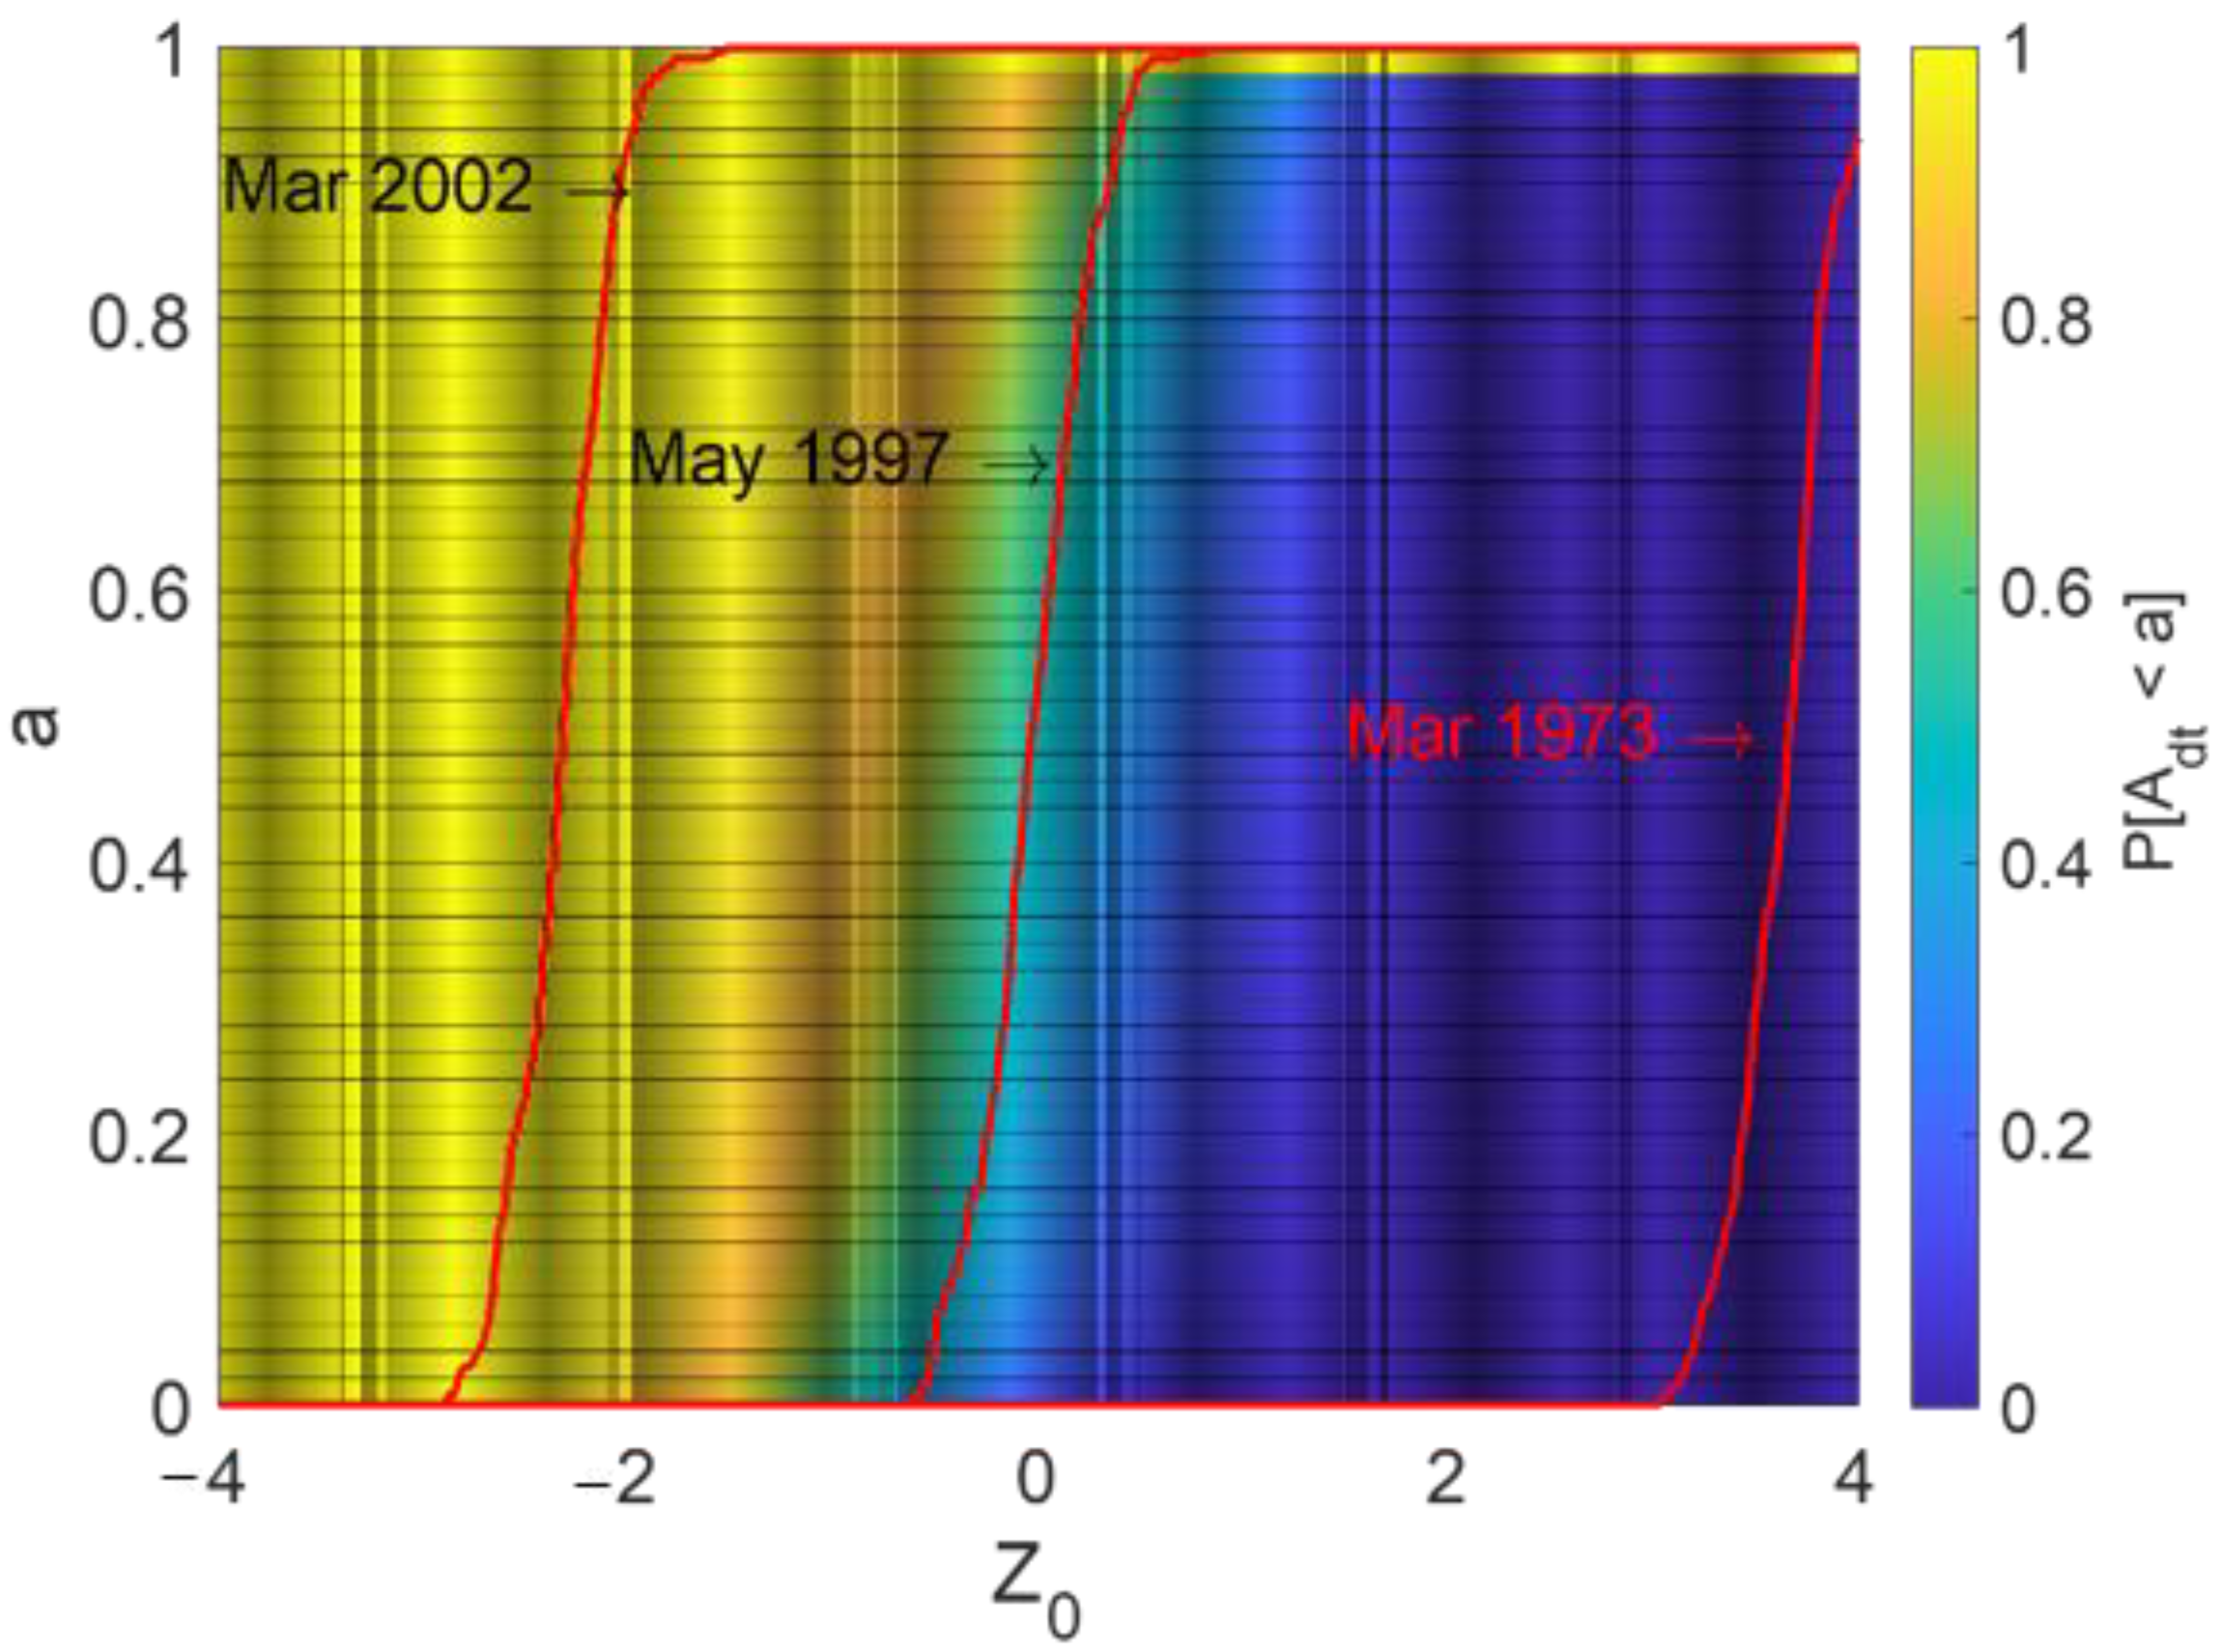
Finally, since the distribution of A d , t ( z 0 ) is known, thanks to the inverse of the cumulative distribution function of the beta distribution, i.e., through Equation (11), quantiles Ad(q) corresponding to non-exceedance probabilities q are computed, and results are shown in Figure 6. Precisely, the plot Ad(q) vs. z 0 is a result of interpolated q values and is represented according to a color scale.
Figure 6 shows a comprehensive depiction of the regional climate patterns and the likelihood of their occurrence for any given month and year, even if, when a regional drought analysis is carried out, attention should be directed towards the half-plane corresponding to negative values. Moreover, the graph corroborates the occurrence of severe drought conditions in March 2002, with non-exceedance probabilities around 95%, as well as the notable wet conditions observed over the island during March 1973, with non-exceedance probabilities around 1%. Thus, SAF plots enable to compute the probability of observing in a given month drought conditions worse than the current. The severe drought occurrence involving Sicily island in March 2002, detected by means of the proposed methodology, is also corroborated by a report published by the Sicilian Agrometeorological Information Service (SIAS) in that year (http://www.sias.regione.sicilia.it/Siccita/siccita_2001_2002.htm (accessed on 29 August 2023)). Specifically, SIAS stated that the precipitation deficit in the different areas of Sicily affected by the most severe manifestations of drought occurrence was estimated at approximately 200–250 mm, with peaks reaching 300 mm. It should be noted that in many of these areas, as opposed to the typical 400–500 mm of precipitation that historically occurs during the period under consideration, only 200–250 mm or less was recorded in the last months of 2001. Additionally, it was observed that while August 2001 generally experienced above-average rainfall, the critical drought period started in September and escalated significantly in October. During October 2001, indeed, nearly all regions witnessed negative deviations of nearly 100%, essentially signifying a complete absence of rainfall. The rainy events in November and December 2001, conversely, were localized primarily on the northern side of the island, while the prevailing crisis persisted unabated in the remaining areas of the regional territory. This situation further extended into the initial three months of 2002, starting in January but exacerbating significantly during the months of February and March. The spring 2002 drought occurrence was also detected by Bonaccorso et al. [30] through the SPI-based regional drought analysis that the authors carried out for Sicily Island. Specifically, it should be noted that SPEI-based SAF curves have a more pronounced slope and exhibit a narrower range of SPEI values, mainly spanning between −2 and −3, with non-exceedance probabilities around 95%. Conversely, the corresponding SPI-based SAF curve, presented in Bonaccorso et al. [30], for the same drought event in 2002, exhibits a significantly wider range, encompassing less severe SPI values down to −0.5. This observation suggests that using SPEI for constructing SAF curves enables an improved identification of widespread drought conditions and that SPEI has heightened sensitivity in detecting drought conditions due to its capacity to take into account temperature, besides precipitation. In this context, it should be considered that the influence of the main regional climate factors should not be underestimated. In this regard, Di Mauro et al. [43] carried out an analysis to assess the impact of the North Atlantic Oscillation Index (NAO) [44] on Sicilian rainfall patterns. NAO is a climate pattern characterized by atmospheric pressure variations between the Azores and Iceland, impacting the direction and strength of westerly winds and subsequently influencing weather patterns in North America and Europe. Specifically, the authors found out how widespread spatial drought occurrences can be effectively impacted by these meteorological and climatic phenomena on a global scale.
Overall, in addition to corroborating the findings of Bonaccorso et al. [30], results demonstrate the suitability of reanalysis data to assess regional drought analysis. This aspect should not be overlooked since the possibility of using reanalysis data serves as a valuable support for regions with limited in-situ measurements, and being gridded data, it is much easier to employ within the framework of the proposed methodology. Finally, it is worth noting that the regional drought analysis based on SPEI will allow us, in future studies, to consider the role of temperature and, thereby, the influence of global warming on drought conditions. On this path, the forthcoming research steps will involve the analysis of projected drought scenarios utilizing the meteorological data as supplied by the most recent climate projections, with the aim of deriving future SAF curves under different scenarios.

5. Conclusions

Efficient water resource planning requires a nuanced understanding of drought patterns within a region. To enhance this process, it is essential to assess droughts on a regional scale, as such an assessment can provide valuable insights for considering strategies such as water transfer strategies to mitigate drought impacts.
In this study, we have applied a probabilistic framework to assess at the regional scale the drought severity as a function of the SPEI and to link it to the spatial extent of the affected area. To this aim, the probabilistic characterization of drought areal extent has been carried out by means of the derivation of Drought-Severity-Frequency curves, which provide non-exceedance probabilities to observe within a region the area characterized by SPEI values below given thresholds. The methodology has been tested using data from Sicily Island, encompassing historical drought occurrences and utilizing ERA5-Land reanalysis data for precipitation and temperature from 1950 to the present. The proposed approach, which considers the spatial interplay of the drought severity variable, constitutes a substantial improvement over traditional inferential techniques for constructing SAF curves. Specifically, the analysis has revealed how, as spatial dependence intensifies, the variability in the extent of area covered by SPEI values below a specified threshold increases. Furthermore, in comparison with the SPI-based analysis of the spring 2002 drought in Sicily conducted by a previous study [30], it was shown that using SPEI for constructing SAF curves with a steeper slope and a narrower range (primarily between −2 and −3) improved the identification of widespread drought conditions due to SPEIs heightened sensitivity in considering temperature alongside precipitation. Overall, the finding of this study thus highlights the step forward made by incorporating the spatial interdependence of the assessed drought severity variable and corroborates other studies demonstrating the valuable advancement of this probabilistic approach compared to traditional inferential methods for deriving SAF curves. As a side result, the specific outcomes obtained for Sicily corroborate those of a preceding study based on SPI and observed data [30] which implicitly demonstrates the suitability of reanalysis data for reliable drought analysis. The approach and the use of the SPEI index, which is sensitive to temperature and thus to global warming, will allow us to assess the future impacts of climate change on the spatial extent of droughts in Sicily.

Author Contributions

Conceptualization, D.J.P., B.B. and A.C.; Data curation, N.P. and A.C.; Formal analysis, N.P. and A.C.; Investigation, N.P. and A.C.; Methodology, B.B. and A.C.; Supervision, D.J.P., B.B. and A.C.; Writing—original draft, N.P.; Writing—review and editing, N.P., D.J.P. and A.C. All authors have read and agreed to the published version of the manuscript.

Funding

Nunziarita Palazzolo is supported by a post-doctoral programe funded by the project “Autorità di Bacino del Distretto Idrografico della Sicilia—Interventi per il miglioramento dei corpi idrici CUP: F62G16000000001”. Research was also supported by HydrEx—Hydrological extremes in a changing climate—funded within the Piano di incentivi per la ricerca di Ateneo (Pia.ce.ri.) of University of Catania.

Data Availability Statement

Data sharing not applicable. No new data were created or analyzed in this study. Data sharing is not applicable to this article.

Conflicts of Interest

The authors declare no conflict of interest.

References

  1. Orimoloye, I.R.; Belle, J.A.; Orimoloye, Y.M.; Olusola, A.O.; Ololade, O.O. Drought: A Common Environmental Disaster. Atmosphere 2022, 13, 111. [Google Scholar] [CrossRef]
  2. Bandyopadhyay, N.; Bhuiyan, C.; Saha, A.K. Drought mitigation: Critical analysis and proposal for a new drought policy with special reference to Gujarat (India). Prog. Disaster Sci. 2020, 5, 100049. [Google Scholar] [CrossRef]
  3. Raziei, T.; Saghafian, B.; Paulo, A.A.; Pereira, L.S.; Bordi, I. Spatial patterns and temporal variability of drought in Western Iran. Water Resour. Manag. 2009, 23, 439–455. [Google Scholar] [CrossRef]
  4. Martins, D.S.; Raziei, T.; Paulo, A.A.; Pereira, L.S. Spatial and temporal variability of precipitation and drought in Portugal. Nat. Hazards Earth Syst. Sci. 2012, 12, 1493–1501. [Google Scholar] [CrossRef]
  5. Wang, H.; Chen, Y.; Pan, Y.; Li, W. Spatial and temporal variability of drought in the arid region of China and its relationships to teleconnection indices. J. Hydrol. 2015, 523, 283–296. [Google Scholar] [CrossRef]
  6. Santos, J.F.; Pulido-Calvo, I.; Portela, M.M. Spatial and temporal variability of droughts in Portugal. Water Resour. Res. 2010, 46, W03503. [Google Scholar] [CrossRef]
  7. Mishra, A.K.; Singh, V.P. A review of drought concepts. J. Hydrol. 2010, 391, 202–216. [Google Scholar] [CrossRef]
  8. Rojas, L.P.T.; Díaz-Granados, M. The Construction and Comparison of Regional Drought Severity-Duration-Frequency Curves in Two Colombian River Basins—Study of the Sumapaz and Lebrija Basins. Water 2018, 10, 1453. [Google Scholar] [CrossRef]
  9. Zargar, A.; Sadiq, R.; Naser, B.; Khan, F.I. A review of drought indices. Environ. Rev. 2011, 19, 333–349. [Google Scholar] [CrossRef]
  10. Zelenhasić, E.; Salvai, A. A method of streamflow drought analysis. Water Resour. Res. 1987, 23, 156–168. [Google Scholar] [CrossRef]
  11. Kendall, D.R.; Dracup, J.A. On the generation of drought events using an alternating renewal-reward model. Stoch. Hydrol. Hydraul. 1992, 6, 55–68. [Google Scholar] [CrossRef]
  12. Mohan, S.; Sahoo, P.K. Stochastic simulation of droughts. Part 1: Point droughts. Hydrol. Process. 2008, 22, 854–862. [Google Scholar] [CrossRef]
  13. Cancelliere, A.; Salas, J.D. Drought probabilities and return period for annual streamflows series. J. Hydrol. 2010, 391, 77–89. [Google Scholar] [CrossRef]
  14. Shah, D.; Mishra, V. Drought Onset and Termination in India. J. Geophys. Res. Atmos. 2020, 125, e2020JD032871. [Google Scholar] [CrossRef]
  15. Li, Z.; Shao, Q.; Tian, Q.; Zhang, L. Copula-based drought severity-area-frequency curve and its uncertainty, a case study of Heihe River basin, China. Hydrol. Res. 2020, 51, 867–881. [Google Scholar] [CrossRef]
  16. Dai, A. Characteristics and trends in various forms of the Palmer Drought Severity Index during 1900-2008. J. Geophys. Res. Atmos. 2011, 116, D12115. [Google Scholar] [CrossRef]
  17. An, Q.; He, H.; Gao, J.; Nie, Q.; Cui, Y.; Wei, C.; Xie, X. Analysis of Temporal-Spatial Variation Characteristics of Drought: A Case Study from Xinjiang, China. Water 2020, 12, 741. [Google Scholar] [CrossRef]
  18. Das, S.; Das, J.; Umamahesh, N.V. Investigating seasonal drought severity-area-frequency (SAF) curve over Indian region: Incorporating GCM and scenario uncertainties. Stoch. Environ. Res. Risk Assess. 2022, 36, 1597–1614. [Google Scholar] [CrossRef]
  19. Patil, R.; Polisgowdar, B.S.; Rathod, S.; Bandumula, N.; Mustac, I.; Srinivasa Reddy, G.V.; Wali, V.; Satishkumar, U.; Rao, S.; Kumar, A.; et al. Spatiotemporal Characterization of Drought Magnitude, Severity, and Return Period at Various Time Scales in the Hyderabad Karnataka Region of India. Water 2023, 15, 2483. [Google Scholar] [CrossRef]
  20. Kumar, P.; Ma, M.; Zang, H.; Wang, W.; Cui, H.; Sun, Y.; Cheng, Y. Copula-Based Severity–Duration–Frequency (SDF) Analysis of Streamflow Drought in the Source Area of the Yellow River, China. Water 2023, 15, 2741. [Google Scholar] [CrossRef]
  21. Reddy, M.J.; Ganguli, P. Spatio-temporal analysis and derivation of copula-based intensity-area-frequency curves for droughts in western Rajasthan (India). Stoch. Environ. Res. Risk Assess. 2013, 27, 1975–1989. [Google Scholar] [CrossRef]
  22. Amirataee, B.; Montaseri, M.; Rezaie, H. Regional analysis and derivation of copula-based drought Severity-Area-Frequency curve in Lake Urmia basin, Iran. J. Environ. Manag. 2018, 206, 134–144. [Google Scholar] [CrossRef] [PubMed]
  23. Kim, T.W.; Valdés, J.B.; Aparicio, J. Frequency and spatial characteristics of droughts in the Conchos River Basin, Mexico. Water Int. 2002, 27, 420–430. [Google Scholar] [CrossRef]
  24. Loukas, A.; Vasiliades, L. Probabilistic analysis of drought spatiotemporal characteristics inThessaly region, Greece. Nat. Hazards Earth Syst. Sci. 2004, 4, 719–731. [Google Scholar] [CrossRef]
  25. Mishra, A.K.; Desai, V.R. Spatial and temporal drought analysis in the Kansabati river basin, India. Int. J. River Basin Manag. 2005, 3, 43–52. [Google Scholar] [CrossRef]
  26. Mishra, A.K.; Singh, V.P. Analysis of drought severity-area-frequency curves using a general circulation model and scenario uncertainty. J. Geophys. Res. Atmos. 2009, 114, D06120. [Google Scholar] [CrossRef]
  27. Sordo-Ward, A.; Bejarano, M.D.; Iglesias, A.; Asenjo, V.; Garrote, L. Analysis of Current and Future SPEI Droughts in the La Plata Basin Based on Results from the Regional Eta Climate Model. Water 2017, 9, 857. [Google Scholar] [CrossRef]
  28. Santos, M.A. Regional droughts: A stochastic characterization. J. Hydrol. 1983, 66, 183–211. [Google Scholar] [CrossRef]
  29. Cancelliere, A. Stochastic Characterization of Droughts in Stationary and Periodic Series; ProQuest Dissertations Publishing, Colorado State University: Fort Collins, CO, USA, 2011. [Google Scholar]
  30. Bonaccorso, B.; Peres, D.J.; Castano, A.; Cancelliere, A. SPI-Based Probabilistic Analysis of Drought Areal Extent in Sicily. Water Resour. Manag. 2015, 29, 459–470. [Google Scholar] [CrossRef]
  31. Vicente-Serrano, S.M.; Beguería, S.; López-Moreno, J.I. A Multiscalar Drought Index Sensitive to Global Warming: The Standardized Precipitation Evapotranspiration Index. J. Clim. 2010, 23, 1696–1718. [Google Scholar] [CrossRef]
  32. Achite, M.; Bazrafshan, O.; Katipoğlu, O.M.; Azhdari, Z. Evaluation of hydro-meteorological drought indices for characterizing historical droughts in the Mediterranean climate of Algeria. Nat. Hazards 2023, 118, 427–453. [Google Scholar] [CrossRef]
  33. Peres, D.J.; Bonaccorso, B.; Palazzolo, N.; Cancelliere, A.; Mendicino, G.; Senatore, A. A dynamic approach for assessing climate change impacts on drought: An analysis in Southern Italy. Hydrol. Sci. J. 2023, 68, 1213–1228. [Google Scholar] [CrossRef]
  34. Muñoz Sabater, J. ERA5-Land monthly averaged data from 1950 to present. Copernic. Clim. Chang. Serv. Clim. Data Store 2019. [Google Scholar] [CrossRef]
  35. Vanella, D.; Longo-Minnolo, G.; Belfiore, O.R.; Ramírez-Cuesta, J.M.; Pappalardo, S.; Consoli, S.; D’Urso, G.; Chirico, G.B.; Coppola, A.; Comegna, A.; et al. Comparing the use of ERA5 reanalysis dataset and ground-based agrometeorological data under different climates and topography in Italy. J. Hydrol. Reg. Stud. 2022, 42, 101182. [Google Scholar] [CrossRef]
  36. Li, M.; Wu, P.; Ma, Z. A comprehensive evaluation of soil moisture and soil temperature from third-generation atmospheric and land reanalysis data sets. Int. J. Climatol. 2020, 40, 5744–5766. [Google Scholar] [CrossRef]
  37. Thornthwaite, C.W. An Approach toward a Rational Classification of Climate. Geogr. Rev. 1948, 38, 55. [Google Scholar] [CrossRef]
  38. Norman, L.; Johnson, S.; Kotz, N.B. “14: Lognormal Distributions”, Continuous univariate distributions. Wiley Ser. Probab. Math. Stat. Appl. Probab. Stat. 1994, 1, 119. [Google Scholar]
  39. Sheffield, J.; Goteti, G.; Wen, F.; Wood, E.F. A simulated soil moisture based drought analysis for the United States. J. Geophys. Res. D Atmos. 2004, 109, 1–19. [Google Scholar] [CrossRef]
  40. Mendicino, G.; Senatore, A.; Versace, P. A Groundwater Resource Index (GRI) for drought monitoring and forecasting in a mediterranean climate. J. Hydrol. 2008, 357, 282–302. [Google Scholar] [CrossRef]
  41. Rossi, G.; Benedini, M. Water Resources of Italy; Springer: Berlin/Heidelberg, Germany, 2020. [Google Scholar]
  42. Peres, D.J.; Senatore, A.; Nanni, P.; Cancelliere, A.; Mendicino, G.; Bonaccorso, B. Evaluation of EURO-CORDEX (Coordinated Regional Climate Downscaling Experiment for the Euro-Mediterranean area) historical simulations by high-quality observational datasets in southern Italy: Insights on drought assessment. Nat. Hazards Earth Syst. Sci. 2020, 20, 3057–3082. [Google Scholar] [CrossRef]
  43. Di Mauro, G.; Bonaccorso, B.; Cancelliere, A.; Rossi, G. Use of NAO index to improve drought forecasting in the Mediterranean area: Application to Sicily region. In Drought Management: Scientific and Technological Innovations; López-Francos, A., Ed.; CIHEAM: Zaragoza, Spain, 2008; pp. 311–319. [Google Scholar]
  44. Hurrell, J.W. Decadal Trends in the North Atlantic Oscillation: Regional Temperatures and Precipitation. Science 1995, 269, 676–679. [Google Scholar] [CrossRef] [PubMed]
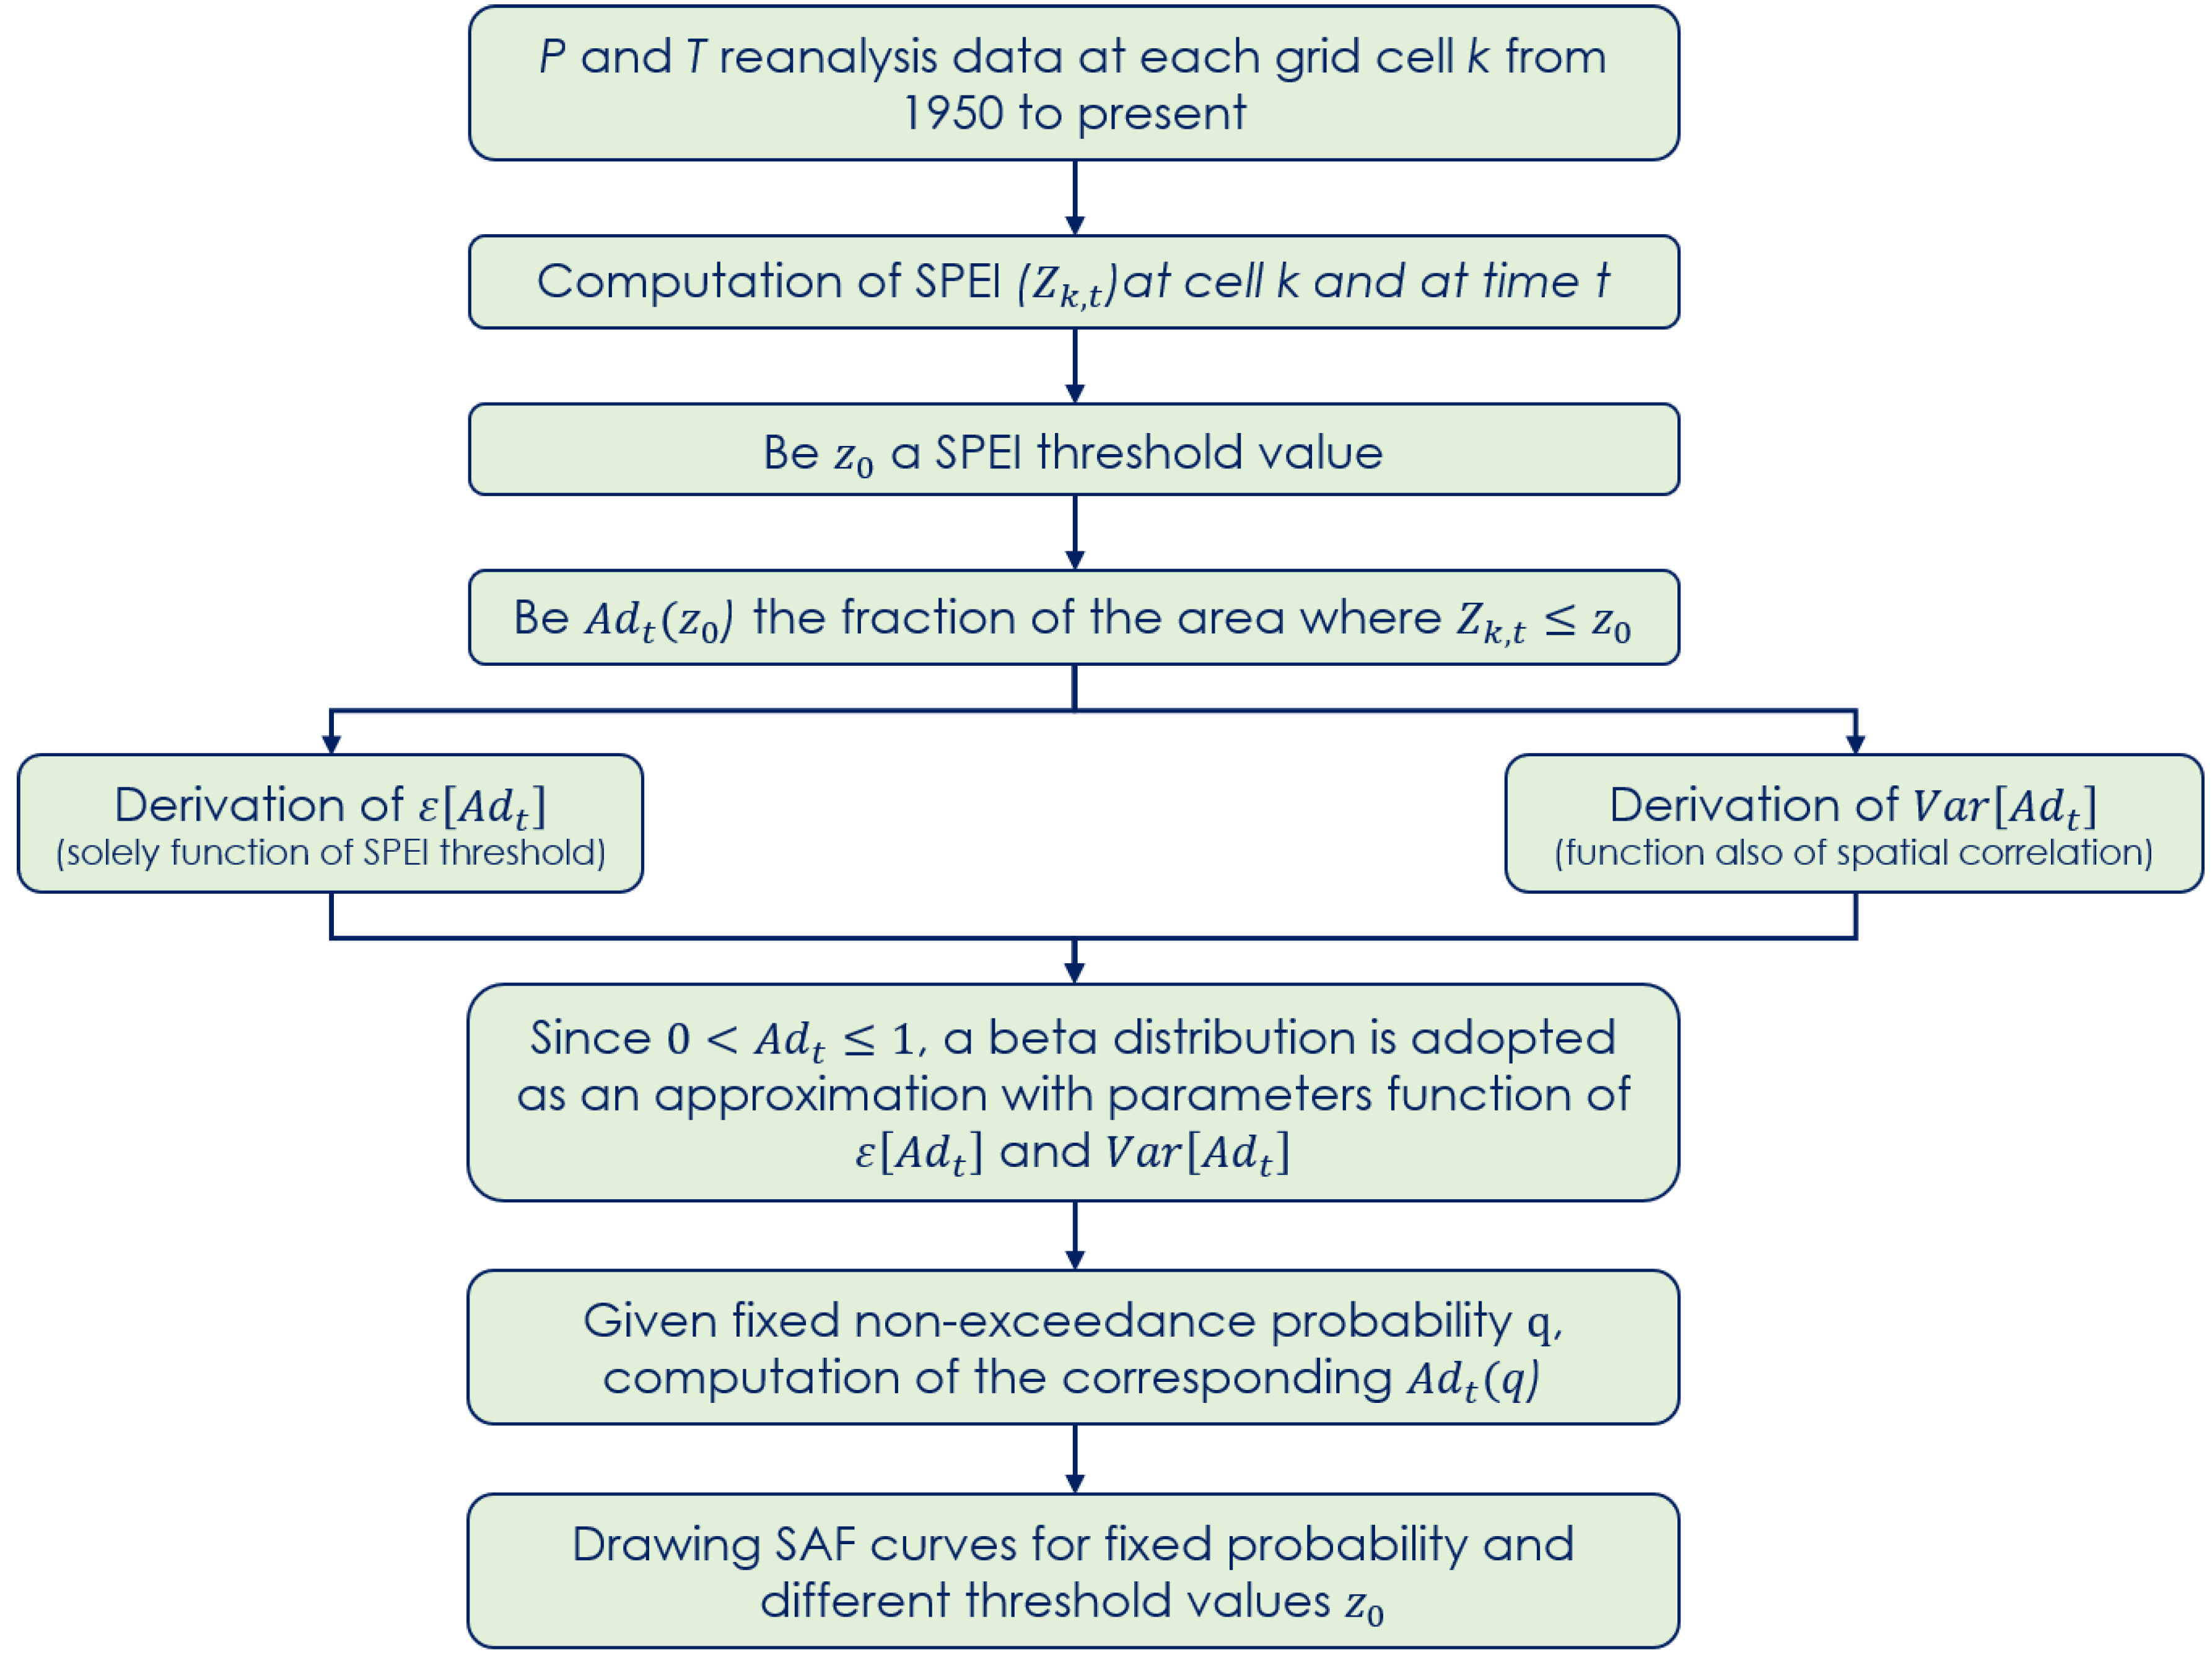
Figure 1. Scheme illustrating the proposed approach for probabilistically characterizing the spatial extent of drought and deriving SAF curves based on SPEI.
Water 15 03141 g001
Figure 2. Elevation map of Sicily Island and related ERA5-Land grid.
Water 15 03141 g002
Figure 3. Spatial averaged SPEI values from 1950 to the present considering the 12-month aggregation time scale.
Water 15 03141 g003
Figure 4. Severity-Area curves referred to three different years where dry, normal and wet conditions occurred.
Water 15 03141 g004
Figure 5. Probability plot of the observed A d , t ( z 0 ) vs. the corresponding quantiles computed using the derived distributions.
Water 15 03141 g005
Figure 6. SAF curves and observed Severity-Area curves for three experienced events in terms of drought conditions.
Water 15 03141 g006
Table 1. Categories of dryness/wetness conditions according to SPEI [30].
CategoriesSPEI Values
Extremely droughtLess than −2
Severe drought−1.99 to −1.50
Moderately drought−1.49 to −1.00
Near normal−0.99 to 0.99
Moderately wet1.00 to 1.49
Severely wet1.50 to 1.99
Extremely wetMore than 2.00
Disclaimer/Publisher’s Note: The statements, opinions and data contained in all publications are solely those of the individual author(s) and contributor(s) and not of MDPI and/or the editor(s). MDPI and/or the editor(s) disclaim responsibility for any injury to people or property resulting from any ideas, methods, instructions or products referred to in the content.