Article

Heavy Metal Contamination in Surface Water of Harike Wetland, India: Source and Health Risk Assessment

1
Department of Zoology, School of Bioengineering and Biosciences, Lovely Professional University, Phagwara 144411, Punjab, India
2
Department of Marine Biology, Faculty of Marine Sciences, King Abdul-Aziz University, Jeddah 21589, Saudi Arabia
*
Author to whom correspondence should be addressed.
Water 2023, 15(18), 3287; https://doi.org/10.3390/w15183287
Submission received: 4 August 2023 / Revised: 8 September 2023 / Accepted: 15 September 2023 / Published: 18 September 2023

Abstract

:
Amidst industrialization and urbanization, wetlands face pollution challenges. We investigated the seasonal distribution of five heavy metals (As, Cd, Cr, Pb, and Zn) in the surface water of Harike wetland. The surface water samples were collected from four different stations selected along Harike wetland. Our results indicate As, Cr, and Zn levels were within WHO standards, however, Cd in winter (7.07 µg/L), monsoon (4.45 µg/L), and post-monsoon seasons (3.13 µg/L) exceeded the limits. Pb surpassed the standards in winter (278 µg/L) and monsoon seasons (14.5 µg/L). In winter, Pb and Cd had higher levels, and the pollution level was classified as moderate. Cd, however, was categorized under light pollution status during the monsoon and post-monsoon seasons. The health risk assessment indicated that the hazard quotient (HQ) and hazard index (HI) values for both ingestion and dermal pathways were within the safety limits (HQ < 1 and HI < 1) for both population groups (adults and children). The multivariate statistical analysis reported the correlation and further indicated different sources of heavy metals from nearby industries, agriculture, and mining. This research highlights the importance of continued monitoring and emphasizes the potential for positive environmental changes, as exemplified by the influence of the COVID-19 pandemic. These findings hold global relevance and offer valuable input for the development of precise action plans aimed at elevating water quality standards on an international scale.

1. Introduction

Wetlands are biologically beneficial habitats that act as a transition zone between land and water. The diverse ecosystem of wetlands contributes enormously to biotic and abiotic factors. The ecological services provided by the wetlands include flood control, groundwater replenishment, biodiversity maintenance, water purification, water conservation, etc. [1]. Wetlands are classified into natural and manmade categories, where manmade wetlands are concerned with the same processes but under managed conditions. These extremely rich habitats are conserved under some initiatives. The Ramsar convention is one of the international treaties for conserving wetlands which was signed in 1971. The convention was signed in Ramsar, Iran, to overcome the loss and degradation of wetlands globally [2]. India signed the convention in 1982 with 75 Ramsar sites to date (India, Convention on Wetlands). The wetland ecosystem in India covers a total area of 4,050,536 ha, and out of this area, 23,000 ha is surrounded by the natural and manmade wetlands in Punjab [3]. Harike wetland is the largest one in Northern India, covering an area of 4100 ha [4]. The wetland came into existence during barrage construction in 1952 [5]. It is considered a rich wetland supporting various flora and fauna. Despite the tremendous environmental functions, Harike wetland faces threats due to industrial and sewage discharges. The wetland is situated at the confluence point of two rivers, Beas and Sutlej; the polluted water brought in by these rivers eventually degrades the wetland. Further, the industrial effluents from the adjoining city of Ludhiana drain into Sutlej River through Buddha Nullah [6]. The polluted water of Sutlej River finally reaches Harike wetland, from where its impact spreads to southern Punjab and Rajasthan.
Over the recent decades, the surge in industrialization and urban development has led to a substantial increase in pollution within river systems. Among the array of pollutants, heavy metals stand out as a matter of significant apprehension due to their recognized potential for toxicity, tendency to accumulate in living organisms, and enduring presence over extended periods of time [7,8,9]. Metal pollution originates from various sources, including industrial waste, metal extraction, mining, and electronic waste [10,11]. Heavy metals and metalloids commonly prevail in the environment and have been reported in different species of fish and freshwater systems worldwide [12,13]. Other metals can adsorb on aquatic debris, including plastic particles resulting in secondary exposure [14,15]. Atomic absorption spectrometer (AAS) analysis from earlier research studies determined the critical level of heavy metal concentrations in Harike wetland [16,17]. The study evaluated sediment quality in Kol wetlands, Kerala, India, identifying elevated trace metal concentrations and potential ecological risks, especially from Cd, while observing exceeded limits for Cd, Zn, and Cu in water, impacting habitats and organisms [18]. Another study examined groundwater quality near Ropar wetland, Punjab, India, revealing elevated Cd and Cr levels, substantial non-cancerous health risks, and potential cancer risk from Cr, emphasizing the need for mitigation due to significant heavy metal contamination [19]. These reports have suggested continuous wetland monitoring so that specific measures are adapted to conserve the wetland. Heavy metals can be categorized into two groups: micro-essential, which are required in limited quantities for human metabolism, and non-essential, with no known biological role. Micro-essential metals can result in toxicity both at higher concentrations and deficiencies [20]. Therefore, the present study deals with the concentration of biologically micro-essential and non-essential heavy metals in the surface water of Harike wetland. The analysis has been performed using Inductively Coupled Plasma Mass Spectrometry (ICP-MS), a more precise technique [21]. In the present work, the micro-essential elements chromium (Cr) and zinc (Zn), and the toxic elements arsenic (As), cadmium (Cd), and lead (Pb) have been considered for seasonal analysis of heavy metals. Among the metals analyzed in the present study, the International Agency for Research on Cancer has classified As, Cd, and Cr as group 1 carcinogens [22,23,24]. The focus of this study was to gather baseline information regarding heavy metal concentrations in an internationally recognized wetland. Heavy metals were analyzed through the Nemerow comprehensive pollution index and health risks using the US-EPA (US Environmental Protection Agency) model. Subsequently, this study attempted to evaluate the ecological and health hazards considering two population groups associated with this region by adopting the USEPA standards.

2. Materials and Methods

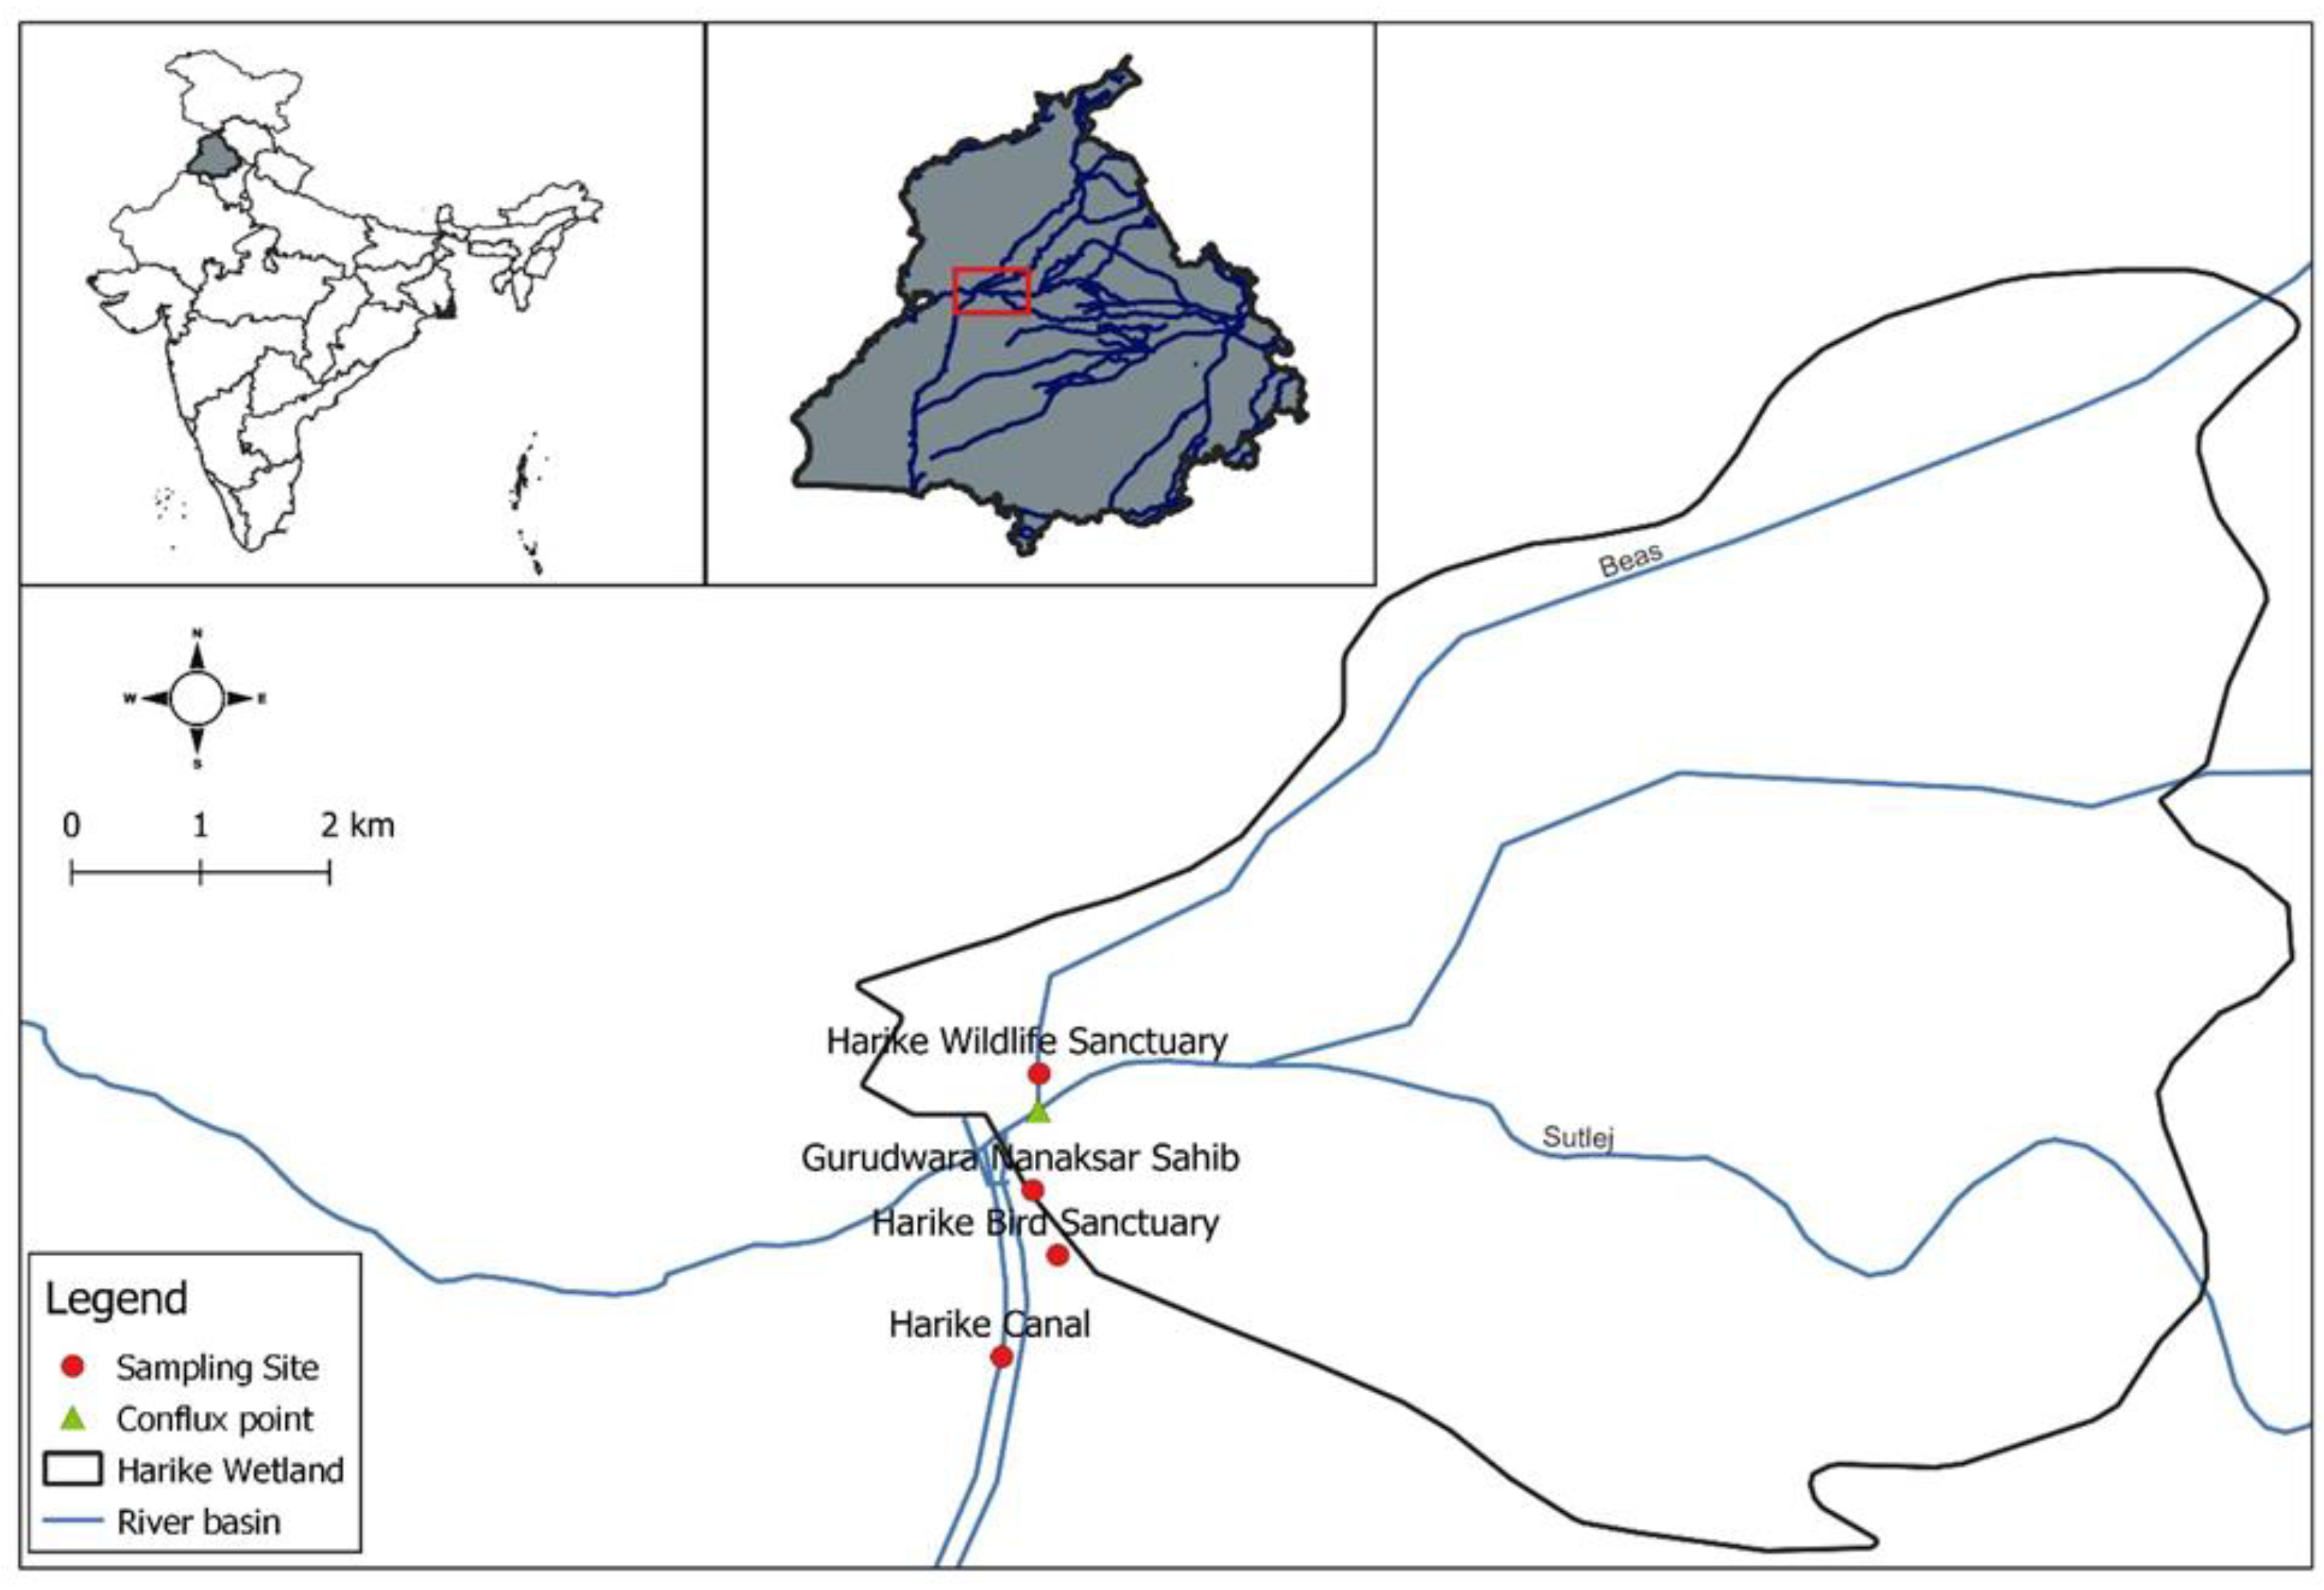
2.1. Site Description

Harike is a manmade wetland included in the Ramsar list of international significance. The wetland covers an area of 4100 ha and extends over the three districts of Kapurthala, Tarn-Taran, and Ferozepur in Punjab. It is located at a latitude of 31.17° N and a longitude of 75.2° E. The wetland came into existence during barrage construction in 1952 [25]. It is situated at the conflux of two rivers of the Indus River system, i.e., Beas and Sutlej. The wetland was constructed to store and provide water for drinking and irrigation to parts of Punjab and Rajasthan. The northern Himalayas influence the climatic conditions of the area. It experiences an annual precipitation of 668 mm during the monsoon season extending from the first week of July to September. The wetland records the highest heat during April, May, and June. The wetland experiences the highest temperature of 43 °C in June. In January, the winter season records a minimum temperature of 0.6 °C [26].

2.2. Sampling

Surface water samples were systematically collected from four chosen stations across the Harike wetland, spanning winter (January 2021), summer (May 2021), monsoon (August 2021), and post-monsoon (October 2021) seasons, in accordance with the guidelines prescribed by the Meteorological Department of India, Centre Chandigarh. These designated sampling stations encompass Station I (Harike Canal), Station II (Harike Gurudwara Nanaksar Sahib), Station III (Harike Bird Sanctuary), and Station IV (Harike Wildlife Sanctuary), as visually illustrated in Figure 1. Employing a rigorous methodology, each station was subjected to the extraction of three replicates, maintaining a consistent and uniform sampling depth of 25 cm to ensure data accuracy. To avert the risk of metal precipitation and maintain sample integrity, a filtration process involving 0.45 µm membrane filters was executed, followed by judicious acidification using nitric acid (HNO3). This comprehensive approach to sample collection ensures the reliability and precision of the obtained data for subsequent analysis and interpretation.

2.3. Chemical Analysis

A detailed chemical analysis was conducted to assess the heavy metal concentrations in the collected surface water samples from Harike wetland. The concentrations of the five selected heavy metals (As, Cd, Cr, Pb, and Zn) were determined using the advanced technique of Inductively Coupled Plasma Mass Spectrometry (ICP-MS), known for its accuracy and sensitivity [21]. This method allows for precise quantification of the heavy metal content in the samples, enhancing the reliability of the results.

2.4. Statistical Analysis

In the present study, the descriptive statistics analysis method has been used for calculating the average, standard deviation (SD), coefficient of variation (CV), skewness, and kurtosis of all the values obtained using SPSS 25.0 software [27]. Further, Pearson’s correlation analysis was used to evaluate the associations among the metals. The comprehensive pollution index and multivariate statistical evaluation, including correlational and principal component analyses, were used to estimate pollution status and source. The PCA (Principal Component Analysis) biplots, box plot, and Pearson’s correlation matrix were generated using R software [28].

2.4.1. Single-Factor Pollution Index

The single pollution indices of each heavy metal in each sample were calculated using the single-factor pollution index. These values are directly proportional to major pollutants and excessive multiples [29,30]. The formula is shown below:
p i = C i S i
where pi is the single pollution index of the metal I, Ci is the value of heavy metal I obtained from the samples, and Si is the standard value of I based on the Bureau of Indian Standards (BIS).

2.4.2. Nemerow Comprehensive Pollution Index

The impact of heavy metal contaminants was illustrated by applying the Nemerow comprehensive pollution index to account for the mean and maximum values of the single-factor pollution index [30]. Heavy metals may affect the same station differently; this method may provide a reasonable interpretation of heavy metal pollution at each station. The model used for calculating the comprehensive pollution index is as follows (2):
P i = P a 2 + P i max 2 2
where Pi is the comprehensive pollution index of each sampling station, Pimax is the maximum value of the single pollution index for the heavy metal in sampling station i, and Pa is the average single-factor index value, which can be calculated using Equation (3):
P a = 1 n i = 1 n P i
Using the comprehensive pollution index (Pi), the classification grades obtained are Grade 1 (Pi ≤ 0.7, clean), Grade 2 (0.7 < Pi ≤ 1, warning line), Grade 3 (1 < Pi ≤ 2, light pollution), Grade 4 (2 < Pi ≤ 3, moderate pollution), and Grade 5 (Pi > 3.0, heavily polluted) [30].

2.4.3. Health Risk Assessment

The risk of exposure and the propensity of hazardous elements to accumulate in the human body were assessed for the studied element concentrations. The two major pathways through which human beings are exposed to heavy metals are drinking water (ingestion) and skin contact (dermal exposure). Therefore, the selected metals were examined in comparison to reference doses and chronic daily intake (CDIingestion and CDIdermal) for adults and children based on USEPA standard values. CDIingestion and CDIdermal were evaluated for both groups using Equations (4) and (5) [31,32,33,34].
C D I i n g e s t i o n = E C × I n g R × E F × E D B W × A T
C D I d e r m a l = E C × S A × A F × A B S d × E T × E F × E D × C F B W × A T
where EC is the heavy metal concentration at the sampling station (mg/L), IngR is the ingestion rate (L/day) (adult: 2.5 and child: 0.78; USEPA 1989), EF is the exposure frequency (days/year) (365; USEPA 1989), ED is the exposure duration (in years) (adult: 70 and child: 6; USEPA 2002), BW is the body weight (kg) (adult: 70 and child: 15; USEPA 1991), AT is the average time (adult: 25,550 days and child: 2190 days) (ED × 365; USEPA 1989), SA is the skin area exposed (cm2) (5700; USEPA 2011), AF is the adherence factor (mg cm2) (0.07; USEPA 2011), ABSd is the dermal absorption fraction (0.03; USEPA, 2011), ET is the exposure time (h/day) (0.6; [35]), and CF is the conversion factor (kg/mg) (10−6; USEPA, 2002).
Moreover, the level of hazard to human health or non-carcinogenic risk (CR) due to metal exposure was evaluated using the hazard quotient (HQ) and hazard index (HI) calculated using Equations (6)–(8) as recommended by USEPA 2010.
H Q i n g e s t i o n = C D I i n g e s t i o n R f D i n g e s t i o n
H Q d e r m a l = C D I d e r m a l R f D d e r m a l
H I = H Q i
where ‘i’ reflects the HQ of each heavy metal and RfD ingestion implies the oral reference doses and RfD dermal are the reference doses dermal exposures, expressed in µg/kg/day, according to the USEPA. USEPA standards (USEPA, 2006, 2010) were used to calculate risk-based concentrations for all metals.

3. Results

3.1. Descriptive Statistical Analysis

From the present study, the average concentrations of all the heavy metals from the selected sampling stations at Harike wetland during different seasons have been shown in Table 1. Among the triplicate water samples, the average heavy metal values for As, Cd, Cr, Pb, and Zn were compared to the standard water quality values from the Bureau of Indian Standards (BIS) and the World Health Organization (WHO) The values exceeding these limits have been highlighted in Table 1.
In our study, the Zn concentration varied significantly (p < 0.05, ANOVA) during all four seasons studied (Table 1). The lowest average value of Zn was found during the winter season at Station III, whereas at the other three stations, its concentration was comparatively higher, resulting in a higher variability of Zn throughout the year (Figure 2). However, the concentration was found within the permissible limit of surface water according to WHO and BIS. On the other hand, the Pb concentration surpassed the standard admissible limits of surface water according to WHO and BIS throughout the year. Its concentration was significantly higher during the winter season, followed by the monsoon season (Figure 2).
The descriptive statistical analysis of the average values obtained from different sampling stations during four seasons are mentioned in Table 2. Further, these values were compared to the heavy metal standards, as shown in Table 3. The maximum (average) heavy metal values during winter for was 5.88 (4.37) for As, 11.05 (7.07) for Cd, 13.18 (8.58) for Cr, 374.98 (278.50) for Pb, and 484.50 (270.22) µg/L for Zn. In summer, the maximum (average) values were 20.63 (6.07) for As, 3.94 (1.80) for Cd, 9.45 (5.29) for Cr, 10.22 (5.85) for Pb, and 343.19 (220.27) µg/L for Zn. In the monsoon season, the maximum (average) values were 4.05 (2.45) for As, 7.22 (4.45) for Cd, 9.41 (4.07) for Cr, 19.57 (14.58) for Pb, and 208.87 (191.500) µg/L for Zn. In post-monsoon, the maximum (average) values were 2.80 (1.31) for As, 7.74 (4.66) for Cd, 9.45 (5.29) for Cr, 23.20 (9.47) for Pb, and 247.49 (200.49) µg/L for Zn.
The coefficients of variation evaluated from different sampling stations during the four seasons for selected heavy metals were as follows: winter—As (1.246), Cd (7.398), Cr (11.809), Pb (4038.415), and Zn (16,715.699); summer—As (71.996), Cd (1.52), Cr (8.778), Pb (6.719), and Zn (4643.651); monsoon season—As (0.818), Cd (6.658), Cr (9.458), Pb (30.198), and Zn (166.717); and post-monsoon season—As (0.94), Cd (4.084), Cr (4.83), Pb (60.425), and Zn (579.427). For these, the Cr, Cd, Pb, and Zn coefficients of variation all exceeded 100%, illustrating a significant degree of variability, which indicates the extreme variability in the contents of these four heavy metals [36]. The coefficients of variation for As predicted high variability in the winter and summer seasons, but moderate variability was observed in the monsoon and post-monsoon seasons, indicating relatively significant differences between the various samples. Other statistical parameters like skewness and kurtosis values for each metal in all the seasons have been presented in Table 2.
When compared to the drinking water quality standards of WHO, the average concentrations of As, Cr, and Zn were within the acceptable range. However, the concentration of cadmium in winter (7.07 µg/L), monsoon (4.45 µg/L), and post-monsoon seasons (3.13 µg/L) exceeded the limits prescribed by WHO. Further, another heavy metal, Pb, exceeded the limits in winter (278 µg/L) and monsoon seasons (14.5 µg/L). Compared to the water quality standards from the Bureau of Indian Standards, the average concentrations of As, Cr, and Zn were within the acceptable range. However, the concentration of cadmium in winter (7.07 µg/L), monsoon (4.45 µg/L), and post-monsoon seasons (3.13 µg/L) exceeded the BIS limits. Further, the concentration of Pb also exceeded the BIS limits in the winter season (278 µg/L). Furthermore, wetlands support an immense variety of flora and fauna. Therefore, the average values were also compared with standards of freshwater quality criteria for the protection of aquatic life as recommended by the United States Environmental Protection Agency (US-EPA). It was found that the heavy metals As, Cr, and Zn fell within the acceptable ranges. However, Cd exceeded the limits in winter (7.07 µg/L), monsoon (4.45 µg/L), and post-monsoon seasons (3.13 µg/L); Pb exceeded the limits in winter (278 µg/L) and monsoon seasons (14.5 µg/L); and Zn exceeded them in winter (270 µg/L), summer (220 µg/L), monsoon (191 µg/L), and post-monsoon seasons (200 µg/L). This wetland provides water for drinking and irrigation purposes to parts of Punjab and Rajasthan. Therefore, the heavy metal values of the analyzed water samples were compared to the concentrations of trace elements in irrigation water recommended by the Food and Agricultural Organization (FAO) of the United States. The values for As, Cd, Cr, Pb, and Zn in all the tested water samples fell within the acceptable ranges.

3.2. Multivariate Statistical Analysis

3.2.1. Correlation Analysis

Multivariate statistical methods, such as Pearson’s correlation analyses, were performed at a 95% significance level to point out the sources of heavy metals in Harike wetland. The Pearson’s correlation analysis results indicated that Pb-Cr, Pb-Cd, Pb-Zn, and Cr-Zn were positively correlated, with corresponding correlation coefficients of r0.05 = 0.58, r0.05 = 0.49, r0.05 = 0.55, and r0.05 = 0.72, respectively (Figure 3). Notably, the correlation coefficients of Cr-As, Cr-Cd, As-Cd, As-Zn, and Cd-Zn were r0.05 = −0.21, r0.05 = 0.23, r0.05 = −0.06, r0.05 = −0.19, and r0.05 = −0.09, respectively, which indicate that they are negatively correlated. This implies that Pb is moderately associated with Cr, Cd, and Zn, whereas the highest correlation was found between Cr and Zn, indicating that these metals might be from the same source.

3.2.2. Principal Component Analysis

Principal component analysis (PCA) was conducted to assess the variability of heavy metals throughout year with time intervals reflecting different seasons. The PCA results revealed that along Dim 1, consisting primarily of the summer samples distinctly separated from the other seasons, contributed to 46.7% of the total variance. Consequently, heavy metals “Pb” and “Cr” emerged as the most significant factors in distinguishing the summer season from the other seasons. It is important to note that the separation along Dim 1 was primarily driven by these two heavy metals. In addition, it was observed that the majority of samples from the post-monsoon and summer seasons, characterized by lower concentrations of “Cd” and “As”, exhibited negative values along Dim 2. This negative dimension indicates a contrast with other seasons in terms of these particular heavy metals.
The variability in heavy metal concentrations with respect to seasons is visually represented in Figure 4, where the biplot shows distinctive patterns for the different seasons. Specifically, the summer season exhibited the highest variability compared to winter, leading to a clear separation along Dim 1. Conversely, the post-monsoon and monsoon seasons displayed more similarity in terms of heavy metal concentrations. Furthermore, the loadings plot analysis indicated that “Cd” made the most substantial contribution to distinguishing the four seasons from each other. These findings provide valuable insights into the seasonal dynamics of heavy metal concentrations in the studied area.

3.2.3. Heavy Metal Pollution Indices

Equations (1)–(3) were used to evaluate the single-factor pollution and the Nemerow comprehensive pollution indices. We selected the water quality standards from the Bureau of Indian Standards as our background values. The average single pollution index and Nemerow comprehensive pollution index values generated during the winter, summer, monsoon, and post-monsoon seasons have been mentioned in Table 4. Among these, As, Cr, and Zn were classified within the clean level during all the seasons. On the other hand, Pb was found in higher concentrations and categorized as having a moderate pollution status in samples taken during the winter, whereas during the rest of all three seasons, Pb was classified within the clean level. In the case of Cd, the summer samples were classified within the clean level. However, the values were high during the winter and were categorized under moderate pollution. Further, the values for Cd in monsoon and post-monsoon seasons were classified as a light pollution status.

3.2.4. Health Risk Assessment

The CDI, HQ, and HI were used to assess the health hazard for adults and children. The CDI revealed the daily exposure of humans to heavy metals. The HQ value, furthermore, acknowledges the possible risk to human health from exposure to heavy metals, with values exceeding one (>1) being hazardous to human health. Likewise, HI evaluated the threats posed by the tested heavy metals. Table 5 summarizes the CDI ingestion, CDI dermal, HQ ingestion, and HQ dermal values for both adults and children. The HQ values for both the ingestion and dermal pathways were within limits (HQ < 1) during all seasons. The HI of metals assessed for ingestion and skin absorption indicated that all stations were below the risk limit (HI < 1) for both population groups. However, children may be more affected than adults (Figure 5). Furthermore, from the values obtained, it is evident that the ingestion route is more influential than skin exposure and is therefore considered the primary pathway for element exposure. Previous studies have also observed a similar trend [33].

4. Discussion

In the present study, by comparing with past research on the Harike wetland [16,17], a considerable reduction has been noticed in the concentrations of Cr, Cd, Pb, and Zn (Table 6). As levels were not reported in any of the previously collected water samples. The sampling station is situated at the confluence point of two rivers, Sutlej and Beas, among which Sutlej River is critically contaminated with heavy metals. The primary source of heavy metal pollution in the region can be predominantly attributed to the presence of 2423 industrial facilities situated within the catchment area of the Sutlej River, as indicated by a study conducted by the Directorate of Climate Change, Government of Punjab, in 2019. These industrial establishments release their effluents either directly into the Sutlej River or indirectly through adjacent waterways. Notably, a significant proportion of these effluents is linked to electroplating and surface treatment processes, accounting for approximately 79% of the pollution load, followed by the dyeing sector, which contributes around 10% [37]. Approximately 84% of these industries are located in Ludhiana city, which discharges its effluents into Buddha Nallah, a drain that merges with Sutlej River [28]. It is worth noting that Ludhiana city’s municipal sewage treatment plants (STPs) also play a pivotal role in the pollution dynamics, as they release untreated sewage waste directly into Buddha Nallah, thus representing a significant component of its overall pollution burden [38]. Additionally, the Sutlej River receives contributions from another tributary, East Bein, which serves as a conduit for transporting industrial and sewage discharges from the towns of Jalandhar and Kapurthala in Punjab, situated near the Harike headworks. The drainage infrastructure in Jalandhar, represented by the Jamsher Drain and Kala Sanghian Drain, was originally designed for rainwater drainage into the Sutlej River. However, in practice, these conduits have become channels for conveying substantial volumes of hazardous pollutants into the Sutlej River [39]. Furthermore, the untreated discharge from Jalandhar’s leather goods industry also stands as a prominent contributor to the pollution of rivulet Chitti Bein, thereby affecting the overall contamination of the Sutlej River [40]. It is important to mention that the land use and cover in the study area are predominantly shaped by agricultural activities, encompassing water bodies, forested regions, uncultivable land, mining zones, and both rural and urban areas, as illustrated in Figure 6 [28].
Throughout changing seasons, biophysical variables and social drivers dominate the release of heavy metal contaminants into surface water [41]. Urban and industrial waste, agronomic sources of pollutants (such as nutrient and pesticide loads brought on by fertilizer and pesticide accumulation), and water treatment infrastructure are examples of the biophysical factors, which are primarily represented by a material or energy flux (both natural and built infrastructure) [28]. These biophysical factors alter the contaminant levels at different spatial and temporal scales and vary with the seasons. Agronomic practices (cropping systems, water handling, and fertilizer, pesticide, or herbicide selection), industrial practices (particularly waste management), urban forethought arrangements, and social norms such as hygiene and debris removal are among the social drivers [41]. The complex and dynamic interplay between these biophysical and societal factors not only shapes the temporal and spatial distribution of heavy metal pollutants but also underscores the need for a comprehensive understanding of the intricate relationships within the broader ecosystem. Such insights are essential for the development of effective strategies and policies aimed at mitigating heavy metal contamination in surface water systems, thereby safeguarding both environmental and human health.
Compared to earlier analyses, the level of heavy metal contamination in the Harike wetland is relatively low in this study (Table 6). Compared to earlier studies, the recent analysis of heavy metal concentrations in Harike wetland’s surface waters shows a promising trend towards improved water quality. Arsenic and cadmium consistently adhered to acceptable limits, signifying successful contamination management strategies. Notably, chromium concentrations have decreased since previous studies, although the occasional exceedances of limits warrant continued attention. The significant reduction in lead and zinc levels underscores effective pollution control efforts; however, their occasional variance emphasizes the need for consistent monitoring. These findings collectively highlight positive strides in wetland conservation, but the dynamic nature of metal concentrations necessitates sustained dedication to long-term environmental health. Possibly, the lockdown had a visible impact on the heavy metal content in the wetland by shutting down various agricultural, industrial, and commercial activities. The coronavirus disease (COVID-19) pandemic emerged as a significant threat to all countries worldwide [42]. Many problems were affecting human growth and survival at the time, including climate change, the depletion of natural resources, a shortage of clean water, and many others. Researchers from various disciplines worked together to conduct additional research after reports about the positive effects of lockdown on water quality attracted attention. Dutta et al. revealed improved water quality in the Ganga at Haridwar throughout the lockdown [43,44]. However, according to some reports, the water quality of rivers (Ganga, Chambal, and Svarnarekha) has deteriorated during the pandemic [44,45]. Khan et al. also reported on the Gomti River’s reduced water quality at various locations throughout Lucknow during the lockdown period [35]. However, none of the earlier studies evaluated the level of heavy metal contamination to assess the implications of the COVID-19 lockdown. Therefore, the current study also demonstrates the beneficial effects of the COVID-19 clampdown on the heavy metal contamination of the Harike wetland, in addition to pollution status and health risks. A significant decrease in the concentration of heavy metals provides undeniable proof of the impact of closing industrial and commercial facilities. Furthermore, water chemistry can influence heavy metal solubility and mobility. Factors like pH and temperature variations in winter can alter the chemical speciation of heavy metals, potentially leading to increased concentrations. Therefore, we are proceeding with further research taking such factors into consideration. Further, during winter, the increased water flow causes more runoff and erosion. This can eventually transport pollutants, including heavy metals, from surrounding areas into the wetland, leading to elevated concentrations.

5. Conclusions

Heavy metal analyses of wetlands is mandatory to investigate the possibility of adverse effects of pollution on productive habitats. The present study analyzed the surface water of Harike wetland to determine the concentrations of heavy metals. According to this research, the Harike wetland’s heavy metal levels were low in all four seasons in 2021. Utilizing CDI, HQ, and HI, it was determined that the associated health risks were also low (HI). The pollution index assessment revealed that As, Cr, and Zn were all within the normal limits during all seasons. However, Pb was moderately polluting during the winter (278.5025 µg/L), while in the other three seasons, its levels were classified as clean. The summer Cd samples were classified as clean; however, the values were high during the winter season (7.07 µg/L) and were classified as moderately polluted.
Furthermore, the Cd values in monsoon (4.457 µg/L), and post-monsoon (3.137 µg/L) seasons were classified as a light pollution status. The heavy metals at higher concentrations, Pb and Cd, in the winter season may deteriorate the water quality, which may, in turn, cause a threat to the biodiversity of the wetland. Future studies should examine variations in pollutant content and the forms of heavy metals. The Harike wetland’s current pollution level, chemical forms, and dispersion and modification of heavy metals should be analyzed using different technical approaches. Further, the relevant authorities must design economical, environmentally safe, and time-saving ways for the continuous monitoring of heavy metals and other pollutants.

Author Contributions

N.N., research, writing original draft, framework, result interpretation, and editing. M.T.J., validation, and review. R.S., project administration, editing, supervision, and review. All authors have read and agreed to the published version of the manuscript.

Funding

This research received no external funding.

Data Availability Statement

The relevant data have been included in the article.

Acknowledgments

The authors would like to express special thanks and gratitude to the Department of Forest and Wildlife Preservation, Chandigarh, India.

Conflicts of Interest

The authors declare no conflict of interest.

References

  1. Arya, S.; Syriac, E.K. Wetlands: The living waters-A review. Agric. Rev. 2018, 39, 122–129. [Google Scholar] [CrossRef]
  2. Home Page|The Convention on Wetlands. Available online: https://www.ramsar.org/ (accessed on 21 August 2023).
  3. Jain, S.K.; Sarkar, A.; Garg, V. Impact of Declining Trend of Flow on Harike Wetland, India. Water Resour. Manag. 2007, 22, 409–421. [Google Scholar] [CrossRef]
  4. Jangu, S.; Kumar, D.; Brraich, O.S.; Baek, K.-H.; Mishra, A.K. Alterations in ultra-structures and elemental composition of ovaries of Labeo rohita (Hamilton-Buchanan) as a pollution indicator in Harike Wetland (Ramsar Site), India. J. Histotechnol. 2020, 44, 62–69. [Google Scholar] [CrossRef]
  5. Kaur, A.; Datta, S.N.; Tewari, G. Study on biometrics and biology of Rohu, Labeo rohita from Harike wetland-Ramsar site. J. Entomol. Zool. Stud. 2018, 6, 496–500. [Google Scholar]
  6. Kaur, J.; Kaur, V.; Pakade, Y.B.; Katnoria, J.K. A study on water quality monitoring of Buddha Nullah, Ludhiana, Punjab (India). Environ. Geochem. Health 2021, 43, 2699–2722. [Google Scholar] [CrossRef] [PubMed]
  7. Duncan, A.E.; de Vries, N.; Nyarko, K.B. Assessment of heavy metal pollution in the sediments of the River Pra and its tributaries. Water Air Soil Pollut. 2018, 229, 272. [Google Scholar] [CrossRef] [PubMed]
  8. Strzebońska, M.; Jarosz-Krzemińska, E.; Adamiec, E. Assessing historical mining and smelting effects on heavy metal pollution of river systems over span of two decades. Water Air Soil Pollut. 2017, 228, 141. [Google Scholar] [CrossRef]
  9. Singh, V.; Singh, N.; Rai, S.N.; Kumar, A.; Singh, A.K.; Singh, M.P.; Sahoo, A.; Shekhar, S.; Vamanu, E.; Mishra, V. Heavy Metal Contamination in the Aquatic Ecosystem: Toxicity and Its Remediation Using Eco-Friendly Approaches. Toxics 2023, 11, 147. [Google Scholar] [CrossRef] [PubMed]
  10. Duncan, A.E.; de Vries, N.; Nyarko, K. Microplastics in the surface sediments from the Beijiang River littoral zone: Composition, abundance, surface textures and interaction with heavy metals. Chemosphere 2017, 171, 248–258. [Google Scholar]
  11. Kang, M.; Tian, Y.; Zhang, H.; Lan, Q. Distribution, ecological risk assessment, and source identification of heavy metals in river sediments from Hai River and its tributaries, Tianjin, China. Water Air Soil Pollut. 2020, 231, 38. [Google Scholar] [CrossRef]
  12. Ali, H.; Khan, E. Bioaccumulation of non-essential hazardous heavy metals and metalloids in freshwater fish. Risk to human health. Environ. Chem. Lett. 2018, 16, 903–917. [Google Scholar] [CrossRef]
  13. Dukes, A.D.; Eklund, R.T.; Morgan, Z.D.; Layland, R.C. Heavy metal concentration in the water and sediment of the lake greenwood Watershed. Water Air Soil Pollut. 2020, 231, 11. [Google Scholar] [CrossRef]
  14. Wen, B.; Jin, S.-R.; Chen, Z.-Z.; Gao, J.-Z.; Liu, Y.-N.; Liu, J.-H.; Feng, X.-S. Single and combined effects of microplastics and cadmium on the cadmium accumulation, antioxidant defence and innate immunity of the discus fish (Symphysodon aequifasciatus). Environ. Pollut. 2018, 243, 462–471. [Google Scholar] [CrossRef]
  15. Naqash, N.; Prakash, S.; Kapoor, D.; Singh, R. Interaction of freshwater microplastics with biota and heavy metals: A review. Environ. Chem. Lett. 2020, 18, 1813–1824. [Google Scholar] [CrossRef]
  16. Brraich, O.S.; Jangu, S. Evaluation of water quality pollution indices for heavy metal contamination monitoring in the water of Harike Wetland (Ramsar Site), India. Int. J. Sci. Res. Publ. 2015, 5, 1–6. [Google Scholar]
  17. Kaur, J.; Walia, H.; Mabwoga, S.O.; Arora, S. Water quality monitoring of an international wetland at Harike, Punjab and its impact on biological systems. Appl. Water Sci. 2017, 7, 1107–1115. [Google Scholar] [CrossRef]
  18. Nisari, A.; Sujatha, C. Assessment of trace metal contamination in the Kol wetland, a Ramsar site, Southwest coast of India. Reg. Stud. Mar. Sci. 2021, 47, 101953. [Google Scholar] [CrossRef]
  19. Sharma, S.; Nagpal, A.K.; Kaur, I. Appraisal of heavy metal contents in groundwater and associated health hazards posed to human population of Ropar wetland, Punjab, India and its environs. Chemosphere 2019, 227, 179–190. [Google Scholar] [CrossRef] [PubMed]
  20. Sfakianakis, D.; Renieri, E.; Kentouri, M.; Tsatsakis, A. Effect of heavy metals on fish larvae deformities: A review. Environ. Res. 2015, 137, 246–255. [Google Scholar] [CrossRef]
  21. Wang, H.; Wu, Z.; Chen, B.; He, M.; Hu, B. Chip-based array magnetic solid phase microextraction on-line coupled with inductively coupled plasma mass spectrometry for the determination of trace heavy metals in cells. Anal. 2015, 140, 5619–5626. [Google Scholar] [CrossRef]
  22. Known and Probable Human Carcinogens. Available online: https://www.cancer.org/cancer/risk-prevention/understanding-cancer-risk/known-and-probable-human-carcinogens.html (accessed on 21 August 2023).
  23. Singh, V.; Singh, N.; Verma, M.; Kamal, R.; Tiwari, R.; Chivate, M.S.; Rai, S.N.; Kumar, A.; Singh, A.; Singh, M.P.; et al. Hexavalent-Chromium-Induced Oxidative Stress and the Protective Role of Antioxidants against Cellular Toxicity. Antioxidants 2022, 11, 2375. [Google Scholar] [CrossRef] [PubMed]
  24. Singh, V.; Singh, J.; Mishra, V. Sorption kinetics of an eco-friendly and sustainable Cr (VI) ion scavenger in a batch reactor. J. Environ. Chem. Eng. 2021, 9, 105125. [Google Scholar] [CrossRef]
  25. Kumar, G.; Singh, K.K. Mapping and monitoring the selected wetlands of Punjab, India, using geospatial techniques. J. Indian Soc. Remote Sens. 2020, 48, 615–625. [Google Scholar] [CrossRef]
  26. Chopra, R.; Verma, V.K.; Sharma, P.K. Mapping, monitoring and conservation of Harike wetland ecosystem, Punjab, India, through remote sensing. Int. J. Remote. Sens. 2001, 22, 89–98. [Google Scholar] [CrossRef]
  27. Ağca, N.; Karanlık, S.; Ödemiş, B. Assessment of ammonium, nitrate, phosphate, and heavy metal pollution in groundwater from Amik Plain, southern Turkey. Environ. Monit. Assess. 2014, 186, 5921–5934. [Google Scholar] [CrossRef] [PubMed]
  28. Setia, R.; Dhaliwal, S.S.; Kumar, V.; Singh, R.; Kukal, S.S.; Pateriya, B. Impact assessment of metal contamination in surface water of Sutlej River (India) on human health risks. Environ. Pollut. 2020, 265, 114907. [Google Scholar] [CrossRef]
  29. Dung, T.T.T.; Cappuyns, V.; Swennen, R.; Phung, N.K. From geochemical background determination to pollution assessment of heavy metals in sediments and soils. Rev. Environ. Sci. Biotechnol. 2013, 12, 335–353. [Google Scholar] [CrossRef]
  30. Zhaoyong, Z.; Xiaodong, Y.; Shengtian, Y. Heavy metal pollution assessment, source identification, and health risk evaluation in Aibi Lake of northwest China. Environ. Monit. Assess. 2018, 190, 69. [Google Scholar] [CrossRef]
  31. Singh, U.K.; Kumar, B. Pathways of heavy metals contamination and associated human health risk in Ajay River basin, India. Chemosphere 2017, 174, 183–199. [Google Scholar] [CrossRef]
  32. Giri, S.; Singh, A.K. Human health risk assessment via drinking water pathway due to metal contamination in the groundwater of Subarnarekha River Basin, India. Environ. Monit. Assess. 2015, 187, 63. [Google Scholar] [CrossRef]
  33. Mitra, S.; Sarkar, S.K.; Raja, P.; Biswas, J.K.; Murugan, K. Dissolved trace elements in Hooghly (Ganges) River Estuary, India: Risk assessment and implications for management. Mar. Pollut. Bull. 2018, 133, 402–414. [Google Scholar] [CrossRef]
  34. Prasad, S.; Saluja, R.; Joshi, V.; Garg, J.K. Heavy metal pollution in surface water of the Upper Ganga River, India: Human health risk assessment. Environ. Monit. Assess. 2020, 192, 742. [Google Scholar] [CrossRef] [PubMed]
  35. Wu, B.; Zhao, D.Y.; Jia, H.Y.; Zhang, Y.; Zhang, X.X.; Cheng, S.P. Preliminary Risk Assessment of Trace Metal Pollution in Surface Water from Yangtze River in Nanjing Section, China. Bull. Environ. Contam. Toxicol. 2009, 82, 405–409. [Google Scholar] [CrossRef] [PubMed]
  36. Abuduwaili, J.; Zhang, Z.Y.; Jiang, F.Q. Assessment of the Distribution, Sources and Potential Ecological Risk of Heavy Metals in the Dry Surface Sediment of Aibi Lake in Northwest China. PLoS ONE 2015, 10, e0120001. [Google Scholar] [CrossRef] [PubMed]
  37. Kumar, V.; Sharma, A.; Kumar, R.; Bhardwaj, R.; Kumar Thukral, A.; Rodrigo-Comino, J. Assessment of heavy-metal pollution in three different Indian water bodies by combination of multivariate analysis and water pollution indices. Hum. Ecol. Risk Assess. Int. J. 2018, 26, 1–16. [Google Scholar] [CrossRef]
  38. Minhas, P.S.; Saha, J.K.; Dotaniya, M.; Sarkar, A.; Saha, M. Wastewater irrigation in India: Current status, impacts and response options. Sci. Total Environ. 2022, 808, 152001. [Google Scholar] [CrossRef]
  39. Verma, V.K.; Sur, K.; Prakash, C. Ecotope-Based Diversity Monitoring of Wetland Using Infused Machine Learning Technique. Water Conserv. Sci. Eng. 2023, 8, 38. [Google Scholar] [CrossRef]
  40. Walia, G.; Handa, D.; Kaur, H.; Kalotra, R. Erythrocyte abnormalities in a freshwater fish, Labeo rohita exposed to tan-nery industry effluent. Int. J. Pharm. Biol. Sci. 2013, 3, 287–295. [Google Scholar]
  41. Grigg, N.; Ahmad, M.-D.; Imran, S.; Podger, G.; Kirby, M.; Colloff, M. Water Quality in the Ravi and Sutlej Rivers, Pakistan: A System View; CSIRO: Canberra, Australia. [CrossRef]
  42. Ali, S.A.; Baloch, M.; Ahmed, N.; Ali, A.A.; Iqbal, A. The outbreak of Coronavirus Disease 2019 (COVID-19)—An emerging global health threat. J. Infect. Public Heal. 2020, 13, 644–646. [Google Scholar] [CrossRef]
  43. Dutta, V.; Dubey, D.; Kumar, S. Cleaning the River Ganga: Impact of lockdown on water quality and future implications on river rejuvenation strategies. Sci. Total. Environ. 2020, 743, 140756. [Google Scholar] [CrossRef]
  44. Khan, R.; Saxena, A.; Shukla, S.; Sekar, S.; Goel, P. Effect of COVID-19 lockdown on the water quality index of River Gomti, India, with potential hazard of faecal-oral transmission. Environ. Sci. Pollut. Res. 2021, 28, 33021–33029. [Google Scholar] [CrossRef] [PubMed]
  45. Gagan, M.; D.P., U.; K., C.S.; Sunil, K.; Gaurav, P.; Avinash, K.; Anjali, N.; Pawan, K. Impact of Pandemic COVID19 on Air and Water Quality in India: A Systematic Review. Int. J. Eng. Adv. Technol. 2022, 11, 149–167. [Google Scholar] [CrossRef]
Figure 1. Surface water sampling stations (Station I: Harike Canal, Station II: Harike Gurudwara Nanaksar Sahib, Station III: Harike Bird Sanctuary, and Station IV: Harike Wildlife Sanctuary) of Harike wetland, Punjab, India.
Water 15 03287 g001
Figure 2. Spatial variation of heavy metals in four studied stations throughout the year.
Water 15 03287 g002
Figure 3. Pearson correlation among different heavy metals in surface water of Harike wetland.
Water 15 03287 g003
Figure 4. Principal component analysis of heavy metals from the surface water of Harike wetland during four seasons.
Water 15 03287 g004
Figure 5. Spatial variation at different sampling stations in HI for both population groups (adults and children) through dermal and ingestion exposure.
Water 15 03287 g005
Figure 6. Harike wetland land use and cover distribution, highlighting Buddha Nallah and East Bein as primary pollution sources.
Water 15 03287 g006
Table 1. Mean concentrations of heavy metals from 4 sampling stations in different seasons in Harike wetland, India (unit: µg/L).
Heavy MetalSampling Season
WinterSummerMonsoonPost-Monsoon
Station I
As3.651.222.032.67
Cd7.843.762.426.47
Cr11.096.648.987.38
Pb286.333.7615.446.75
Zn257.54186.95197.53234.75
Station II
As5.041.211.680.71
Cd10.651.676.892.31
Cr4.763.493.473.76
Pb280.533.695.83.61
Zn221.16209.45186.83190.65
Station III
As5.7420.133.910.25
Cd6.321.066.921.9
Cr5.991.862.561.79
Pb189.366.2318.445.33
Zn132.86157.84182.72181.67
Station IV
As3.081.722.191.63
Cd3.470.731.61.87
Cr12.489.191.285.73
Pb357.799.7518.6422.19
Zn469.33326.85198.92194.91
Table 2. Descriptive statistics of heavy metals (µg/L) in surface water from Harike wetland during the winter, summer, monsoon, and post-monsoon seasons.
ParametersAsCdCrPbZn
Winter
Mean (µg/L)4.377.078.58278.5270.22
Minimum (µg/L)2.983.354.58179.89128.96
Maximum (µg/L)5.8811.0513.1374.98484.5
SD1.112.713.4363.54129.28
CV1.247.3911.84038.4116,715.69
Skewness0.060.0090.05−0.210.79
Kurtosis−1.84−1.06−2.12−0.75−0.71
Summer
Mean (µg/L)6.071.805.295.85220.27
Minimum (µg/L)1.18.71.773.51142.94
Maximum (µg/L)20.633.949.4510.22343.19
SD8.481.232.962.5968.14
CV71.991.528.776.714643.65
Skewness1.321.030.200.770.96
Kurtosis−0.31−0.62−1.64−1.03−0.52
Monsoon
Mean (µg/L)2.454.454.0714.58191.5
Minimum (µg/L)1.61.581.225.51170.72
Maximum (µg/L)4.057.229.4119.57208.87
SD0.902.583.075.4912.91
CV0.816.659.4530.19166.71
Skewness1.15−0.031.06−1.06−0.15
Kurtosis−00.38−2.33−0.51−0.62−1.14
Post−monsoon
Mean (µg/L)1.313.134.669.47200.49
Minimum (µg/L)0.241.821.713.46165.88
Maximum (µg/L)2.86.727.7423.2246.49
SD0.962.022.197.7724.07
CV0.944.084.8360.42579.42
Skewness0.401.3−0.081.240.55
Kurtosis−1.39−0.319−1.43−0.35−0.27
Table 3. Heavy metal standards for the elements analyzed in the present study.
ElementBIS (mg/L)WHO (mg/L)US-EPA (mg/L)FAO (mg/L)
Arsenic (As)0.050.010.340.10
Cadmium (Cd)0.0030.0030.0020.01
Chromium (Cr)20.050.0160.10
Lead (Pb)0.10.010.0655.0
Zinc (Zn)1530.122.0
Note(s): BIS—water quality standards from the Bureau of Indian Standards, WHO—World Health Organization recommended drinking water standard (WHO: 2011), US-EPA—United States Environmental Protection Agency recommended freshwater quality criteria for the protection of aquatic life (National Recommended Water Quality Criteria—Aquatic Life Criteria Table, US EPA), FAO—Food and Agricultural Organization of United States recommended concentration of trace elements in irrigation water (Water quality for agriculture, FAO).
Table 4. Values for the pollution indices for the five selected heavy metals from the surface water of Harike wetland.
SeasonsPollution IndexAsCdCrPbZn
Winterpi0.0872.3560.0042.7850.018
Pi0.0722.1300.0032.2670.018
Summerpi0.1210.6010.0020.0580.014
Pi0.2100.6950.0020.0560.013
Monsoonpi0.0491.4850.0020.1450.012
Pi0.0461.3710.0020.1180.009
Post-monsoonpi0.0261.0450.0020.0940.013
Pi0.0291.1980.0020.1200.010
Note(s): pi—single-factor pollution index value for a given heavy metal, Pi—comprehensive index for a given heavy metal.
Table 5. CDI (CDIingestion and CDIdermal) and HQ (HQingestion and HQdermal) for children and adults through ingestion and dermal pathway at four sampling stations during winter, summer, monsoon, and post-monsoon seasons.
Heavy MetalCDIingestionCDIdermalHQingestionHQdermal
Winter Season
AdultChildAdultChildAdultChildAdultChild
As1.56339E−072.2763E−074.49132E−122.09595E−115.21131E−077.58767E−073.65148E−101.70402E−09
Cd2.525E−073.6764E−077.25382E−123.38512E−110.0000005057.3528E−071.45076E−096.77023E−09
Cr3.06429E−074.4616E−078.80308E−124.11E−111.02143E−071.4872E−075.86872E−102.73874E−09
Pb9.94652E−061.44821E−052.85744E−101.33347E−097.10466E−061.03444E−056.80342E−103.17493E−09
Zn9.6508E−061.40516E−052.77248E−101.29383E−093.21693E−084.68386E−084.6208E−122.15638E−11
Summer Season
AdultChildAdultChildAdultChildAdultChild
As2.16786E−073.1564E−076.22782E−122.90632E−117.22619E−071.05213E−065.06327E−102.36286E−09
Cd6.44643E−089.386E−081.85193E−128.64234E−121.28929E−071.8772E−073.70386E−101.72847E−09
Cr1.89107E−072.7534E−075.43267E−122.54E−116.30357E−089.178E−083.62178E−101.69016E−09
Pb2.09196E−073.0459E−076..0098E−122.80457E−111.49426E−072.17564E−071.4309E−116.67755E−11
Zn7.86688E−061.14542E−052.26E−101.05466E−092.62229E−083.81806E−083.76666E−121.75777E−11
Monsoon Season
AdultChildAdultChildAdultChildAdultChild
As8.75893E−081.2753E−072.51627E−121.17426E−112.91964E−074.251E−072.04574E−109.5468E−10
Cd1.59196E−072.3179E−074.5734E−122.13425E−113.18393E−074.6358E−079.14679E−104.2685E−09
Cr1.45446E−072.1177E−074.17839E−121.95E−114.84821E−087.059E−082.78559E−101.29994E−09
Pb5.20714E−077.5816E−071.49591E−116.9809E−113.71939E−075.41543E−073.56169E−111.66212E−10
Zn6.83929E−060.0000099581.96479E−109.16902E−102.27976E−083.31933E−083.27465E−121.52817E−11
Post-monsoon Season
AdultChildAdultChildAdultChildAdultChild
As4.69643E−086.838E−081.34919E−126.29622E−121.56548E−072.27933E−071.0969E−105.11888E−10
Cd1.12054E−071.6315E−073.21908E−121.50224E−112.24107E−073.263E−076.43815E−103.00447E−09
Cr1.66607E−072.4258E−074.78629E−122.23E−115.55357E−088.086E−083.19086E−101.48907E−09
Pb3.38214E−074.9244E−079.71622E−124.53424E−112.41582E−073.51743E−072.31339E−111.07958E−10
Zn7.86688E−061.04257E−052.05708E−109.5997E−102.38685E−083.47525E−083.42846E−121.59995E−11
Table 6. Previous and present concentrations (mg/L) of heavy metals in surface waters of Harike wetland, India.
Heavy Metal(Brraich and Jangu 2015) [16](Kaur et al., 2017) [17](Kumar et al., 2018) [37]Present Study
WinterSummerMonsoonPost-Monsoon
As---0.00430.00600.00240.0013
Cr0.120.1210.090.00850.00520.00400.0046
Cd0.01-0.020.00700.00180.00440.0031
Pb0.530.7040.720.27850.00580.01450.0094
Zn0.692.5890.550.27020.22020.19150.2004
Disclaimer/Publisher’s Note: The statements, opinions and data contained in all publications are solely those of the individual author(s) and contributor(s) and not of MDPI and/or the editor(s). MDPI and/or the editor(s) disclaim responsibility for any injury to people or property resulting from any ideas, methods, instructions or products referred to in the content.

