Article

Impact of Hydrological Changes on Wetland Landscape Dynamics and Implications for Ecohydrological Restoration in Honghe National Nature Reserve, Northeast China

1
College of Landscape Architecture and Art, Fujian Agriculture and Forestry University, Fuzhou 350002, China
2
College of Ecology and Environment, Nanjing Forestry University, Nanjing 210037, China
3
Co-Innovation Center for Sustainable Forestry in Southern China, Nanjing Forestry University, Nanjing 210037, China
4
Nanjing Institute of Environmental Sciences, Ministry of Ecology and Environment of the People’s Republic of China, Nanjing 210042, China
5
College of Horticulture and Plant Protection, Henan University of Science and Technology, Luoyang 471023, China
*
Author to whom correspondence should be addressed.
Water 2023, 15(19), 3350; https://doi.org/10.3390/w15193350
Submission received: 14 August 2023 / Revised: 18 September 2023 / Accepted: 22 September 2023 / Published: 24 September 2023

Abstract

:
Marsh wetlands are significant ecosystems located between land and water bodies which can both protect species diversity and provide habitats. Changes in the hydrological situation of marsh wetlands as a result of climate change and human activities have led to the degradation of wetland landscapes. Taking the Honghe National Nature Reserve (HNNR) in Heilongjiang Province, China, as an example, this paper gathered information on the reserve’s wetland landscape before and after dam construction. The information was obtained using field survey data and a random forest classification method based on Landsat data powered by the Google Earth Engine (GEE) cloud platform. Then, on the basis of the water level data and the digital elevation model, the wetland landscape dynamics of HNNR under three water level conditions were simulated. The findings were as follows: (1) From 1998 to 2008, the area of marsh and meadow had a downward trend, while the area of forest, farmland and water showed a gradual and upward trend; a marked rise in the area of marsh and a continued rise in the area of forest, farmland and water, and a sharp decline in the area of meadow during 2008 to 2018 was observed. (2) There was a significant increase in the area of marsh under the 20 and 40 cm water level simulation scenarios, with a decrease in the number of patches, and an increase in the aggregation index with rising water levels; in contrast, when the water level rose to 60 cm, the area of marsh and the number of patches decreased, but the aggregation index continued to increase. (3) The correlation between wetland landscape and the water level was a nonlinear one. The area of marsh increased and then decreased with increasing water level, reaching a maximum at the 40 cm water level; therefore, 40 cm was the optimal water level regulation scenario. Hydrological processes are the most fundamental ecological processes in marsh wetlands. Understanding the scientific pattern of the spatial pattern characteristics of species as a function of water level environment is important for scientifically guiding the restoration of marsh vegetation.

1. Introduction

Wetlands are unique ecosystems that are both terrestrial and aquatic. They have a transitional nature, and their dynamic hydrological characteristics make them one of the most diverse ecosystems on earth in terms of biodiversity [1,2]. The global area covered by wetlands is currently declining, the rate of which is the highest in all the ecosystems [3]. The damage or alteration to the hydrology of some existing wetlands and the impact on terrestrial and aquatic ecosystems caused by the acceleration of human activity are causes for concern [4].
Hydrological processes are the main drivers that control the development and succession of wetland ecological processes, and they play a crucial role in determining the formation, evolution, succession and extinction of marshes. The hydrological regime of a marsh is dynamic which changes the hydrology of the landscape over time through erosion due to natural hazards and sedimentation caused by flooding [5]. In contrast, wetland landscape features are associated with hydrological elements including water levels, depth of inundation and the alternation of wet and dry cycles [6]. The hydrological processes of wetlands also form the bridge and link between different types of wetlands [7]. Studying hydrological connectivity is important for understanding the ease of runoff sediment generation and transport within a catchment, and it can provide a good indication of the runoff sediment transport pathways and their response to changes in the landscape [8]. Wetland hydrological functions, i.e., wetland landscape dynamics, are impacted by the capability of wetlands to store and release water. For example, drought can lead to a decline in groundwater storage, which can create a level of water stress conditions for wetland vegetation. In some coastal areas, flooding caused by storms or a rise in sea level may significantly increase soil erosion and even cause the death of some vegetation that is not tolerant to flooding [9]. The dynamic change in hydrology not only affects the spatial distribution of wetland plant communities, but also controls their successional patterns. On a small scale, hydrological factors such as water levels and currents can create water stress conditions for the vegetation in wetlands, thus affecting the morphological characteristics, growth, and biomass of plants, and ultimately determining the landscape pattern of wetlands [10]. Some hydrological features of wetlands therefore need to be monitored and potentially protected as they are critical in regulating the hydrological cycles, as well as vegetation growth and succession.
An important contributor to the development of wetland plant communities and the pattern of plant zonation is the water regime. Water regime can be described in terms of factors such as the depth, frequency, duration and rate of the inundation and the drying phases of a wetland [11]. Of these factors, the duration and depth of flooding are recognized as the primary hydrological factors that control species diversity, community structure, and the geographical distribution of plants [12]. Plant growth and zoning patterns in HNNR can change with year and season as the water levels fluctuate in space and time. For example, prolonged flooding adversely affects some species and benefits others, and the depth of flooding can have a significant impact on the species composition and biomass of the plants being established [11]. Furthermore, various species exhibit unique acceptable parameters for fluctuation in response to hydrological gradient variations. Typical marsh species tend to thrive with an increase in the wetland water level over a certain area, whereas non–marsh species tend to proliferate and expand with a decrease in the water level. However, when water levels rise above a certain threshold, the growth of marsh vegetation will be limited [13]. It is challenging to forecast the composition and distribution of wetland vegetation communities in relation to hydrological characteristics.
For the purpose of monitoring the surface hydrology dynamics, large area hydrological data are required (e.g., regional catchments); the traditional wetland monitoring methods are costly, time consuming, and laborious, while standing water areas are often inaccessible, and some remote areas are under–researched, resulting in a neglected response of the landscape to hydrological changes [14]. Nevertheless, without widespread and long–standing hydrological records, it is not possible to properly observe the changing hydrological conditions of wetlands [15]. Remote sensing is a promising source of data for the calibration of landscape–scale models, and satellite data offer the opportunity to depict surface hydrological dynamism over large geographical scales and over long periods of time [16]. Nakayama et al. [17] assessed ecohydrological processes in high-latitude wetlands using the NICE model, which incorporates the complexity of interactions among hydrological, geomorphological as well as ecosystem processes. Using 14 high–resolution remote sensing images taken in autumn between 1989 and 2013, You et al. [18] used quantitative interpretation techniques to study the classifying features and spatial dispersion pattern of the Poyang Lake wetland landscape; they used multivariate statistical analysis methods to investigate the relationship between the distribution of the Poyang Lake wetland landscape and hydrological health. Powell et al. [19] assessed flood dynamics through remote sensing and analyzed the plant communities using AVHRR satellite data; inundation patterns in the floodplains were analyzed and a model framework was established based on river, watercourse and key wetland components. The findings and outputs showed that this model could stimulate the ecologically relevant flood dynamics in floodplain wetlands. Using probability distribution functions modified for stochastic rainfall events and seasonal effects, Kim et al. [20] simulated and analyzed the ecological networks formed over hydrodynamic wetland complexes, and studied the variability of wetland area distribution at the landscape scale. The study of wetland ecohydrology combines wetland ecological processes, landscape patterns, and hydrological processes, and simulates and analyzes the responses of wetland landscape patterns to climate change or anthropogenic disturbances by revealing wetland ecohydrological processes and mechanisms [21]; it constructs an applied foundation for the realization of the conservation and restoration of wetland ecosystems.
Research on remote sensing classification and spatial variations in the wetlands landscape of Honghe National Nature Reserve (HNNR) has made progress both at home and abroad. Zhou et al. [22] concluded that, judging by the rate of marsh wetland degradation in the 7 years after 1998, the marsh wetland ecosystem of HNNR had been severely degraded due to human interference, and that the reserve would be entirely destroyed within the following 30 years. Wu et al. [23] selected Landsat TM images from 1975 to 2014 to classify the type of land cover in HNNR in various years, and the resulting data showed that the wetlands in HNNR had degraded; they concluded that changes in water quantity were the major drivers of wetland development. Fu et al. [24] used Landsat imagery provided by the GEE platform to track the spatiotemporal dynamics of wetland plants and hydrological perturbation and rehabilitation within the HNNR during 1985–2019, and found that hydrological change was the driving mechanism of wetland plants disappearance and restoration. Luan et al. [25,26] found that the intensification of human activities, the implementation of the water conservation schemes and the reclaiming of wetlands along the rivers have led to significant modifications of the river flow in the Sanjiang Plain, and that the altered hydrological conditions had directly led to the degradation and landscape fragmentation of the wetlands in HNNR. Despite these studies, the specific relationship between wetland vegetation patterns and hydrological conditions remains unclear. A new dam was built on the northeastern boundary of HNNR in 2008. The shift from natural to anthropogenic dominance of the hydrological situation in the reserve has resulted in an expansion of the inundated area and alterations in the composition and dispersal of the marsh flora communities, leading to further changes in the ecologic configuration of the marshes [13,27]. Thus, more in–depth research and analysis is needed on the conservation and restoration of the dynamics of wetland scenery patterns in HNNR under the interference of changes in water level gradients.
In order to solve the aforementioned problems, this paper combines GIS and remote sensing technology to predict the restoration processes of wetland ecology through different inundation levels; thus, it provides a basis for decision making for the management of wetland ecosystems in HNNR and for ecological recovery of damaged wetlands. Our specific objectives are as follows:
(1)
To monitor the dynamics of the marshland landscape in HNNR before and after hydrological regulation using long time series of satellite data;
(2)
To forecast the variation in wetland landscape patterns due to anthropogenic water level changes through the integration of digital topographic data with in situ hydrological data, based on the correlation between wetland plant communities and hydrological gradients;
(3)
To validate the simulated spatial patterns of the wetland landscapes under a number different water level gradients.

2. Materials and Methods

2.1. Study Area

Established in 1984, HNNR (47°42′18″ N~47°52′00″ N,133°34′38″ E~133°46′29″ E) is situated in the Nongjiang River Basin of the Sanjiang Plain in Heilongjiang Province, a waterlogged area where the Nongjiang River and Wolvlan River merge; it covers a surface area of 218.36 km2 [28] (Figure 1). HNNR is situated in the alluvial plain of the Sanjiang Plain; it has a flat topography, with a higher elevation in the southwest and a lower elevation in the northeast, and a relative height difference of 7 m. The landform type includes terraces and river floodplains, and the main soils are white pulpy soil and swampy soil [29]. The main soil type of forest is hill albic soil, and meadows grow in the meadow albic bleached soil, incubation albic bleached soil and meadow swamp soil. Marsh mainly grows in two soil types: peat swamps soil and sapropelic marsh soil. The region has windy springs with little rainfall, hot summers, short autumns, and long, cold and snowy winters. The average annual rainfall in HNNR is 585 mm. From July to September, 50% to 70% of the rainfall is concentrated, and rainstorm is mostly concentrated in summer [30]. Because it has a temperate continental climate, the average temperature throughout the year is around 1.9 °C [31]. The lowest temperature in winter reaches −43.3 °C, and the highest temperature in summer is 37.7 °C [32].

2.2. Data Acquisition and Pre–Processing

2.2.1. Satellite Data

Landsat series satellite data provided by the GEE cloud platform were selected as the primary data in this paper; Landsat data have a temporal resolution of 16 days. The images were collected between June and October, which is the period of vegetation growth from 1998 to 2018. First, the minimum cloud image set was generated; the Landsat 7 ETM+ data strips were filled and then mosaicked and cropped to obtain Landsat 5 TM (1998, 2003–2011), Landsat 7 ETM+ (1999–2002 and 2012), and Landsat 8 OLI (2013–2018) image datasets with a spatial resolution of 30 m. Finally, the annual median image was synthesized, and spectral and exponential features were constructed for the next classification process.

2.2.2. Field Verification Data

Ground surveys were carried out in August 2004 and September 2015, and 330 samples of land cover–type samples were collected every year. Therefore, the precision of the result classification could be assessed and guaranteed objectively. In 2004, there were 119, 87, 72, 22, and 30 sample points for the marsh, meadow, forest, farmland, and water, respectively, and in 2015, there were 93, 103, 90, 29, and 15 points for each category, respectively. Two–thirds of the sample points were used randomly as training samples, and the remainder of the sample points was used for verifying the accuracy of the classification outcomes.

2.2.3. Digital Elevation Model

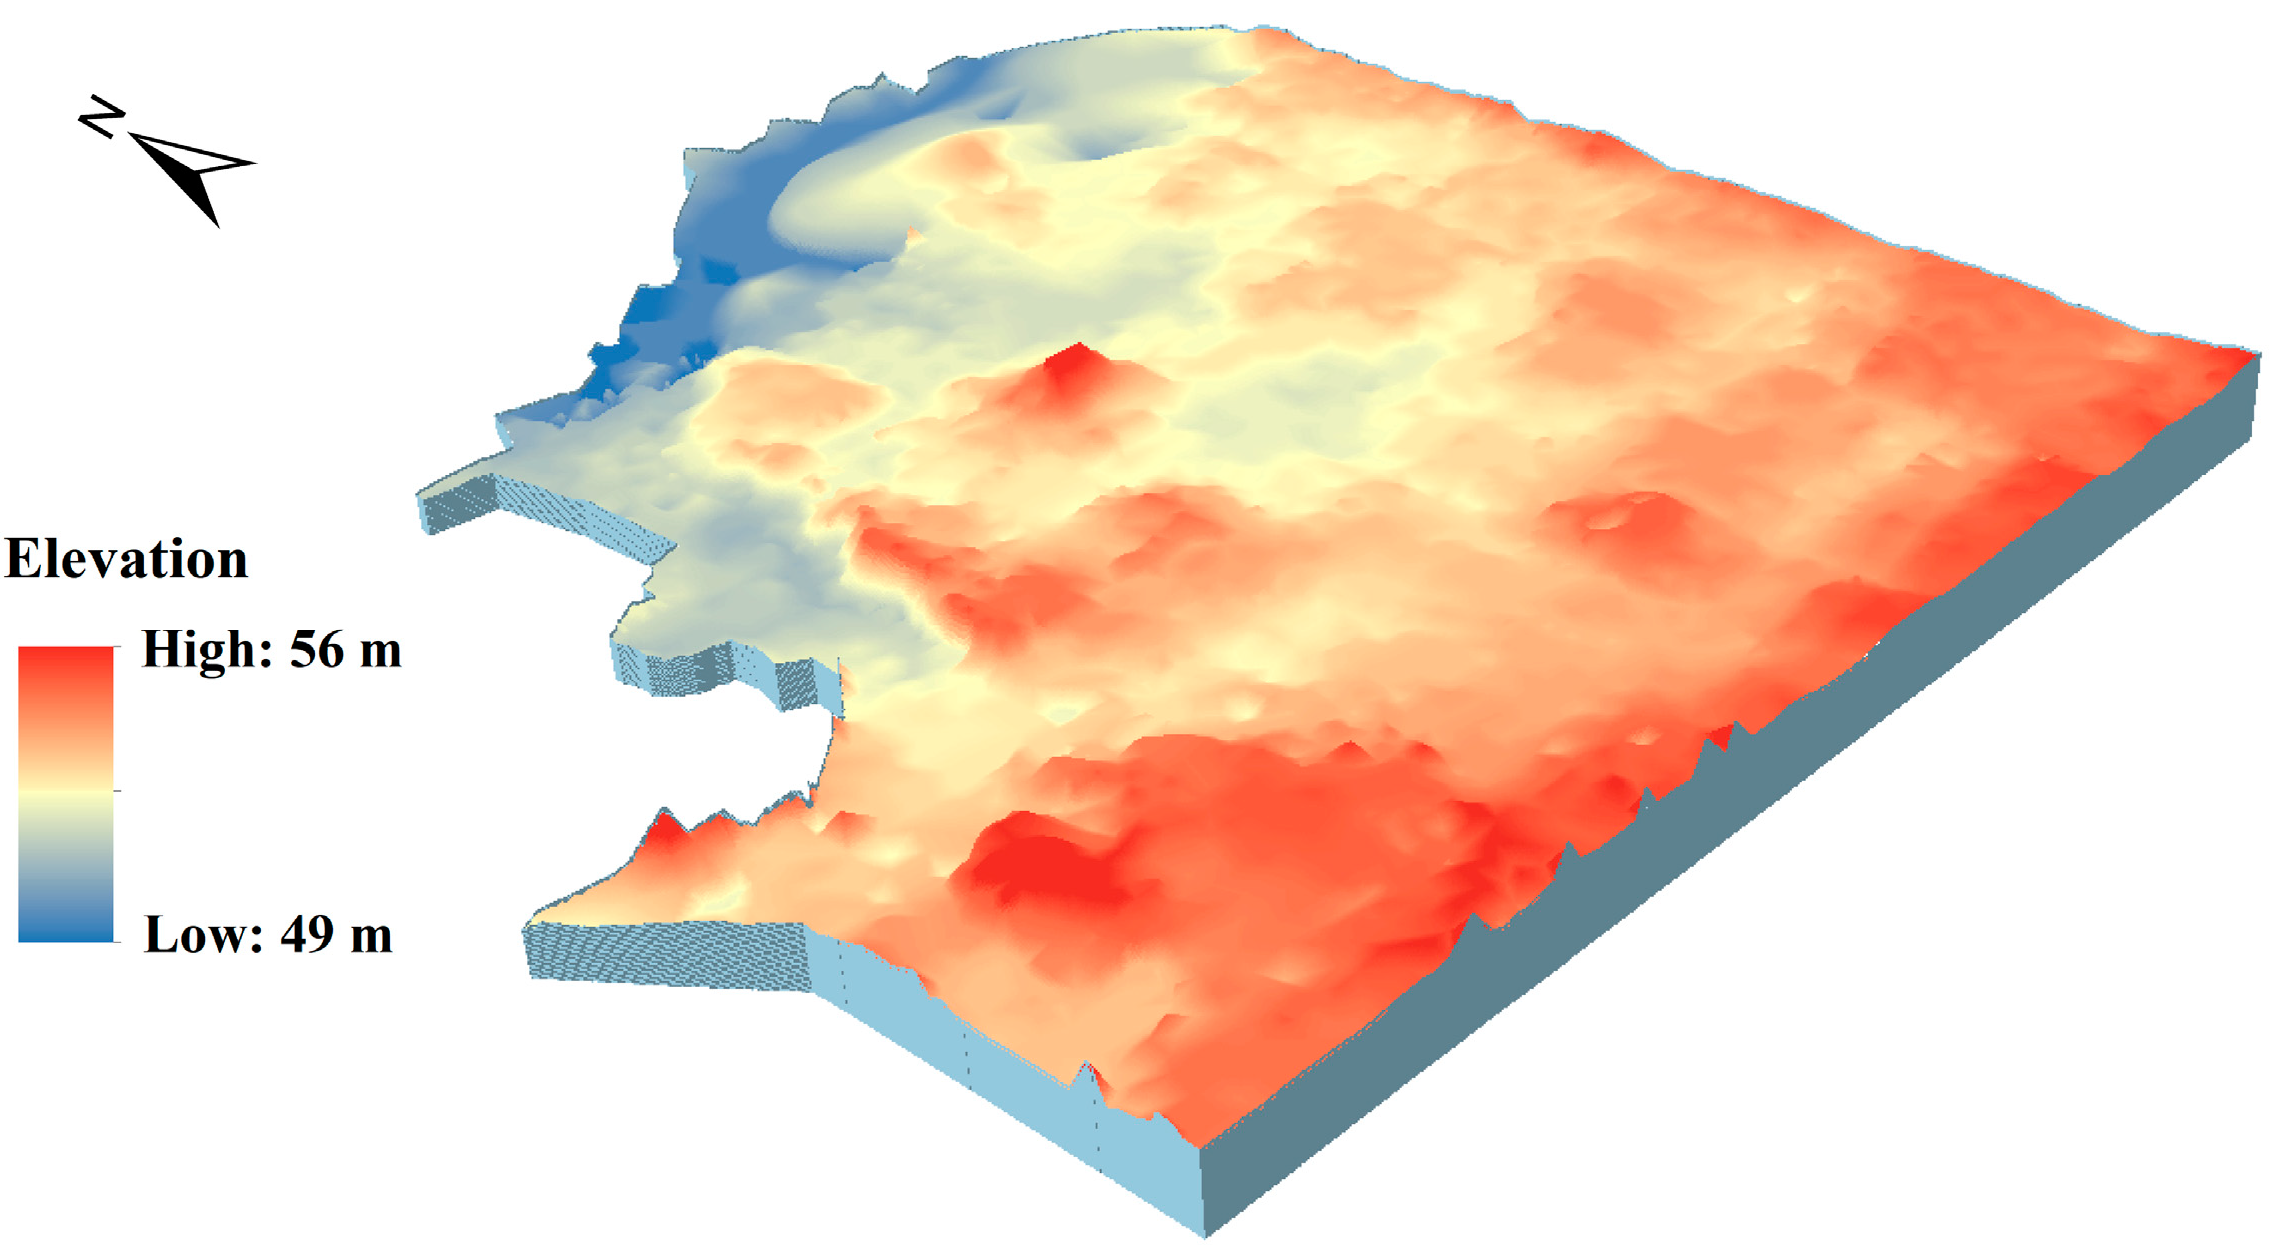
The digital elevation model (DEM) of the investigation area was produced via vector extraction from the topographic map of the Heilongjiang Provincial Bureau of Surveying and Mapping 1:10,000 (1 m contour distance), 1994. In addition, R2V vectorization software was applied to extract contour lines and contour points, and layer stitching was carried out to establish the digital layers of the elevation points and contour lines for the whole study area. In order to ensure accuracy, an irregular triangular network was generated; then, the elevation values were interpolated to generate a DEM with a resolution of 5 m (49–56 m, Figure 2).

2.2.4. Water Level Data

The surface water levels were measured using Odyssey water level recorders (New Zealand), and the data on daily water levels from HNNR were selected for a comparative analytical study of the changes in hydrological conditions in the study site before and after the dam was completed.

2.3. Methods

2.3.1. Wetland Information Extraction

The random forest is a combined set of randomly trained decision trees. The crucial aspect of the model is that trees in the forest are randomly related to each other. The predictions between the decision trees are thus decorrelated, which in return improves generalization and robustness [33]. Currently, the random forest method is considerably less demanding in terms of computation than other methods of neural network computation, and it guarantees the accuracy of results. Consequently, it is frequently used for ecological monitoring of large wetlands, forest fire early warning systems, agricultural resource surveys, etc., and is becoming more instrumental in the geographic surveillance and land classification coverage. Based on the random forest classification algorithm that is delivered by the GEE platform, the training samples, and the spectral and remote sensing index feature data, we classified the wetland landscape into five categories: marsh, as represented here by Carex lasiocarpa, Carex pseudocuraica, etc.; meadow, as represented here by Calamagrostis angustifolia, Carex schmidtii Meinsh, etc.; forest, comprising Populus davidiana and Betula platyphylla; farmland, containing both paddy and dryland; and water, which includes rivers and small lakes. The post–processing process of classification resulted in the final HHNR wetland landscape maps for 1998–2018. Based on the limited data from the validation sample, we only assessed the precision of the classification results for the years 2004 and 2015; these results yielded an overall average accuracy of >90% and a Kappa coefficient of >0.83, indicating a high level of consistency between the classification maps and the ground reality features; therefore, these results could be used for the subsequent analysis.

2.3.2. Spatial Patterns of Vegetation Communities at Various Hydrological Gradients in HNNR

The HNNR ecosystem is a highly dynamic and diversified landscape, not just in terms of spatial extent, but also in terms of its hydrologic features and plant communities. Extensive studies demonstrate that there is a relationship between the hydrological patterns of HNNR and the plant communities found within it, with the vegetation structure and composition often showing spatially differentiated patterns along the hydrological gradient [13,22,27]. Using literature studies [27,31,34,35,36,37], ecohydrology theory and field surveys, the spatial distribution of typical plant communities and their corresponding habitat characteristics were determined in the wetlands of HNNR (Figure 3). For example, as the water depth increases, the shrub meadow vegetation dominated by Calamagrostis angustifolia is gradually invaded by wet and marsh meadows, ultimately forming a Carex-dominated marsh. If the water accumulates to about 30 cm, the Carex lasiocarpa becomes a community–building species, and when the water accumulation increases to 30–80 cm, the Carex pseudocuraica replaces the Carex lasiocarpa and develops into a Carex pseudocuraica marsh [37,38]. This is because the suitable water depth range of Carex lasiocarpa is 10–30 cm. The suitable water depth range of Carex pseudocuraica is 20–40 cm, but the maximum tolerable water depth is 80 cm, so when the water depth range is 30–80 cm, there will be a succession of substitutions [27,34]. Figure 3 quantitatively depicts the dominant species composition of the various plant communities in HNNR, the suitable habitat conditions (soil type and moisture), and the corresponding hydrological situation (optimum inundation conditions and water depth range). This is the theoretical basis for the prediction of changes in the patterns of spatial distribution of plant communities due to hydrological variability.

2.3.3. Changes in Wetland Levels in HNNR before and after Dam Construction

The hydrological condition of wetlands is closely related to surface elevation and water depth [39]. When the water level surpasses a specific elevation, the vegetation growing at that level is considered to be flooded. In the HNNR wetlands, the water conditions are indicated by elevation and water level. The annual mean water levels were derived from the daily water level data measured in the field. Based on 5 m resolution DEM data, an inundation analysis of the wetland micro–landscapes was carried out using the spatial analysis tools in ArcGIS 10.8. There are two main algorithms for inundation analysis: active submergence algorithm and passive submergence algorithm, which are suitable for different scenarios. The simulation method used in this article is the active submergence algorithm [40]. The active submergence algorithm method uses DEM data to study regional geographic morphology, surface runoff, and water flow direction. When analyzing data, it is necessary to provide the source point of inundation and the water level of inundation. During the process of flood flow, if terrain obstacles are encountered, the water can only be submerged to the place it can flow to. In the active submergence algorithm method, even if the elevation of a point on the DEM is less than the given water level, that point may not necessarily be submerged [41,42]. The active submergence algorithm, with constant change in reference elevation, continuously incorporates the surrounding area into the inundation area according to the advancing mode of the water source; according to the actual terrain and topography, if the traversal point elevation is higher than the current point elevation, it will not be included in the inundation area [43]. A precise bathymetric raster of the HNNR wetlands was generated by combining the inundation analysis with water level measurements.
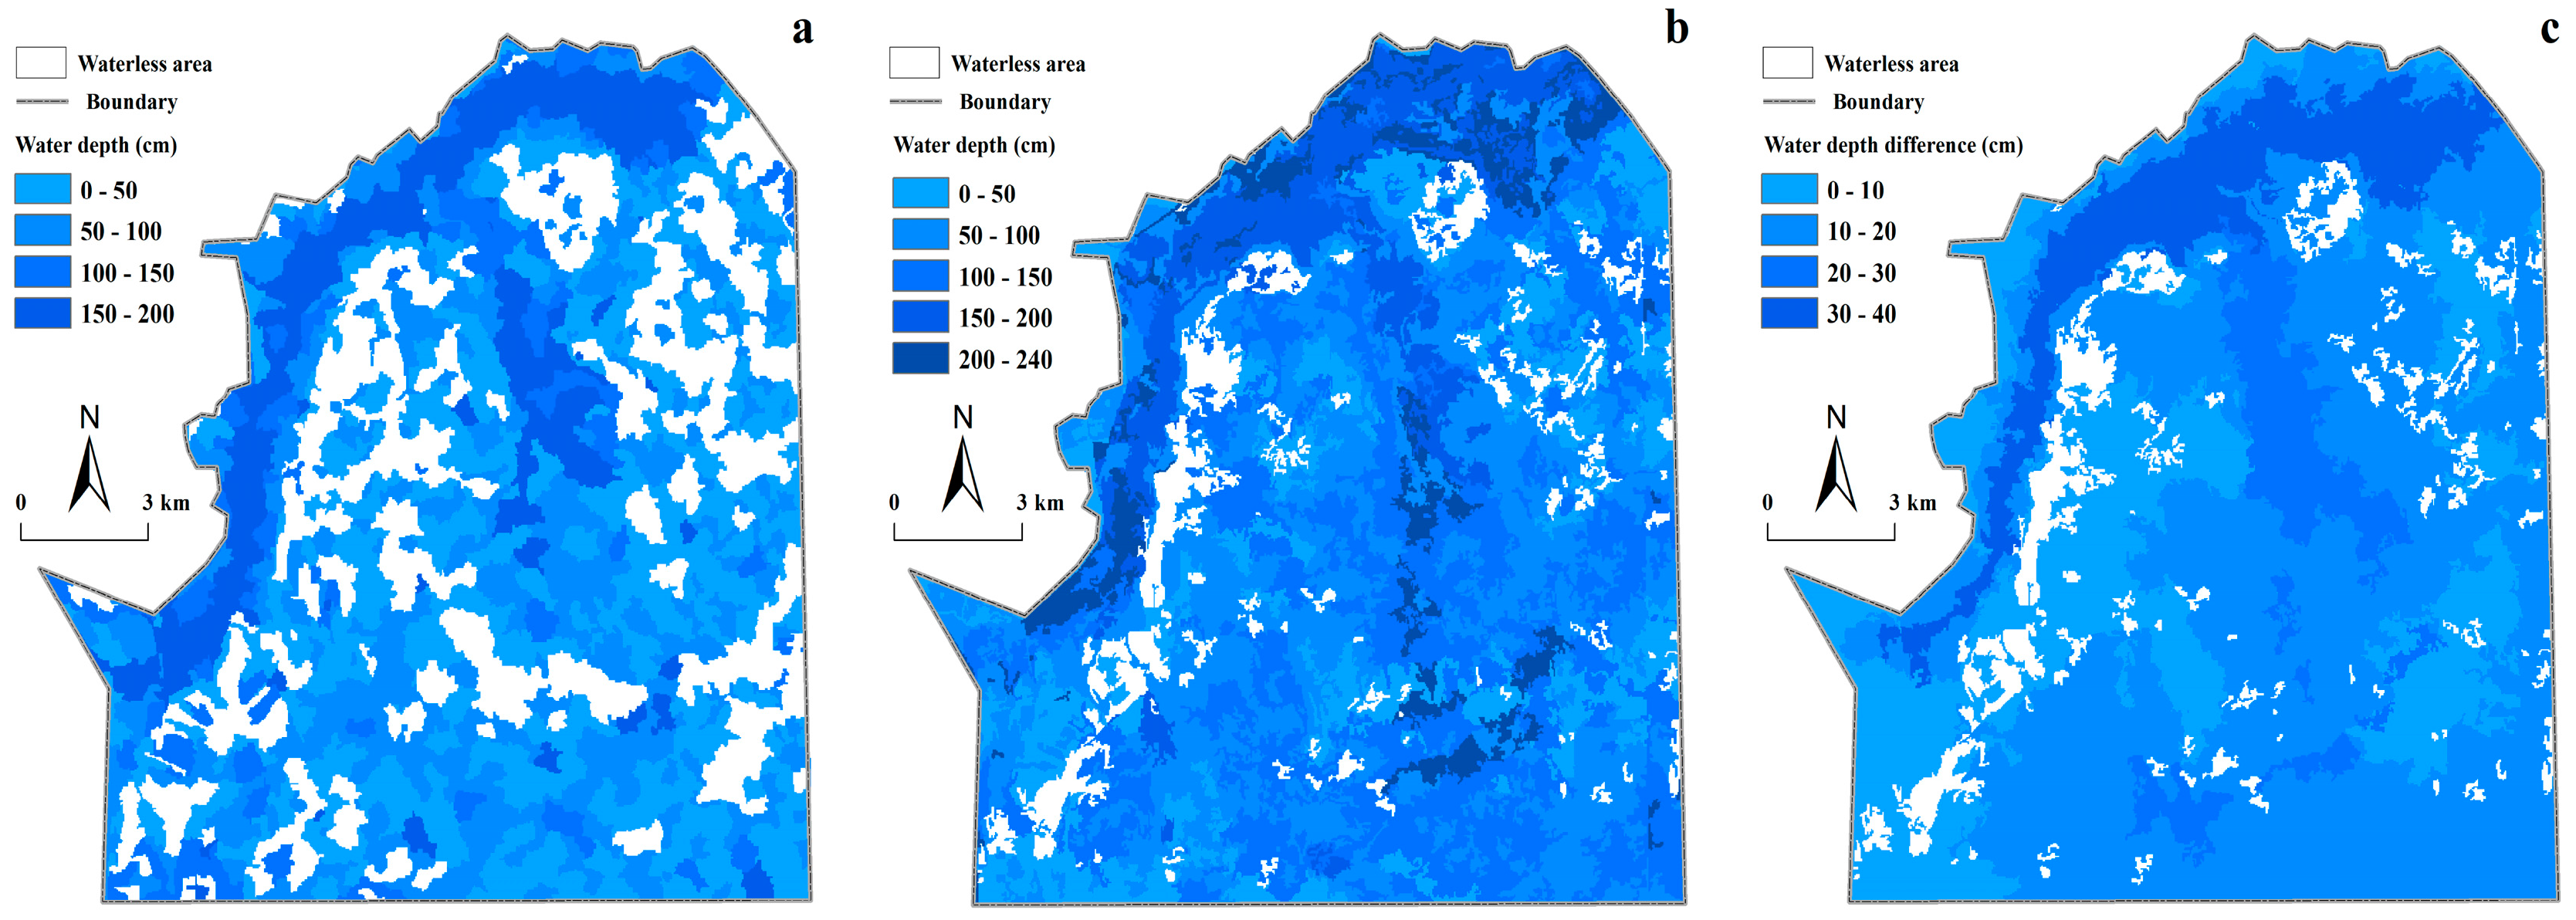
Due to the expropriation and reclamation of more and more wetlands around the reserve to cater for the needs of a growing population, groundwater and surface water levels have continued to drop, leading to serious degradation of the wetlands over the last few decades [44,45]. In order to curb the degradation of the hydrological environment in marsh wetlands, a new dam was built in 2008 near the residential area of Qianfeng Farm in the protection section of the Nongjiang River, which is located on the northeast boundary of HNNR. A water level control gate was also built outside the 0 + 400 section of the dam. If a flood year occurs, this gate controls the discharge of floods to regulate the flood discharge and storage water level according to the succession law of wetland ecology [46]. Since then, changes in the hydrological conditions of the reserve have influenced the composition and distribution of the marsh vegetation communities. The impact on the hydrological situation of the study area under anthropogenic regulation after 2008 was analyzed, taking into account the elevation and construction of the dam. Based on the existing water depth grid, we set up three water level control schemes to increase the water levels by 20, 40, and 60 cm, respectively, and thereby obtained three new water depth maps. Figure 4a displays the initial surface water depth of HNNR before the dam’s construction. Subsequently, Figure 4b portrays the surface water depth map of the area after the dam’s construction, showing a remarkable increase of 40 cm in the water level. These water depth maps were subsequently used to predict the spatial distribution of plant communities under different water level scenarios, based on the relationship between the spatial differentiation patterns of typical plant communities in the reserve and the range of the bathymetry tolerance (Figure 3).

2.3.4. Verification of Simulation Results’ Accuracy

The classification results for 2009, 2012, and 2015 were selected as the baseline maps, and 20 validation points were created for each vegetation type in the three water level simulations using the CreateRandomPoints tool in ArcGIS 10.8. A confusion matrix was created to calculate the overall accuracy (OA), user accuracy (UA), producer accuracy (PA), and Kappa coefficients to validate the accuracy of the landscape patterns of wetlands under three different water level scenarios, as well as assess the accuracy of the predictions for these three water levels. The basic evaluation indicators are as follows [47]:
(1)
Overall accuracy (OA)
OA = i = 1 n x ii N
Overall accuracy is a statistic with a probabilistic meaning, expressed as the probability that, for each random sample, the result classified is consistent with the actual type.
(2)
User accuracy (UA)
UA = x ii x i +
User accuracy denotes the conditional probability that any random sample taken from the classification results has the same type as the actual type on the ground.
(3)
Producer accuracy (PA)
PA = x ii x + i
Producer accuracy denotes the conditional probability that a classification result for the same site on a classification map is consistent with it, relative to any random sample in the reference data.
(4)
Kappa coefficients
k = N i = 1 n x ii - i = 1 n x i + x + i N 2 - i = 1 n x i + x + i
In the equation, N is the total number of samples used for accuracy evaluation; n is the total number of columns in the confusion matrix (i.e., the total number of categories); xii is the number of samples on the i row and i column of the confusion matrix, which is the number of correctly classified samples; xi+ and x+i are the total number of samples in row i and column i, respectively. When k exceeds 0.8, it indicates that the obtained classification results are very close to the actual surface features; when k is between 0.4 and 0.8, it indicates a good match between the two. However, if the k value is less than 0.4, it indicates that the matching degree between the two is extremely poor and the classification result cannot be adopted.

3. Results

3.1. Wetland Landscape Changes from 1998 to 2018

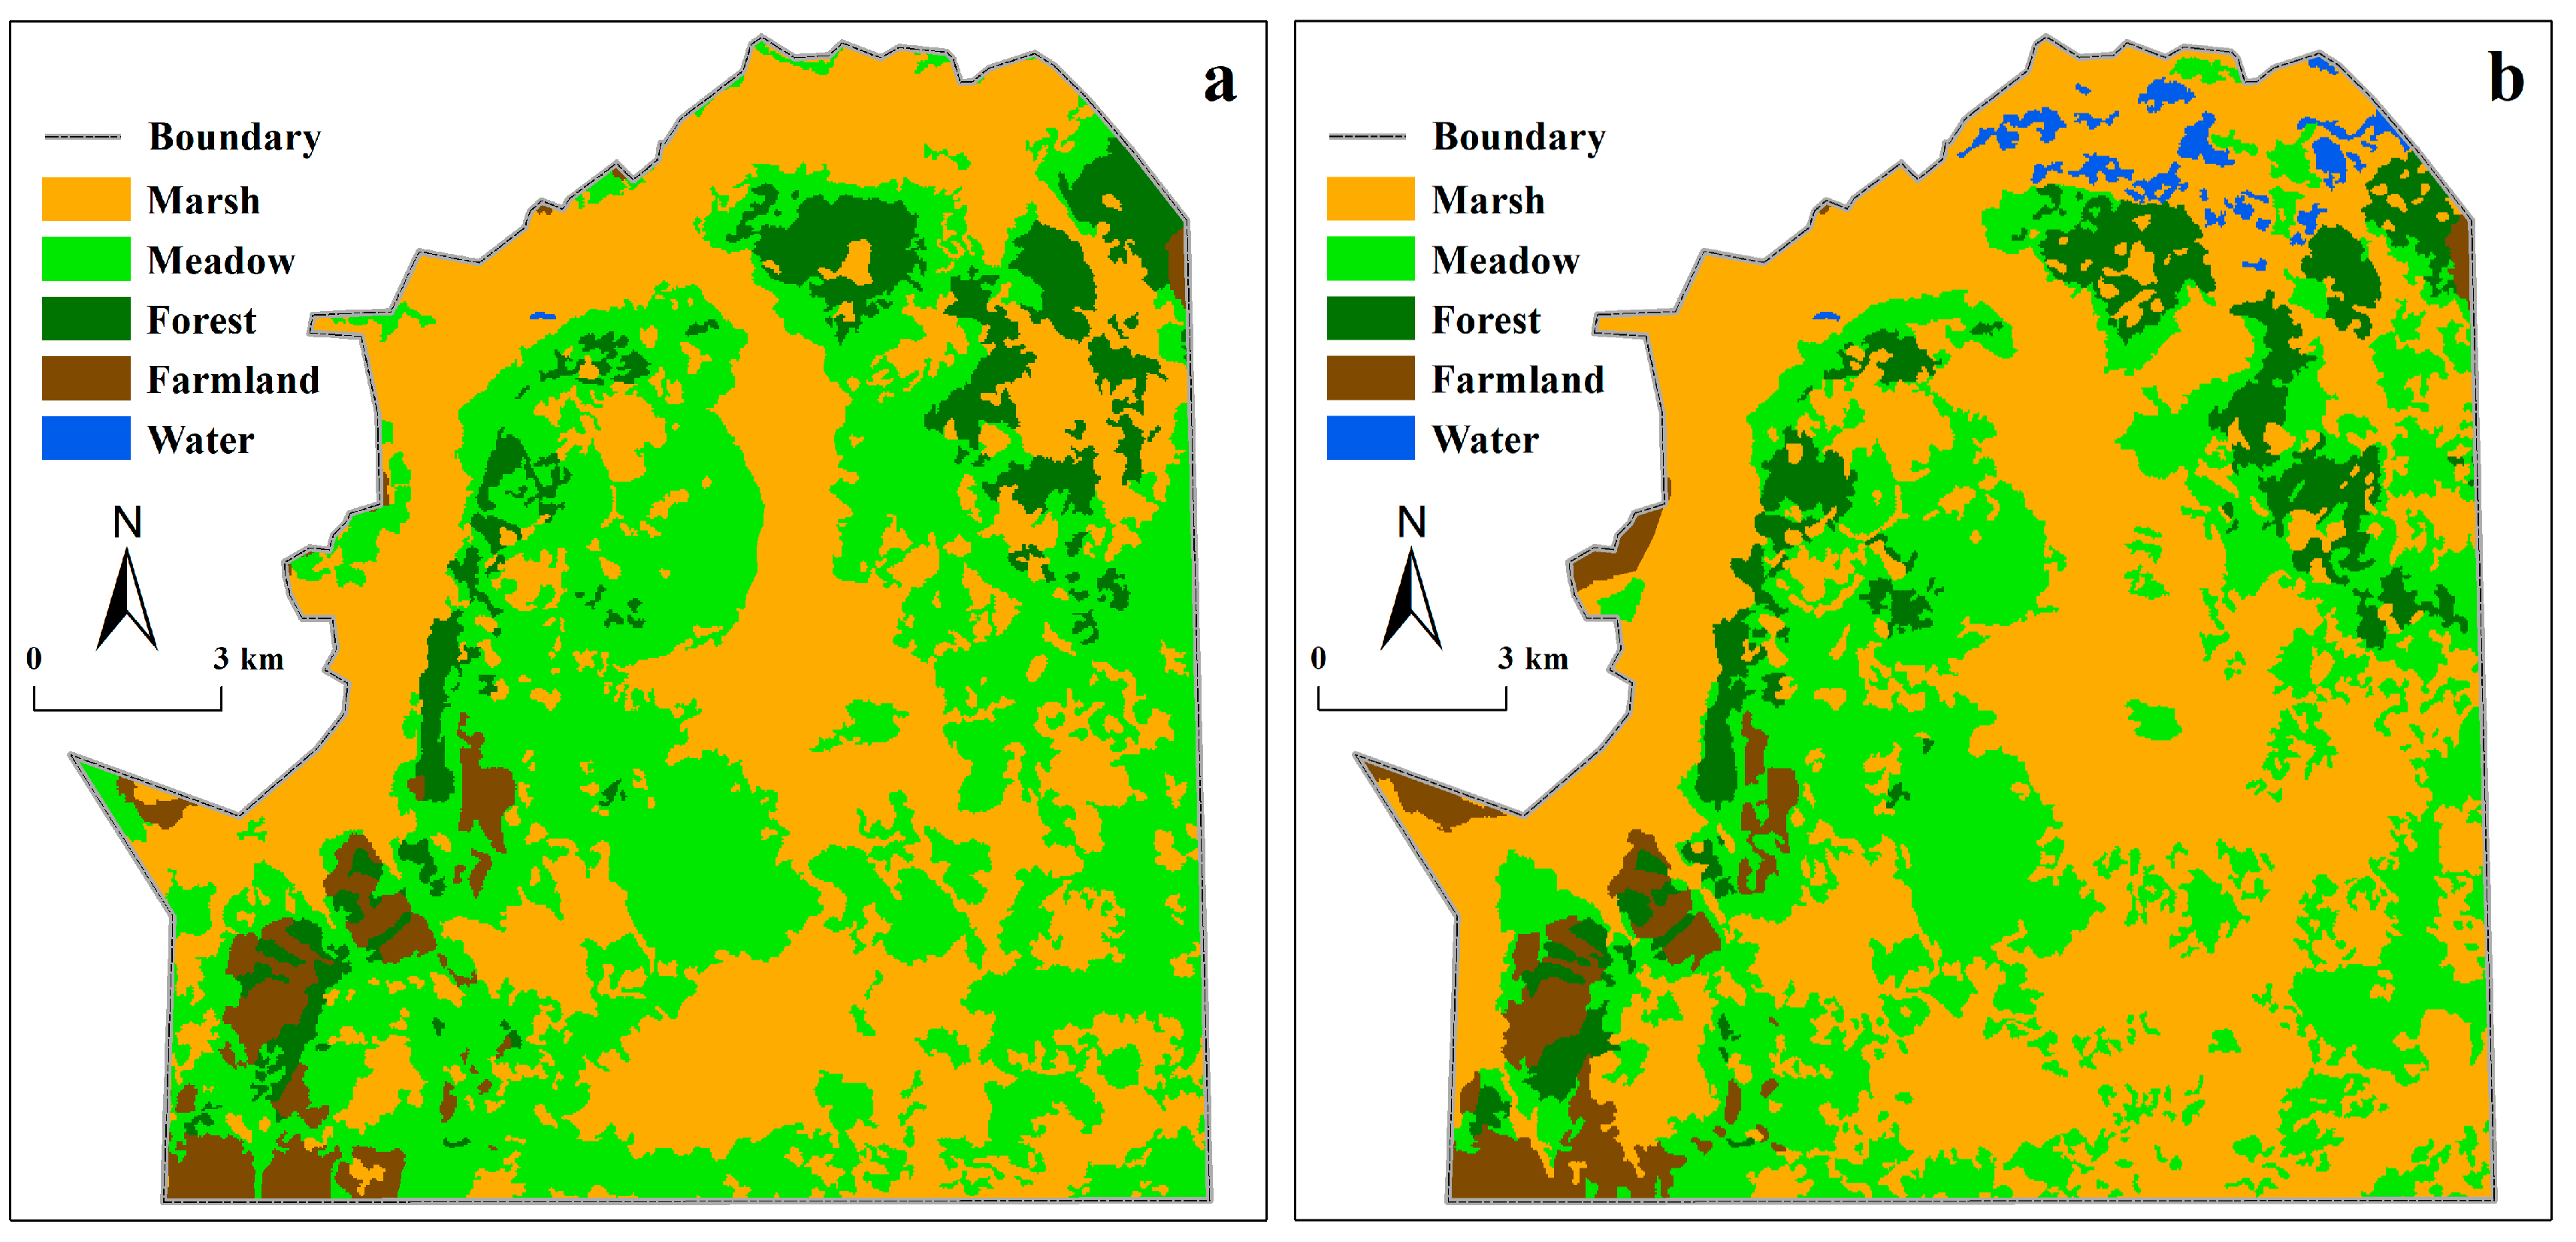
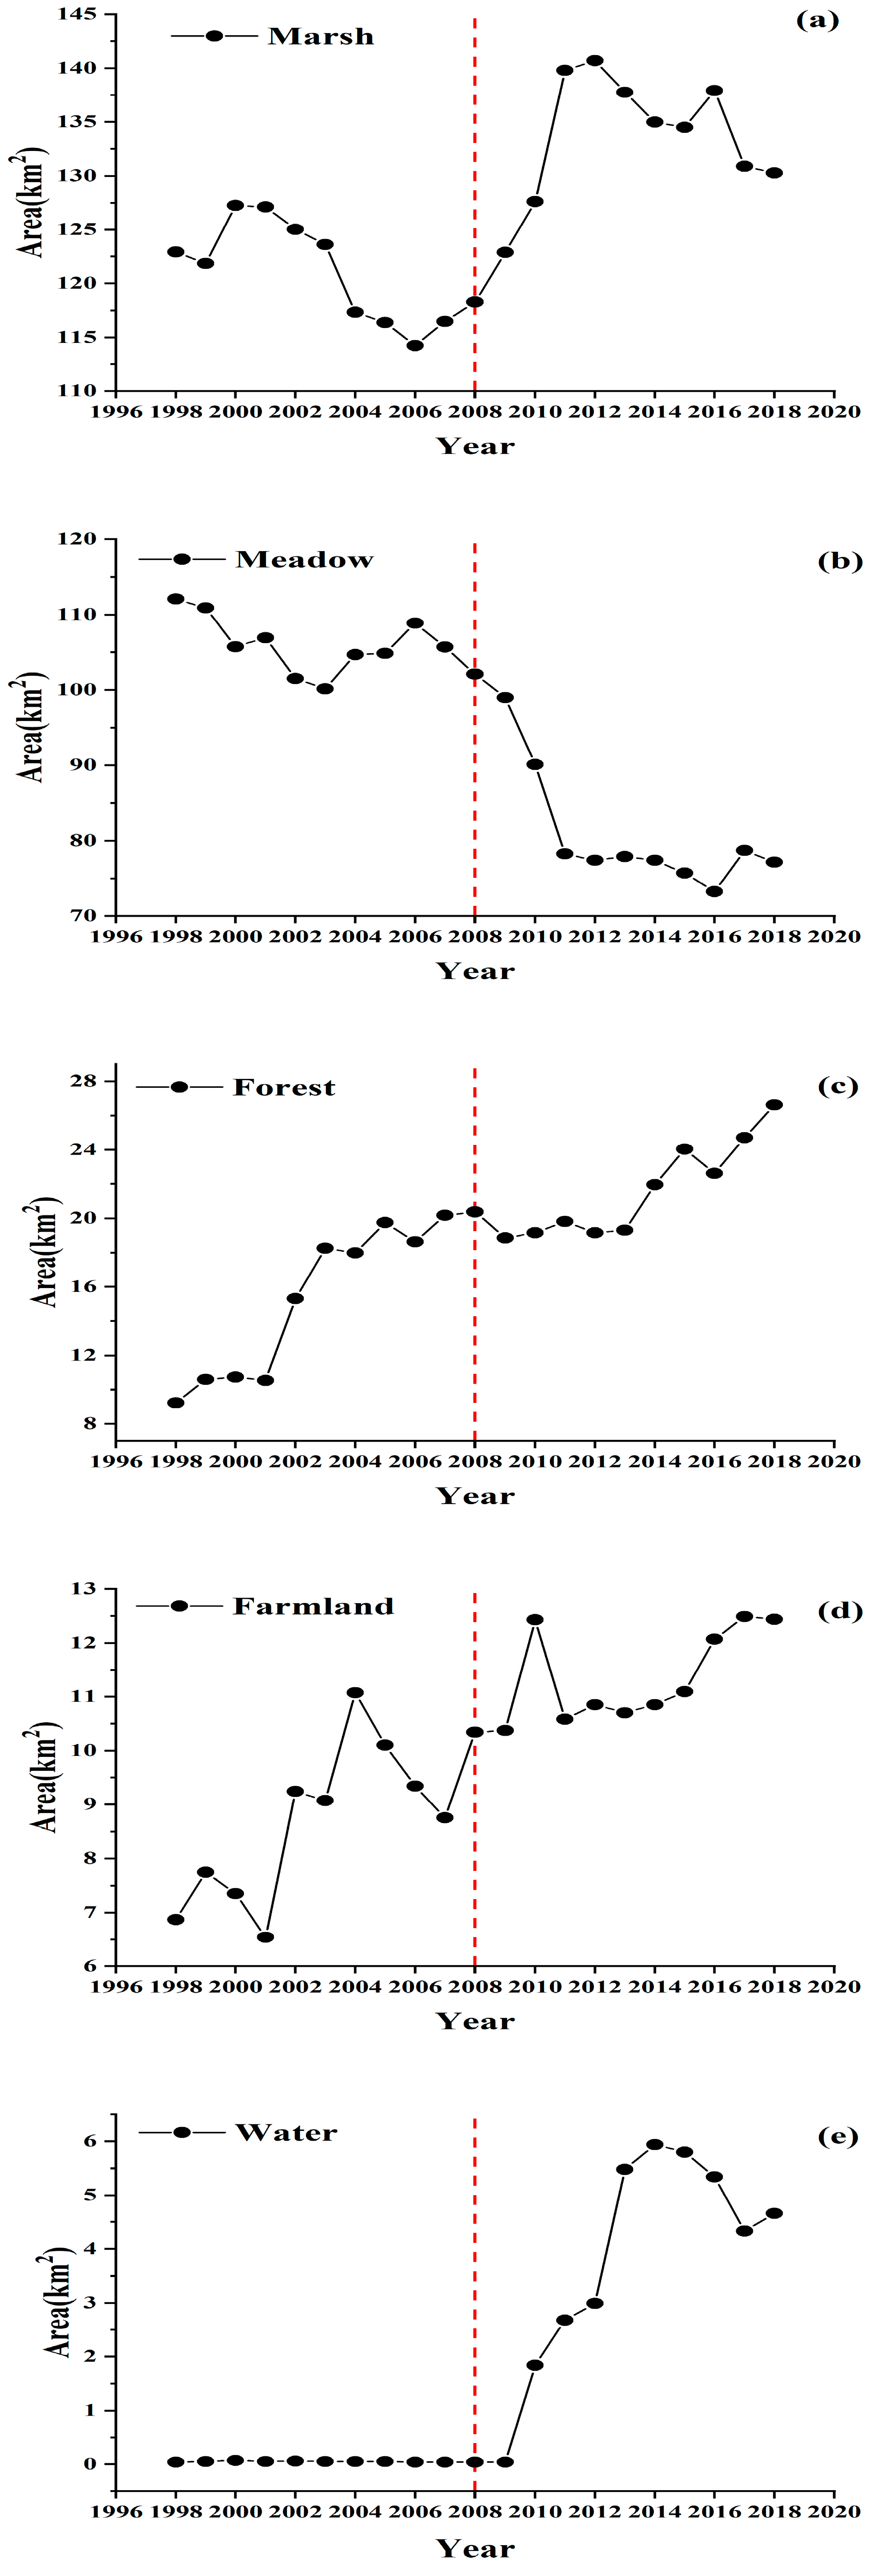
As shown in Figure 5a,b, the wetland landscape of HNNR significantly changed before and after the dam construction. Compared to the pre–dam period (2006), the post–dam period (2012) has seen a significant expansion in the extent of the marsh and water, and a significant reduction in the extent of the meadow. Using the landscape spatial distribution dataset from 1998 to 2018, we calculated the annual area change for each HNNR landscape category in ArcGIS 10.8 (Figure 6). The dam of HNNR was built at the Nongjiang River in 2008, so we divided the study period into two phases, from 1998 to 2008 and from 2008 to 2018. The year 2008 was regarded as the turning point year, and the landscape evolution process of HNNR was analyzed based on it.
Among them, the marsh area showed a downward trend from 1998 to 2008, dropping to the lowest value of 114.25 km2 in 2006, and a decrease of 8.66 km2 compared to 1998 (Figure 6a). However, from 2008 to 2018, the area of the marsh showed an increasing trend, rising from 118.28 km2 in 2008 to 140.7 km2 in 2012 and reaching a maximum increase of 22.42 km2 in area; it declined after 2012 but overall remained relatively stable. From 1998 to 2008, the meadow area gradually changed, with a clear downward trend after 2008 (Figure 6b); the minimum meadow area was 73.22 km2 in 2016, accounting for only 29.16% of the study area, which represented a decrease of 28.87 km2 compared to 2008. The forest showed a fluctuating upward trend from 1998 to 2018 and reached a maximum of 26.62 km2 in 2018, with the forest area accounting for 3.51% to 10.6% of the total area of the study area over the years (Figure 6c). Farmland accounts for 2.60% to 4.97% of the total area of HNNR, with the smallest value occurring in 2001 at 6.54 km2 and reaching a maximum value of 12.49 km2 in 2017 (Figure 6d). As the Sanjiang Plain has experienced a number of agricultural activities based on the reclamation of marsh wetlands, the area of agricultural land has shown a steady upward trend.
As can be seen from Figure 6e, the water area before 2008 was negligible. This was because, after the construction of the dam was completed in 2008, the water began to concentrate near the dam in the lower reaches of the Wolvlan River. In 2014, the area of water reached the maximum of 5.94 km2, and then, although there was a downward trend, it gradually stabilized. Accordingly, it could be seen that the construction of dam had a significant impact on both marsh and water.

3.2. Wetland Landscape Changes under Three Water Level Scenarios

Figure 7 and Table 1 show the results of the original water level scenario and the three simulated scenarios. As most of the farmland is located on upland areas, water level adjustments in any scenario would have little effect on the spatial pattern of the uplands, so we assume no change in the farmland area. However, anthropogenic water level adjustments can have an impact on the number of patches, the total area, and the AI (aggregation index) of the vegetation, water, and various natural vegetation types.
After the dam was built, when the water level in HNNR increased to 20 cm (Figure 7b, Table 1), the spatial distribution of vegetation and water significantly changed compared with before the dam was built (Figure 7a). The area of the marsh increased and the number of patches of marsh approximately quadrupled compared to the pre-dam period; so, the accompanying decrease in AI values represents an increase in the fragmentation of the marsh landscape. In this case, both the meadow and forest areas were drastically reduced; however, the number of patches of meadow was higher than the original level, and the AI value increased, i.e., fragmentation increased. The forest in the northeast corner was extensively inundated, so the number of patches dropped sharply, and the fragmentation increased (the AI value rose). According to the natural landscape changes caused by the above–mentioned water level rise, the increase in water area and marsh area due to the rise in water level (20 cm), together with the decrease in the non–marsh landscape area, indicated that rising water level was beneficial for the restoration of wetland vegetation patterns.
When the water level increased to 40 cm (Figure 7c, Table 1), changes in marsh and meadow were more noticeable than before. Compared with the 20 cm water level, the area of the marsh increased, although the number of patches was lower. This indicated a reduction in habitat fragmentation (higher AI values) with an increase in marsh area. Thus, the connectivity of the landscape was altered. As part of the scattered grassland was inundated with the rise of water level and became a water/marsh, the meadow area sharply decreased and the number of patches was reduced to half, with the increasing AI values indicating a high concentration of meadow patches. The area of forest continued to remain at a relatively low level; with the original forest being inundated by water, there was increased fragmentation (decreased AI values). The area of the water was significantly higher and connected as a whole, and the number of patches decreased. Therefore, from the point of view of wetland restoration, a 40 cm increase in water level is preferable to a 20 cm increase. When the dam level increased to 60 cm (Figure 7d, Table 1), the area of the water significantly expanded, and the meadow and forest may have disappeared from the study area, which was not desirable for local landscape biodiversity. In addition, the area of marsh was beginning to decrease, and some of the small areas that remained were being inundated by water, resulting in a less fragmented marsh landscape and a decreased number of patches. This illustrated that higher water levels did not necessarily lead to habitat expansion, but that appropriate water level adjustments did not damage the landscape structure of the marsh.
All this being said, there was a nonlinear correlation between water level rise and the restoration of wetland vegetation patterns, and an increase of 40 cm was the optimal water level regulation scenario. Therefore, it was necessary to model and quantify the effects of hydrological regulation on changes in vegetation patterns.

3.3. Validation against Existing Results

According to the existing results verification (Table 2), when the water level height reached 20 cm and 40 cm, the overall classification accuracy was higher than 69%, and the Kappa coefficient was higher than 0.62, and the simulation results were highly consistent with the basic original data. However, when the water level increased to 60 cm, the simulated classification results were in moderate agreement with the baseline data. This may be related to the fact that the actual water level situation in 2015 did not reach 60 cm.

4. Discussion

4.1. Wetland Landscape Dynamics in HNNR

The degradation of the marsh landscape was evident prior to 2008 (Figure 6a); this is consistent with the conclusions drawn by previous studies [22]. Additionally, the areas of marsh and meadow in HNNR alternate; this is mainly due to differences in the annual hydrological conditions, with the meadow and marsh vegetations transforming into each other under different moisture conditions, with large interannual variations. This is roughly the same as the findings of Na et al. [29]. Some studies suggest that the increase in forest and farmland area is caused by the conversion of marsh area. From Figure 6c,d, we can see that the landscape areas of forest and farmland have gradually increased; this paper argues that this is due to the policy of returning farmland to forests proposed in the 1990s and the exploitation of the marsh wetlands of the Sanjiang Plain over the years [48]. The distribution of water was minimal until 2010, but the area of water has increased substantially since the construction of the dam. Ning et al. [49] attribute this to the effective containment of fallowing and ditching for drainage.

4.2. Landscape Dynamics under Water Level Simulation Scenarios

Hydrological factors are a prerequisite for marsh formation and development, with water quantity, water quality, hydrological conditions, the degree of continuity of water recharge, and the degree of stability due to moisture conditions being the factors that govern the formation and development of marsh wetlands [12]. Thus, compared with climate factors, hydrological factors have a more direct effect in the formation and development of marsh wetlands [50]. In this paper, the effects of anthropogenic water level regulation on wetland landscape pattern before and after dam construction were simulated and predicted to provide a more accurate basis for ecological restoration of HNNR wetland landscape.
Maingi and Marsh used Landsat (MSS) and SPOT (XS) imagery data to analyze changes in the wetlands along the lower Tana River in Kenya from 1985 to 1996 [51]. The results show that human activities have had a significant impact on landscape changes along the river; this is particularly the case with the construction of dams in the upper reaches, which bring changes to the vegetation and agricultural production along the river in the lower reaches, and thus change the landscape pattern of the wetlands. Through a comparative analysis of studies prior to 2008, we found that the previous authors believed that the fragmentation of the marsh landscape would become increasingly high [52]. From Figure 6a, it can be seen that the marsh area decreased by 8.66 km2 from 1998 to 2006; this is also in accordance with the findings of Zhou et al. [22]. However, some studies suggest that the marsh area declined at a rate of 10% per year from 1998 to 2006, and that the wetlands in HNNR will disappear completely within the next 30 years [22], but this contradicts our conclusion that the marsh area showed a gradual increase after 2008. This increase is mainly due to the establishment of the dam in 2008, which allowed for the hydrological situation in the reserve to be restored and the marsh landscape to be improved accordingly. Moreover, annual average temperature, annual precipitation and human activities all have an impact on changes in the area of marsh. It can be understood that the way wetland plant communities react to moisture gradients (water depth and water level fluctuations) is a long–term adaptation to special habitat conditions. For instance, a rise (fall) in water level within a specific range is conducive to the expansion of marsh communities (non–marsh communities) [2].

4.3. Limitations

Wetland ecohydrological modelling is a key component of ecohydrology research [53]. On the basis of wetland ecohydrological processes and mechanisms, wetland ecohydrological model can simulate and analyze the response of ecohydrological patterns and processes to climate change or human disturbance [21,54,55], study the complex coupling mechanism of wetland ecological processes and hydrological processes, and calculate the ecological water requirement of wetlands, so as to achieve the goal of wetland ecosystem protection and restoration [56,57]. The three water level simulations for HNNR were obtained from the inundation analysis based on DEM of the study area; hence, the simulation results are directly correlated with the topography and the accuracy of DEM [13]. We found that the accuracy validation results for the simulated water level of 60 cm were relatively low and significantly differed from the actual ground features. This is because the actual water level data in 2015 would not have reached 60 cm; therefore, our modelled values significantly differed from those of the actual observations, resulting in a less accurate result. However, with our experimental approach, the accuracy of the landscape classification under both the 20 cm and the 40 cm water level conditions reached over 69%; this result is in high agreement with the actual situation, indicating that our modelling approach of coupling wetland hydrology with vegetation distribution is reliable and scientifically relevant.
However, there are limitations to this approach. The terrain of HNNR is flat, slightly inclined from southwest to northeast, with a relative elevation difference of 7 m, belonging to the alluvial plain of Sanjiang Plain. Therefore, the suitability of this method for areas with a large relative height difference is yet to be verified. Furthermore, this approach is not suitable for study areas where the spatial scale is too large. In addition, Sadinski et al. [58] conducted an interdisciplinary research on the effects of climatic and ecological conditions on wetland landscapes based on multi–year satellite data for four protected areas in the USA; they revealed that the dynamics of the wetland landscapes in the study area were caused by the interaction of temperature and precipitation. Therefore, we should also take meteorological factors into account rather than just hydrological conditions. Zhou et al. [59] extracted the spatial distribution data of wetland plants in HNNR through multi–temporal remote sensing imagery; it was concluded that the changes in the hydrological characteristics of the reserve triggered by the surrounding human activities were the main drivers of the severe degradation of the wetland habitats in HNNR. On this basis, we should also continue to explore the impact of other anthropogenic factors on landscape change in HNNR.

5. Conclusions

By monitoring and simulating the response of the HNNR wetland landscape to hydrological changes during 1998–2018, we drew the following conclusions. During the period of 1998–2018, the overall change in the areas of forest, farmland, and water in the HNNR showed an increasing trend. With 2008 as the turning point (the dam was completed in 2008), the area of marsh showed a decreasing trend until 2008 and an increasing trend after 2008, while the area of meadow as a whole decreased and fell sharply after 2008. In this study, ecological hydrological modeling was used to predict the changes in HNNR wetland landscape pattern under three situations of water level rise. As the water level increased by 20 cm in HNNR, the marsh landscape substantially increased, while the other non–marsh landscapes prominently decreased. The 40 cm water level led to a similar change and a more pronounced change than in the previous scenario; however, when the water level increased to 60 cm, the landscape of the marsh began to significantly decrease. The three simulation scenarios showed that the relationship between wetland vegetation restoration and water level regulation was non–linear, and the water level at 40 cm was the best water level regulation scenario. It was possible to improve the marsh habitat by artificially raising the local water level of HNNR as this facilitated ecosystem recovery. According to the results, at the water level of 40 cm, although the number of marsh patches was decreasing, due to the improvement in ecological connectivity, the marsh area increased by 26.88 km2, and the water area also significantly increased, while the area of forest and meadow decreased. This paper established a quantitative relationship between water level gradients and wetland landscape distribution patterns. By coupling water levels with high resolution topographic data, the spatial pattern changes in the wetlands in HNNR were evaluated with the help of water level regulation; thus, predictions could be made regarding the wetland ecohydrology. This research contributed to the achievement of a dynamic balance between hydrology, biology, and the ecosystems within the wetlands and suggested ways of protecting and restoring the wetland ecosystem as a whole.

Author Contributions

Conceptualization, X.Z. and W.Z.; methodology, X.Z. and M.W.; software, X.Z., Y.L. and J.L.; validation, X.H., J.L. and Y.L.; formal analysis, C.Z.; investigation, S.X., D.Y. and C.Z.; resources, X.H.; data curation, S.X.; writing—original draft preparation, X.Z.; writing—review and editing, W.Z., Y.L. and D.Y.; visualization, X.Z. and J.L.; supervision, W.Z.; project administration, W.Z. and D.Y. All authors have read and agreed to the published version of the manuscript.

Funding

This work was supported by the Open Research Fund of State Key Laboratory of Simulation and Regulation of Water Cycle in River Basin (China Institute of Water Resources and Hydropower Research) [No. IWHR–SKL–KF202201], the National Natural Science Foundation of China [No. 41871097, 41471087]; and the Priority Academic Program Development of Jiangsu Higher Education Institutions [PAPD].

Data Availability Statement

Not applicable.

Acknowledgments

The authors gratefully acknowledge the editors and reviewers for providing suggestions and comments on this paper.

Conflicts of Interest

The authors declare no conflict of interest.

References

  1. Correa-Araneda, F.J.; Urrutia, J.; Soto-Mora, Y.; Figueroa, R.; Hauenstein, E. Effects of the Hydroperiod on the Vegetative and Community Structure of Freshwater Forested Wetlands, Chile. J. Freshw. Ecol. 2012, 27, 459–470. [Google Scholar] [CrossRef]
  2. Yang, J.; Li, E.H.; Cai, X.B.; Wang, Z.; Wang, X.L. Research Progress in Response of Plants in Wetlands to Water Level Change. Wetl. Sci. 2014, 12, 807–813. [Google Scholar] [CrossRef]
  3. Davidson, N.C. How Much Wetland Has the World Lost? Long-term and Recent Trends in Global Wetland Area. Mar. Freshw. Res. 2014, 65, 934–941. [Google Scholar] [CrossRef]
  4. Liu, W.W.; Guo, Z.L.; Jiang, B.; Lu, F.; Wang, H.N.; Wang, D.A.; Zhang, M.Y.; Cui, L.J. Improving Wetland Ecosystem Health in China. Ecol. Indic. 2020, 113, 106184. [Google Scholar] [CrossRef]
  5. Benda, L.; Miller, D.; Barquín, J. Creating a Catchment Scale Perspective for River Restoration. Hydrol. Earth Syst. Sci. 2011, 15, 2995–3015. [Google Scholar] [CrossRef]
  6. You, H.L.; Xu, L.G.; Wu, Y.M.; Liu, G.L.; Wang, X.L.; Liu, L.Z. Influence of Water Regime on Landscape at Typical Delta Wetland in Poyang Lake. Water Power 2017, 43, 1–5+26. [Google Scholar] [CrossRef]
  7. Yan, S.R.; Liu, Q.; Sun, T.; Liang, L.Q.; Li, S.Z.; Yuan, X.M.; Li, M. Research Progress in Wetland Ecohydrological Processes and Their Simulation. Wetl. Sci. 2021, 19, 99–105. [Google Scholar] [CrossRef]
  8. Ellen, W.; Gary, B.; Daniel, C.; Tom, J.C.; Tim, C.; Kirstie, A.F.; Gordon, G.; Robert, G.H.; Stuart, N.L.; Francis, J.M.; et al. Connectivity as an Emergent Property of Geomorphic Systems. Earth Surf. Process. Landf. 2018, 44, 4–26. [Google Scholar] [CrossRef]
  9. Day, J.W.; Christian, R.R.; Boesch, D.M.; Yáñez-Arancibia, A.; Morris, J.; Twilley, R.R.; Naylor, L.; Schaffner, L.; Stevenson, C. Consequences of Climate Change on the Ecogeomorphology of Coastal Wetlands. Estuaries Coasts 2008, 31, 477–491. [Google Scholar] [CrossRef]
  10. Xu, X.L.; Zhang, Q.; Tan, Z.Q.; Li, Y.L.; Wang, X.L. Effects of Water Table Depth and Soil Moisture of Plant Biomass, Diversity, and Distribution at a Seasonally Flooded Wetland of Poyang Lake, China. Chin. Geogr. Sci. 2015, 25, 739–756. [Google Scholar] [CrossRef]
  11. Casanova, M.T.; Brock, M.A. How Do Depth, Duration and Frequency of Flooding Influence the Establishment of Wetland Plant Communities? Plant Ecol. 2000, 147, 237–250. [Google Scholar] [CrossRef]
  12. Todd, M.J.; Muneepeerakul, R.; Pumo, D.; Azaele, S.; Miralles-Wilhelm, F.; Rinaldo, A.; Rodriguez-Iturbe, I. Hydrological Drivers of Wetland Vegetation Community Distribution Within Everglades National Park, Florida. Adv. Water Resour. 2010, 33, 1279–1289. [Google Scholar] [CrossRef]
  13. Yan, D.D.; Luan, Z.Q.; Xu, D.D.; Xue, Y.Y.; Shi, D. Modeling the Spatial Distribution of Three Typical Dominant Wetland Vegetation Species’ Response to the Hydrological Gradient in a Ramsar Wetland, Honghe National Nature Reserve, Northeast China. Water 2020, 12, 2041. [Google Scholar] [CrossRef]
  14. Ryan, M.E.; Palen, W.J.; Adams, M.J.; Rochefort, R.M. Amphibians in the Climate Vise: Loss and Restoration of Resilience of Montane Wetland Ecosystems in the Western US. Front. Ecol. Environ. 2014, 12, 232–240. [Google Scholar] [CrossRef] [PubMed]
  15. Halabisky, M.; Moskal, L.M.; Gillespie, A.; Hannam, M. Reconstructing Semi-arid Wetland Surface Water Dynamics Through Spectral Mixture Analysis of a Time Series of Landsat Satellite Images (1984–2011). Remote Sens. Environ. 2016, 177, 171–183. [Google Scholar] [CrossRef]
  16. Sass, G.Z.; Creed, I.F. Characterizing Hydrodynamics on Boreal Landscapes Using Archived Synthetic Aperture Radar imagery. Hydrol. Process. 2008, 22, 1687–1699. [Google Scholar] [CrossRef]
  17. Nakayama, T.; Maksyutov, S. Application of Process-based Eco-hydrological Model to Broader Northern Eurasia Wetlands through Coordinate Transformation. Ecohydrol. Hydrobiol. 2018, 18, 269–277. [Google Scholar] [CrossRef]
  18. You, H.L.; Fan, H.X.; Xu, L.G.; Wu, Y.M.; Liu, L.Z.; Yao, Z. Poyang Lake Wetland Ecosystem Health Assessment of Using the Wetland Landscape Classification Characteristics. Water 2019, 11, 825. [Google Scholar] [CrossRef]
  19. Powell, S.J.; Letcher, R.A.; Croke, B.F.E. Modelling Floodplain Inundation for Environmental Flows: Gwydir Wetlands, Australia. Ecol. Modell. 2008, 211, 350–362. [Google Scholar] [CrossRef]
  20. Kim, B.; Park, J. Random Ecological Networks that Depend on Ephemeral Wetland Complexes. Ecol. Eng. 2020, 156, 105972. [Google Scholar] [CrossRef]
  21. Beechie, T.J.; Sear, D.A.; Olden, J.D.; Pess, G.R.; Buffington, J.M.; Moir, H.; Roni, P.; Pollock, M.M. Process-Based Principles for Restoring River Ecosystems. BioScience 2010, 60, 209–222. [Google Scholar] [CrossRef]
  22. Zhou, D.M.; Gong, H.L.; Wang, Y.Y.; Khan, S.; Zhao, K.Y. Driving Forces for the Marsh Wetland Degradation in the Honghe National Nature Reserve in Sanjiang Plain, Northeast China. Environ. Model. Assess. 2009, 14, 101–111. [Google Scholar] [CrossRef]
  23. Wu, X.C.; Dong, W.H.; Lin, X.Y.; Liang, Y.K.; Meng, Y.; Xie, W. Evolution of Wetland in Honghe National Nature Reserve from the View of Hydrogeology. Sci. Total Environ. 2017, 609, 1370–1380. [Google Scholar] [CrossRef] [PubMed]
  24. Fu, B.L.; Lan, F.W.; Xie, S.Y.; Liu, M.; He, H.C.; Li, Y.; Liu, L.L.; Huang, L.K.; Fan, D.L.; Gao, E.T.; et al. Spatio-temporal Coupling Coordination Analysis between Marsh Vegetation and Hydrology Change from 1985 to 2019 using LandTrendr Algorithm and Google Earth Engine. Ecol. Indic. 2022, 137, 108763. [Google Scholar] [CrossRef]
  25. Luan, Z.Q.; Deng, W. Study on Hydrological Effects of Human Activities in Sanjiang Plain. Bull. Soil Water Conserv. 2003, 23, 11–14. [Google Scholar] [CrossRef]
  26. Luan, Z.Q.; Deng, W.; Bai, J.H.; Zhu, B.G. Protection of Honghe National Nature Reserve Wetland Habitat. Res. Soil Water Conserv. 2003, 10, 154–157. [Google Scholar] [CrossRef]
  27. Zhou, D.M.; Wang, Z.; Tang, T.; Li, S.H.; Liu, C.L. Prediction of the Changes in Ecological Pattern of Wetlands due to a New Dam Establishment in China. Ecohydrol. Hydrobiol. 2013, 13, 52–61. [Google Scholar] [CrossRef]
  28. Liu, H.Y.; Li, Z.F. Effects of Landscape Change of Wetlands on Habitats of Waterfowls Within Honghe Nature Reserve by Its Surrounding Area. Acta Ecol. Sin. 2008, 28, 5011–5019. [Google Scholar] [CrossRef]
  29. Na, X.D.; Zhang, S.Q.; Kong, B.; Fu, Q.; Li, X.F. Effects of Sanjiang Plain Land Use/Cover Change on Wetland Vegetation Degradation of Honghe Nature Reserve. J. Arid Land Resour. Environ. 2009, 23, 144–150. [Google Scholar] [CrossRef]
  30. Li, H.M.; Gong, Z.N.; Bu, F.; Zhou, D.M. Estimation of Ecological Water Storage of Marsh Wetlands in Honghe National Nature Reserve. Wetl. Sci. 2019, 17, 210–214. [Google Scholar] [CrossRef]
  31. Wang, Z.X.; Luan, Z.Q.; Liu, G.H. Respondence of Vegetation to Soil Environmental Factors in Riparian Wetlands of Nongjiang River, Honghe National Nature Reserve. Wetl. Sci. 2013, 11, 54–59. [Google Scholar] [CrossRef]
  32. Zhao, D.S.; Wu, Z.F.; Shang, L.N. Study on the Ecological Water Requirement of Wetland in Honghe National Nature Reserve. Wetl. Sci. 2004, 2, 133–138. [Google Scholar] [CrossRef]
  33. Yu, X.Y.; Zhao, G.X.; Chang, C.Y.; Yuan, X.J.; Wang, Z.R. Random Forest Classifier in Remote Sensing Information Extraction: A Review of Applications and Future Development. Remote Sens. Inf. 2019, 34, 8–14. [Google Scholar] [CrossRef]
  34. Lou, Y.J.; Zhao, K.Y. Correlation between Plant Species Diversity of Main Vegetation Types and Surface Soil Properties in Wetland of Honghe Nature Reserve. Wetl. Sci. 2008, 6, 45–50. [Google Scholar] [CrossRef]
  35. Ni, H.W.; Gao, Y.H.; Yang, L.P. A Study on The Ecosystem Diversity and The Flora of Grassland Plants in The Honghe Nature Reserve. Biodiversity and the Future of Humanity. In Proceedings of the Second National Symposium on Biodiversity Conservation and Sustainable Utilization, Beijing, China, 20 November 1996. [Google Scholar]
  36. Wang, X.H.; Luan, Z.Q.; Yan, D.D.; Wang, Z.X. Niche of 17 Kinds of Plants in Marshes in Honghe. Wetl. Sci. 2015, 13, 49–54. [Google Scholar] [CrossRef]
  37. Zhou, R.C.; Fu, C.J.; Lin, J.; Wang, Y.J.; Wang, J.X. Honghe Marsh Nature Reserve. Nat. Resour. Res. 1984, 79–87. [Google Scholar] [CrossRef]
  38. Lou, Y.J.; Zhao, K.Y.; Ma, K.P. Change in Floristic Composition and Species Diversity of Plant Community Along Environment Gradient in Honghe Nature Reserve China. Acta Ecol. Sin. 2007, 27, 3883–3891. [Google Scholar] [CrossRef]
  39. Urban, K.E. Oscillating Vegetation Dynamics in a Wet Heathland. J. Veg. Sci. 2005, 16, 111–120. [Google Scholar] [CrossRef]
  40. Yu, H.; Zhang, S.Q.; Kong, B. Digital Simulation for Flood Inundation of Degenerate Marshes—A Case of Honghe National Nature Reserve. Wetl. Sci. 2008, 6, 506–511. [Google Scholar] [CrossRef]
  41. Cheng, Y.J.; Li, H.; Xie, W.; Zhu, Y.; Nie, W. Analysis and method of Flood Inundation in Shanmei Reservoir. Sci. Technol. Eng. 2023, 23, 7631–7639. [Google Scholar] [CrossRef]
  42. Sun, J.; Xi, S.Y.; You, D.; Zheng, F.T. Analysis and 3D Simulation of Flood Inundation Based on ArcGIS System. Urban Geol. 2012, 7, 31–33+37. [Google Scholar] [CrossRef]
  43. Ran, D.; Luo, X.S.; Long, J.X.; Fan, Y.J.; Wang, Z.H. Flood Disaster Simulation and Assessment in Karst Mountain Area Based on Active Submergence Algorithm. Surv. Mapp. 2021, 44, 267–270. [Google Scholar] [CrossRef]
  44. Liu, X.T.; Ma, X.H. Influence of Large-Scale Reclamation on Natural Environment and Regional Environmental Protection in the Sanjiang Plain. Sci. Geogr. Sin. 2000, 20, 14–19. [Google Scholar] [CrossRef]
  45. Xie, S.Y.; Yan, D.D.; Li, J.T.; Liu, Y.; Sheng, Y.F.; Luan, Z.Q. GEE-Based Spatial-Temporal Dynamics in a Ramsar Wetland, Honghe National Nature Reserve, Northeast China from 1985 to 2021. Land 2022, 11, 2137. [Google Scholar] [CrossRef]
  46. Dai, L.Y.; Wang, W.F.; Chen, W.G. Construction of Wetland Protection Project in Honghe National Nature Reserve. Mod. Agric. 2008, 22–23. [Google Scholar] [CrossRef]
  47. Shen, Z.Y. Land Use/Land Cover Classification and Accuracy Evaluation for Long Time Series Landsat Images from 1987 to 2019 in the Huangshui River Watershed. Master’s Thesis, Qinghai Normal University, Xining, China, 2020. [Google Scholar]
  48. Liu, J.P.; Du, B.J.; Sheng, L.X.; Tian, X.Z. Dynamic Patterns of Change in Marshes in the Sanjiang Plain and Their Influential Factors. Adv. Water Sci. 2017, 28, 22–31. [Google Scholar] [CrossRef]
  49. Ning, S.; Ke, K.; Yu, M.; Chen, X.M.; Li, Y.Z.; Zhou, D.; Zhan, C.; Yang, J.S.; Yu, Y.; Zhang, J.J.; et al. Prediction about Areas of Various Types of Land Cover in Honghe National Nature Reserve in 2023. Wetl. Sci. 2019, 17, 80–87. [Google Scholar] [CrossRef]
  50. Yin, S.B.; Shen, F.; Fu, B.L. Study on the Theory and Method for Determining Wetland “Water Stage-duration-frequency” Thresholds. Adv. Water Sci. 2016, 27, 476–484. [Google Scholar] [CrossRef]
  51. Maingi, J.K.; Marsh, S.E. Assessment of Environmental Impacts of River Basin Development on the Riverine Forests of Eastern Kenya Using Multi-temporal Satellite Data. Int. J. Remote Sens. 2001, 22, 2701–2729. [Google Scholar] [CrossRef]
  52. Wan, L.H.; Zhang, Y.W.; Zhang, X.Y.; Qi, S.Q.; Na, X.D. Comparison of Land Use/Land Cover Change and Landscape Patterns in Honghe National Nature Reserve and the Surrounding Jiansanjiang Region, China. Ecol. Indic. 2015, 51, 205–214. [Google Scholar] [CrossRef]
  53. Yang, S.Y.; Yan, D.H.; Li, Y.; Hu, D.L.; Yu, X.; Zhang, M.Z. Progress of Eco-hydrological Coupling Research. Water Resour. Hydropower Eng. 2009, 40, 1–4+8. [Google Scholar] [CrossRef]
  54. Mo, X.G.; Lin, Z.H.; Liu, S.X. Climate Change Impacts on the Ecohydrological Processes in the Wuding River Basin. Acta Ecol. Sin. 2007, 27, 4999–5007. [Google Scholar] [CrossRef]
  55. Yang, D.W.; Lei, H.M.; Cong, Z.T. Overview of the Research Status in Interaction Between Hydrological Processes and Vegetation in Catchment. Shuili Xuebao/J. Hydraul. Eng. 2010, 41, 1142–1149. [Google Scholar] [CrossRef]
  56. Xiao, Y.; Zhang, X.; Wang, M.; Deng, Z.M. Preliminary Study on Eco-hydrological Process Simulation of Typical Wetland of Beach in Poyang Lake. Yangtze River 2019, 50, 31–36+112. [Google Scholar] [CrossRef]
  57. Yang, Z.F. Study on Ecological Water Demand of River Marsh System Based on Water Flow Process. Ph.D. Thesis, China Institute of Water Resources and Hydropower Research, Beijing, China, 2019. [Google Scholar]
  58. Sadinski, W.; Gallant, A.L.; Roth, M.; Brown, J.; Senay, G.; Brininger, W.; Jones, P.M.; Stoker, J. Multi-year Data from Satellite and Ground-based Sensors Show Details and Scale Matter in Assessing Climate’s Effects on Wetland Surface Water, Amphibians, and Landscape Conditions. PLoS ONE 2018, 13, e0201951. [Google Scholar] [CrossRef]
  59. Zhou, D.M.; Gong, H.L.; Hu, J.M.; Zhao, K.Y. Probe into the Landscape Pattern of Freshwater Wetland Communities—A Case Study in the Honghe National Nature Reserve in Sanjiang Plain, China. J. Nat. Resour. 2007, 1, 86–96. [Google Scholar] [CrossRef]
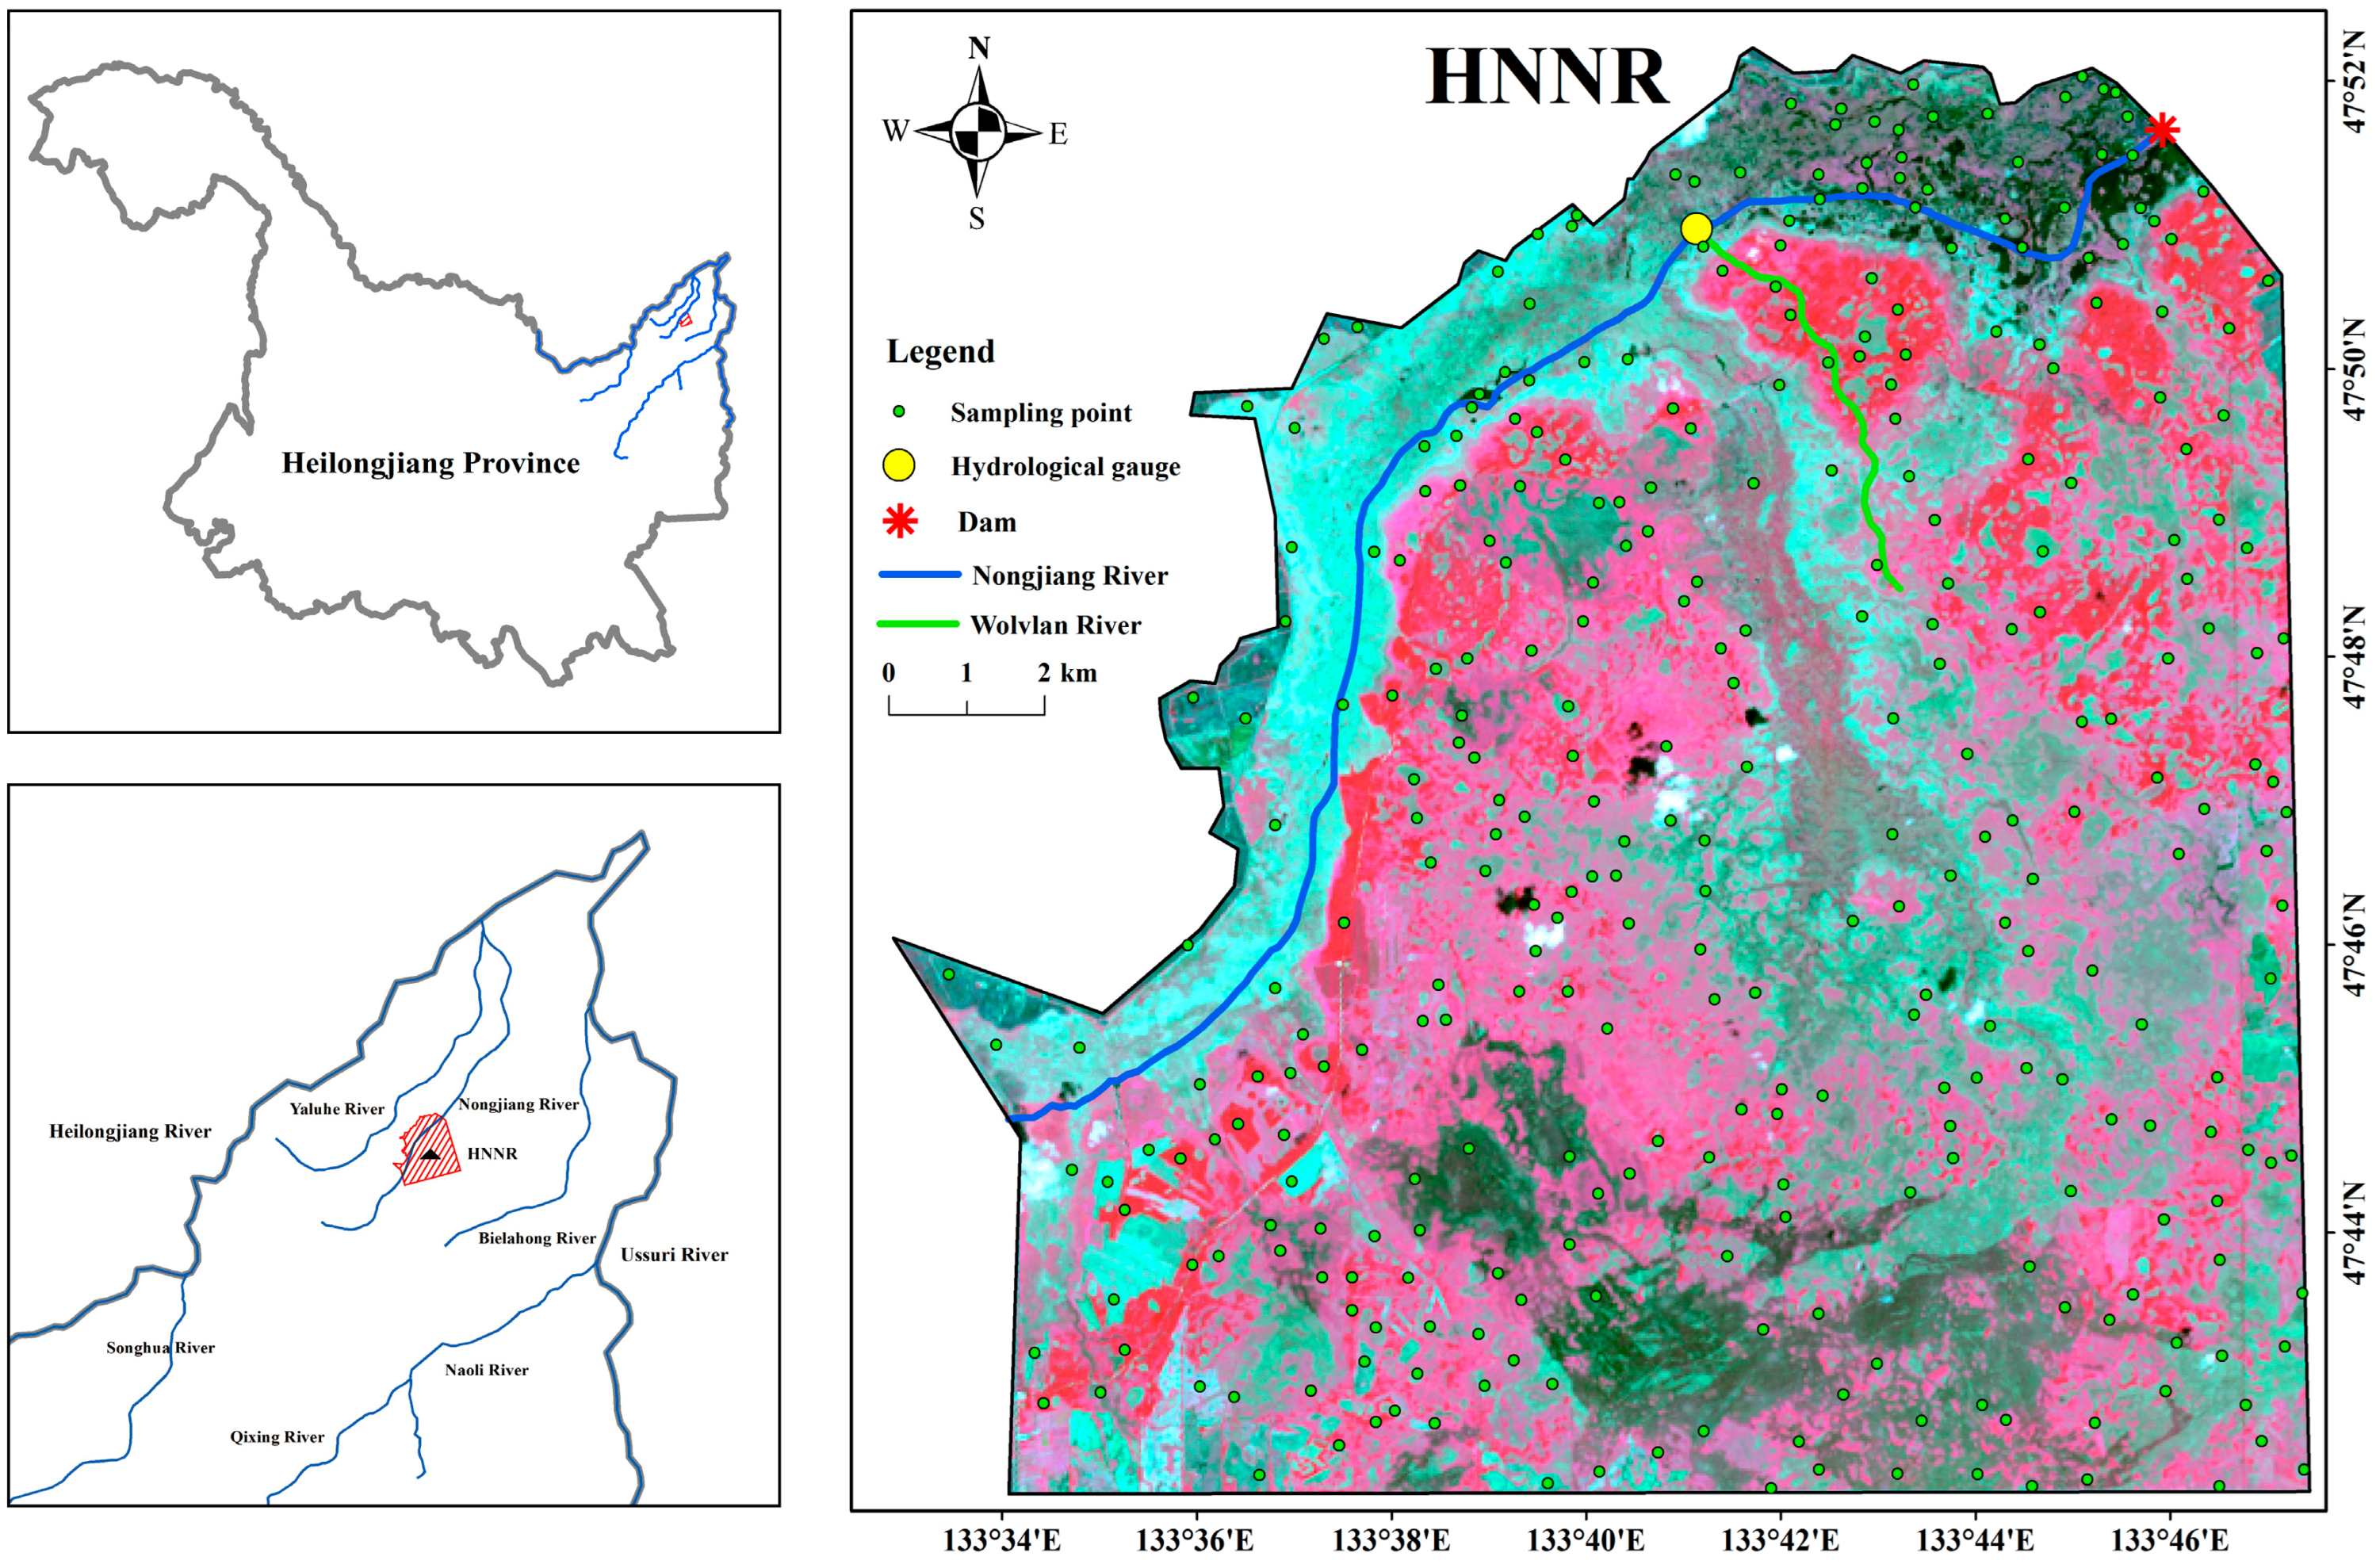
Figure 1. The geography of Honghe National Nature Reserve (HNNR).
Water 15 03350 g001
Figure 2. A 3D visual map of HNNR.
Water 15 03350 g002
Figure 3. Spatial distribution of typical vegetation communities and their suitable habitat characteristics in the wetlands of HNNR.
Water 15 03350 g003
Figure 4. Change in the depth of the surface water in HNNR prior to and following the construction of the dam: (a) water depth before dam construction; (b) water depth at 40 cm increase in water level after dam construction; (c) a different map between (a,b).
Water 15 03350 g004
Figure 5. Spatial and temporal dynamics of different landscape types in HNNR from 1998 to 2018: (a) wetland landscape pattern in 2006; (b) wetland landscape pattern in 2012.
Water 15 03350 g005
Figure 6. Wetland landscape area changes in HNNR during 1998–2018: (a) changes in the area of marsh from 1998 to 2018; (b) changes in the area of meadow from 1998 to 2018; (c) changes in the area of forest from 1998 to 2018; (d) changes in the area of farmland from 1998 to 2018; (e) changes in the area of water from 1998 to 2018.
Water 15 03350 g006
Figure 7. Changes in wetland landscape patterns in HNNR before and after water level rise: (a) landscape patterns in HNNR extracted from remote sensing imagery in 2008; (bd) landscape patterns in HNNR based on three water level projection scenarios (20, 40, and 60 cm water level increase).
Water 15 03350 g007
Table 1. Three manual adjustments for changes in landscape characteristics before and after water level.
Vegetation TypeWater Level ChangesNumber of Patches (Piece)Area (km2)AI (%)
MarshThe original water level167118.2494.86
△Δ20 cm998136.2389.81
Δ40 cm906145.1292.48
Δ60 cm258127.4894.22
MeadowThe original water level137102.0992.90
Δ20 cm69277.288.12
Δ40 cm31542.9188.81
Δ60 cm2239.4784.46
ForestThe original water level8720.3790.68
Δ20 cm467.3588.68
Δ40 cm354.4788.65
Δ60 cm273.2389.70
FarmlandThe original water level3410.3592.81
Δ20 cm3410.3592.81
Δ40 cm3410.3592.81
Δ60 cm3410.3592.81
WaterThe original water level10.0490.48
Δ20 cm69719.9679.31
Δ40 cm51348.2488.15
Δ60 cm241100.5694.39
Table 2. Accuracy of prediction results in scenarios of 20 cm, 40 cm, and 60 cm.
Year20 cm (Year 2009)40 cm (Year 2012)60 cm (Year 2015)
Type PAUAPAUAPAUA
Marsh0.700.5610.5110.4
Meadow0.570.460.350.410.050.25
Forest0.350.780.310.151
Farmland0.8510.910.80.94
Water10.831110.76
OA69.31%71%60%
Kappa coefficients0.620.640.5
Disclaimer/Publisher’s Note: The statements, opinions and data contained in all publications are solely those of the individual author(s) and contributor(s) and not of MDPI and/or the editor(s). MDPI and/or the editor(s) disclaim responsibility for any injury to people or property resulting from any ideas, methods, instructions or products referred to in the content.