Article

Land Use and Land Cover Change Modulates Hydrological Flows and Water Supply to Gaborone Dam Catchment, Botswana

by
Bisrat Kifle Arsiso
1,2,* and
Gizaw Mengistu Tsidu
1,*
1
Department of Earth and Environmental Sciences, Botswana International University of Technology and Science, Priv. Bag 16, Palapye 10071, Botswana
2
Department of Environment and Climate Change, Ethiopian Civil Service University, Addis Ababa P.O. Box 5648, Ethiopia
*
Authors to whom correspondence should be addressed.
Water 2023, 15(19), 3364; https://doi.org/10.3390/w15193364
Submission received: 4 August 2023 / Revised: 28 August 2023 / Accepted: 6 September 2023 / Published: 25 September 2023

Abstract

:
Identifying the mechanism through which changes in land use and land cover (LULC) modulate hydrological flows is vital for water resource planning and management. To examine the impact of LULC change on the hydrology of the Gaborone Dam catchment within the upper Limpopo basin, where Notwane river is the major river within the catchment, three LULC maps for the years 1997, 2008, and 2017 were established based on a mosaic of Landsat 5 for 1997 and 2008 and Landsat 8 for 2017. The 10 m-resolution Version 200 ESA World Land Cover Map for 2021 is used as a ground truth to train the random forest (RF) classifier to identify land cover classes from Landsat 8 imageries of 2021 using the Google Earth Engine (GEE) Python API. The overall accuracy/kappa coefficient of the RF classifier is 0.99/0.99 for the training and 0.73/0.68 for the validation data sets, which indicate excellent and substantial agreements with the ground truth, respectively. With this confidence in the LULC classification, the impact of LULC change on the hydrological flow within the catchment was estimated by employing the Soil and Water Assessment Tool (SWAT) and indicator of hydrological alteration (IHA). The SWAT model calibration and validation were first performed, and the ability of the model to capture the observed stream flow was found to be good. The LULC maps from Landsat images during the 1997–2017 period show a decrease in forests and shrubland in contrast to an increase in pasture land. The expansion of pasture and cropland and the reduction in forests and shrubland led to a decline in the amount of evapotranspiration and groundwater recharge. Furthermore, the LULC change also caused a reduction in low flow during dry periods and an increase in high flow during the rainy season. The findings clearly demonstrate that LULC changes can affect the water table by altering soil water recharge capacity. The study highlighted the importance of LULC for catchment water resource management through land use planning to regulate the water level in the Gaborone Dam against the impact of climate change and growing water demands by the city of Gaborone due to population growth.

1. Introduction

Water is a key resource in the development of society and its economy globally. However, this vital resource is under pressure from land-use change, increasing global population, water pollution, and climate change. These are major challenges facing sustainable development [1,2,3]. Freshwater resources in Southern Africa have become limited as the countries’ population and economy have considerably increased through the last four decades [4,5,6]. Limpopo Basin is one of the most populated basins in the Southern African regions. According to the 2007 estimate, the population of the Limpopo Basin is about 14.5 million people, which includes 69% of Botswana, 22% of South Africa, 7% of Mozambique, and 10% of Zimbabwe’s respective total population [7,8]. In addition, climate change is also causing another strain on freshwater resources in the region, aggravating the imbalance between water demand and supply [9]. Recent climate change models suggest that rising temperatures and rainfall extremes are likely to increase runoff irregularity on river basins in Botswana [10]. Climate extremes such as droughts and flash floods have become more prevalent than in the past. For example, during the prolonged drought of 2015–2016, the seasonal rainfall in the region fell below 20% of the seasonal climatology [11]. Heat waves also occurred in 2015, leading to a few fatalities in the region. Cyclone Dineo in 2017 and heavy rain in 2018 led to flash floods and overtopping of dams in the region [11].
Botswana is a semi-arid country with erratic rainfall patterns resulting in low total annual rainfall (475 mm per year) and, consequently, high uncertainty in water resource availability [12]. Considering the low rainfall and high rainfall variability, water management is important for the optimal use of the available water resources [13] and for meeting the growing water demand in Botswana attributed to population growth [13,14,15]. The population in Botswana has increased from 650,832 in 1968 to nearly 2.4 million in 2021 at an annual growth rate of 1.94% [16,17]. Botswana has nine surface water-sourced dams, namely the Gaborone, Bokaa, Nnywane, Letsibogo, Ntimbale, Shashe, Lotsane, Dikgathong and Thune dams. Botswana also receives additional water from the Molatedi dam located in the Republic of South Africa. The Dikgathong and Gaborone Dams are the two largest dams, with a capacity of 400 and 141.4 million cubic meters (MCM), respectively [18].
The Gaborone Dam, with supplementation from the integrated North-South Carrier (NSC) water supply system (WSS), is responsible for providing potable water to the city of Gaborone and its surrounding villages. Rainfall is the major source of water in this catchment, as elsewhere in most arid and semi-arid catchments. Some of the rain water is also consumed by plants and evaporated as green water from moist soil surfaces [19]. Blue water, which fills aquifers, streams, artificial reservoirs, or dams, is eventually used by aquatic ecosystems and society [20]. Green water is mostly available in the form of soil moisture and used through evaporation by different ecosystems [21]. Therefore, both blue water (surface water within streams and artificial reservoirs or dams) and green water (water evaporated by plants) sustain human needs and ecological functions [19]. In this study, the impact of LULC on the vital source of water for the city of Gaborone and surrounding villages was investigated. In this regard, previous studies have shown that both blue and green water are affected by the LULC change and climate [22,23]. The process of hydrology (e.g., groundwater recharge, infiltration, loss by evapotranspiration, soil moisture storage, etc.) is also affected by LULC and results in alterations of catchment water resources [23]. The changes in LULC affect the physiography of the catchment of a basin (e.g., vegetation cover and surface roughness), which has an effect on surface runoff, volume, and groundwater recharge, causing streamflow alterations [24]. Understanding these alterations and quantifying them is important. To this end, hydrological modeling and observations are usually employed.
In hydrological modeling, an accurate estimation of streamflow is very crucial. The distinct features of hydro-climatological variables in semi-arid and arid catchments are the most challenging factors [25]. Furthermore, it is also challenging that most catchments in semi-arid and arid areas are ungauged. Several models are used in hydrological studies; nevertheless, the physics-based models of rainfall–runoff have been verified to be robust in the estimation of streamflow because of their clear formulation of the runoff-generation strategy [22,26]. Considering this, it is essential to explore and monitor the catchment characteristics and its variable performance influencing its dynamics [27]. The SWAT model is a semi-distributed, continuous-time, and process-based model developed and supported by the research of the United States Department of Agriculture (USDA) and broadly employed by researchers [28,29,30]. The SWAT was developed to evaluate the practice of land use management impact, such as chemical use for improving agricultural yields and increase in sediment loads in catchments due to different land use and soil conditions on water resources [31]. Water balance is the core component of the SWAT model. The different components of water balance can be used to model the growth of plants and the movement of sediments, pathogens, pesticides, and nutrients in the catchment [30]. For surface water supply management, the water balance of the catchment is one of the determinants that shows the stream inflows into the dam and consequently affects the water supply system [32].
The main input data used in the SWAT model are the digital elevation model (DEM), soil types, LULC, and daily weather data, including minimum and maximum air temperature, precipitation, solar radiation, wind speed, and relative humidity. These inputs are used to define the hydrologic response unit (HRU), which represents the smallest spatial unit of the catchment having homogenous soil properties, LULC, and slope information [14,29,33,34]. DEM and LULC data are usually obtained from high-resolution satellite observations, unlike daily weather data, which are available from ground observations taken by meteorological stations. Moreover, the satellite observations are not direct observations and need some form of data processing to obtain the required variables, such as LULC. For example, ground truth and satellite data should be combined in the framework of supervised image classification to obtain LULC. Several image classification machine learning (ML) algorithms (e.g., Support Vector Machine (SVM), Artificial Neural Network (ANN), classification and regression trees (CART), and random forest (RF)) have been developed. In recent decades, LULC classification of satellite images using the random forest (RF) classifier [35] has obtained high acceptance due to its excellent performance in capturing LULC classes with better accuracy [36,37,38]. The random forest (RF) classifier uses ensemble decision trees [35]. In addition, the RF classifier is efficient in the selection of the variables that would normally be time-consuming, subjective, and error-prone [39].
Therefore, the SWAT is used in this study to assess the impact of LULC changes on the water resource in the Gaborone Dam catchment, and the needed input data were acquired as described above. In addition to its performance and functionality described in the preceding paragraphs, the SWAT model was used mainly because it has a multidimensional methodology to assess the catchment water yield, baseflow, and surface runoff [40]. To evaluate the LULC effect on hydrological flow, the SWAT model has better performance during a simple water balance approach [41,42]. In semi-arid climate areas, the curve number (CN) simulating method of the SWAT model performed well in estimating surface runoff at high precipitation intensity, although the model underestimated surface runoff [43]. The aim of this study is primarily to assess the effects of LULC change on stream flow processes at the watershed level. Also, this study aims to evaluate the spatial and temporal availability and distribution of hydrological variables due to LULC change using the SWAT and indicator of hydrological alteration (IHA) tool to estimate the amount of change in the hydrological flow due to LULC change in the Gaborone Dam catchment. The rest of the paper is organized such that data and methods are given in Section 2; the results on the LULC classification accuracy assessment, stream flow calibration and validation for the model, sensitive parameter identification to the streamflow model performance assessment, and impacts of LULC changes on hydrology are presented in Section 3; the discussion is presented in Section 4; and finally, the conclusion is given in Section 5.

2. Materials and Methods

2.1. Study Area

The Gaborone Dam catchment is located in southern Botswana and extends from the southern part of the Notwane catchment to the southeast of the city of Gaborone (Figure 1). The catchment has an area of about 4278.2 km2. The Gaborone Dam sub-catchment is part of the Notwane catchment and Limpopo Basin. The catchment is drained by the Nnywane, Metsemaswaane, Taung, and Notwane rivers. The population within the Gaborone Dam catchment is about 111,612 [44]. The Gaborone Dam catchment is the main source of water for the city of Gaborone and the town of Lobatse. The average precipitation at the dam is about 450 to 550 mm/annum, the monthly maximum temperature is about 37 °C, and the monthly minimum temperature is about 3.1 °C.

2.2. Data and Data Quality Control

2.2.1. Hydrometeorological Data

Streamflow and meteorological data are needed to calibrate and validate the SWAT model. The meteorological data used in this study are daily rainfall, maximum and minimum temperature, wind speed, relative humidity, and solar radiation from 1982 to 2017. All the data were acquired from the NASA POWER observation repository. The monthly stream flow data for the period of 1982–2001 used in the paper was obtained from the Southern African Science Service Centre for Climate Change and Adaptive Land Management (SASSCAL) information portal. The SASSCAL daily inflow to the Gaborone Dam catchment was calculated using a rating curve from gauge height [45]. The boundaries of the catchment (sub-watershed and watershed), river networks, reclassification of slope, and hydrologic response units (HRUs) were established from the DEM. Soil moisture and evapotranspiration from two reanalysis models are used to evaluate the ability of the SWAT to reproduce the two parameters in addition to stream flow. Evapotranspiration is obtained from the Global Land Data Assimilation System (GLDAS) version 2.1. The GLDAS-2.1 reanalysis began on 1 January 2000, employing the conditions from the GLDAS-2.0 output. GLDAS-2.1 is forced with atmospheric fields from the National Oceanic and Atmospheric Administration (NOAA)/Global Data Assimilation System (GDAS) [46], the grided daily analysis precipitation of Global Precipitation Climatology Project (GPCP) V1.3 [47,48], and radiation fields from the Air Force Weather Agency’s AGRicultural METeorological modeling system (AGRMET). Soil moisture is calculated from the soil infiltration rate obtained from The Modern-Era Retrospective Analysis for Research and Applications, version 2 (MERRA-2). MERRA-2 is planned to serve as an intermediate reanalysis, one that leverages recent developments at GMAO in modeling and data assimilation to address some of the known limitations of the earlier version. Details of the improvement and capabilities of MERRA-2 can be found in several past studies in the literature [49,50,51].

2.2.2. SPATIAL Data

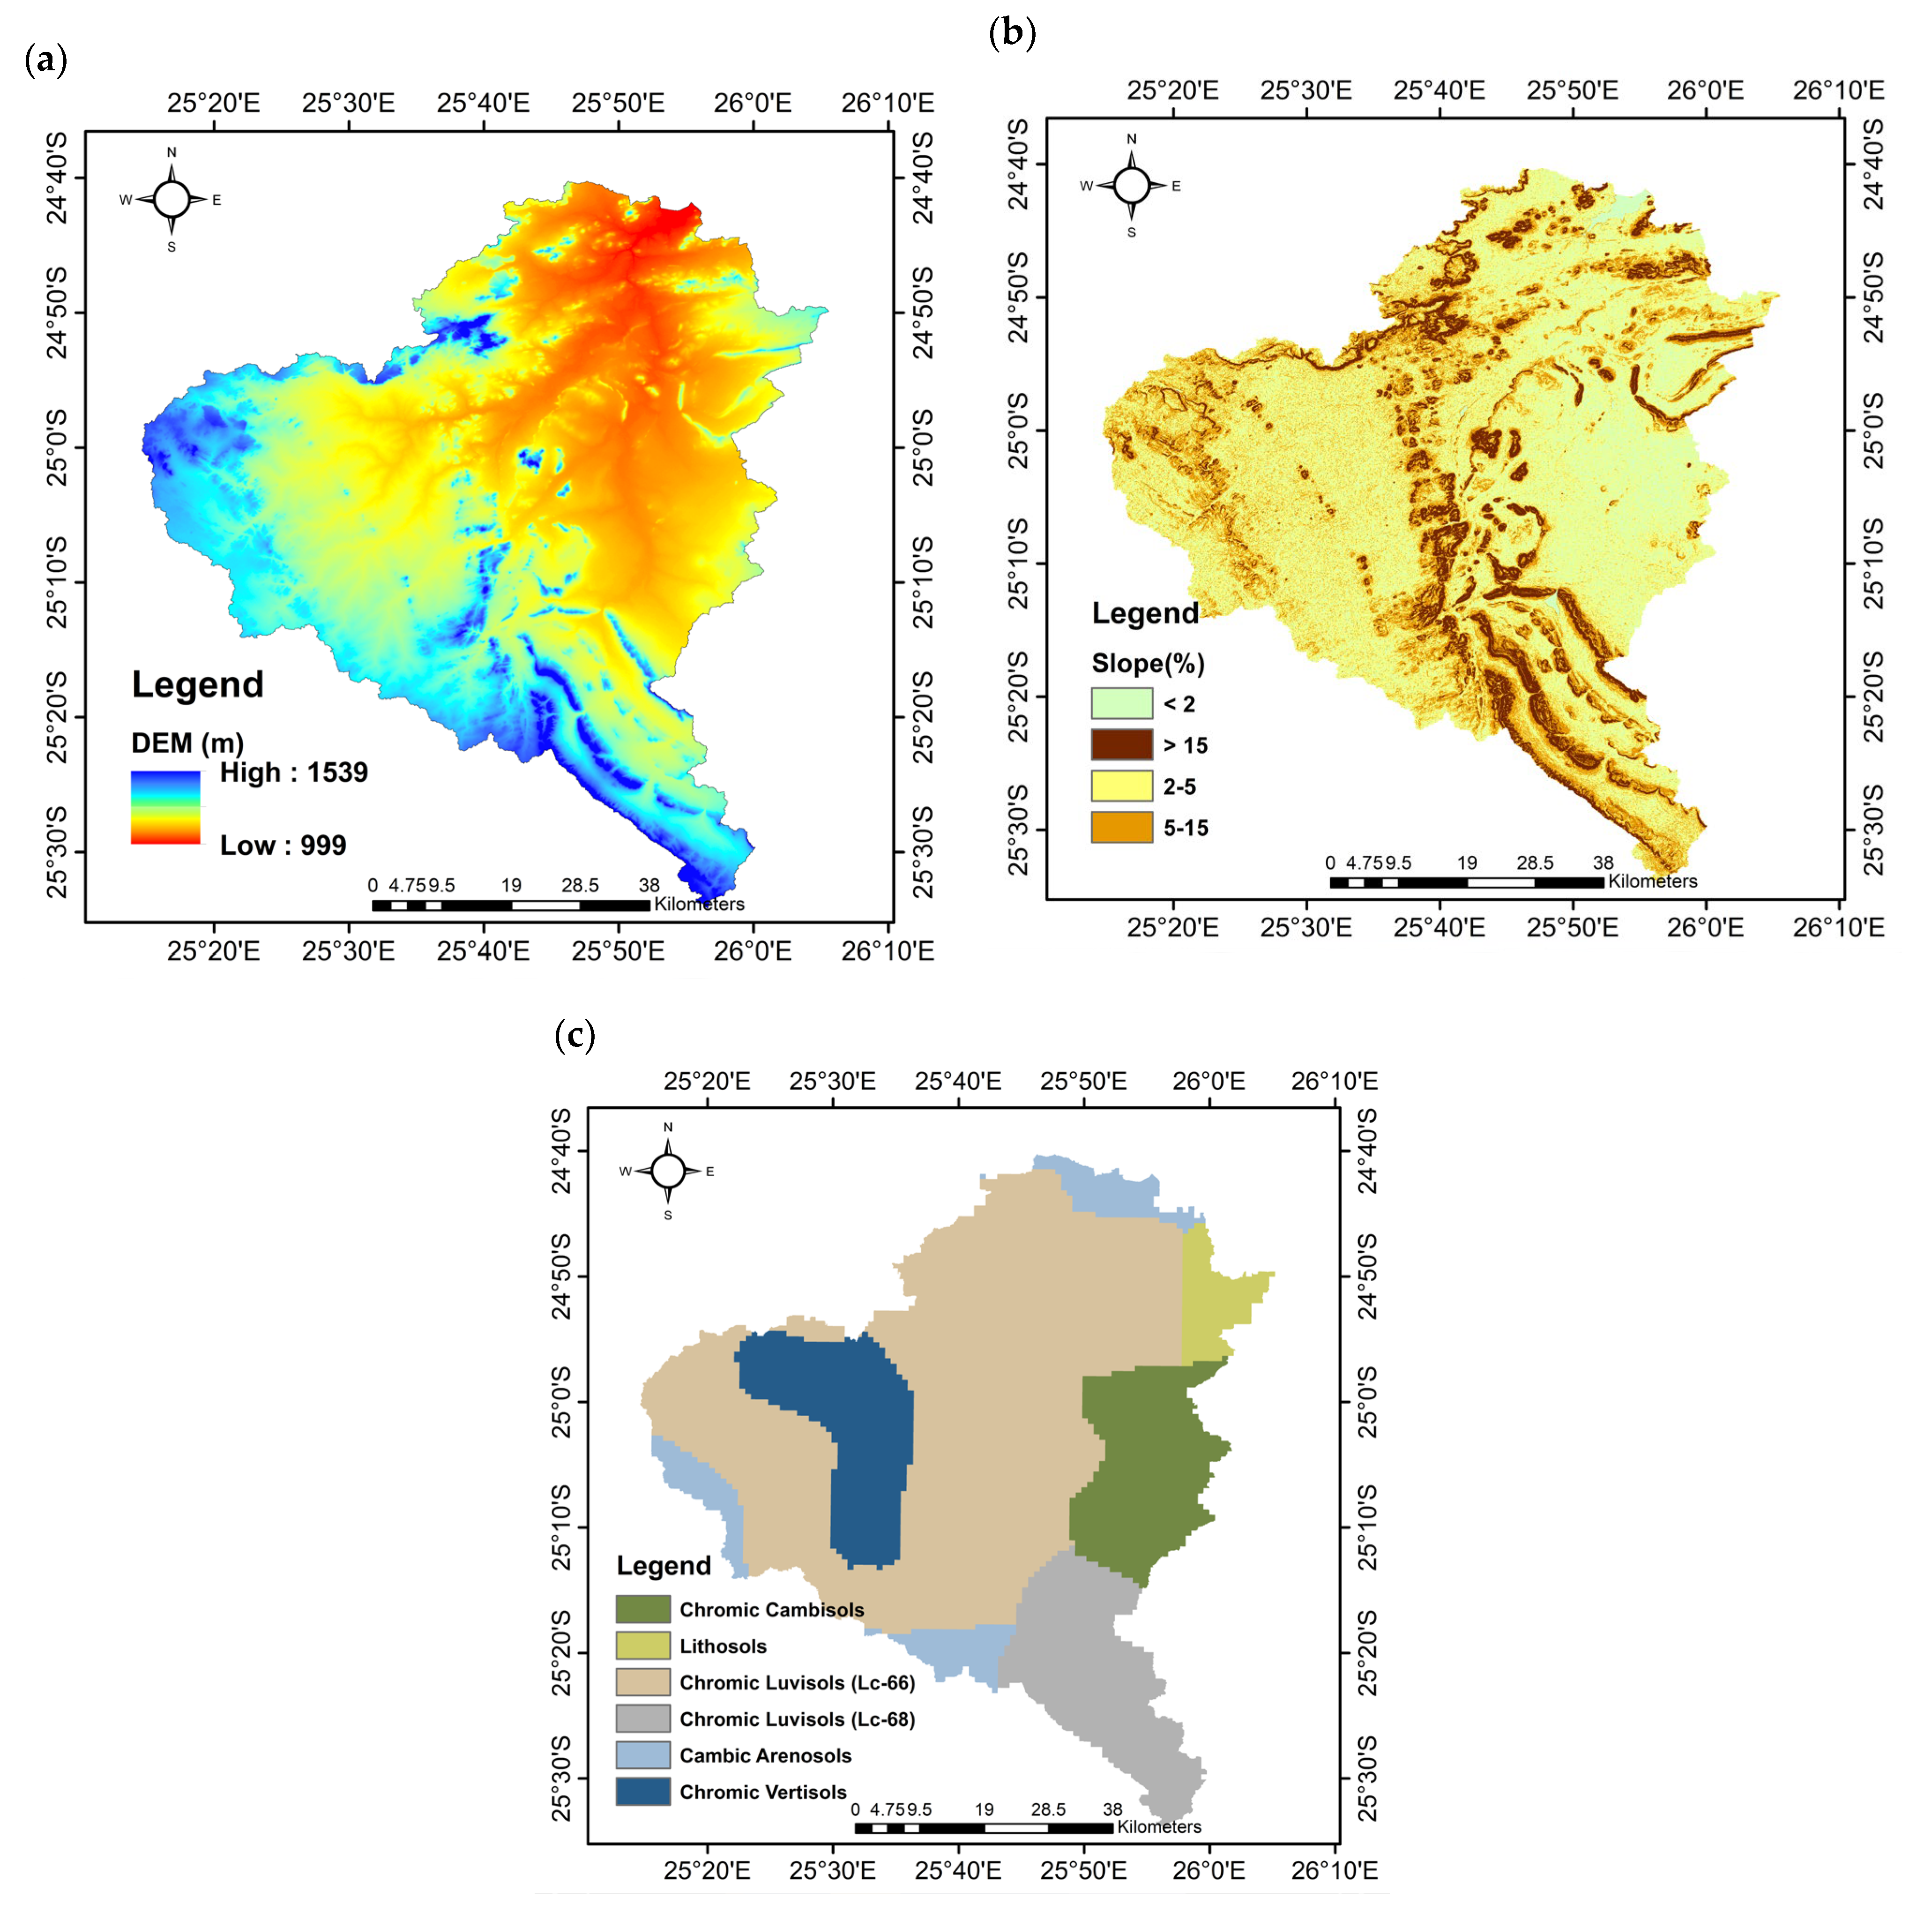
The SWAT model requires spatial data input, including DEM, soil type, LULC, and weather data. The DEM data with a spatial resolution of 30 m × 30 m are downloaded from USGS Earth Explorer (Figure 2a), from which slope classes are identified (Figure 2b). Soil also has a major influence on hydrologic models. Different soil classes were defined based on FAO-UNESCO soil databases. The soil data contains soil texture, Hydrological Soil Group (HSG), soil depth, organic carbon content, and rock fragments [52].
The Gaborone Dam catchments have six major soil types. In Figure 2c, the soil type in the basin is dominated by Chromic Luvisol soils (68.35%, with texture of sandy clay loam), followed by Chromic Cambisol (11.1%, with its texture sandy clay), Chromic Vertisol (10.65%, with clay texture), and Cambic Arenosol soils (6.7%—sandy loam texture) and Lithosol groups (3.2% clay loam texture).
For the LULC assessment, we used the Google Earth Engine (GEE), which provides a cloud-computing platform for satellite image processing. The GEE is a web-based graphical user interface that gives access to different data sets and catalogs of Remote Sensing (RS) imagery through Google’s computational infrastructure [53]. The satellite image processing in the GEE can be conducted by employing a JavaScript code editor platform or the GEE Python API within a Google Colab code editor environment [54]. In this study, the GEE Python API with the Google Colab code editor is used for classifying LULC from Landsat 5 for the years 1997 and 2008 and Landsat 8 imageries for the year 2017. The Version 200 ESA World Land Cover Map for 2021 with a resolution of 10 m is used as ground truth to train the LULC classifier based on Landsat mosaic images. The classifier trained based on ground truth and Landsat mosaic images of 2021 is then applied to reflectance images from Landsat 5 and 8 images, with a spatial resolution of 30 m, to determine LULC in 1997, 2008, and 2017 over the catchment.

2.2.3. LULC Classification Accuracy Assessment

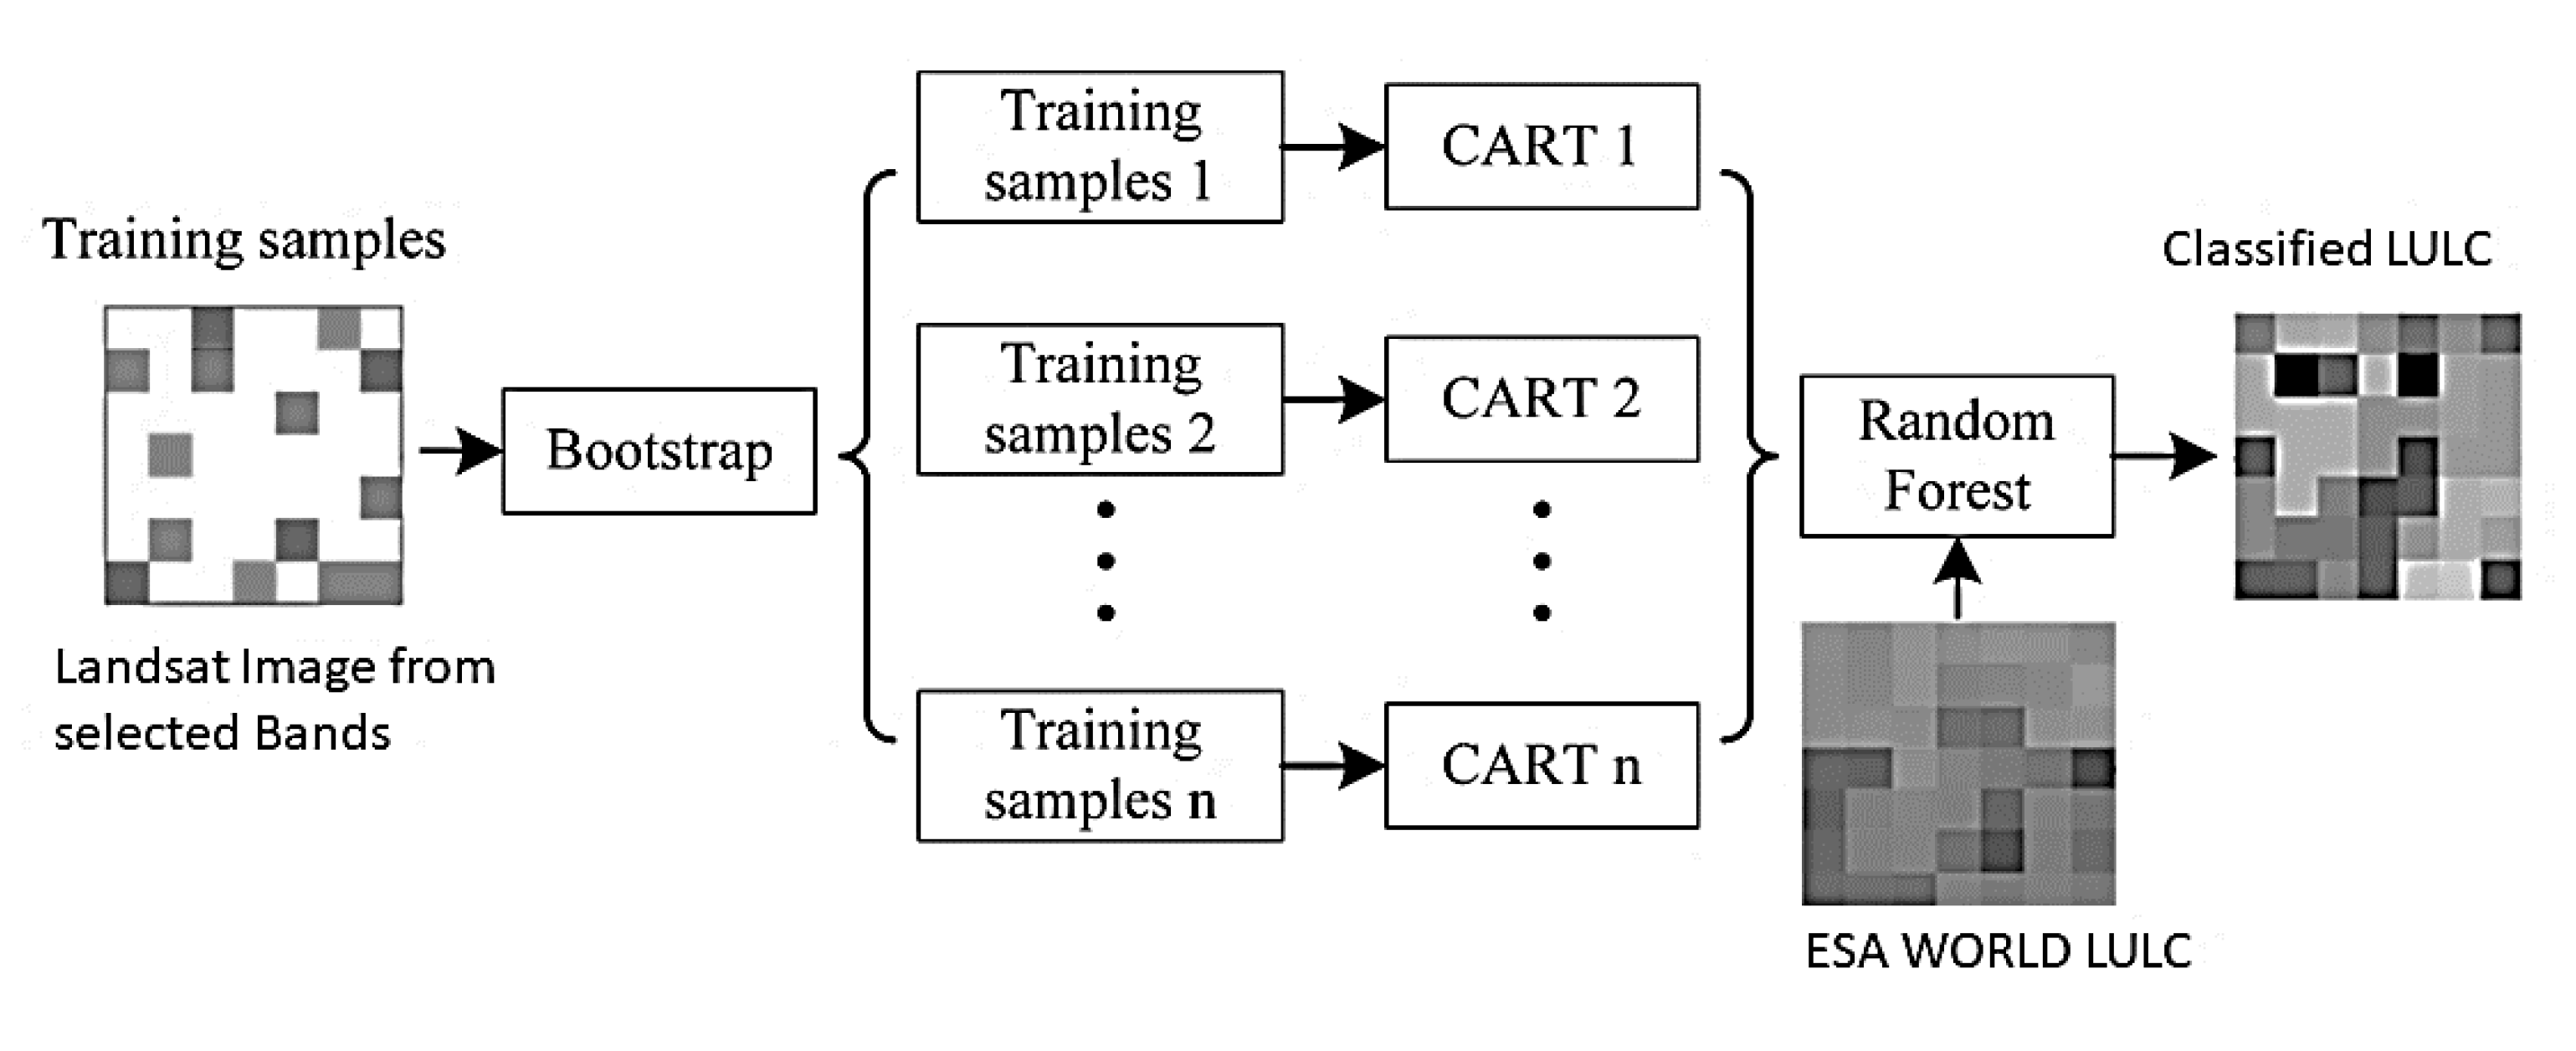
The RF classifier, which is an ensemble classifier most commonly used for its reliability and robustness [35], is used in this study. RF is a group of independent individual classification and regression tree (CART) classifiers. RF generates multiple decision trees based on variables and training data sets selected randomly. The two hyperparameters for RF are the number of trees to be grown in the forest and the number of randomly selected predictor parameters, both of which are user-defined parameters. The ideal number of trees ranges from 100 to 500 counts [39]. In this study, 120 trees, level 2 (L2), tier 1 (T1) reflectance containing 6 bands (ST_B2, ST, ST_B3, ST_B4, ST_B5, ST_B6, and ST_B7) of Landsat 8, and emissivity of Band 10 estimated from ASTER GED (ST_EMIS), Level-1 thermal band converted to thermal surface radiance (ST_TRAD), and Upwelled Radiance (ST_URAD) are used as inputs to the RF classifier. The number of trees in this study is chosen as a trade-off between the convergence of the RF classifier and the attained accuracy of both the training and validation data sets. The number of training and validation samples n, which is 8000 in this study, were selected using a stratified sampling as shown in Figure 3. The choice of the bands of Landsat 8 used as inputs in this study is based on common bands of Landsat 5 and Landsat 8 in order to allow the trained RF classifier to be used for the classification of Landsat 5 images. The RF classifier is trained to classify Landsat 8 mosaic images for the period October 2020 to May 2021 using Version 200 ESA World Land Cover Map for 2021 as a ground truth land cover class. The data set is divided into training samples (80%) and testing samples (20%) randomly.
The performance of the RF classifier is assessed based on a confusion matrix for training and testing data sets from which various accuracy metrics can be derived. The overall accuracy (OA), consumer (CA) and producer (PA) accuracies, and kappa coefficient (KC) of training and validation data are some of the performance and accuracy metrics obtained from the training and validation of the RF classifier [55,56]. The quality of LULC classification is in excellent agreement when KC > 0.85, very good agreement for 0.7 < KC < 0.85, good agreement when 0.55 < KC < 0.7, and poor agreement when KC < 0.4 from the validation samples [57,58]. Once the KC of the RF classifier is in the first three quality categories (i.e., good to excellent range), the classifier can be applied to other data sets, assuming the performance remains the same. Therefore, we applied the RF classifier on Landsat mosaic images taken during 1997, 2008, and 2017 in the same months as that of the training data to determine the land cover classes at a pixel resolution of 30 m by 30 m. Training of the RF classifier on the selected years 1997, 2008, and 2017 was not possible since the ESA World Land Cover Map is available only for 2021. We also decided to exclude 2021 as one of the selected years for assessing the impact of LULC on the hydrologic flow to avoid the impact of any additional misclassification error during other years that may arise because of the difference in the period of the data up on which the RF classifier is trained. This ensures any misclassification error arising from such difference among the selected years affects the hydrologic response in the same way during all the selected years.

2.3. Preprocessing for Running SWAT

The SWAT ecohydrological model is set up to simulate hydrological variables using 1997, 2008, and 2017 LULC thematic maps and the hydrometeorological data for the period of 1982–2017 as inputs. First, thematic maps of LULC were obtained through supervised classification of Landsat 5 and 8 using the RF classifier for the Gaborone Dam catchment for the years 1997, 2008, and 2017, as indicated in Section 2.2. Second, the SWAT ecohydrological model was calibrated and validated based on the LULC map of the year 1997 and observed streamflow, homogenized by SASSCAL, from the gauging station during the period of 1985–2000 as inputs.

2.3.1. SWAT Model Setup

Three SWAT model runs were carried out using LULC maps for 1997, 2008, and 2017 and the calibrated and validated model parameters covering the period of 1982–2017. The outputs from the three model runs allow the assessment of the water resources of the catchment under the influence of LULC dynamics. Due to evapotranspiration processes, rainfall is recycled by plant transpiration over the catchment, accounting for green water, which is a vital ecohydrological resource [59]. The blue water was considered as the sum of deep aquifer recharge and surface water yield, while the green water was considered as actual evapotranspiration and soil moisture [20,60]. In this study, blue water was estimated from ground and surface water components, while transpiration and evaporation water from vegetation and bare soil (excluding surface water) constituted green water.
To evaluate the effects of the LULC practice on the hydrology of the catchment, it is highly required to use a semi-distributed physical model [42]. The major water balance components determined by the SWAT model are surface runoff, evapotranspiration, lateral flow, groundwater flow, transmission losses, and percolation [42]. The water balance of the SWAT is described by
SWt = S W o + ( R d a y S U R Q G W Q W s e e p E T )
where SWt is the final soil water content (mm), t is time in days, SWo is the initial soil water content (mm), R d a y is daily precipitation amount (mm/day), SURQ is surface runoff amount (mm/day), Wseep is water entering the unsaturated zone from the soil profile (mm/day), GWQ is the return flow (mm/day), and ET is the evapotranspiration (mm/day). Stream flow network and watershed boundaries were delineated by Arc-SWAT 2012.
Curve Number (CN) was used to determine surface runoff in a specific location of the catchment during a wet event by taking into account the soil hydrologic group, LULC types, and soil moisture conditions. Temperature, solar energy, humidity, and wind speed were used to calculate the potential evapotranspiration (PET) for the whole catchment area [61,62]. Inflow of the stream network within the basin is simulated by employing the storage variable routing techniques [63]. The Gaborone Dam catchment is delineated into sub-catchments using the high-resolution DEM (SRTM DEM).
Gaborone Dam catchment was divided into 7 sub-basins (Table 1) and further subdivided into 256 HRUs, which have the same units of specific soil, slope, and land use combinations [30]. The simulation was for 19 years between 1982 and 2000, with the initial three years from 1982 to 1984 used as spin-up periods.

2.3.2. Calibration and Validation Assessment

The performance of hydrological models is assessed through a comparison of simulated variables in the basin with the observed ones. Prior to validation, calibration of the model using observed stream flow is a vital step to capture basin characteristics. Uncertainty analysis of each tuning parameter of the model is part of model calibration. SWAT-CUPs (SWAT-Calibration and Uncertainty Procedures (CUPs)) are used for calibration and uncertainty assessment. The complex and large-scale models use Sequential Uncertainty Fitting (SUFI-2) due to its reliability and efficiency [64] compared to the deterministic approaches [65].
In this study, however, the stochastic approach is used to quantify the uncertainty of each parameter of the model. Due to the lack of quality-assured observed stream flow for the Gaborone Dam catchment, the calibration and validation were performed using the split-sample technique using monthly stream flow data taken from SASSCAL for the period of 1982–1994 (calibration) and 1995–2001 (validation). This was meant to measure the effectiveness of SWAT simulation stream flow compared to the daily inflow to the Gaborone Dam catchment [45]. Furthermore, the period that was selected for the calibration and validation process does not include two of the years (2009 and 2017) due to the lack of stream flow data covering up to 2017. This does not have a significant impact on the analysis as the focus is to evaluate the impact of LULC on the hydrology, and we do not expect drift in model ability with time once the model is calibrated with sufficient data. During calibration (1982–1994), five iterations, each having 500 simulations, were performed to tune the model parameters [41] such that the difference between observed and simulated stream flow is optimally low. The objective function is a simple cost function defined as the root mean squared deviation (RMSD) representing the mean deviation of the SWAT predicted stream flow from the observed stream flow. It is used in various studies in the literature [66,67,68] and can be calculated as follows:
RMSD = 1 n 1 i = 1 n ( Q m Q s ) i 2
where Qs is the predicted stream flow, Q m is the observed discharge, n is the total number of observations, and i is the simulated or ith measured stream flow. The value of RMSD becoming near 0 indicates a perfect fit of the data. During each iteration, the search ranges of values of the parameters shrink with centers located at parameter values obtained in the previous simulation. In this manner, the search range narrows approaching parameter values for which the cost function attains optimal global minima for the catchment [69]. The choice of five iterations is rather ad hoc, which is commonly practiced by the SWAT scientific community to allow expert judgment between iterations rather than an automated process using a statistical optimization approach.
The final calibration parameters selected are used in the validation of the models. The calibration and validation were assessed using the R-factor, P-factor, and objective function values [69]. The P-factor is rated between 0 and 1, with 1 indicating 100% of the observed data are captured by the model, while 0 indicates none of the observed data are represented by the model simulation. The R-factor ranges between zero and infinity. The acceptable value for a model with a good capability is less than 1.5, and P-factor values exceeding 0.7 are usually considered acceptable [69]. To evaluate the agreement between the observed and simulated stream flow, the Nash–Sutcliffe coefficient (NSE) given in Equation (3) and the Coefficient of Determination (R2) shown in Equation (3) are employed:
NSE = 1   i = 1 n ( Q o b s e r v e d Q o b s e r v e d ) i   2   i = 1 n ( Q o b s e r v e d Q ¯ o b s e r v e d )   2  
R 2 =   i = 1 n ( Q o b s e r v e d ,   i Q ¯ o b s e r v e d ) ( Q s i m u l a t e d ,   i Q ¯ o b s e r v e d )   2 i = 1 n Q o b s e r v e d , i Q ¯ o b s e r v e d 2   i = 1 n Q s i m u l a t e d , i Q ¯ s i m u l a t e d   2  
where Qobserved and Qsimulated are observed and simulated discharge, respectively, while n is the total number of records and Q ¯ o b s e r v e d   is the observed average stream flow while i is the ith observed or simulated stream flow (m3/s) [41,70]. The percentage bias (PBIAS) given by Equation (5) is also used in the model evaluation:
PBIAS =   i = 1 n Q O b s e r v e d , i Q S i m u l a t e d , i   i = 1 n Q O s e r v e d , i   * 100
where the symbols carry the same meaning as in Equation (4).
RSR is the root mean square error (RMSE) normalized by the standard deviation (STD) given by
  RSR = RMSE σ
In addition to the above SWAT model performance assessment tools, we compared the performance of the SWAT in simulating stream flow with a time series modeling approach. For this purpose, the time series (TS) modeler from the SPSS expert modeler is selected as it is found to be robust in identifying the best-fit model type for the observed stream flow [71]. The SPSS expert TS modeler used in this study is from the IBM-SPSS Statistics 24 software package. The expert modeler identified as suitable for modeling Gaborone Dam catchment stream flow is the seasonal Winters’ Multiplicative model. This model is identified from other models, such as ARIMA and different variants of exponential smoothing models available in the software package. The Winters’ Multiplicative model is given as follows:
L t = α ( Y t / S t p ) + ( 1 α ) L t 1   + T t 1 ; T t = γ L t L t 1   +   1   γ T t 1 S t =   δ Y t / L t   +   1     δ S t p Y ^ t = L t 1 + T t 1 S t p
where Lt is the level at time t, and α is the weighting factor; Tt is a trend, and γ is the weighting factor for the trend; St is the seasonal component, and δ is its weight; p is the period of the season; and Yt is the value of the data and Y ^ t is the forecast value at time t [71,72].

2.3.3. Simulation of LULC and Its Impacts on Hydrology

To evaluate the impacts of LULC dynamics on the hydrological process, the calibrated and validated SWAT model is set up for a new set of model runs using three LULC maps (1997, 2008, and 2017) while keeping other input data constant from 1985 to 2017 in the Gaborone Dam catchment. The first three years (1982–1994) of the SWAT model run were considered as the initiation (warm-up) period in this study. The sub-basin level water resource, namely blue water resources (WRB), includes the change in groundwater storage and water yield [73]. Designated water yield (WYLD) flows from catchment HRUs to the main channel, whereas groundwater storage change represents the subtraction of the inflow from the outflow of the aquifer into the main channel [74]. Therefore, blue water resources are calculated as
WRB = GWRCHG + WYLD − GWQ
where WRB represents blue water resources (mm/day), WYLD stands for water flowing from the HRUs to the stream network (mm/day), GWRCHG is the amount of water entering the aquifer (mm/day), and GWQ is water flowing out from the aquifer to the main channel (mm/day). The difference, GWRCHG–GWQ, accounts for the change in groundwater storage (GW). On the other hand, the green water resource (WRG) includes the outflow and storage of green water, which comes from precipitation and is stored in the plant root zone soil and spent through transpiration, evaporation, or consumed by plants [20,75].

2.3.4. Indicator of Hydrological Alteration (IHA) Method

River water is one of the surface water resources that are critical inputs for agriculture, industry, and human consumption. For ecological integrity and ecosystem processes, a watershed of streamflow has a vital role since the change in river flow regimes affects ecological processes in the river basin ecosystem [37]. Therefore, information on the impacts of LULC dynamics on hydrological features is vital as it can be used as inputs to formulate an appropriate methodology to ensure sustainable exploitation and development of catchment systems.
The IHA is a tool developed by the US Nature Conservancy [76]. The IHA computes various parameters to evaluate and compare flow regimes, discharge characteristics, and environmental flow components from daily stream flow. The indicator of hydrological alteration (IHA) parameters is divided into two groups: (i) indicator of hydrological alteration (IHA) and (ii) environmental flow component (EFC). In this study, a subset of 26 IHAs and 6 EFCs were chosen to describe the Gaborone Dam catchment ecological LULC relevant flow regime changes. The parameters for the catchment areas were selected based on the relevance of ecological LULC. The selected main indices are grouped into five classes: (i) 12 parameters for monthly average discharge; (ii) 10 parameters for annual average extreme discharge with various durations; (iii) 2 parameters for annual extreme timing of streamflow; (iv) 2 parameters for streamflow frequency and rate of change; and (v) 6 parameters for monthly high flows of EFCs. The SWAT simulated monthly stream flow data for 1997, 2008, and 2017 based on the three LULC maps was used as inputs in the IHA tool to analyze each of the 32 chosen flow parameters.

3. Result

3.1. LULC Accuracy Assessment

The confusion matrix of the classification results for the validation data set of 2021 obtained from the RF classifier is given in Table 2 which shows the number of training, classified, and misclassified samples as well as the producer accuracy and consumer accuracy (reliability). In general, the overall accuracy (OAs) of the classifier was 72%, which indicated that the classification algorithm is suitable for the classification of high-spatial resolution images in the study area. The classification meets the minimum requirement of the accuracy level of 67% [58,77]. The Kappa Coefficient is also 0.67, within the range of a good classifier. The conditional probability, per-class accuracy, of producer accuracy (PA) remains mostly above 0.74 for forest, pasture, barren land, and water, with the exception of shrubs (0.50) and built-up (0.40). Similarly, the per-class accuracy of consumer accuracy (CA) remains relatively higher than PA, ranging from 0.52 (pasture) to 0.98 (water) (Table 2) [78,79].

3.2. Calibration and Validation of SWAT

The simulated water balance shows precipitation in the catchments is low and potential PET is high, as expected due to the semi-aridity of the catchment.
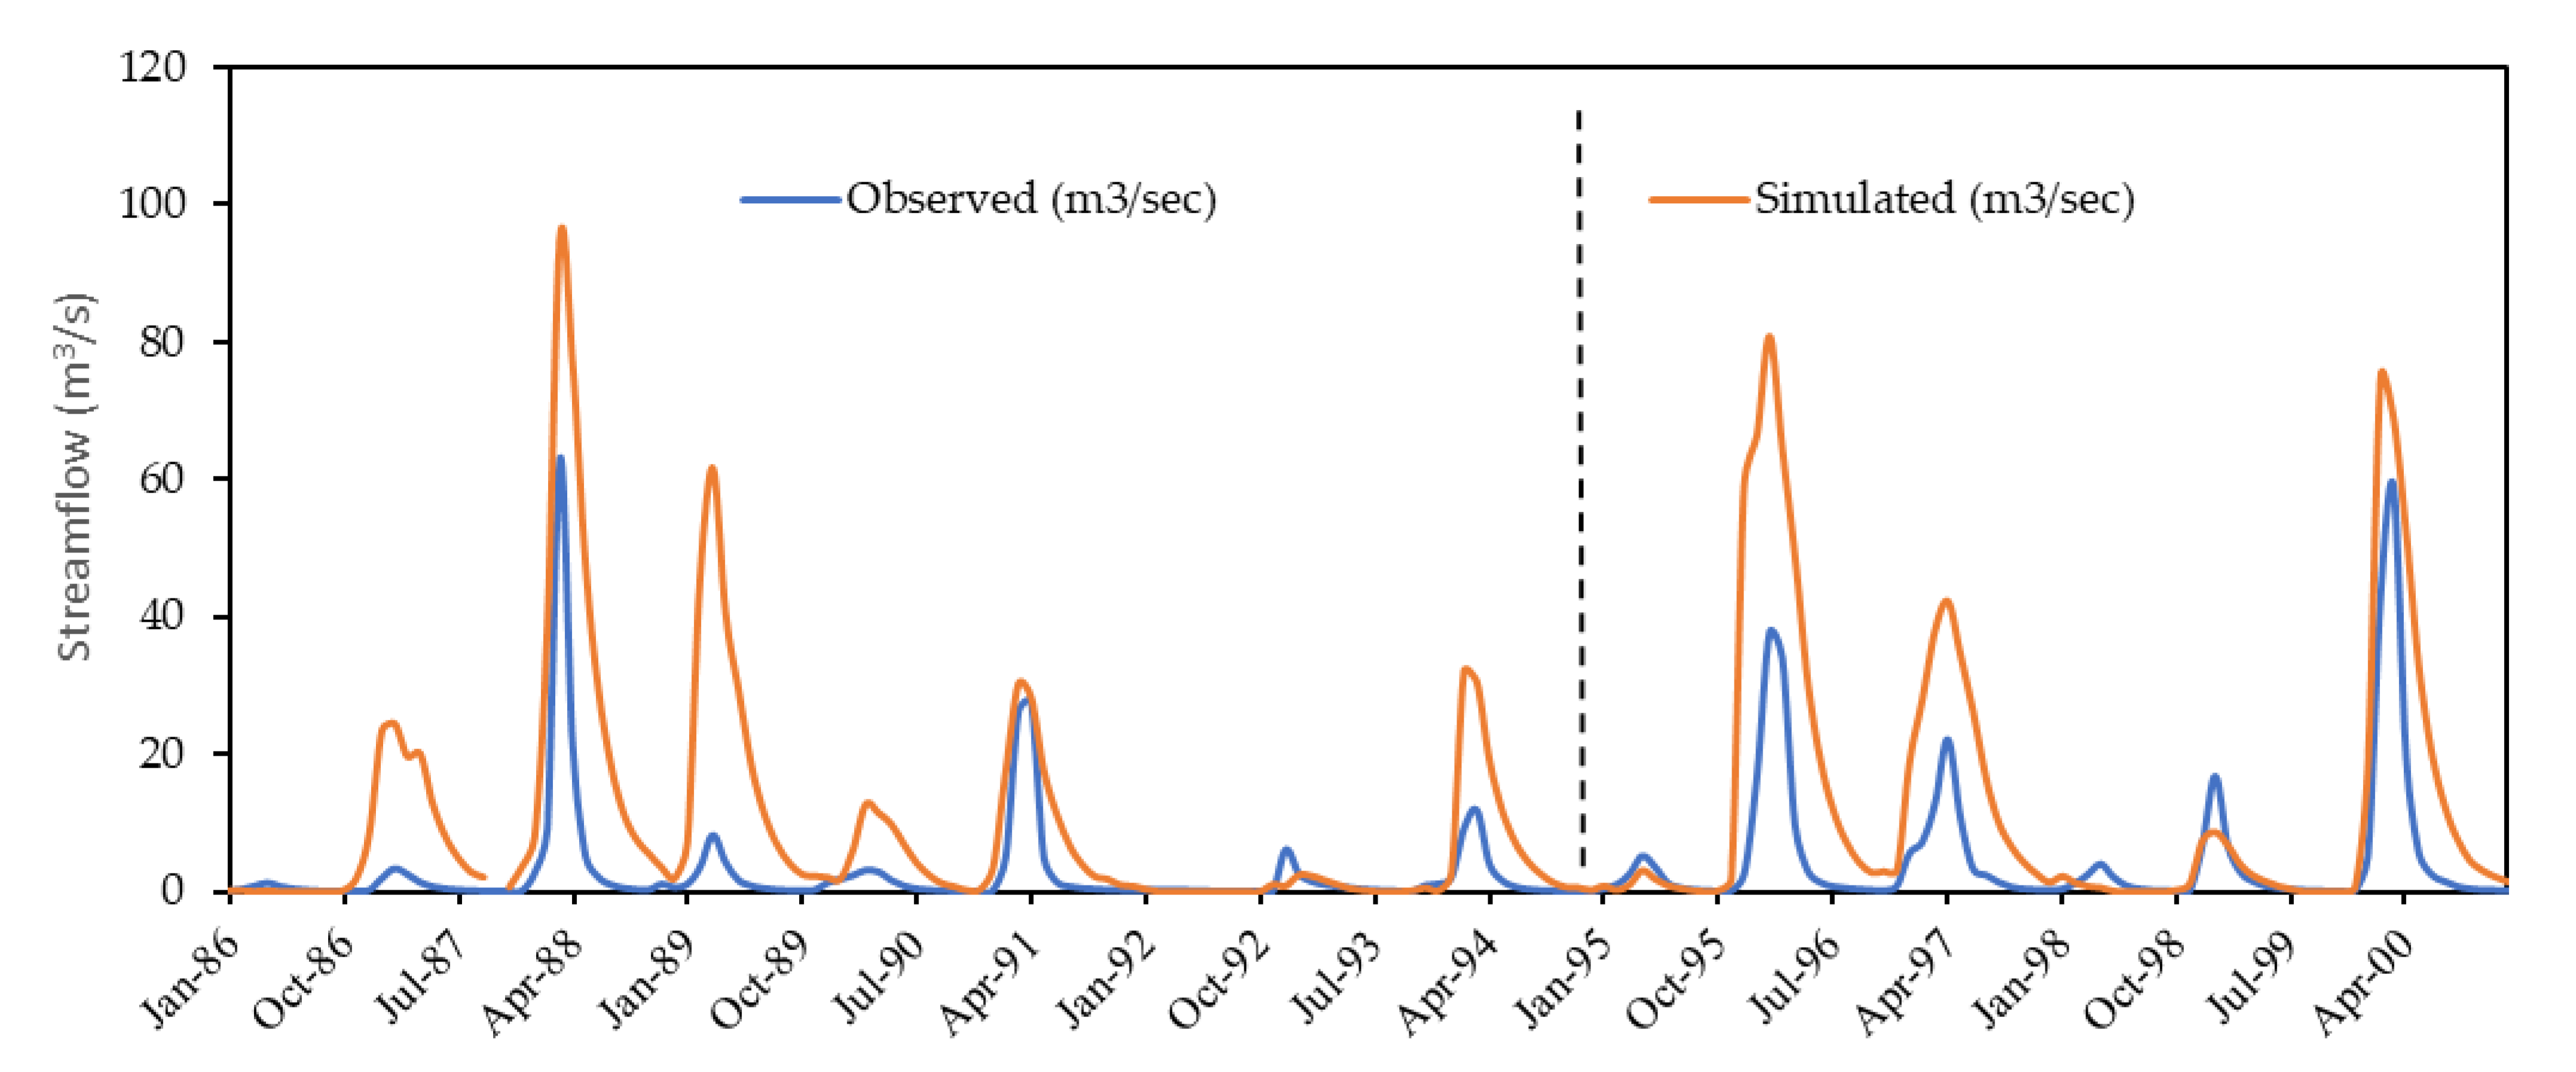
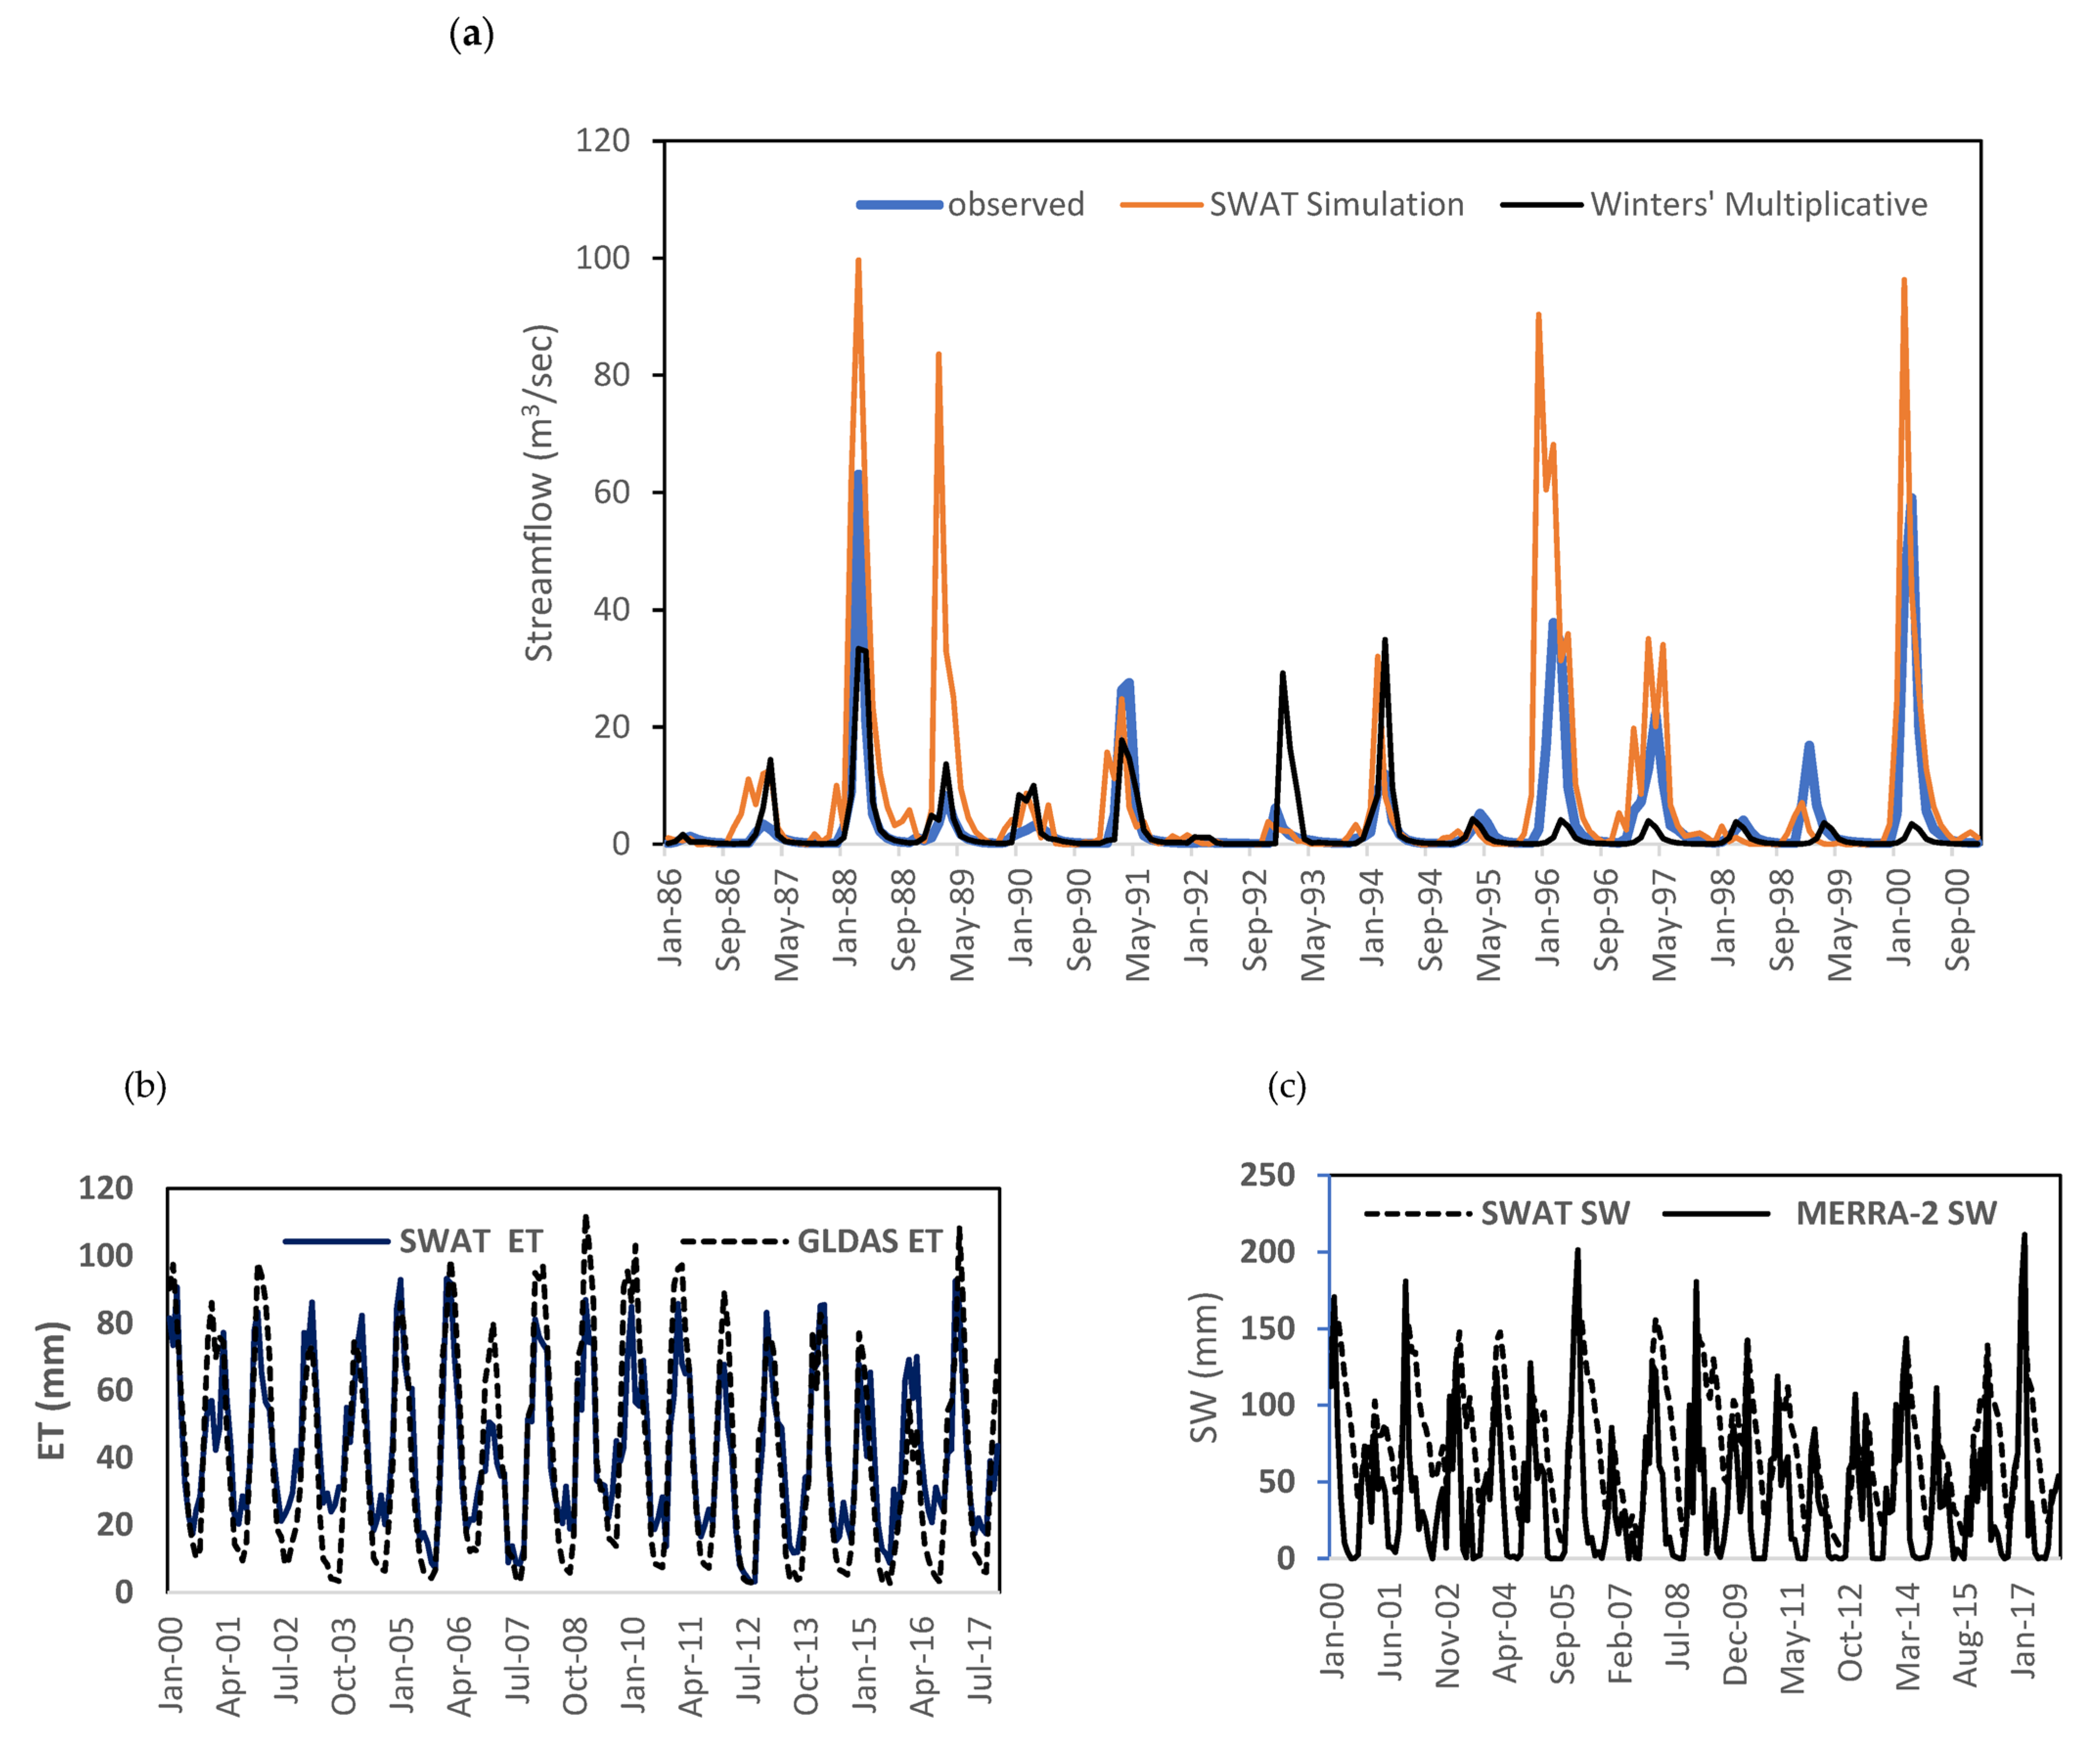
Out of the twelve parameters (Table 3), four parameters are highly sensitive to stream flow in the Gaborone Dam catchment. These are the groundwater delay time (GW_DELAY) followed by the available water capacity of the soil layer (SOL_AWC), runoff curve number (CN2), and the surface runoff and soil evaporation compensation factors (ESCO), which influence the base flow of the semi-arid catchment from 1985 to 2000. Our findings agree with those of [80,81,82], who reported similar parameters as the most sensitive in the global sensitivity hydrological analysis of catchments in semi-arid areas. It is also evident from Figure 4 that during the start of the simulation period, the model stream flow shows better agreement with the observed flow than that during the end of the seasonal flow. The phase of the simulated stream flow is in excellent agreement with the observations. However, the magnitude of the stream flow is generally overestimated during peak flow years. The P-factor of 0.81 during calibration (Table 4) is above the recommended minimum value of 0.7 (Table 5) [69]. The R-factor exceeds the maximum recommended value of 1.5. In contrast, during the validation period, the R-factor satisfies the requirement, whereas the P-factor is 0.42 (see Table 4 and Table 5). However, the other measures of model performance are within the acceptable range (R2 of 0.66, NSE of 0.64, and RSR of 0.69) for a model having a good ability to simulate stream flow [78]. The percentage bias in the model (PBIAS) of 8.6 is within a very good range for validation as noted from comparison of Table 4 and Table 5 [78,79].
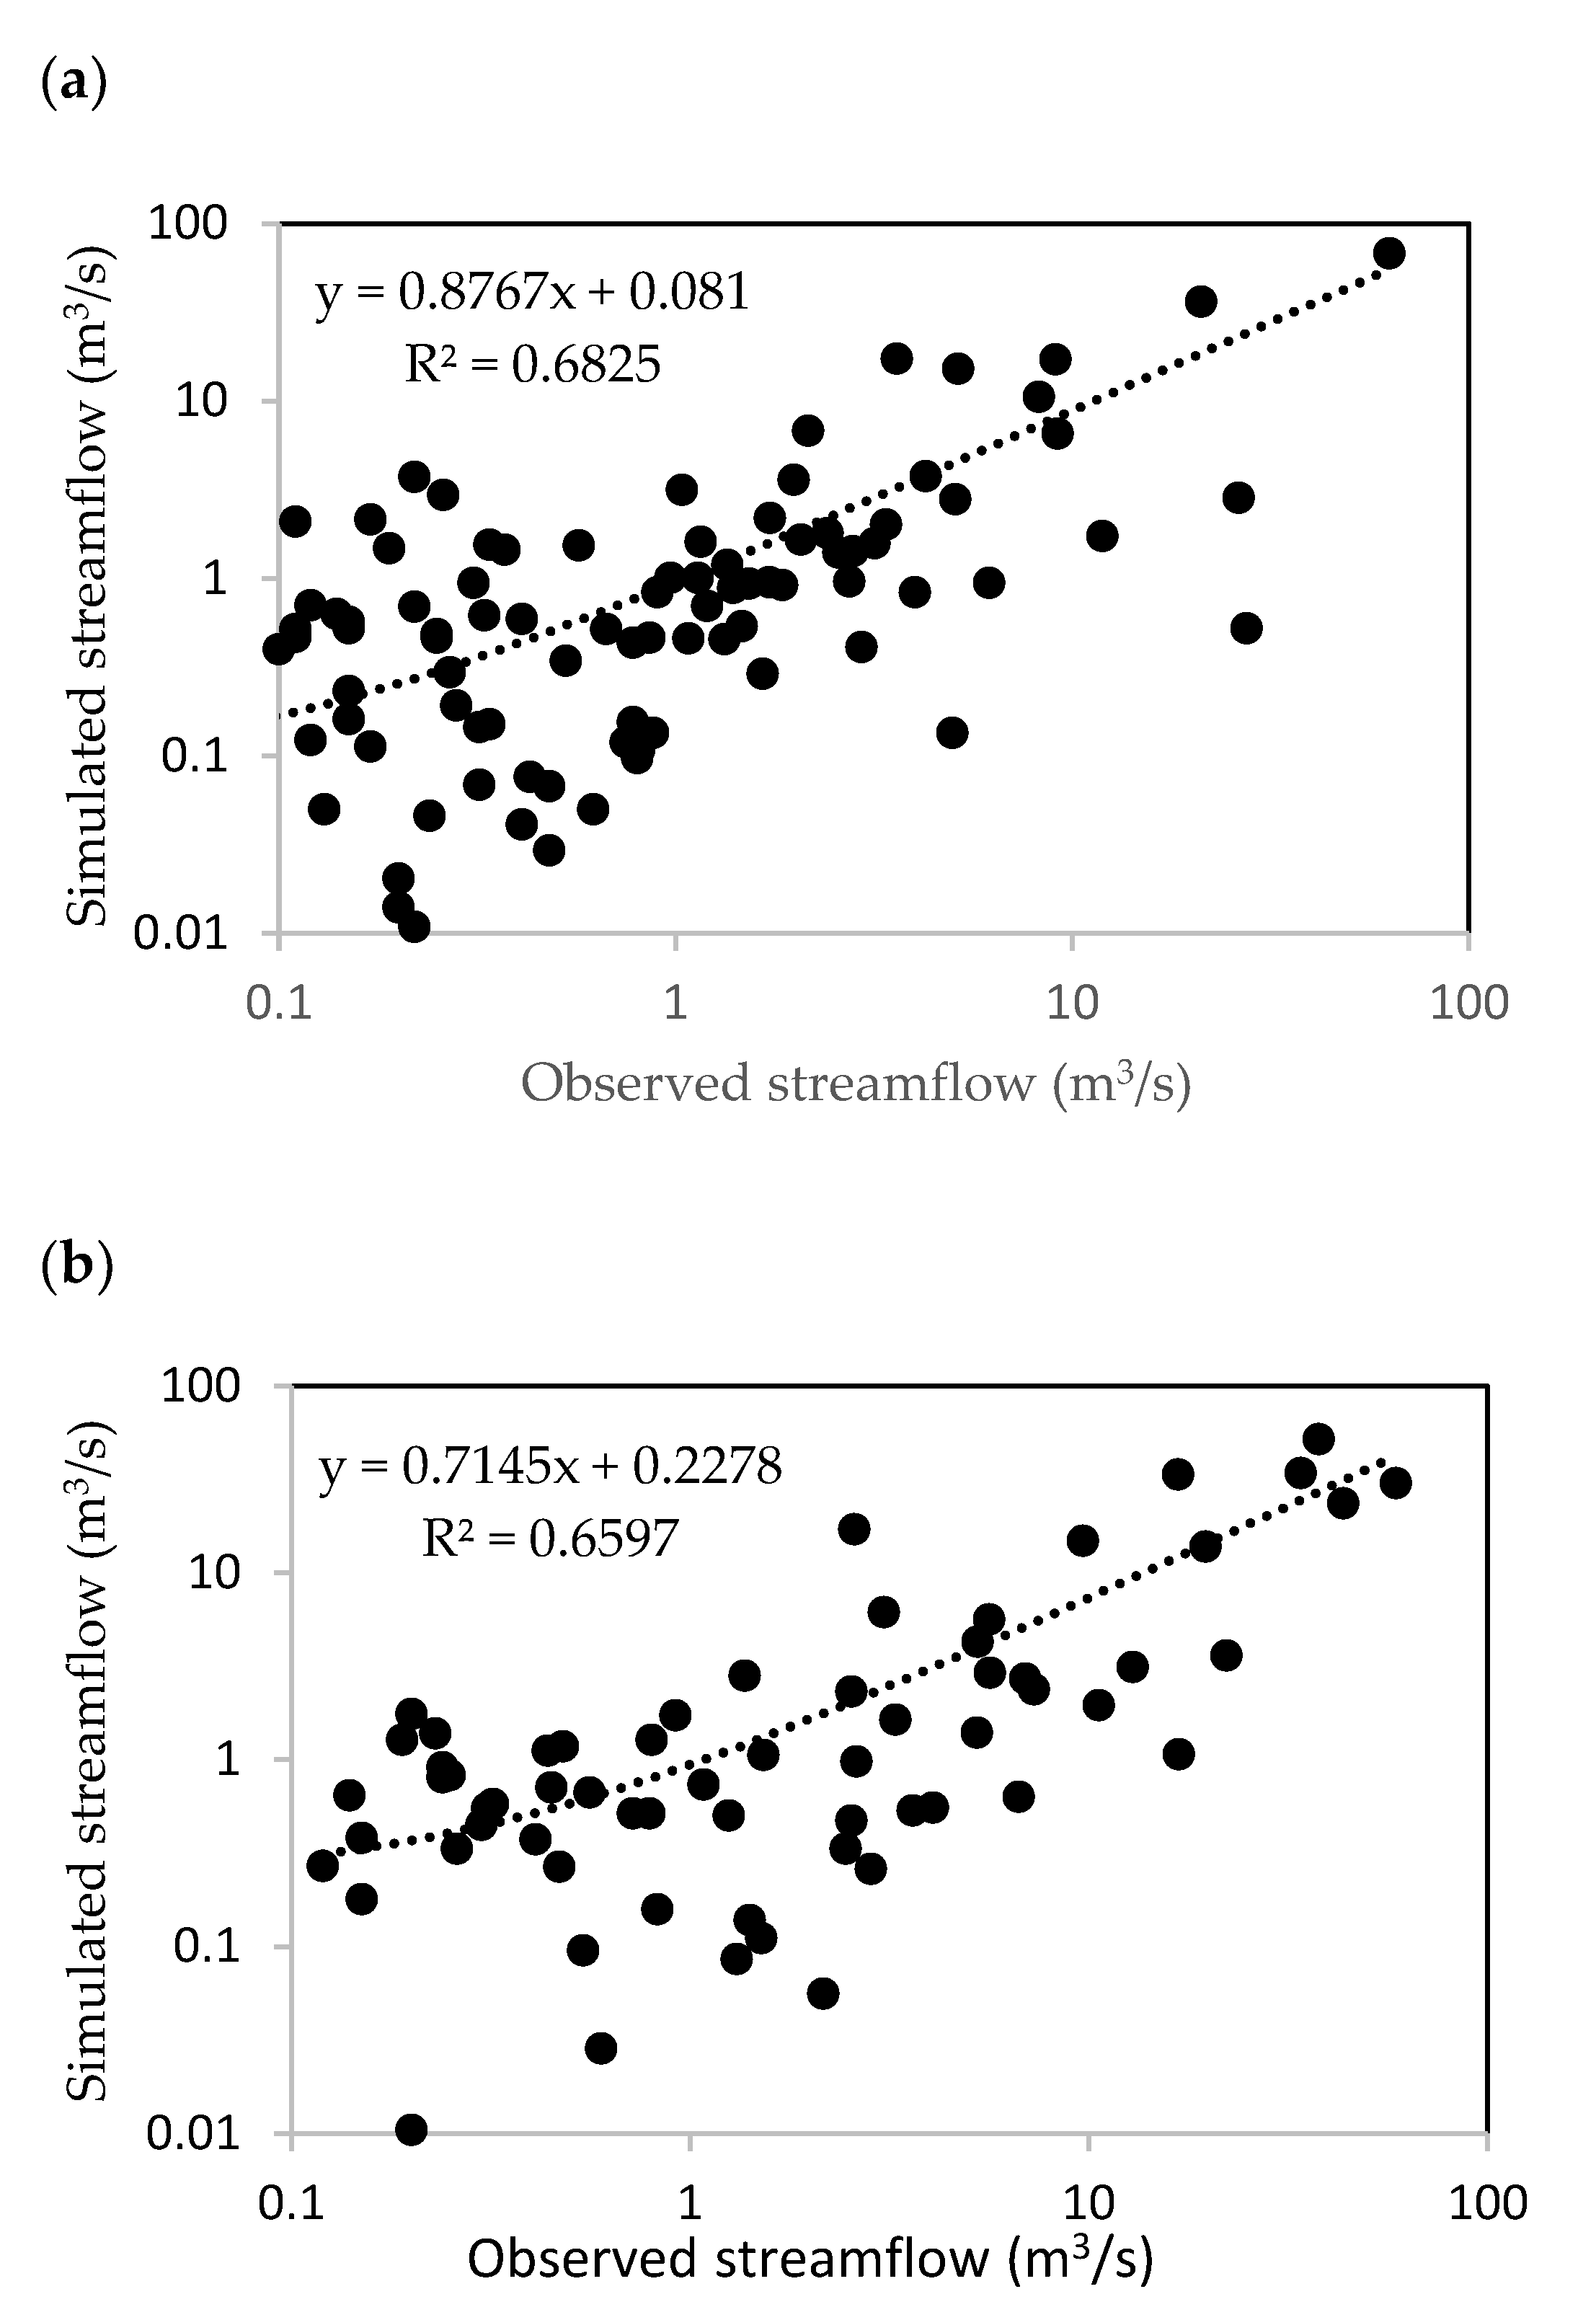
The Coefficient of Determination (R2) attained a value of 0.68 and 0.65 in Figure 5a,b, respectively, indicating a strong positive correlation between simulated and observed flow during the calibration and validation periods. Therefore, the performance of the SWAT during the validation phase shows the model is able to simulate the stream flow of the Gaborone Dam catchment based on the parameters obtained during calibration.
To further establish strong confidence in the SWAT’s ability to simulate observed stream flow, it is also worth comparing it with other models. For this purpose, the SWAT model is compared with data-based time series modeling (TS). The seasonal Winters’ Multiplicative model is selected by the SPSS expert modeler software package since it shows better performance in simulating observed stream flow relative to other available models. The TS model is developed based on the observed stream flow during the calibration period. As a result, the TS model fits the observation reasonably, as shown in Figure 6. However, the TS model failed to predict the observed stream flow during validation (Figure 6a). When the SWAT is evaluated against the TS model, it is quite apparent that the SWAT shows better performance in emulating observed flow during both the calibration and validation periods (Figure 6). Quantitively, the R2 (0.68/0.66) and NSE (0.63/0.64) values of the SWAT (Table 4) are higher than that of TS (Table 6) during the calibration/validation period, respectively. Similarly, the PBIAS and the standardized deviation index (RSR) of the SWAT are lower than that of the TS model.
The assessment based on both performance evaluation metrics and comparison with the TS model shows that the SWAT model has a reasonably good ability to reproduce the observed stream flow of the catchment.
While modeling stream flow accurately is critical, assessing the SWAT for its ability to reproduce other parameters is important. To this end, we compared two of the parameters simulated by the SWAT with other reanalysis data sets. Evapotranspiration (ET) from Global Land Data Assimilation (GLDAS) version 2.1 (GLDAS-2.1) is compared with SWAT ET (Figure 6b). The agreement between the ETs from the SWAT and GLDAS-2.1 is quite good, as both the phase and magnitude of the two time series overlap (Figure 6b). This is reflected in R2 of 0.8. On the other hand, the agreement between soil moisture from the SWAT and MERRA-2 is not as good as that of evapotranspiration. In particular, while the seasonality in the two time series shows excellent agreement, the magnitude of SWAT soil moisture differs appreciably at the lower ends of MERRA-2 soil moisture, which shows mostly zero values (Figure 6c).
Therefore, in view of the remarkable ability of the SWAT model shown by the preceding comparisons, it is used to assess the spatiotemporal variability of hydrological flows based on the parameter values reached during calibration and the LULC maps established from satellite observations in accordance with procedures given in Section 2.2. The results of this modeling step are given in Section 3.3 below.

3.3. Impacts of Land Use Land Cover Changes on Hydrology

3.3.1. LULC Change

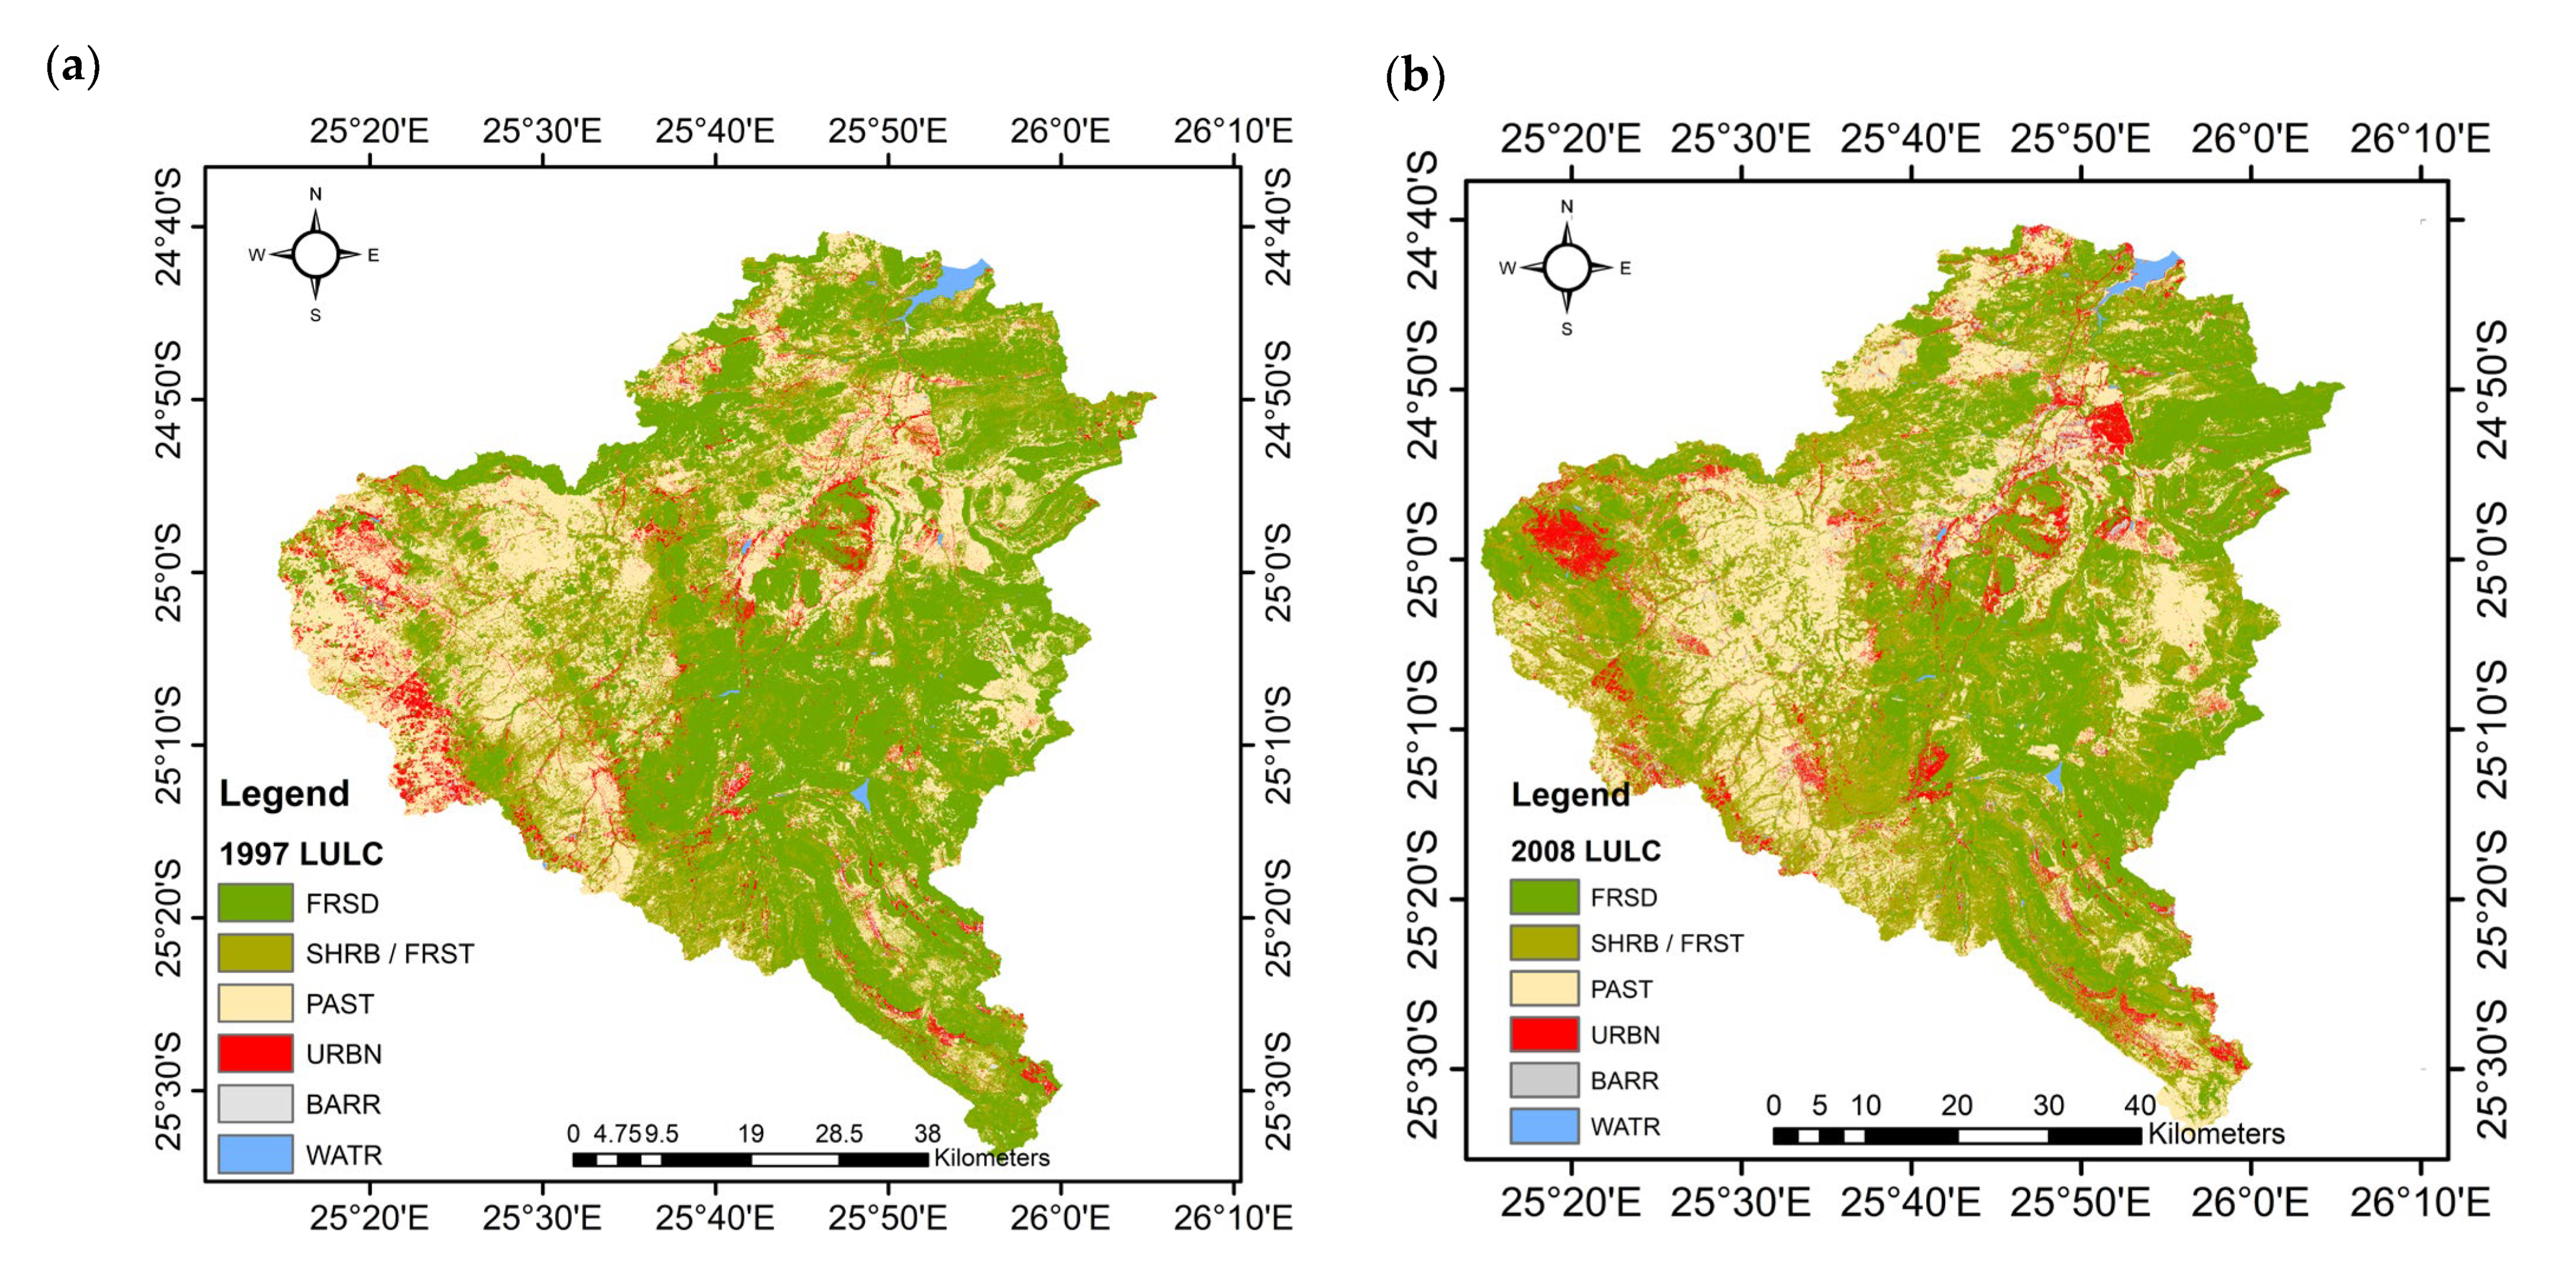
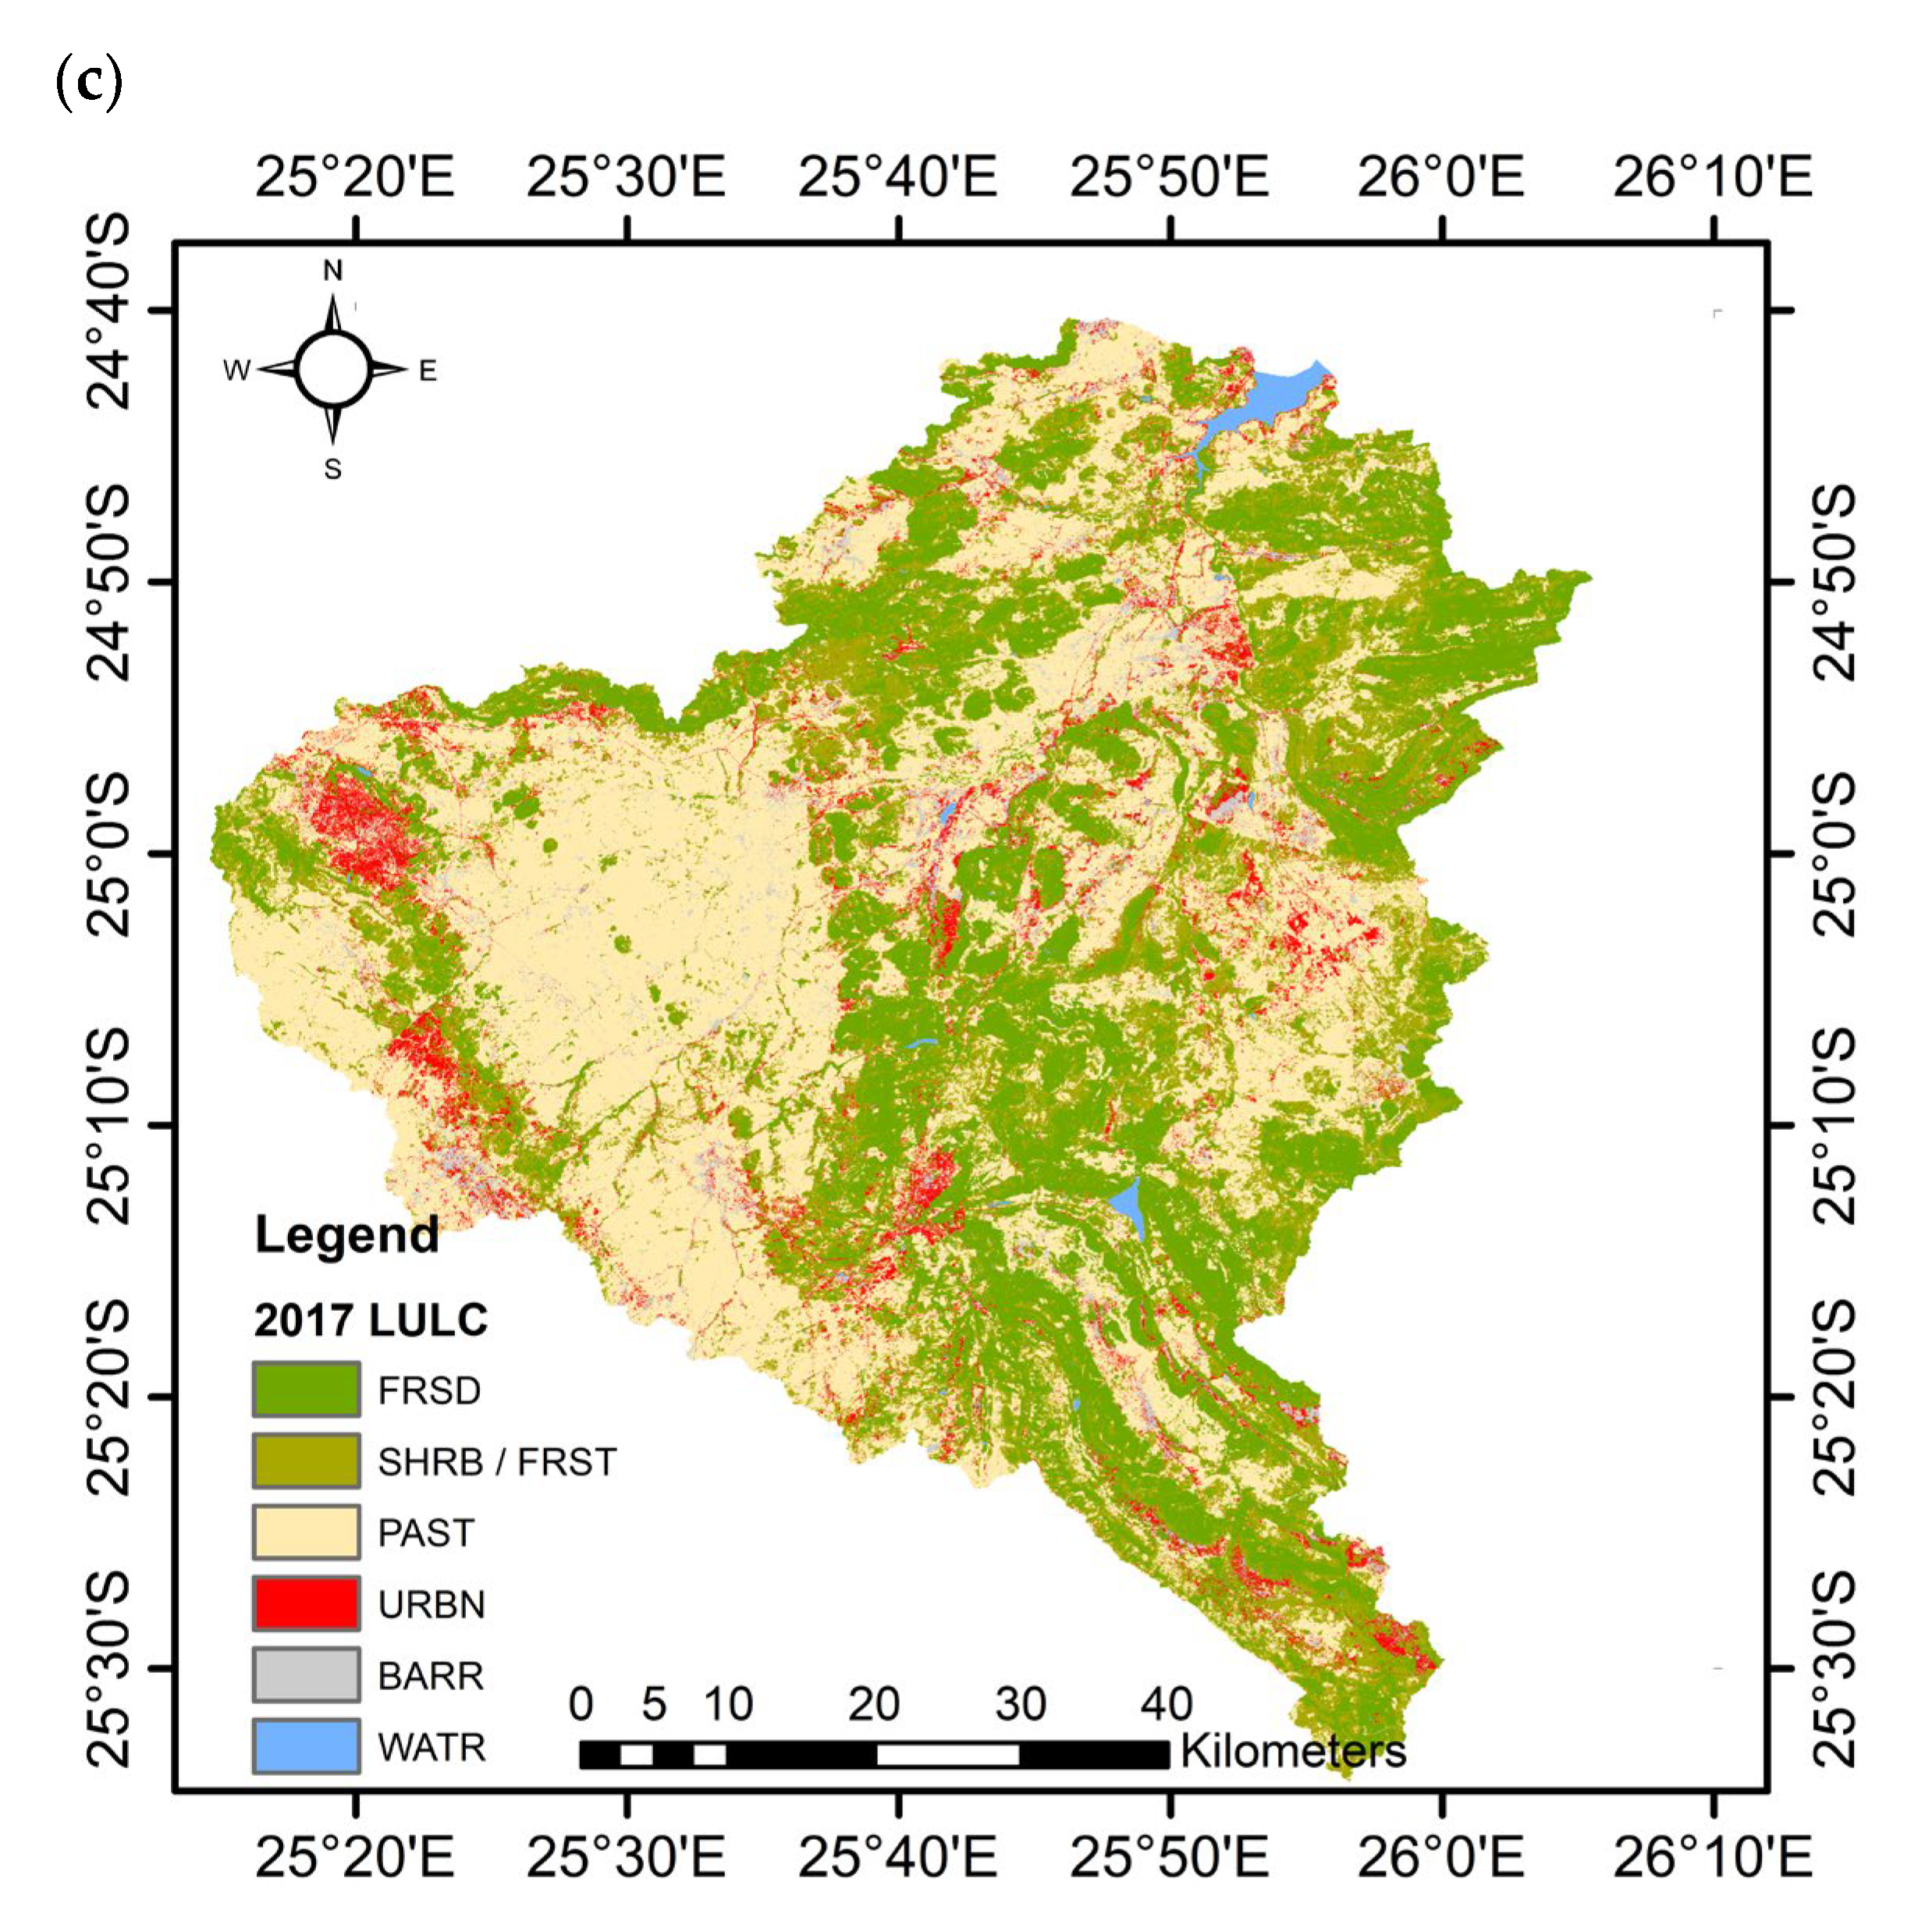
For the Gaborone Dam catchment, six major land use classes were identified: water body, built-up, pasture (grassland and crops), shrubs, forest, and barren lands. In 1997, the largest area was covered by forests, followed by pasture and shrubs. However, during the year 2017, the largest area of the dam catchments was covered by pastureland. Table 7 shows the percentage of different land classes in the watershed for the years 1997, 2008, and 2017 and the simulated flow components. The spatial extent of each land class is given in Figure 7 for the years 1997, 2008, and 2017. An increase in pastureland (grass and cropland) from 28.13 to 44.91% between 1997 and 2017, a decrease in forest cover coverage from 41.95 to 30.75% and from 41.95 to 24.19% between 1997 and 2008 and 1997 and 2017, respectively, and a decrease in shrubland from 23.53 to 22.15% between 1997 and 2017 are captured by the RF LULC classification in Table 7.

3.3.2. Impacts of LULC Changes on the Hydrology at Sub-Basin Level

In this study, we refer to a simulation with LULC from 1997 as a reference simulation or control experiment, whereas the other two simulations based on the LULC maps of 2008 and 2017 are referred to as sensitivity experiments or simulations. The difference between the sensitivity and control experiments provides the response of the basin to change in LULC. Table 7 also shows the different flow components of the water balance as simulated by the SWAT under the respective land cover and the corresponding change in the volume of flow during the three years. Table 7 displays the average annual basin values of total water yield, soil moisture, surface flow, base flow, evapotranspiration, and groundwater simulated using each LULC map for the period of 1997–2017. Relative to average annual water yields under the 1997 LULC (i.e., LULC baseline year), the average annual water yields over the catchment under the 2008 and 2017 LULCs were higher by 5.12 mm/year and 7.99 mm/year, respectively. The average annual dam catchment level base soil moisture is increased from 411.77 mm during reference simulation based on the LULC of 1997 to 432.80 mm and 433.43 mm when the LULC of 2008 and 2017 are used, respectively. The differences between the reference simulation and sensitivity simulations arise in response to the change in LULC areal extent and land use types. In addition, the average annual water yields also increased from 38.36 mm/year for the 1997 LULC to 43.47 mm /year and 46.34 mm/year for the 2008 and 2017 LULCs, respectively. In contrast, evapotranspiration decreased from 281.09 mm/year in association with the 1997 LULC to 272.60 mm/year in association with the 2017 LULC. The percentage of changes in selected LULC classes in 2017 relative to 1997 (Figure 8a) and in 2017 relative to 2008 (Figure 8b) are shown in Figure 8. The percentage change in 2017 from 1997 (Figure 8a) in selected pastureland (left), shrubs (middle), and savanna trees (right) within the basin ranges from −6.7% to 7.1%. A decrease in pastureland in 2017 relative to 1997 was observed over north and western sub-basins 1–3 and 6 (Figure 8a, left). In contrast, an increase in pastureland was observed over southern sub-basins 4–5 and 7 (Figure 8a, left). Similarly, a decrease in pastureland in 2017 relative to 2008 over sub-basins 1–3 was noted, revealing that 2017 pasture cover is the lowest over these catchment areas (Figure 8b, left). On the other hand, pasture cover over sub-basin 6 was highest in 1997. An increase in pastureland cover over sub-basins 4, 5, and 7 in 2017 relative to 2008 shows land covered by pasture is the highest in 2017. Shrub coverage (Figure 8a, middle) decreased in 2017 relative to 1997 over sub-basins 2, 4, 5, and 6, whereas it increased over sub-basins 1, 3, and 7. The shrub coverage in 2017 relative to 2008 was almost the same when compared to 1997 except over sub-basin 2 (Figure 8b, middle). A decrease in savanna trees in 2017 relative to 1997 was observed over sub-basins 1 and 4–7 in contrast to sub-basins 2–3, which exhibited an increase in savanna trees (Figure 8a, left). However, relative to 2008, there was a decrease over sub-basins 1, 3–4, and 6 and an increase over sub-basins 2, 5, and 7 (Figure 8b, left).
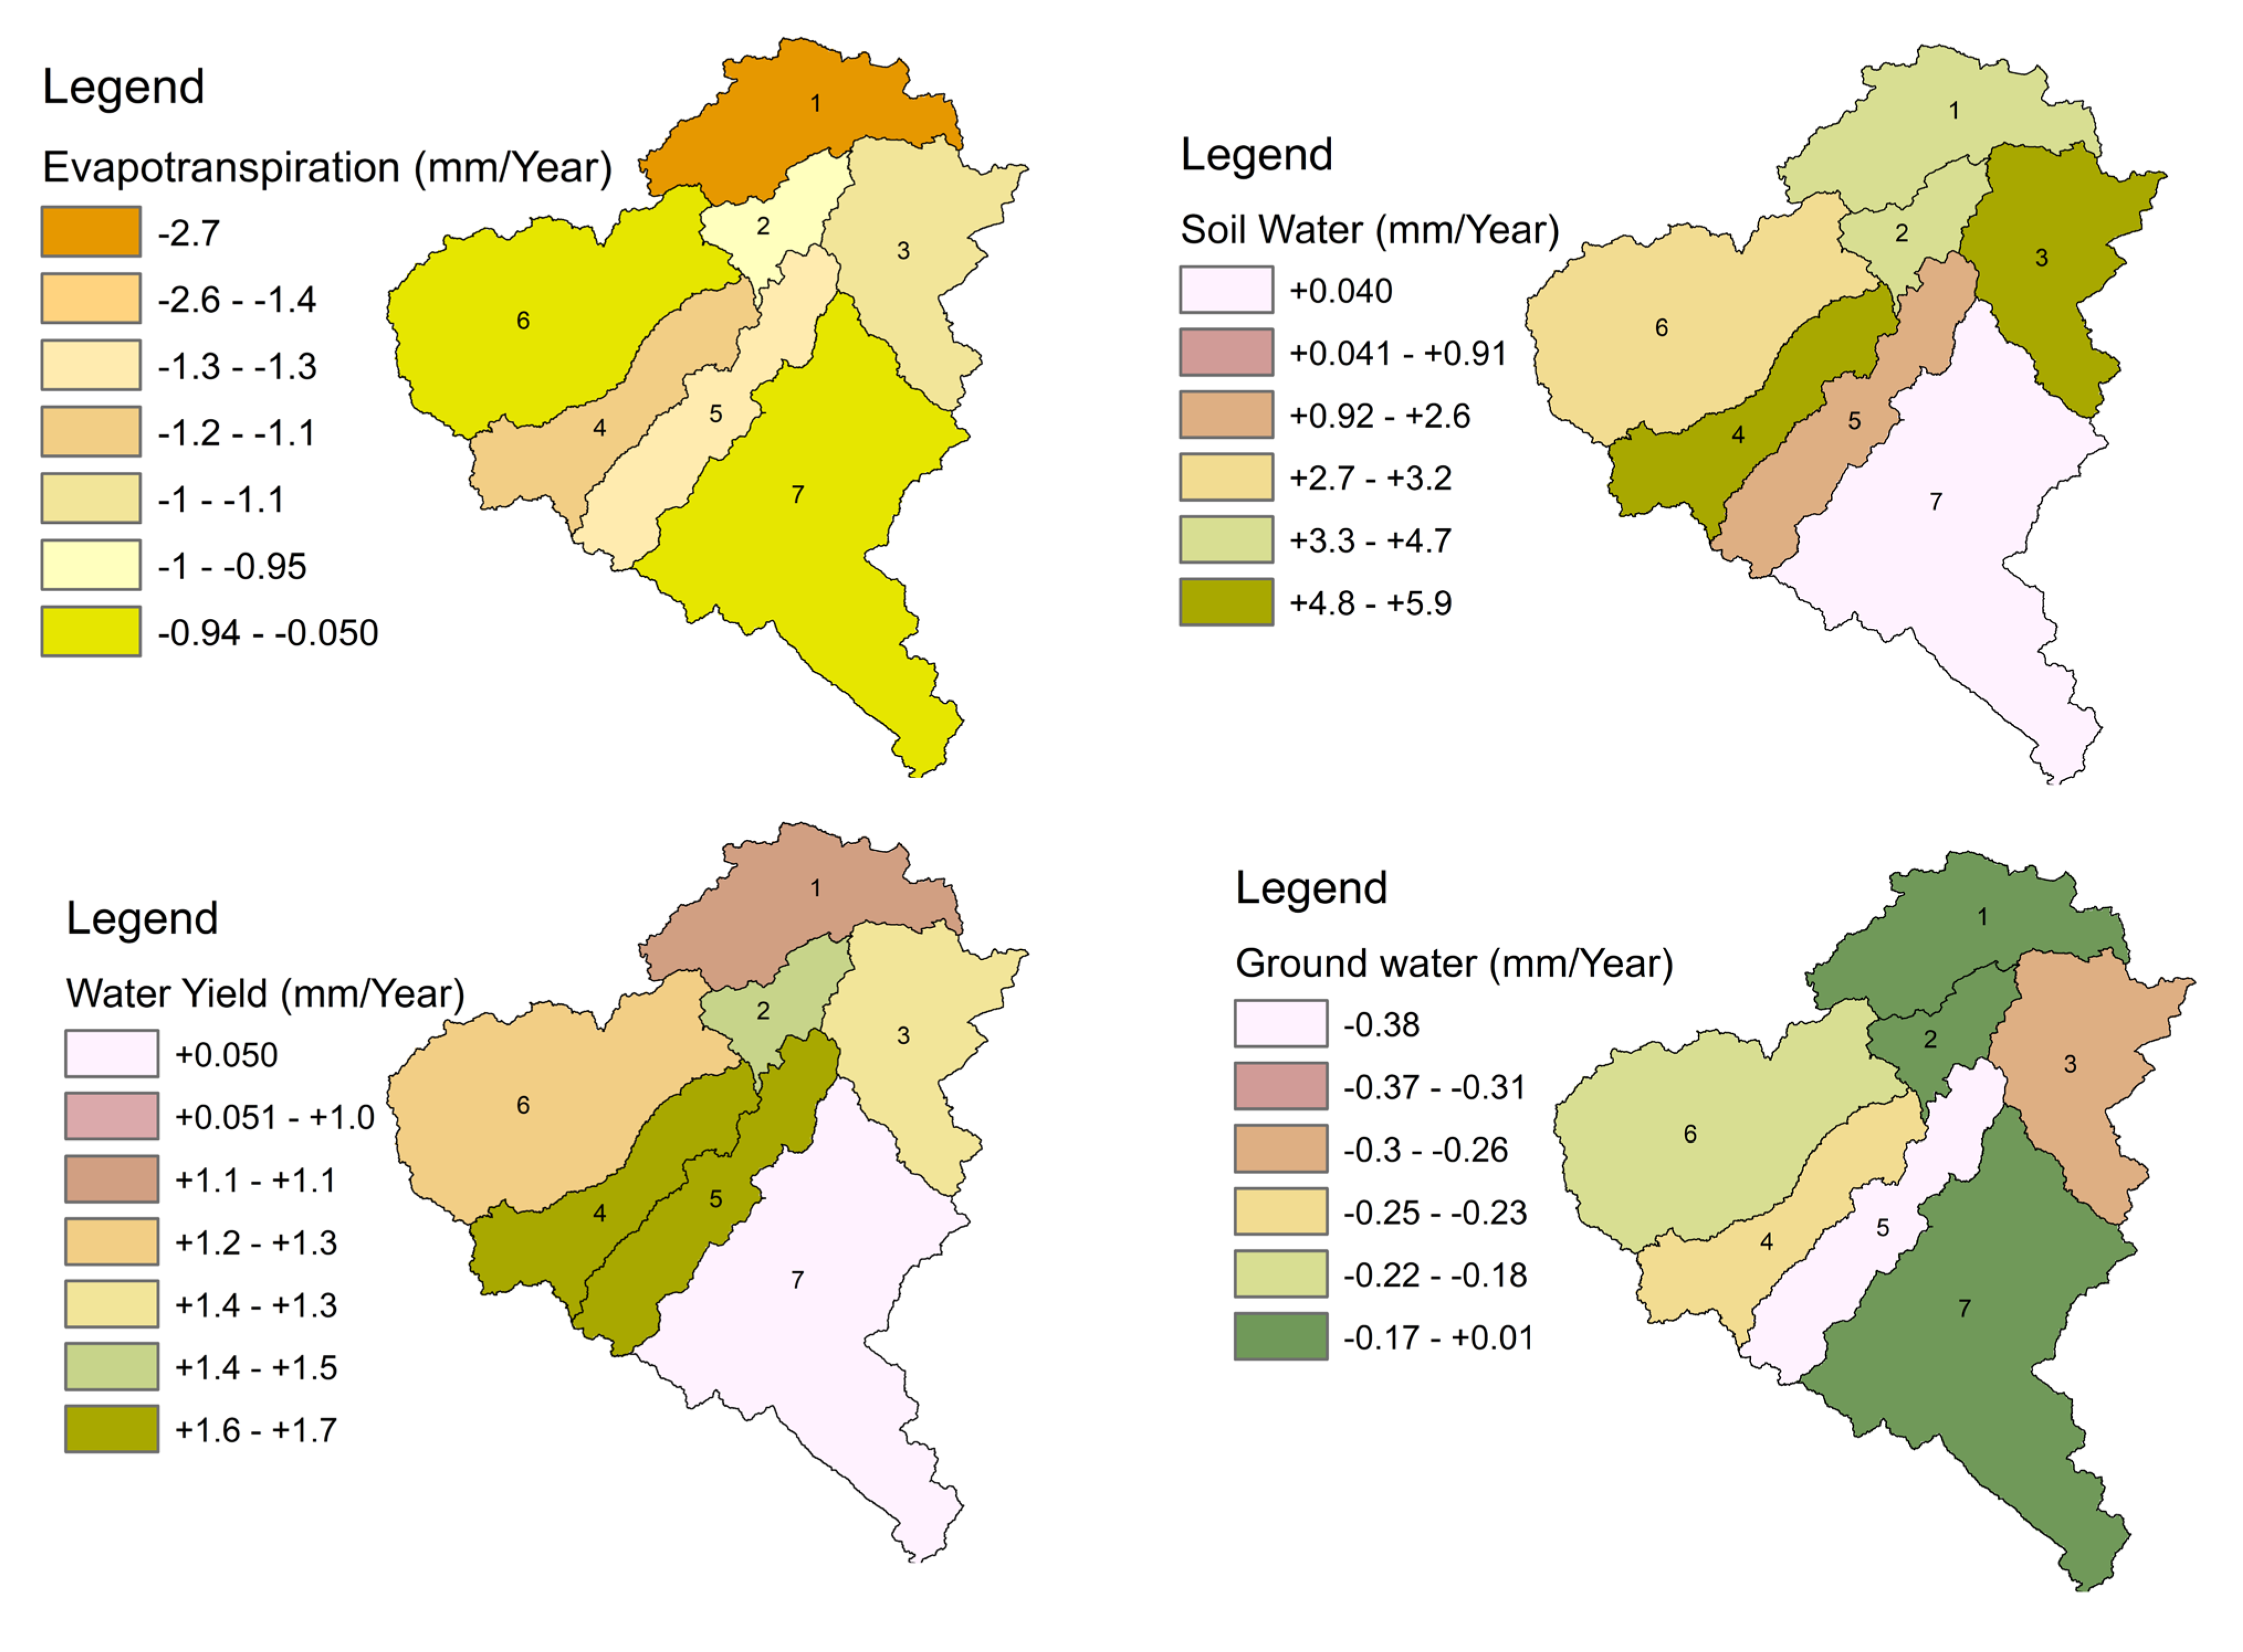
Figure 9 shows the response of each component of the water balance to changes in LULC in 2017 relative to 1997. The decline in evaporation in 2017 as a result of the change in LULC is notable in all areas of the sub-basins. Among the three LULC classes in Figure 7a, the decrease in evapotranspiration over the sub-basin appears to be associated with reduced forestland cover. There is also a decrease in shrubs (Figure 7a, middle panel catchments 6, 5, 4, and 2) over the same area, which also contributes to the reduction in evapotranspiration. However, the increase in shrub coverage over most of the southern sub-basin, sub-basin 7, does not seem to have a dominant role as the sub-basin experienced a decrease in evapotranspiration due to concurrent decrease in forests over the area (Figure 8a, left). The northeastern sub-basin, sub-basin 3, with increased shrubs in 2017 relative to 1997, also exhibited a decrease in evapotranspiration since there was a concurrent decrease in pastureland. On the other hand, the northeastern sub-basin, sub-basin 3, experienced a decrease in evapotranspiration, irrespective of an increase in forests and shrubs. Although forests and shrubs contribute more to evapotranspiration, the pasture land is dominant in sub-basin 3, as can be verified from Figure 7 (bottom panel). In effect, a decrease in pasture land led to a decrease in evapotranspiration over this sub-basin.
Soil water over the catchment is in excess in 2017 over most sub-basins, with the exception of sub-basins 5 and 7, in response to changes in LULC in 2017 relative to 1997. The increase in soil moisture is related to the dense coverage of shrubs and forests over most of the northeastern sub-basin 3 (Figure 7 and Figure 8a, left and middle panel) in 2017 relative to 1997. The low soil moisture over sub-basin 7 is likely related to a decrease in forest cover. However, high pasture and shrub per unit area did not result in an increase in soil moisture.
Water yield in 2017 in response to changes in LULC relative to 1997 has a similar spatial pattern as soil moisture, implying the difference in the spatial extent and areal density of the pasture vegetation, shrubs, and forests in 2017 from 1997 has the same role in water yield. Groundwater responds to the LULC change in the opposite manner from both soil moisture and water yield. There is a strong consistence between the components of the water balance in 2017 since the decrease in evapotranspiration matches spatially with the increase in percolation components and water yield, taking into account the LULC change between 1997 and 2017 (Figure 9).

3.4. Impact of LULC Changes on Hydrological Variables

In the following, mean annual stream flow, daily annual stream discharges, and some indices representing hydrological alteration will be described.

3.4.1. Mean Annual Stream Flow

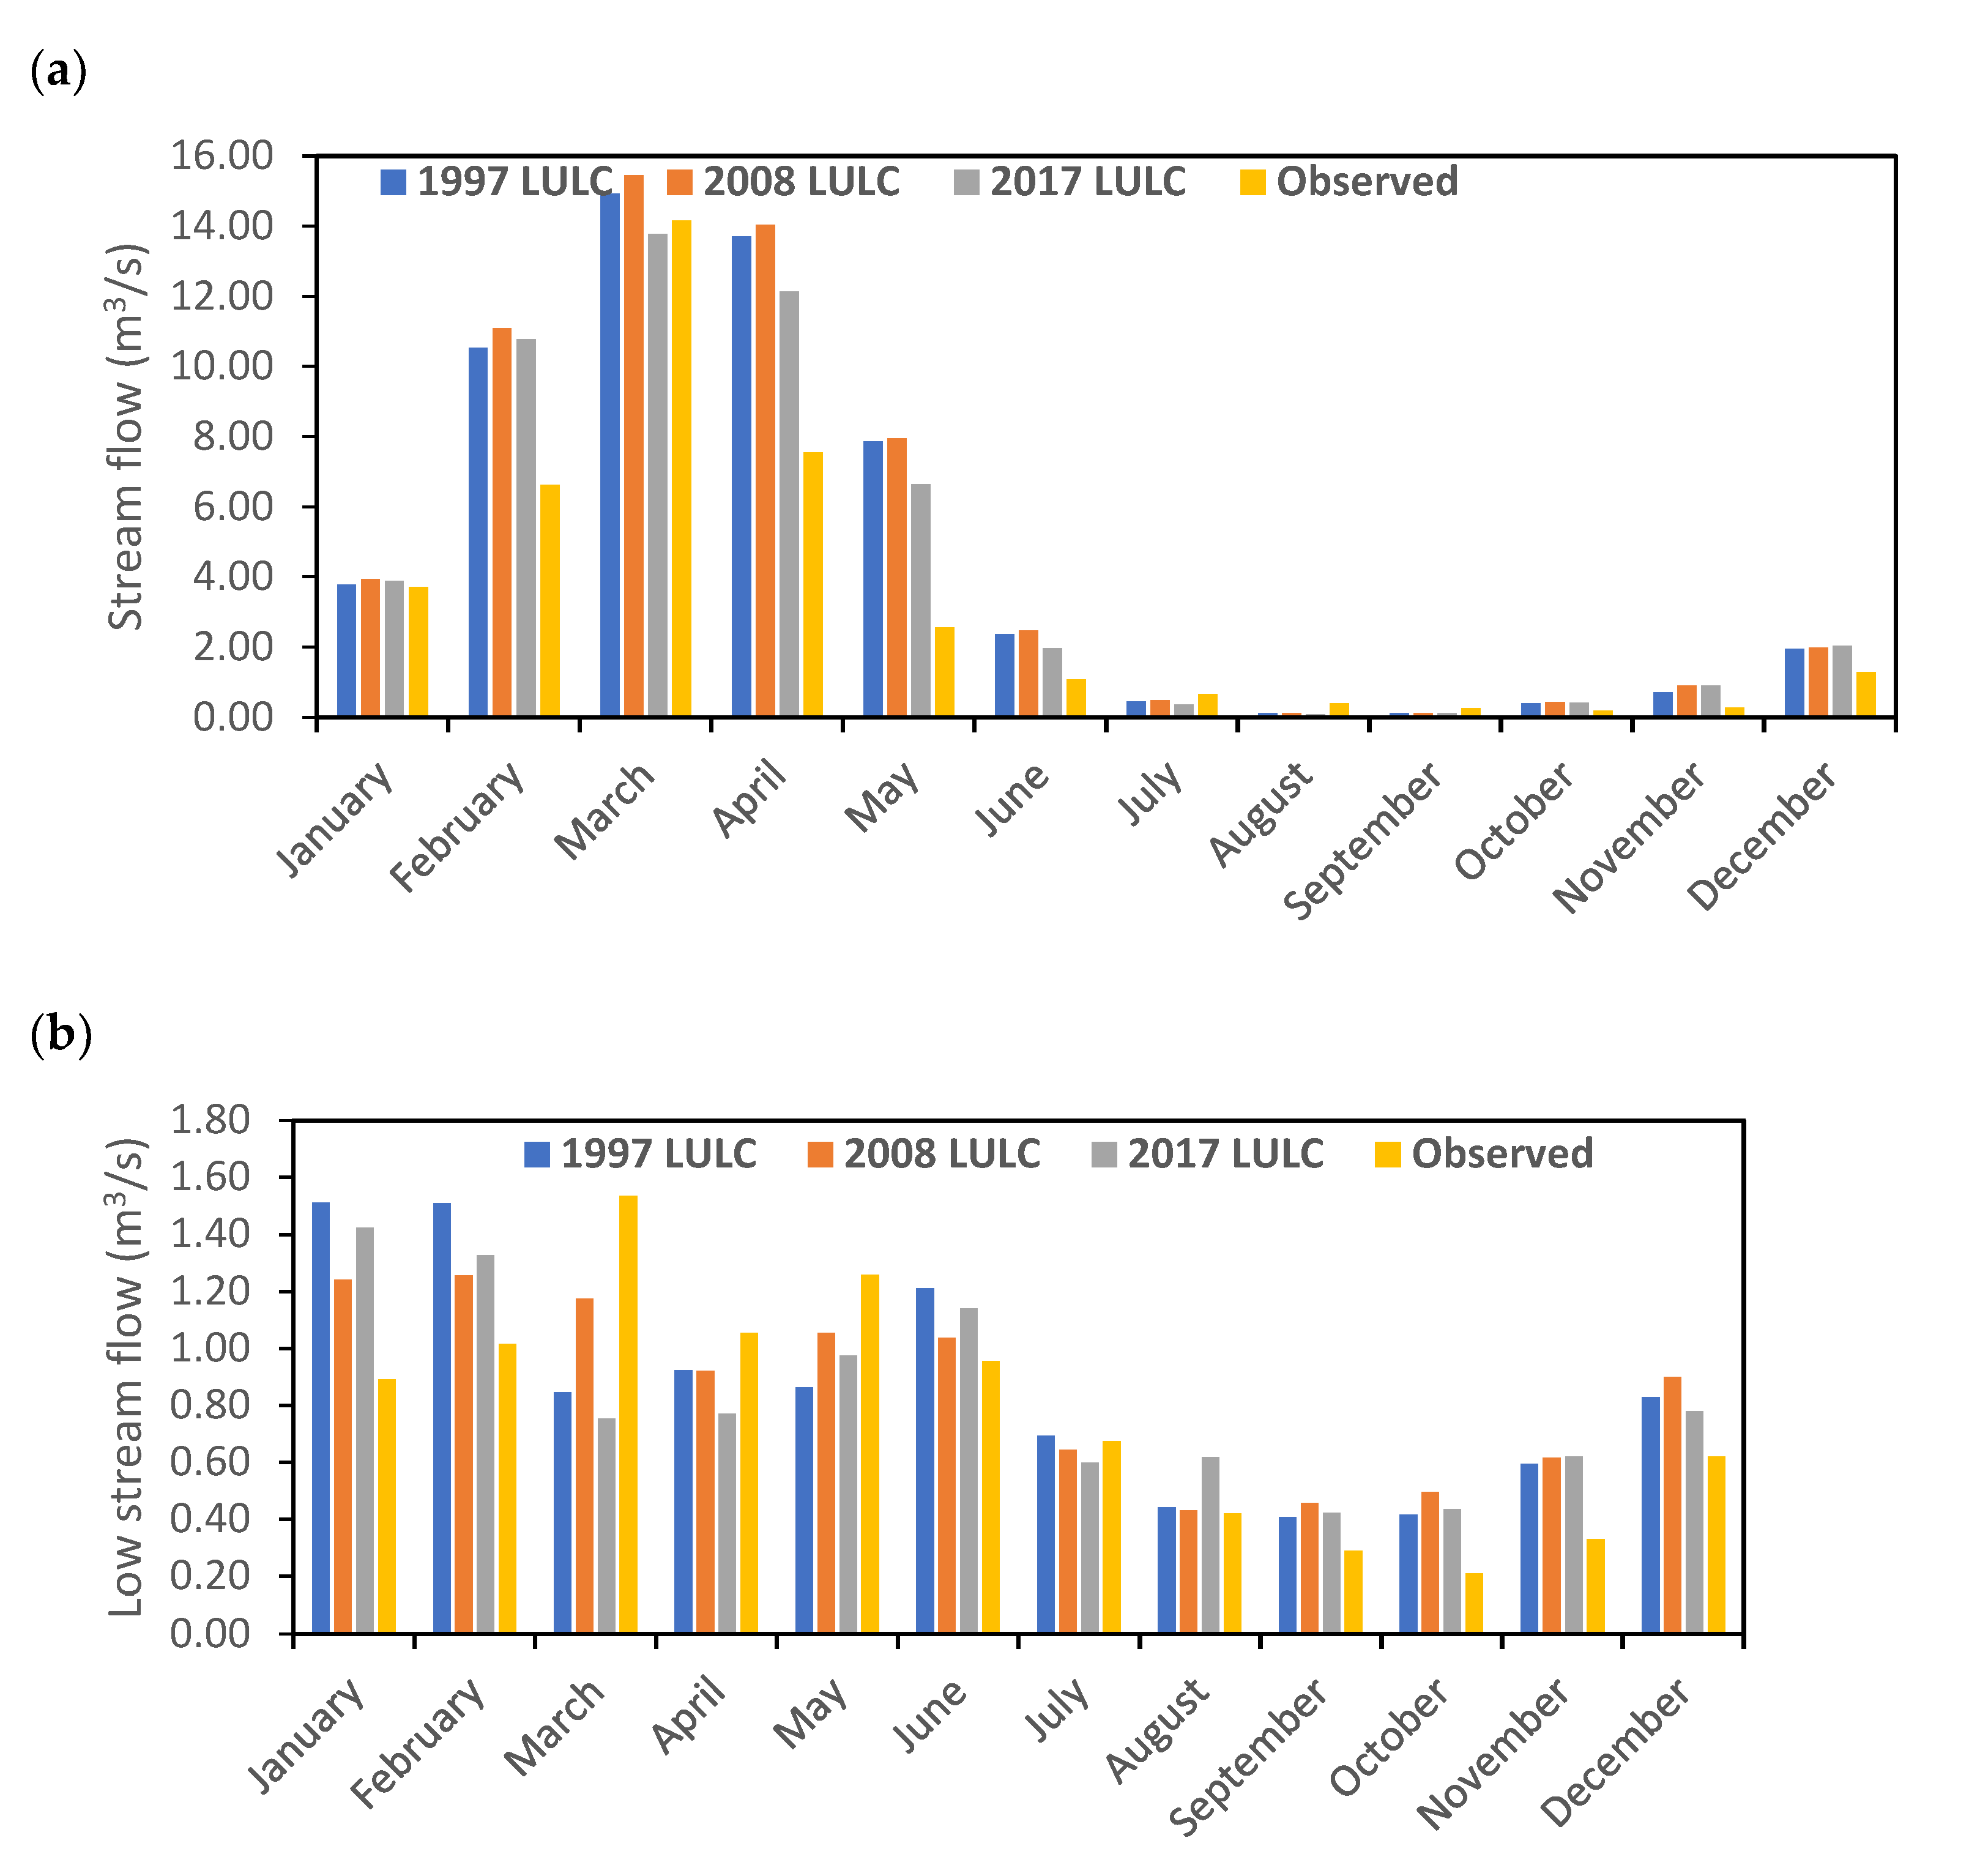
The impacts of LULC change on the hydrology of the Gaborone Dam catchment were simulated using a calibrated and validated SWAT model. The hydrometeorological inputs used during calibration and validation remain the same during these runs. Three sets of simulations with varied LULC from 1997, 2008, and 2017 were conducted with a simulation period covering the period of 1985–2017. As noted in Section 3.2, a reference (control) experiment is based on the LULC of 1997, and the remaining two sensitivity experiments were run based on the LULC in 2008 and 2017. The simulated mean monthly streamflow from 1985 to 2017 under the three experimental setups shows a significant difference, in particular towards the end of the rainy season from February to July. There is no large difference during the peak rainy season from October to February of the following years (Figure 9). Monthly minimum simulated low flows simulated by the SWAT under the LULC, together with observed flow, are shown in Figure 10b.
The impact of LULC on the mean of minimum monthly low flows is visible in Figure 10b, where low flows decreased particularly during June, July, January, and February in response to the 2017 and 2008 LULC maps compared to the 1997 LULC.

3.4.2. Daily Average Annual Discharges

The change in daily average annual minimum and maximum discharges is presented in Table 8. The daily flows of 90 days of minimum flow show a very low difference between the LULC maps used during the simulations. The 2017 LULC map resulted in slightly higher flows for the November, December, and January flow categories. The simulated daily maximum flows using 2017 LULC are higher than the maximum flows simulated based on the 1997 LULC by about 12% for 90 days maximum flow. The differences in the average values of the IHA parameters in response to LULC changes in 2008 and 2017 relative to 1997 are shown in Table 8, and the result showed that an increase in daily maximum flows, particularly during the 3- and 7-day maximums in response to the 2017 LULC maps compared to the 1997 LULC.

3.4.3. Indices of Hydrological Alteration

The IHA results for 1-day, 3-day, 7-day, and 30-day minimum daily streamflow in the Gaborone Dam catchment revealed that there is no observed statistically significant count value between the pre- and post-impact periods, whereas for 1-day, 3-day, 7-day, 30-day, and 90-day maximum daily streamflow, there is little difference between the pre- and post-impact periods (Table 8). However, the 90-day minimum streamflow showed statistically significant count values between the pre- and post-impact periods, at least at the 80% significance level.
The Julian dates of annual minimum flow slightly change under changes in LULC, whereas the date of maximum flow remains the same. The average values of rise and fall rates decreased by about 31% and 5%, respectively, in response to changes in LULC in 2017 relative to 1997. A decrease in the duration of high pulses (Table 8) is also notable, which can affect the stream ecosystem by disrupting the riverine biodiversity and reducing the riverbank nutrient supply to the biosystem. The flood peak rises while its duration is reduced (Table 9) due to the difference in LULC between 1997 and 2017.

4. Discussion

In this study, we found that the SWAT model is robust enough to investigate the impact of LULC change on hydrologic processes in the semi-arid catchment of the Gaborone Dam. Results from the SWAT model showed that LULC changes had a considerable impact on the hydrologic process (e.g., surface runoff, evapotranspiration, water yield, and streamflow) of the Gaborone Dam catchment. The effects of LULC change on hydrological flows were quantified using the SWAT hydrological model [78]. The three maps of LULC for the years 1997, 2008, and 2017 were constructed using an RF classifier developed from the training of Landsat images of 2021 using the ESA World Land Cover Map as ground truth. The trained RF classifier has good performance (Table 2), and it can be used on other images outside the training data sets to determine the land cover maps for 1997, 2008, and 2017. The maps created in this manner are then used as inputs to the SWAT model to simulate the availability of water under the observed LULC change over the Gaborone Dam catchment. The simulation based on the LULC map of 1997 was used as a control simulation, whereas those based on the LULC maps of 2008 and 2017 were used as sensitivity simulations.
Our results revealed that evapotranspiration (green water) decreased while water yield (blue water) increased in the past few years in the Gaborone Dam catchments (Figure 9). The results of control and sensitivity experiments can be explained by the fact that a decrease in forest cover and expansion of pasture land can lead to increased surface runoff over the water shade, as noted in other studies [83,84,85,86] since a lower amount of water infiltrates into the soil and evapotranspiration decreases. For instance, the replacement of forests with croplands and grassland (pasture) usually decreases soil infiltration capacity, surface roughness, and root depth. These alterations in land-surface characteristics lead to a decrease mainly in evapotranspiration, water table depth, and an increase in runoff and soil moisture in agreement with previous results [87,88,89,90].
According to Abel et al. [91], the reverse effects can occur in response to afforestation. In the southern sub-basin (sub-basin 7), an increase in pasture land (Figure 8a) led to low evapotranspiration since there was a concurrent decrease in both forests and shrubland and pasture land seasonally transpires, i.e., light brown or yellow grass cover turns green after rainy season [92], whereas some shrubs and forest trees transpire throughout the year [93,94,95]. In general, low evapotranspiration from moist soil surfaces and vegetation affects the processes of the hydrological cycle and energy balance of catchment areas [96].
The soil infiltration process is driven by initial soil moisture, ground cover, precipitation, soil characteristics, and slope [97,98,99], which in turn affects the amount of water in the soil [100,101]. The southern sub-basin 7 area has a dominant soil texture of sandy clay loam, and over this area, there is a reduction in forests and dense coverage of shrubland, which resulted in an increase in soil moisture (Figure 9) over the catchment areas. On the contrary, over large forest cover areas, a low soil moisture content could be caused by a high transpiration rate and the use of more water by the forests [102,103].
Moreover, studies have shown that LULCs are some of the drivers of catchment water yields [104,105,106]. Increased rainfall is not enough to enhance forest water yield due to the presence of soil evaporation and large amounts of vegetation transpiration over the areas [107]. An increase in water yield in a catchment is manifested as a decrease in evapotranspiration [108,109]. Similarly, in this study, the decrease in the spatial extent of forestland cover in 2017 relative to 1997 (Figure 8a) has played a significant role in increasing water yield.
We found that the minimum monthly low flows decreased (Figure 10) during most of the months in response to the 2017 and 2008 LULC maps compared to the 1997 LULC. The decrease in low streamflow in the dry season (June and July) due to LULC change has major ecological consequences [110,111,112]. The reduction in low flow due to changes in LULC is a potential indicator of the occurrence of hydrological drought [113].
The hydrology and ecosystem of the catchment can be influenced by any modification of the upstream watershed process [114]. The water supply and sediment flow are modified by LULC dynamics through the process of ecological changes, river channel networks, and aquatic ecosystems [115,116,117]. In the case of the Gaborone Dam catchment, where land use change increases the runoff or streamflow, flooding incidence can increase, leading to the severe alteration of some stream habitats [118]. The major components of flow regimes that influence ecological processes are the rate of change in streamflow, frequency, magnitude, duration, and timing [119].
Expansion of pasture over southern sub-basins 4-5 and 7 reduces groundwater and evapotranspiration (Figure 8 and Figure 9). This result is consistent with the findings of Tekleab et al. [120] and Gashaw et al. [121]. The decrease in soil moisture over sub-basin 7 through LULC dynamics and increased runoff during the rainy season with high grazing pressure causes vulnerability to severe soil erosion [122]. Thus, human-caused LULC change commences soil erosion in the catchment.
Consequently, the post-impact of the 2017 LULC map of high flow was slightly higher relative to 1997 in November, December, and January (Table 8), creating a high flood peak or flash flow. Also, during this post-impact time, a decrease in low flow during June, July, January, and February might result in a changed morphology of the river course [117,123,124]. The high flood peak maintains a healthy zone of riparian communities in the river stream by delivering a side connection between the floodplains and river course and the riparian zone [125,126]. Nevertheless, when peak flow increases, it could move a substantial amount of sediments, which disrupts benthic invertebrates [117,127]. However, it is also worth noting that the IHA result revealed that there is no statistically significant count value in the Gaborone Dam catchment for 1-day, 3-day, 7-day, and 30-day minimum daily streamflow. However, for the 90-day minimum daily streamflow, a statistically significant (at least at 80% significance level) increment was observed. In addition, the Indices of hydrological alteration result for mean values of rise and fall rates decreased by about 31% and 5% (Table 8), respectively, together with the decrease in the duration of high pulses, which are identified by some studies as indicative of catchment areas being affected by landscape change [124,128].
Both spatial and temporal scale dynamics of LULC vary with responses of the river ecosystem [129], indicating the result of the flow in the Gaborone Dam catchment might not be the same as other river basins. Furthermore, the use of changes in streamflow and loading of sediments in geomorphic responses generated over floodplains of downstream rivers can also vary critically within the basin. Sustaining seasonal hydrologic variation is essential for maintaining aquatic ecosystems and local biodiversity [124].

5. Conclusions

To investigate the impact of LULC change on the hydrology of the Gaborone Dam catchment, this study uses Landsat 5 for 1997 and 2008 and Landsat 8 for 2017. In this effort, we used the Version 200 World Land Cover Map for 2021 as a ground truth to train a random forest (RF) classifier to identify land cover classes from Landsat 8 imageries of 2021 using the Google Earth Engine (GEE) Python API. With 1997, 2008, and 2017 LULC classifications, the impact of LULC change on the hydrological flow within the catchment was estimated using the Soil and Water Assessment Tool (SWAT) and Indicator of Hydrological Alteration (IHA).
The overall accuracy/kappa coefficient of the RF classifier is 0.99/0.99 for the training and 0.73/0.68 for the validation data sets, indicating excellent and substantial agreements with the ground truth, respectively. The result of calibration and validation for the SWAT model shows that the model was found to be good at capturing the observed stream flow. Moreover, a comparison with the data-based time series modeling approach shows the SWAT has better performance in simulating the stream flow of the basin.
The result of LULC change indicates an increase in pastureland from 28.13 to 44.91% between 1997 and 2017, a decrease in forest cover coverage from 41.95 to 30.75% and from 41.95 to 24.19% between 1997 and 2008 and 1997 and 2017, respectively, and a decrease in shrubland from 23.53 to 22.15% between 1997 and 2017. The expansion of pasture and cropland and the reduction in forests and shrubland led to a decline in the amount of groundwater recharge and evapotranspiration. The increase in soil moisture is related to forests and dense coverage of shrubs over most of the northeastern sub-basin (e.g., sub-basin 3) in 2017 relative to 1997. The decrease in evapotranspiration spatially follows the increase in percolation components and water yield as a result of LULC change between 1997 and 2017. Furthermore, the low soil moisture over sub-basin 7 is likely related to a decrease in forest cover. The result of LULC change also caused a reduction in low flow during dry periods and an increase in high flow during the rainy season.
In general, the impact of LULC change on hydrological flow has been clearly observed. The hydrological response to LULC change manifested in terms of a reduction in evapotranspiration, which affects biological functions in terrestrial ecosystems and leads to a reduction in the water table by altering soil water recharge capacity. Therefore, to reduce the impact of climate change and growing water demands by the city of Gaborone, appropriate land and water management tools at the catchment level are important for water resource management and ecosystem protection.

Author Contributions

Conceptualization, B.K.A. and G.M.T.; methodology, B.K.A. and G.M.T.; software, B.K.A. and G.M.T.; validation, B.K.A. and G.M.T.; formal analysis, B.K.A. and G.M.T.; investigation, B.K.A. and G.M.T.; resources, B.K.A. and G.M.T.; visualization, B.K.A. and G.M.T.; supervision, G.M.T.; funding acquisition, G.M.T. All authors have read and agreed to the published version of the manuscript.

Funding

This research has been supported by the grant of O.R. Tambo Africa Research Chairs Initiative as supported by the Botswana International University of Science and Technology, the Ministry of Tertiary Education, Science and Technology; the National Research Foundation of South Africa (NRF); the Department of Science and Innovation of South Africa (DSI); the International Development Research Centre of Canada (IDRC); and the Oliver & Adelaide Tambo Foundation (OATF).

Institutional Review Board Statement

Not applicable.

Informed Consent Statement

Not applicable.

Data Availability Statement

Not applicable.

Acknowledgments

The authors would like to acknowledge that this work was carried out with the aid of a grant from the O.R. Tambo Africa Research Chairs Initiative as supported by the Botswana International University of Science and Technology, the Ministry of Tertiary Education, Science and Technology; the National Research Foundation of South Africa (NRF); the Department of Science and Innovation of South Africa (DSI); the International Development Research Centre of Canada (IDRC); and the Oliver & Adelaide Tambo Foundation (OATF).

Conflicts of Interest

The authors declare no conflict of interest.

References

  1. Duan, W.; He, B.; Takara, K.; Luo, P.; Nover, D.; Sahu, N.; Yamashiki, Y. Spatiotemporal Evaluation of Water Quality Incidents in Japan between 1996 and 2007. Chemosphere 2013, 93, 946–953. [Google Scholar] [CrossRef] [PubMed]
  2. Pangare, G. The Source of the Problem. 2006. Available online: https://scholar.google.com/scholar?hl=en&as_sdt=0%2C5&q=Pangare%2C+G.+2006.+The+Source+of+the+Problem.+Nature%3B+441%2C+28.+2.+&btnG= (accessed on 3 June 2023).
  3. Boretti, A.; Rosa, L. Reassessing the Projections of the World Water Development Report. NPJ Clean Water 2019, 2, 15. [Google Scholar] [CrossRef]
  4. Steffen, W.; Richardson, K.; Rockström, J.; Cornell, S.E.; Fetzer, I.; Bennett, E.M.; Biggs, R.; Carpenter, S.R.; De Vries, W.; De Wit, C.A.; et al. Planetary Boundaries: Guiding Human Development on a Changing Planet. Science 2015, 347, 1259855. [Google Scholar] [CrossRef] [PubMed]
  5. Albert, J.S.; Destouni, G.; Duke-Sylvester, S.M.; Magurran, A.E.; Oberdorff, T.; Reis, R.E.; Winemiller, K.O.; Ripple, W.J. Scientists’ Warning to Humanity on the Freshwater Biodiversity Crisis. Ambio 2021, 50, 85–94. [Google Scholar] [CrossRef]
  6. Papa, F.; Crétaux, J.F.; Grippa, M.; Robert, E.; Trigg, M.; Tshimanga, R.M.; Kitambo, B.; Paris, A.; Carr, A.; Fleischmann, A.S.; et al. Water Resources in Africa under Global Change: Monitoring Surface Waters from Space. Surv. Geophys. 2023, 44, 43–93. [Google Scholar] [CrossRef] [PubMed]
  7. Mulligan, M.; Fisher, M.; Sharma, B.; Xu, Z.X.; Ringler, C.; Mahé, G.; Jarvis, A.; Ramírez, J.; Clanet, J.C.; Ogilvie, A.; et al. The Nature and Impact of Climate Change in the Challenge Program on Water and Food (CPWF) Basins. Water Int. 2011, 36, 96–124. [Google Scholar] [CrossRef]
  8. Magombeyi, M.; Akpofure, T.; Barron, J. Rural Poverty and Food Insecurity Mapping at District Level for Improved Agricultural Water Management in the Limpopo River Basin; CGIAR Challenge Program on Water and Food (CPWF): Colombo, Sri Lanka, 2013. [Google Scholar]
  9. UNFCC. Climate Change and Freshwater Resources; UNFCC: Rio de Janeiro, Brazil, 2015. [Google Scholar]
  10. Batisani, N.; Yarnal, B. Rainfall Variability and Trends in Semi-Arid Botswana: Implications for Climate Change Adaptation Policy. Appl. Geogr. 2010, 30, 483–489. [Google Scholar] [CrossRef]
  11. Mengistu Tsidu, G. Southern Africa between 5° and 30°S [in “State of the Climate in 2015”]. Bull. Am. Meteorol. Soc. 2016, 97, S192–S193. [Google Scholar] [CrossRef]
  12. Tirivarombo, S.; Oromeng, G. Remote Sensing for Drought Assessment and Monitoring: A Case of Botswana. In Recent Advances in Environmental Science from the Euro-Mediterranean and Surrounding Regions; 2018; pp. 1753–1755. [Google Scholar]
  13. Lindhe, A.; Rosén, L.; Johansson, P.; Water, T.N. Dynamic Water Balance Modelling for Risk Assessment and Decision Support on MAR Potential in Botswana. Water 2020, 12, 721. [Google Scholar] [CrossRef]
  14. Himanshu, S.K.; Pandey, A.; Shrestha, P. Application of SWAT in an Indian River Basin for Modeling Runoff, Sediment and Water Balance. Environ. Earth Sci. 2017, 76, 1–18. [Google Scholar] [CrossRef]
  15. Farrington, E.M. The Water Crisis in Gaborone: Investigating the Underlying Factors Resulting in the ‘Failure’ of the Gaborone Dam, Botswana. Bachelor’s Thesis, Lund University, Lund, Sweden, 2015. [Google Scholar]
  16. Thakur, B.K.; Bal, D.P.; Nurujjaman, M.; Debnath, K. Developing a Model for Residential Water Demand in the Indian Himalayan Region of Ravangla; Elsevier: South Sikkim, India, 2023. [Google Scholar]
  17. Motho, M.; Kolawole, O.D.; Motsholapheko, M.R.; Mogomotsi, P.K. Influence of Household Demographic and Socio-Economic Factors on Water Demand in Ngamiland District, Botswana. Water Sci. 2022, 36, 48–59. [Google Scholar] [CrossRef]
  18. Botswana Environment Statistics. Natural Disasters Digest 2017; Botswana Environment Statistics: Maun, Botswana, 2018. [Google Scholar]
  19. Mao, G.; Liu, J.; Han, F.; Meng, Y.; Tian, Y.; Zheng, Y.; Zheng, C. Assessing the Interlinkage of Green and Blue Water in an Arid Catchment in Northwest China. Environ. Geochem. Health 2020, 42, 933–953. [Google Scholar] [CrossRef] [PubMed]
  20. Falkenmark, M.; Rockström, J. The New Blue and Green Water Paradigm: Breaking New Ground for Water Resources Planning and Management Water for Food and Hunger Alleviation. J. Water Resour. Plan. Manag. 2006, 132, 129–132. [Google Scholar] [CrossRef]
  21. Hoekstra, A.Y.; Chapagain, A.K.; Van Oel, P. Progress in Water Footprint Assessment; MDPI: Basel, Switzerland, 2019. [Google Scholar]
  22. Pandey, A.; Palmate, S.S. Assessments of Spatial Land Cover Dynamic Hotspots Employing MODIS Time-Series Datasets in the Ken River Basin of Central India. Arab. J. Geosci. 2018, 11, 1–8. [Google Scholar] [CrossRef]
  23. Swain, S.; Sahoo, S.; Kumar Taloor, A.; Mishra, S.K.; Pandey, A. Exploring Recent Groundwater Level Changes Using Innovative Trend Analysis (ITA) Technique over Three Districts of Jharkhand, India. Groundw. Sustain. Dev. 2022, 18, 100783. [Google Scholar] [CrossRef]
  24. Aragaw, H.M.; Goel, M.K.; Mishra, S.K. Hydrological Responses to Human-Induced Land Use/Land Cover Changes in the Gidabo River Basin, Ethiopia. Hydrol. Sci. J. 2021, 66, 640–655. [Google Scholar] [CrossRef]
  25. Kan, G.; He, X.; Ding, L.; Li, J.; Liang, K.; Hong, Y. Study on Applicability of Conceptual Hydrological Models for Flood Forecasting in Humid, Semi-Humid Semi-Arid and Arid Basins in China. Water 2017, 9, 719. [Google Scholar] [CrossRef]
  26. Dhami, B.; Himanshu, S.K.; Pandey, A.; Gautam, A.K. Evaluation of the SWAT Model for Water Balance Study of a Mountainous Snowfed River Basin of Nepal. Environ. Earth Sci. 2018, 77, 21. [Google Scholar] [CrossRef]
  27. Negussie, K.G.; Wyss, D.; Knox, N.; Vallejo Orti, M.; Corral-Pazos-de-Provens, E.; Kappas, M. Evaluating Swat Model for Streamflow Estimation in the Semi-Arid Okavango-Omatako Catchment, Namibia. SSRN Electron. J. 2022, 16, 385–403. [Google Scholar] [CrossRef]
  28. Simić, Z.; Milivojević, N.; Prodanović, D.; Milivojević, V.; Perović, N. SWAT-Based Runoff Modeling in Complex Catchment Areas-Theoretical Background and Numerical Procedures. J. Serbian Soc. Comput. Mech. 2009, 3, 38–63. [Google Scholar]
  29. Neitsch, S.L.; Arnold, J.G.; Kiniry, J.R.; Williams, J.R. Soil and Water Assessment Tool Theoretical Documentation Version 2009; Texas Water Resources Institute: College Station, TX, USA, 2011. [Google Scholar]
  30. Arnold, J.G.; Moriasi, D.N.; Gassman, P.W.; Abbaspour, K.C.; White, M.J.; Srinivasan, R.; Santhi, C.; Harmel, R.D.; Van Griensven, A.; Van Liew, M.W.; et al. SWAT: Model Use, Calibration, and Validation. Trans. ASABE 2012, 55, 1491–1508. [Google Scholar] [CrossRef]
  31. Daniel, E.B.; Camp, J.V.; Leboeuf, E.J.; Penrod, J.R.; Dobbins, J.P.; Abkowitz, M.D. Watershed Modeling and Its Applications: A State-of-the-Art Review. Open Hydrol. J. 2011, 5, 1874. [Google Scholar] [CrossRef]
  32. Maliva, R.; Missimer, T. Arid Lands Water Evaluation and Management; Springer Science & Business Media: London, UK, 2012. [Google Scholar] [CrossRef]
  33. Aadhar, S.; Swain, S.; Rath, D.R. Application and Performance Assessment of SWAT Hydrological Model over Kharun River Basin, Chhattisgarh, India. In World Environmental and Water Resources Congress 2019: Watershed Management, Irrigation and Drainage, and Water Resources Planning and Management; American Society of Civil Engineers: Reston, VA, USA, 2019; pp. 272–280. [Google Scholar] [CrossRef]
  34. Swain, S. Hydrological Modeling through Soil and Water Assessment Toolin a Climate Change Perspective a Brief Review. In Proceedings of the 2017 2nd International Conference for Convergence in Technology, Mumbai, India, 7–9 April 2017; pp. 358–361. [Google Scholar] [CrossRef]
  35. Breiman, L. Random Forests. Mach. Learn 2001, 45, 5–32. [Google Scholar] [CrossRef]
  36. Du, P.; Samat, A.; Waske, B.; Liu, S.; Photogrammetry, Z.L.-I. Random Forest and Rotation Forest for Fully Polarized SAR Image Classification Using Polarimetric and Spatial Features; Elsevier: Amsterdam, The Netherlands, 2015. [Google Scholar]
  37. Palmer, M.; Science, A.R. Linkages between Flow Regime, Biota, and Ecosystem Processes: Implications for River Restoration. Science 2019, 365, eaaw2087. [Google Scholar] [CrossRef] [PubMed]
  38. Rodriguez-Galiano, V.F.; Ghimire, B.; Rogan, J.; Chica-Olmo, M.; Rigol-Sanchez, J.P. An Assessment of the Effectiveness of a Random Forest Classifier for Land-Cover Classification; Elsevier: Amsterdam, The Netherlands, 2012. [Google Scholar]
  39. Belgiu, M.; Csillik, O. Sentinel-2 Cropland Mapping Using Pixel-Based and Object-Based Time-Weighted Dynamic Time Warping Analysis. Remote Sens. Environ. 2018, 204, 509–523. [Google Scholar] [CrossRef]
  40. Aladejana, O.O.; Salami, A.T.; Adetoro, O.I.O. Hydrological Responses to Land Degradation in the Northwest Benin Owena River Basin, Nigeria. J. Environ. Manag. 2018, 225, 300–312. [Google Scholar] [CrossRef] [PubMed]
  41. Hajati, M.C.; White, S.; Moosdorf, N.; Santos, I.R. Modeling Catchment-Scale Nitrogen Losses Across a Land-Use Gradient in the Subtropics. Front. Earth Sci. 2020, 8, 347. [Google Scholar] [CrossRef]
  42. Arnold, J.G.; Srinivasan, R.; Muttiah, R.S.; Williams, J.R. Large Area Hydrologic Modeling and Assessment Part I: Model Development. J. Am. Water Resour. Assoc. 1998, 34, 73–89. [Google Scholar] [CrossRef]
  43. Dile, Y.T.; Karlberg, L.; Srinivasan, R.; Rockström, J. Investigation of the Curve Number Method for Surface Runoff Estimation in Tropical Regions. J. Am. Water Resour. Assoc. 2016, 52, 1155–1169. [Google Scholar] [CrossRef]
  44. Population and Housing Census: Population of Towns, Villages and Associated Localities | Statistics Botswana. 2011. Available online: https://www.statsbots.org.bw/2011-population-and-housing-census-population-towns-villages-and-associated-localities (accessed on 7 June 2023).
  45. Meinhardt, M.; Fleischer, M.; Fink, M.; Kralisch, S.; Kenabatho, P.; de Clercq, W.P.; Zimba, H.; Phiri, W.; Helmschrot, J. Semi-Arid Catchments under Change: Adapted Hydrological Models to Simulate the Influence of Climate Change and Human Activities on Rainfall-Runoff Processes. Biodivers. Ecol. 2018, 6, 114–130. [Google Scholar] [CrossRef]
  46. Derber, J.C.; Parrish, D.F.; Lord, S.J. The New Global Operational Analysis System at the National Meteorological Center. Weather Forecast. 1991, 6, 538–547. [Google Scholar] [CrossRef]
  47. Adler, R.F.; Huffman, G.J.; Chang, A.; Ferraro, R.; Xie, P.P.; Janowiak, J.; Rudolf, B.; Schneider, U.; Curtis, S.; Bolvin, D. The Version-2 Global Precipitation Climatology Project (GPCP) Monthly Precipitation Analysis (1979–Present). J. Hydrometeorol. 2003, 4, 1147–1167. [Google Scholar] [CrossRef]
  48. Huffman, G.J.; Adler, R.F.; Morrissey, M.M.; Bolvin, D.T.; Curtis, S.; Joyce, R.; McGavock, B.; Susskind, J. Global Precipitation at One-Degree Daily Resolution from Multisatellite Observations. J. Hydrometeorol. 2001, 2, 36–50. [Google Scholar] [CrossRef]
  49. Gelaro, R.; McCarty, W.; Suárez, M.J.; Todling, R.; Molod, A.; Takacs, L.; Randles, C.A.; Darmenov, A.; Bosilovich, M.G.; Reichle, R. The Modern-Era Retrospective Analysis for Research and Applications, Version 2 (MERRA-2). J. Clim. 2017, 30, 5419–5454. [Google Scholar] [CrossRef] [PubMed]
  50. Bosilovich, M.G.; Robertson, F.R.; Chen, J. Global Energy and Water Budgets in MERRA. J. Clim. 2011, 24, 5721–5739. [Google Scholar] [CrossRef]
  51. Lim, Y.K.; Kovach, R.M.; Pawson, S.; Vernieres, G. The 2015/16 El Niño Event in Context of the MERRA-2 Reanalysis: A Comparison of the Tropical Pacific with 1982/83 and 1997/98. J. Clim. 2017, 30, 4819–4842. [Google Scholar] [CrossRef] [PubMed]
  52. Kuma, H.G.; Feyessa, F.F.; Demissie, T.A. Hydrologic Responses to Climate and Land-Use/Land-Cover Changes in the Bilate Catchment, Southern Ethiopia. J. Water Clim. Chang. 2021, 12, 3750–3769. [Google Scholar] [CrossRef]
  53. Abijith, D.; Saravanan, S. Assessment of Land Use and Land Cover Change Detection and Prediction Using Remote Sensing and CA Markov in the Northern Coastal Districts of Tamil Nadu, India. Environ. Sci. Pollut. Res. 2021, 29, 86055–86067. [Google Scholar] [CrossRef]
  54. Tassi, A.; Vizzari, M. Object-Oriented LULC Classification in Google Earth Engine Combining SNIC, GLCM, and Machine Learning Algorithms. Remote Sens. 2020, 12, 3776. [Google Scholar] [CrossRef]
  55. Foody, G.M. Status of land cover classification accuracy assessment. Remote Sens. Environ. 2002, 80, 185–201. [Google Scholar] [CrossRef]
  56. Abdi, A.M. Land Cover and Land Use Classification Performance of Machine Learning Algorithms in a Boreal Landscape Using Sentinel-2 Data. GIsci. Remote Sens. 2020, 57, 1–20. [Google Scholar] [CrossRef]
  57. Monserud, R.A.; Leemans, R. Comparing Global Vegetation Maps with the Kappa Statistic; Elsevier: Amsterdam, The Netherlands, 1992. [Google Scholar]
  58. Ismail, M.; Jusoff, K. Satellite Data Classification Accuracy Assessment Based from Reference Dataset. Int. J. Geol. Environ. Eng. 2008, 2, 23–29. [Google Scholar]
  59. Zang, C.; Liu, J.; Gerten, D.; Jiang, L. Influence of Human Activities and Climate Variability on Green and Blue Water Provision in the Heihe River Basin, NW China. J. Water Clim. Chang. 2015, 6, 800–815. [Google Scholar] [CrossRef]
  60. Rost, S.; Gerten, D.; Bondeau, A.; Lucht, W.; Rohwer, J.; Schaphoff, S. Agricultural Green and Blue Water Consumption and Its Influence on the Global Water System. Water Resour. Res. 2008, 44, 9405. [Google Scholar] [CrossRef]
  61. Howell, T.A.; Steiner, J.L.; Schneider, A.D.; Evett, S.R.; Tolk, J.A. Seasonal and Maximum Daily Evapotranspiration of Irrigated Winter Wheat, Sorghum, and Corn—Southern High Plains. Trans. ASAE 1997, 40, 623–634. [Google Scholar] [CrossRef]
  62. Allen, R.; Pereira, L.; Raes, D.; Smith, M. Crop Evapotranspiration-Guidelines for Computing Crop Water Requirements—FAO Irrigation and Drainage Paper 56; FAO: Rome, Italy, 1998. [Google Scholar]
  63. Jimmy, R. Williams Flood Routing with Variable Travel Time or Variable Storage Coefficients. Trans. ASAE 1969, 12, 0100–0103. [Google Scholar] [CrossRef]
  64. Yang, J.; Reichert, P.; Abbaspour, K.C.; Xia, J.; Yang, H. Comparing Uncertainty Analysis Techniques for a SWAT Application to the Chaohe Basin in China; Elsevier: Amsterdam, The Netherlands, 2008. [Google Scholar]
  65. Abbaspour, K.C.; Johnson, C.A.; van Genuchten, M.T. Estimating Uncertain Flow and Transport Parameters Using a Sequential Uncertainty Fitting Procedure. Vadose Zone J. 2004, 3, 1340–1352. [Google Scholar] [CrossRef]
  66. Kobayashi, K.; Salam, M.U. Comparing Simulated and Measured Values Using Mean Squared Deviation and Its Components. Agron. J. 2000, 92, 345–352. [Google Scholar] [CrossRef]
  67. Gauch, H.G.; Hwang, J.T.G.; Fick, G.W. Model Evaluation by Comparison of Model-Based Predictions and Measured Values. Agron. J. 2003, 95, 1442–1446. [Google Scholar] [CrossRef]
  68. Sao, D.; Kato, T.; Tu, L.H.; Thouk, P.; Fitriyah, A.; Oeurng, C. Evaluation of Different Objective Functions Used in the SUFI-2 Calibration Process of SWAT-CUP on Water Balance Analysis: A Case Study of the Pursat River Basin, Cambodia. Water 2020, 12, 2901. [Google Scholar] [CrossRef]
  69. Abbaspour, K.C.; Rouholahnejad, E.; Vaghefi, S.R.I.N.I.V.A.S.A.N.B.; Srinivasan, R.; Yang, H.; Kløve, B. A Continental-Scale Hydrology and Water Quality Model for Europe: Calibration and Uncertainty of a High-Resolution Large-Scale SWAT Model. J. Hydrol. 2015, 524, 733–752. [Google Scholar] [CrossRef]
  70. Moriasi, D.N.; Gitau, M.W.; Pai, N.; Daggupati, P. Hydrologic and Water Quality Models: Performance Measures and Evaluation Criteria. Trans. ASABE 2015, 58, 1763–1785. [Google Scholar] [CrossRef]
  71. Kramar, V.; Alchakov, V. Time-Series Forecasting of Seasonal Data Using Machine Learning Methods. Algorithms 2023, 16, 248. [Google Scholar] [CrossRef]
  72. Forecasting: Principles and Practice-Rob J Hyndman, George Athanasopoulos-Google Books. Available online: https://books.google.co.bw/books?hl=en&lr=&id=_bBhDwAAQBAJ&oi=fnd&pg=PA7&ots=TinYth0QNO&sig=NyoBal8TzBbud_LH4Vfb6ywu_Cs&redir_esc=y#v=onepage&q&f=false (accessed on 26 August 2023).
  73. Rodrigues, D.B.B.; Gupta, H.V.; Mendiondo, E.M. A Blue/Green Water-Based Accounting Framework for Assessment of Water Security. Water Resour. Res. 2014, 50, 7187–7205. [Google Scholar] [CrossRef]
  74. Kaur, B.; Shrestha, N.K.; Daggupati, P.; Rudra, R.P.; Goel, P.K.; Shukla, R.; Allataifeh, N. Water Security Assessment of the Grand River Watershed in Southwestern Ontario, Canada. Sustainability 2019, 11, 1883. [Google Scholar] [CrossRef]
  75. Zhu, K.; Xie, Z.; Zhao, Y.; Lu, F.; Song, X.; Li, L.; Song, X. The Assessment of Greenwater Based on the SWAT Model: A Case Study in the Hai River Basin, China. Water 2018, 10, 798. [Google Scholar] [CrossRef]
  76. Richter, B.D.; Baumgartner, J.V.; Powell, J.; Braun, D.P. A Method for Assessing Hydrologic Alteration within Ecosystems; Wiley Online Library: New York, NY, USA, 1996. [Google Scholar]
  77. Anderson, J. A Land Use and Land Cover Classification System for Use with Remote Sensor Data; US Government Printing Office: Washington, DC, USA, 1976. [Google Scholar]
  78. Moriasi, D.N.; Arnold, J.G.; Van Liew, M.W.; Bingner, R.L.; Harmel, R.D.; Veith, T.L. Model Evaluation Guidelines for Systematic Quantification of Accuracy in Watershed Simulations. Trans. ASABE 2007, 50, 885–900. [Google Scholar] [CrossRef]
  79. Koycegiz, C.; Buyukyildiz, M. Calibration of SWAT and Two Data-Driven Models for a Data-Scarce Mountainous Headwater in Semi-Arid Konya Closed Basin. Water 2019, 11, 147. [Google Scholar] [CrossRef]
  80. Thavhana, M.P.; Savage, M.J.; Moeletsi, M.E. SWAT Model Uncertainty Analysis, Calibration and Validation for Runoff Simulation in the Luvuvhu River Catchment, South Africa; Elsevier: New York, NY, USA, 2018. [Google Scholar]
  81. Mengistu, A.G.; van Rensburg, L.D.; Woyessa, Y.E. Techniques for Calibration and Validation of SWAT Model in Data Scarce Arid and Semi-Arid Catchments in South Africa; Elsevier: New York, NY, USA, 2019. [Google Scholar]
  82. Leng, M.; Yu, Y.; Wang, S.; Zhang, Z. Simulating the Hydrological Processes of a Meso-Scale Watershed on the Loess Plateau, China. Water 2020, 12, 878. [Google Scholar] [CrossRef]
  83. Brown, A.E.; Zhang, L.; McMahon, T.A.; Western, A.W.; Vertessy, R.A. A Review of Paired Catchment Studies for Determining Changes in Water Yield Resulting from Alterations in Vegetation. J. Hydrol. 2005, 310, 28–61. [Google Scholar] [CrossRef]
  84. Yurtseven, I.; Serengil, Y.; Gökbulak, F.; Şengönül, K.; Ozhan, S.; Kılıç, U.; Uygur, B.; Ozçelik, M.S. Results of a Paired Catchment Analysis of Forest Thinning in Turkey in Relation to Forest Management Options. Sci. Total Environ. 2018, 618, 785–792. [Google Scholar] [CrossRef] [PubMed]
  85. Cai, X.; Riley, W.J.; Zhu, Q.; Tang, J.; Zeng, Z.; Bisht, G.; Randerson, J.T. Improving Representation of Deforestation Effects on Evapotranspiration in the E3SM Land Model. Geosci. Model Dev. 2019, 11, 2412–2427. [Google Scholar] [CrossRef]
  86. Cheng, L.; Zhang, L.; Chiew, F.H.S.; Canadell, J.G.; Zhao, F.; Wang, Y.-P.; Hu, X.; Lin, K. Quantifying the Impacts of Vegetation Changes on Catchment Storage-discharge Dynamics Using Paired-catchment Data. Water Resour. Res. 2017, 53, 5963–5979. [Google Scholar] [CrossRef]
  87. Marquart, A.; Geissler, K.; Heblack, J.; Lobas, C.; Münch, E.; Blaum, N. Individual Shrubs, Large Scale Grass Cover and Seasonal Rainfall Explain Invertebrate-Derived Macropore Density in a Semi-Arid Namibian Savanna. J. Arid Environ. 2020, 176, 104101. [Google Scholar] [CrossRef]
  88. Fernádez, P.; Minea, G.; Teodor, R.; Centeri, C. Effects of Grazing on Water Erosion, Compaction and Infiltration on Grasslands. Hydrology 2022, 9, 34. [Google Scholar] [CrossRef]
  89. Woldesenbet, T.A. Impact of Land Use and Land Cover Dynamics on Ecologically-Relevant Flows and Blue-Green Water Resources. Ecohydrol. Hydrobiol. 2022, 22, 420–434. [Google Scholar] [CrossRef]
  90. Rita, M.; Fonseca, S.; Elias, R.; Uagoda, S.; Marinho, H.; Chaves, L. Runoff, Soil Loss, and Water Balance in a Restored Karst Area of the Brazilian Savanna. Catena 2022, 222, 106878. [Google Scholar] [CrossRef]
  91. Chemura, A.; Rwasoka, D.; Mutanga, O.; Dube, T.; Mushore, T. The Impact of Land-Use/Land Cover Changes on Water Balance of the Heterogeneous Buzi Sub-Catchment, Zimbabwe. Remote Sens. Appl. 2020, 18, 100292. [Google Scholar] [CrossRef]
  92. Tsheko, R. Land Cover Land Use (LCLU) Classification Methods in Semi-Arid Botswana. J. Remote Sens. GIS 2021, 10, 497. [Google Scholar]
  93. Jeltsch, F.; Weber, G.E.; Grimm, V. Ecological Buffering Mechanisms in Savannas: A Unifying Theory of Long-Term Tree-Grass Coexistence. Plant Ecol. 2000, 150, 161–171. [Google Scholar] [CrossRef]
  94. Roques, K.G.; O’Connor, T.G.; Watkinson, A.R. Dynamics of Shrub Encroachment in an African Savanna: Relative Influences of Fire, Herbivory, Rainfall and Density Dependence. J. Appl. Ecol. 2001, 38, 268–280. [Google Scholar] [CrossRef]
  95. Lohmann, D.; Tietjen, B.; Blaum, N.; Joubert, D.F.; Jeltsch, F. Shifting Thresholds and Changing Degradation Patterns: Climate Change Effects on the Simulated Long-Term Response of a Semi-Arid Savanna to Grazing. J. Appl. Ecol. 2012, 49, 814–823. [Google Scholar] [CrossRef]
  96. Matin, M.A.; Bourque, C.P.-A.; Matin, M.A.; Bourque, C.P.-A. Influence of Vegetation Cover on Regional Evapotranspiration in Semi-Arid Watersheds in Northwest China. In Evapotranspiration—An Overview; IntechOpen: London, UK, 2013. [Google Scholar] [CrossRef]
  97. Ma, Q.; Cheng, F.; Liu, Y.; Wang, F.; Zhang, D.; Jin, H.; Ma, Q.; Cheng, F.; Liu, Y.; Wang, F.; et al. Spatial Heterogeneity of Soil Water Content in the Reversion Process of Desertification in Arid Areas. J. Arid. Land 2011, 3, 268–277. [Google Scholar] [CrossRef]
  98. Gabarrón-Galeote, M.A.; Martínez-Murillo, J.F.; Quesada, M.A.; Ruiz-Sinoga, J.D. Seasonal Changes in the Soil Hydrological and Erosive Response Depending on Aspect, Vegetation Type and Soil Water Repellency in Different Mediterranean. Solid Earth 2013, 4, 497–509. [Google Scholar] [CrossRef]
  99. Gómez-Plaza, A.; Alvarez-Rogel, J.; Albaladejo, J.; Castillo, V.M. Spatial Patterns and Temporal Stability of Soil Moisture across a Range of Scales in a Semi-arid Environment. Hydrol. Process. 2000, 14, 1261–1277. [Google Scholar] [CrossRef]
  100. Rodríguez-Iturbe, I.; Isham, V.; Cox, D.R.; Manfreda, S.; Porporato, A. Space-Time Modeling of Soil Moisture: Stochastic Rainfall Forcing with Heterogeneous Vegetation. Water Resour. Res. 2006, 42. [Google Scholar] [CrossRef]
  101. Liu, X.; Feng, X.; Fu, B. Changes in Global Terrestrial Ecosystem Water Use Efficiency Are Closely Related to Soil Moisture. Sci. Total Environ. 2020, 698, 134165. [Google Scholar] [CrossRef] [PubMed]
  102. Amundson, R.G.; Ali, A.R.; Belsky, A.J. Stomatal Responsiveness to Changing Light Intensityincreases Rain-Use Efficiency of below-Crown Vegetation in Tropical Savannas. J. Arid Environ. 1995, 29, 139–153. [Google Scholar] [CrossRef]
  103. Ludwig, F.; De Kroon, H.; Berendse, F.; Prins, H.H.T. The Influence of Savanna Trees on Nutrient, Water and Light Availability and the Understorey Vegetation. Plant Ecol. 2004, 170, 93–105. [Google Scholar] [CrossRef]
  104. Gordon, L.J.; Steffen, W.; Jönsson, B.F.; Folke, C.; Falkenmark, M.; Johannessen, Å. Human Modification of Global Water Vapor Flows from the Land Surface. Proc. Natl. Acad. Sci. USA 2005, 102, 7612–7617. [Google Scholar] [CrossRef]
  105. Wang, D.; Hejazi, M. Quantifying the Relative Contribution of the Climate and Direct Human Impacts on Mean Annual Streamflow in the Contiguous United States. Water Resour. Res. 2011, 47. [Google Scholar] [CrossRef]
  106. Destouni, G.; Jaramillo, F.; Prieto, C. Hydroclimatic Shifts Driven by Human Water Use for Food and Energy Production. Nat. Clim. Change 2012, 3, 213–217. [Google Scholar] [CrossRef]
  107. Chang, X.; Zhao, W.; Liu, B.; Liu, H.; He, Z.; Du, J. Can Forest Water Yields Be Increased with Increased Precipitation in a Qinghai Spruce Forest in Arid Northwestern China? Agric. For. Meteorol. 2017, 247, 139–150. [Google Scholar] [CrossRef]
  108. Li, G.; Jiang, C.; Zhang, Y.; Jiang, G. Available Online 13. Ecol. Indic. 2021, 120, 106926. [Google Scholar] [CrossRef]
  109. Hawthorne, S.N.; Lane, P.N.; Bren, L.J.; Sims, N.C. The Long Term Effects of Thinning Treatments on Vegetation Structure and Water Yield. For. Ecol. Manag. 2013, 310, 983–993. [Google Scholar] [CrossRef]
  110. Li, L.-J.; Zhang, L.; Wang, H.; Wang, J.; Yang, J.-W.; Jiang, D.-J.; Li, J.-Y.; Qin, D.-Y. Assessing the Impact of Climate Variability and Human Activities on Streamflow from the Wuding River Basin in China. Hydrol. Process. 2007, 21, 3485–3491. [Google Scholar] [CrossRef]
  111. Birkel, C.; Soulsby, C.; Tetzlaff, D. Modelling the Impacts of Land-Cover Change on Streamflow Dynamics of a Tropical Rainforest Headwater Catchment. Hydrol. Sci. J. 2012, 57, 1543–1561. [Google Scholar] [CrossRef]
  112. Chang, J.; Zhang, H.; Wang, Y.; Zhu, Y. Assessing the Impact of Climate Variability and Human Activities on Streamflow Variation. Hydrol. Earth Syst. Sci. 2016, 20, 1547–1560. [Google Scholar] [CrossRef]
  113. Liu, Y.; Wu, G.; Fan, X.; Gan, G.; Wang, W.; Liu, Y. Hydrological Impacts of Land Use/Cover Changes in the Lake Victoria Basin. Ecol. Indic. 2022, 145, 109580. [Google Scholar] [CrossRef]
  114. Nepal, S.; Flügel, W.-A.; Shrestha, A.B. Upstream-Downstream Linkages of Hydrological Processes in the Himalayan Region. Ecol. Process. 2014, 3, 19. [Google Scholar] [CrossRef]
  115. Bunn, S.E.; Arthington, A.H. Basic Principles and Ecological Consequences of Altered Flow Regimes for Aquatic Biodiversity. Environ. Manag. 2002, 30, 492–507. [Google Scholar] [CrossRef] [PubMed]
  116. Allan, J.D. Landscapes and Riverscapes: The Influence of Land Use on Stream Ecosystems. Annu. Rev. Ecol. Evol. Syst. 2004, 35, 257–284. [Google Scholar] [CrossRef]
  117. Poff, N.L.R.; Olden, J.D.; Pepin, D.M.; Bledsoe, B.P. Placing Global Stream Flow Variability in Geographic and Geomorphic Contexts. River Res. Appl. 2006, 22, 149–166. [Google Scholar] [CrossRef]
  118. James, L.A.; Lecce, S.A. Impacts of Land-Use and Land-Cover Change on River Systems. Treatise Geomorphol. 2013, 9, 768–793. [Google Scholar] [CrossRef]
  119. Mathews, R. A Six-Step Framework for Ecologically Sustainable Water Management. J. Contemp. Water Res. Educ. 2009, 131, 60–65. [Google Scholar] [CrossRef]
  120. Tekleab, S.; Mohamed, Y.; Uhlenbrook, S.; Wenninger, J. Hydrologic Responses to Land Cover Change: The Case of Jedeb Mesoscale Catchment, Abay/Upper Blue Nile Basin, Ethiopia. Hydrol. Process. 2014, 28, 5149–5161. [Google Scholar] [CrossRef]
  121. Gashaw, T.; Tulu, T.; Argaw, M.; Worqlul, A.W. Modeling the Impacts of Land Use–Land Cover Changes on Soil Erosion and Sediment Yield in the Andassa Watershed, Upper Blue Nile Basin, Ethiopia. Environ. Earth Sci. 2019, 78, 679. [Google Scholar] [CrossRef]
  122. Ebabu, K.; Tsunekawa, A.; Haregeweyn, N.; Adgo, E.; Meshesha, D.T.; Aklog, D.; Masunaga, T.; Tsubo, M.; Sultan, D.; Fenta, A.A. Effects of Land Use and Sustainable Land Management Practices on Runoff and Soil Loss in the Upper Blue Nile Basin, Ethiopia. Sci. Total Environ. 2019, 648, 1462–1475. [Google Scholar] [CrossRef]
  123. Rientjes, T.H.M.; Haile, A.T.; Kebede, E.; Mannaerts, C.M.M.; Habib, E.; Steenhuis, T.S. Changes in Land Cover, Rainfall and Stream Flow in Upper Gilgel Abbay Catchment, Blue Nile Basin–Ethiopia. Hydrol. Earth Syst. Sci. 2011, 15, 1979–1989. [Google Scholar] [CrossRef]
  124. Kennen, J.G.; Riva-Murray, K.; Beaulieu, K.M. Determining Hydrologic Factors That Influence Stream Macroinvertebrate Assemblages in the Northeastern US. Ecohydrology 2010, 3, 88–106. [Google Scholar] [CrossRef]
  125. Naiman, R.J.; Décamps, H. The Ecology of Interfaces: Riparian Zones. Annu. Rev. Ecol. Syst. 1997, 28, 621–658. [Google Scholar] [CrossRef]
  126. Konrad, C.P.; Brasher, A.M.D.; May, J.T. Assessing streamflow characteristics as limiting factors on benthic invertebrate assemblages in streams across the western United States. Freshw. Biol. 2008, 53, 1983–1998. [Google Scholar] [CrossRef]
  127. Townsend, C.R.; Dolédec, S.; Scarsbrook, M.R. Species Traits in Relation to Temporal and Spatial Heterogeneity in Streams: A Test of Habitat Templet Theory. Freshw. Biol. 1997, 37, 367–387. [Google Scholar] [CrossRef]
  128. Walsh, C.J.; Fletcher, T.D.; Ladson, A.R. Stream Restoration in Urban Catchments through Redesigning Stormwater Systems: Looking to the Catchment to Save the Stream. J. N. Am. Benthol. Soc. 2005, 24, 690–705. [Google Scholar] [CrossRef]
  129. Welde, K.; Conservation, B. Effect of Land Use Land Cover Dynamics on Hydrological Response of Watershed: Case Study of Tekeze Dam Watershed, Northern Ethiopia. Int. Soil Water Conserv. Res. 2017, 5, 1–16. [Google Scholar] [CrossRef]
Figure 1. The location of the study area.
Water 15 03364 g001
Figure 2. Gaborone Dam catchment (a) digital elevation model, (b) slope class, and (c) soil types.
Water 15 03364 g002
Figure 3. Schematic diagram for processing Landsat images and LULC classification.
Water 15 03364 g003
Figure 4. Measured and simulated monthly streamflow for the calibration (1985–1994) and validation (1995–2000) periods.
Water 15 03364 g004
Figure 5. Observed versus simulated streamflow for (a) calibration period (1985–1994) and (b) validation period (1995–2000).
Water 15 03364 g005
Figure 6. Monthly streamflow using time series models fit with observed (1986–2000) and simulated SWAT and Winters’ Multiplicative model for (1995–2000) output period (a); comparison of monthly average SWAT model and NASA Global Land Data Assimilation (GLDAS) evapotranspiration (b); and comparison of SWAT soil moisture and MERRA-2 soil moisture estimated from soil infiltration rate averaged over the whole Gaborone Dam catchment (c).
Water 15 03364 g006
Figure 7. LULC classes for 1997 (a), 2008 (b), and 2017 (c) over Gaborone Dam catchment.
Water 15 03364 g007aWater 15 03364 g007b
Figure 8. (a). Sub-basin-wide percentage change in selected land cover classes in 2017 relative to 1997. Left: pasture, middle: shrubs, and right: savanna tree. (b). The same as (a) but for percentage change in 2017 relative to 2008. (The numbers (1 to 7) in the figure refer to subasins described in Table 1).
Water 15 03364 g008
Figure 9. Spatial distribution of change in annual water resources in 2017 in response to LULC change in 2017 relative to 1997 LULC as depicted in Figure 7a. (The numbers in figure are subasins explanined in Table 1.)
Water 15 03364 g009
Figure 10. Stream flow for (a) monthly simulated streamflow and (b) monthly minimum simulated low flows at the Gaborone Dam averaged over the period of 1985–2000, which overlaps with observed stream flow.
Water 15 03364 g010
Table 1. Gaborone Dam sub-basin area distribution.
Sub-BasinArea [km2]% of Weight Area
1495.7611.59
2186.234.35
3542.7212.69
4418.839.79
5437.6610.23
6919.8521.5
71277.1329.85
Table 2. Validation error matrix of the classification results of the RF algorithms.
ForestShrubsPastureBuilt-UpBarrenWaterPA
Forest13172151831020.83
Shrubs379772294911310.5
Pasture48270218117615840.77
Built-up13761410114619510.4
Barren2191672071213270.74
Water518532215610.93
CA0.750.570.520.690.760.98
OA0.72
Kappa0.67
Table 3. Parameters values used in the SWAT model simulation.
No.Name of ParameterMinimumMaximumFitted ValueDescription
1R__CN2 0.200.20 0.03Soil Conservation Service (SCS) runoff curve number-f
2V__OV_N 1.501.500.79Manning’s “n” value for overland flow
3V__FFCB0.120.690.26Initial soil water storage expressed as a fraction of field capacity water content
4V__ESCO0.001.000.25Soil evaporation compensation factor
5V__CH_K22.00140.00100.32Effective hydraulic conductivity in main channel alluvium (mm/h)
6V__CH_N20.250.760.31Manning’s “n” value for the main channel.
7V__ALPHA_BF0.001.000.82Base flow alpha factor (days)
8V__GW_DELAY30.00450.0035.25Groundwater delay time (days)
9V__GWQMN0.002.001.72Threshold depth of water in the shallow aquifer required for
flow to occur (mm).
10V__SURLAG0.0020.0014.95Surface runoff lag time
11R__SOL_AWC0.001.000.30Available water capacity of the soil layer
12V__GW_REVAP0.020.200.11Groundwater “revap” coefficient.
Table 4. Calibration and validation statistical metrics for SWAT.
CalibrationValidation
p-factor0.810.43
R-factor2.280.72
R20.680.66
NSE0.630.64
PBIAS9.2–8.6
RSR0.610.69
Table 5. Model performance rating.
Performance RatingR2NSERSRPBIAS
Very Good0.75 < R2≤ 1.000.75 < NSE ≤ 1.000.00 ≤ RSR ≤ 0.50PBIAS < ±10
Good0.60 < R2 ≤ 0.750.65 < NSE ≤ 0.750.50 ≤ RSR ≤ 0.60±10 ≤ PBIAS < ±15
Satisfactory0.50 < R2 ≤ 0.600.50 < NSE ≤ 0.650.60 ≤ RSR ≤ 0.70±15 ≤ PBIAS < ±25
UnsatisfactoryR2≤ 0.50NSE ≤ 0.50RSR > 0.70PBIAS ≥ ±25
Table 6. Calibration and validation statistical metrics for time series modeling.
Winters’ Multiplicative
CalibrationValidation
R20.44350.0815
NSE0.44350.0815
PBIAS26.23%83.80%
RSR0.7391.0329
Table 7. Percentage of the basin covered by different land cover types and its dynamics, its mean annual sub-basin hydrological components, and its change.
TimeForestShrubs/Mixed F.PastureBuilt-UpBarrenWaterWater YieldSoil MoistureGWRCHGGWQET
%%%%%%mm/YearSW (mm)mm/Yearmm/Yearmm/Year
199741.5923.5328.135.450.720.5738.36411.7720.488.27281.09
200830.7534.0426.386.292.030.5143.47432.8019.087.67271.48
201724.1922.1544.915.322.860.5846.34433.4317.656.92272.60
2008–1997−10.8410.51 1.750.841.31 0.065.1221.03 1.40 0.59 9.61
2017–2008−6.56 11.8918.53 0.970.830.072.870.62 1.44 0.761.12
2017–1997−17.40−1.3816.78 0.132.140.017.9921.65 2.83 1.35 8.49
Table 8. Hydrological Index Alteration (HIA) using pre-impact of 1997 land use and land cover map and post-impact of 2017 land use and land cover map.
Hydrologic Parameter
IHA
IndicatorsPre-Impact Period:
Medians
1997 LULC
Post-Impact Period:
2017 LULC
Deviation
Factor
**** Significance
Count
Pre*** CDMedians*** C.D.Medians*** C.D.
Group-1
monthly water condition magnitude
January1.292.271.322.010.030.82
February2.447.041.886.560.230.89
March3.285.262.286.000.300.86
April2.965.292.664.590.100.84
May1.427.850.978.220.320.93
June0.574.300.355.700.390.61
July0.097.970.0512.870.440.49
August0.000.000.000.00
September0.000.000.000.00
October0.000.000.000.00
November0.242.910.322.670.320.88
December0.822.660.843.280.020.64
Group-2
* Magnitude and duration
of annual extreme water conditions
1-day minimum0.000.000.000.00--
3-day minimum0.000.000.000.00--
7-day minimum0.000.000.000.00--
30-day minimum0.0000.000.0000.00--
90-day minimum0.00434.360.00289.200.600.18
1-day maximum208.101.99203.702.050.020.95
3-day maximum124.801.86129.001.780.030.90
7-day maximum67.051.7568.671.770.020.98
30-day maximum27.681.8827.511.950.010.97
90-day maximum17.082.1915.102.430.120.89
Number of zero days1051.281121.1880.070.74
Group-3
Annual extreme water conditions
Julian date of annual minimum440.44450.470.010.73
Julian date of annua maximum390.22390.220.000.99
Group-4
** Frequency and duration
of high and low pulses
Low pulse count0000--
High pulse count60.5070.570.16670.65
High pulse duration5.50.363640.3750.270.96
Group-5
Rate and frequency of water
condition changes
Rise rate0.190.840.250.700.310.52
Fall rate 0.18 0.71 0.19 0.620.050.66
Number of reversals710.45710.400.000.88
Note: * For average monthly stream flow and for 1, 3, 7, 30, and 90 days of maximum and minimum flows, the unit is m3/s; ** duration of low and high pulse and zero flow days unit is in days, and the remaining IHA parameters are non-dimensional; *** coefficient of dispersion = (75th − 25th)/50th; deviation factor = (post − pre)/pre; **** A significance count value of 0 indicates presence of statistically significant differences between the pre- and post-impact periods, whereas a significance count value of 1 shows presence of only minor changes between the pre- and post-impact periods. The significance count is similar to a p-value in parametric statistics.
Table 9. Large flood parameters simulated using 1997 and 2017 LULC maps.
* EFC Parameters (High Floods)Median** CDDeviation FactorSignificance Count
PrePostPrePostMedians** CDMedians** CD
Flood peak (m3/s)9.8210.331.320.900.050.320.780.28
Flood duration (days)4.540.390.500.110.290.130.38
Flood timing (Julian dates)3563550.160.120.010.200.660.39
Flow frequency560.500.420.200.170.010.58
Flood rise rate5.325.781.260.960.090.240.900.51
Flood fall rate 1.85 2.29 0.79 0.600.240.240.150.45
Note: * EFC = environmental flow component, ** CD = coefficient of dispersion.
Disclaimer/Publisher’s Note: The statements, opinions and data contained in all publications are solely those of the individual author(s) and contributor(s) and not of MDPI and/or the editor(s). MDPI and/or the editor(s) disclaim responsibility for any injury to people or property resulting from any ideas, methods, instructions or products referred to in the content.