Article

Provenance and Pollution Status of River Sediments in the Danube Watershed in Serbia

by
Milica Kašanin-Grubin
1,*,
Violeta Gajić
2,
Gorica Veselinović
1,
Sanja Stojadinović
1,
Nevena Antić
1 and
Snežana Štrbac
1
1
Institute of Chemistry, Technology and Metallurgy, University of Belgrade, Njegoševa 12, 11000 Belgrade, Serbia
2
Faculty of Mining and Geology, University of Belgrade, Djušina 7, 11000 Belgrade, Serbia
*
Author to whom correspondence should be addressed.
Water 2023, 15(19), 3406; https://doi.org/10.3390/w15193406
Submission received: 31 August 2023 / Revised: 21 September 2023 / Accepted: 26 September 2023 / Published: 28 September 2023
(This article belongs to the Special Issue Fluvial Systems and River Geomorphology)

Abstract

:
Heavy metals as environmental pollutants can have natural or anthropogenic origin. To determine the river sediment pollution status, it is crucial to have appropriate reference samples, free of anthropogenic impact, and natural reference samples should be used wherever and whenever possible. The collection of reference samples should be performed in the vicinity of the research area in a place that belongs to the same geological environment and is undisturbed by human activity. The main purpose of this study was to compare concentrations of heavy metals from different rivers with background values to show that the usage of natural background values is the best option when assessing pollution status, but also to underline that the natural background values have to correspond to the analyzed sediments. In this study, 5 river sediments from Sava, 17 from Great War Island (GWI), 11 from Danube, 24 from Tisa, 47 from Tamiš, and 11 from Timok were evaluated relative to reference samples from the Sava and Tisa Rivers. The results indicate that geological origin has a strong influence on the content of heavy metals in river sediments, primarily regarding concentrations of Ni and Co. Furthermore, Tamiš, Tisa, Sava, and Danube sediments are under strong anthropogenic influence.

1. Introduction

Rivers, which deliver approximately 20 billion metric tons of transported sediment to oceans annually, play a key role in Earth’s surface processes, marine sedimentation, and biogeochemical cycles in oceans [1,2]. Anthropogenic inputs of pollutants can considerably change the composition of river waters and sediments [3]. The capacity of sediment to adsorb and retain contaminants depends on their characteristics, like the surface area and surface properties of the particles [4].
Heavy metals tend to accumulate in sediments and cause major environmental problems in river catchments [5]. Once heavy metals are discharged into a river system, they are distributed between the aqueous phase and bed sediment [6]. The main sources of heavy metals in drainage basins are the weathering of rocks and anthropogenic activities, and it is essential to distinguish between them. Understanding the source of heavy metals in river sediments is vital for understanding their impact on water ecosystems [7].
The main anthropogenic sources of heavy metals are mining and smelting, disposal of effluents containing heavy metals, industrial waste, and haphazard use of fertilizers and pesticides that contain heavy metals [6]. The concentrations of heavy metals are affected by the sediment mineralogy and grain size. The content of organic matter, clay-sized fraction, and surface area control the microelement mobility [8]. Microelements are adsorbed by organic substances and by Fe and Mn oxides, and the adsorption capacity increases as particle size decreases [4]. Adsorbed heavy metals can be released again into the environment by processes dependent on the pH and redox potential.
The geochemistry of river sediments depends on various controlling processes. To evaluate whether heavy metal contamination has occurred in sediments, it is necessary to compare the obtained results with a background concentration. Matchullat et al. [9] argued that there should not be an unmistakable definition of a background value and that it is “in principle almost impossible to quantify a true background value beyond doubt”. Furthermore, global background data should be used only for global models, and they are practically useless in answering regional or local problems [9].
Štrbac et al. [10] showed that the choice of background value can affect the assessment of the pollution status of a certain river. In the literature, the most commonly used are the average composition of upper continental crust, e.g., [11,12,13]; the average shale concentration of elements given by Turekian and Wedepohl [14], used by, e.g., Singh et al. [15]; sequential extraction, e.g., [16,17]; certified reference material, e.g., [18]; uncontaminated sediments from the area, e.g., [5,6,19,20]; and statistical methods, e.g., [21].
Both obtaining and using any of these suggested background values is challenging. Statistical methods are considered the most objective by some authors, e.g., [21], but they might be used only on large datasets containing both uncontaminated and contaminated sites; still, one must bear in mind that the results are influenced by the number of polluted samples and the amount of pollution. Using average shale values in areas where heavy-bearing minerals naturally occur can lead to false anomalies. Furthermore, false anomalies can arise since concentrations of heavy metals tend to vary with grain size [19].
While using natural background values, it is essential to ensure that the geochemical characteristics of these samples are natural, i.e., that no anthropogenic contamination has occurred. Determining a natural background is a very important task, and representative sampling should be done wherever and whenever possible. Representative sampling should be done in an area close to the area of interest, i.e., with the same geological setting, but undisturbed by human action.
In this study, we use two groups of reference samples: The first group contains eight samples from a Belgrade water source, which stratigraphically belongs to the Quaternary (Pleistocene and Holocene). These reference samples are marked with Sava BV. The second group is four alluvial sediments of the Tisa River, which stratigraphically also correspond to the Holocene and the abandoned meander. These reference samples are designated as Tisa BV.
Both groups have the following discriminants, crucial for natural background samples: 1. The background sediment samples petrologically correspond to the tested samples. Therefore, these samples structurally fall into the population of examined samples, which is, in this case, silty clays, clayey silts, and sandy–clayey silts. 2. These samples have an identical or similar sedimentological origin, i.e., they were deposited from alluvial systems. 3. The paleo-drainage areas of those alluvial systems partly or entirely correspond to the modern drainage areas of these rivers. 4. The mineralogical–petrographic compositions of the examined and reference samples are relatively uniform. 5. The reference samples do not have any anthropogenic influence.
Dendievel et al. [5] argued that despite two main approaches used, one being regulatory monitoring on stream sites and the other being studies assessing pollution trends based on sediment cores taken at a certain river location, synthesis works at the scale of large rivers are rather rare. One of those rare large-scale studies regarding the Danube Basin was performed by Woitke et al. [22]. The Danube River, with a length of ~2800 km and a catchment area of ~817,000 km2, is the second longest river in Europe [23]. Woitke et al. [22] showed that pollution was relatively low in the Austrian and Hungarian parts of the Danube, with an increase in the concentration of heavy metals at the Iron Gate Reservoir, and then a constant level or a slight decrease was found down to the Danube Delta.
Since up to 92% of Serbia lies within the Danube Basin, comprising ~10% of the total Danube Basin, it is necessary to explore the composition of river sediments. Further, about 90% of all Serbia’s accessible water originates from outside its territory; therefore, international cooperation on water issues is vital for Serbia [24].
The study aims to show that when analyzing heavy metals in river sediments, the origin of the eroded material reaching the rivers must be considered, so it is necessary to compare the obtained concentrations with properly selected background values. The main purpose of this study was to compare concentrations of heavy metals from different rivers with background values to show that the usage of natural background values is the best option when assessing pollution status, but also to underline that the natural background values must correspond to the analyzed sediments.
To prove the importance of this fact, the results of a multi-year examination of sediments from several locations, primarily from the Danube, Sava, Great War Island (GWI) Tisa, and Tamiš Rivers, are presented. Sediments from the Timok River are used as an example to further support this statement.

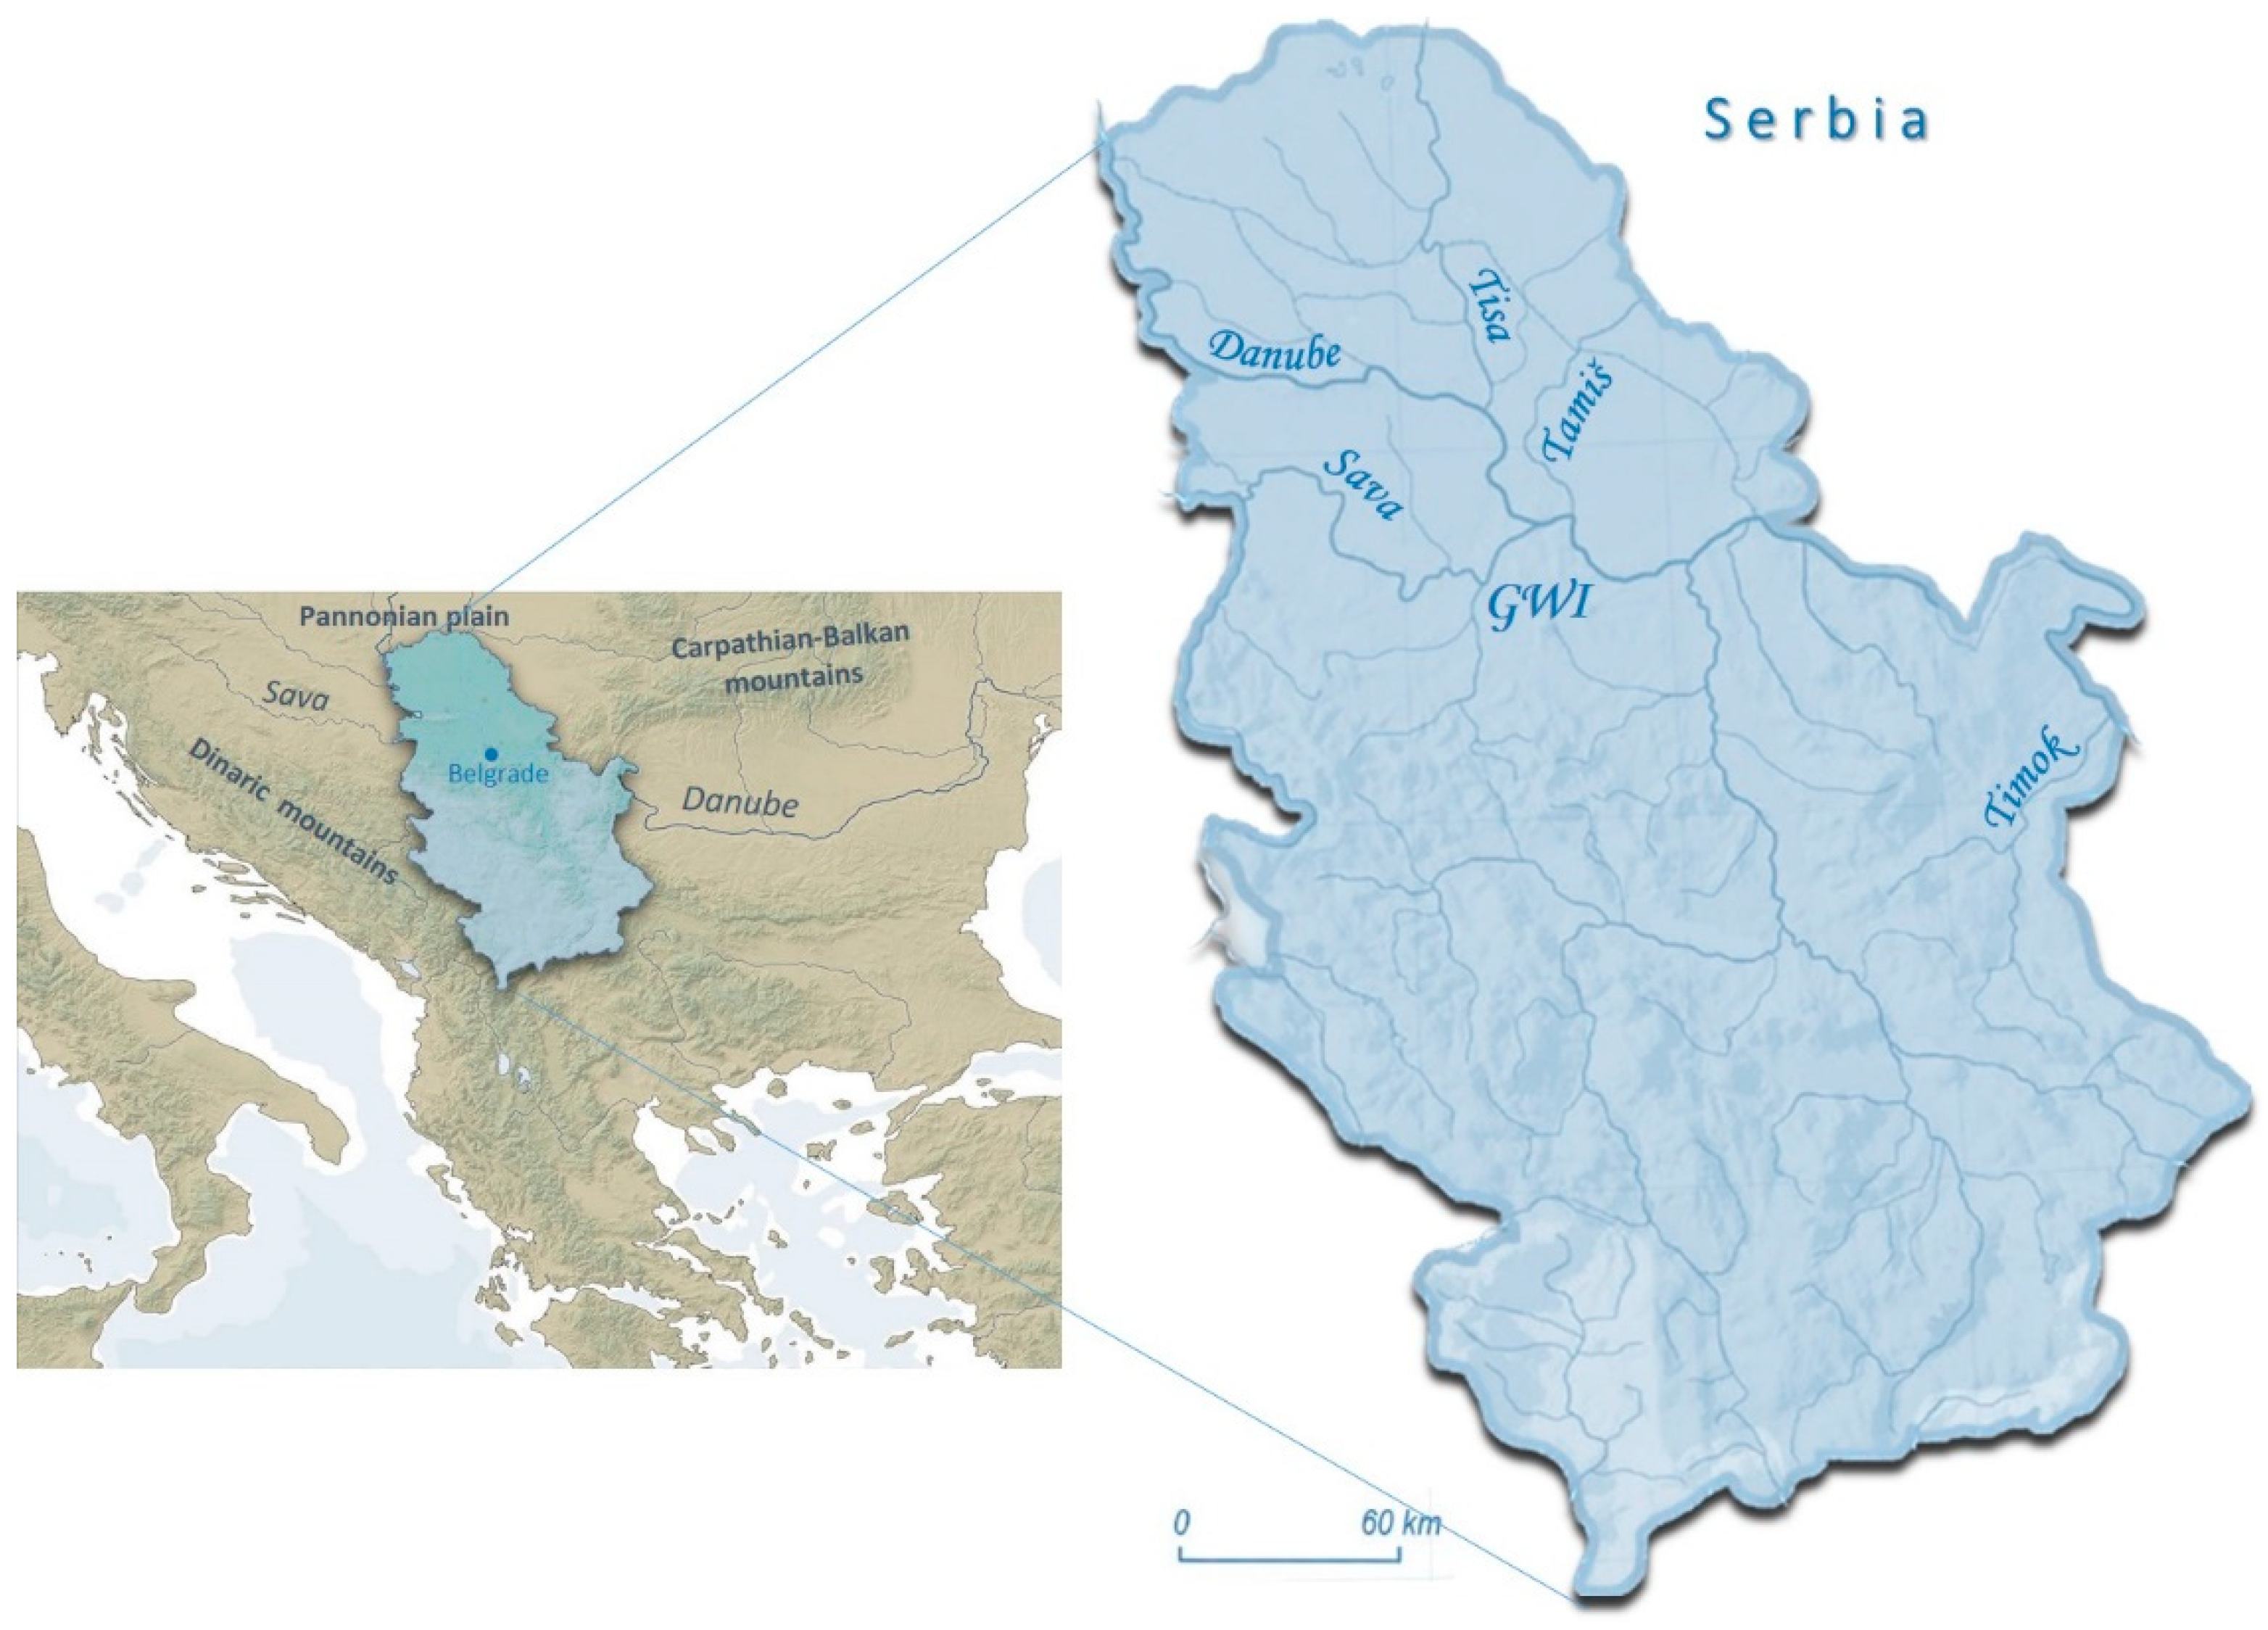
2. Study Areas and Methods

In this study, sediment samples from Tisa, Tamiš, Sava, Danube, GWI, and Timok were analyzed to determine the origin of heavy metals (Figure 1). A total of 127 samples were collected and analyzed for textural and chemical characteristics.
The Tisa River Basin, as the largest sub-basin of the Danube watershed, covers an area of 157,186 km2, which is about 20% of the Danube Basin (Figure 1). The Tisa River Basin is divided into mountainous Upper Tisa, with tributaries in Ukraine, Romania, and east Slovak Republic, and the lowland part in Hungary and Serbia. Anthropogenic impacts over the Tisa River course are high with permanent pollution from industrial activities, mainly municipal sewage discharges and agriculture [16]. In the past, the Tisa River has witnessed a large number of pollution accidents, of which the biggest one occurred in February 2000. During this incident, about 100,000 m3 of water and sludge with a high concentration of cyanide and trace metals from flotation tailings from a gold mine in Baja Mare, Romania, reached Tisa River and was further carried into the Danube River [25]. Along the 150 km Tisa River course in Serbia, a total of 24 surface sediment samples were collected [10].
Tamiš is the largest river in the Banat region, in northeast Serbia (Figure 1). It originates from Semenik Mountain in Romania, flows through the Banat region, and flows into the Danube 30 km east of Belgrade. The Tamiš River, with its main course 340 km long, 118 km of it in Serbia, is a small Danube tributary. Tamiš is draining Quaternary, mostly silty sediments. On several shorter sections of the course, Tamiš meanders laterally, eroding higher relief, loess plain, and loess terrace, forming high riverbanks in the form of steep sections and slopes. Tamiš River is polluted by water supply facilities, fish ponds, industry, agriculture, and urban settlements [26]. Forty-seven samples were collected from the Tamiš River for this study.
Five sediment samples from the Sava River were collected 30 km upstream from Belgrade, and 17 samples were collected at the GWI, which are places of sediment accumulation at the confluence of the Sava and Danube Rivers in Belgrade [27,28].
Great War Island is sedimentary and alluvial–accumulative, formed due to the slowing and stopping of sediments at the confluence of the Sava and Danube Rivers, and is constantly under process of changing shape and size (Figure 1). The total sediment thickness is estimated at about 25 m. The Great War Island has a special status based on its position, because it relies directly on the international waterways of the Danube and Sava Rivers. It is one of the repertoire points on the most important European waterway, which connects the North with the Black Sea via the Rhine–Main–Danube channel. The GWI covers a total area of 210.8 ha and is of unique ecological, cultural, historical, and recreational importance, located in the center of Belgrade.
Djerdap Lake was chosen as a location for the collection of samples from the Danube River for two main reasons. The first is its uniform geological setting, represented by the Lower Carboniferous granitoids, and the second reason is that Djerdap Lake represents a very favorable sediment archive since water and sediment from the entire upstream Danube River Basin, shared by many countries with a total population of about 80 million, concentrate in the Serbian sector of the Danube, especially in Djerdap Lake [29]. Eleven samples from the Danube River were collected before Djerdap Lake, at the Serbia–Romania border [30].
The Timok River, also known as Great Timok, is a river in eastern Serbia, a right tributary of the Danube River. For the last 15 km of its flow, it forms a border between eastern Serbia and western Bulgaria. The Timok River is 202 km long, and the watershed covers an area of 4626 km2. The geological setting consists of Neogene sediments, granitoides, metamorphic rocks, gabro, and limestones. Eleven sediment samples from the Timok River were collected for this study.
As background values, we used the composition of core sediments from the Tisa River [10] and the Sava River [27]. The reference samples were those whose geochemical characteristics are known to be natural, i.e., without any anthropogenic influences. In terms of mineralogical and structural characteristics, they are the closest to modern sediments from the Tisa River. Four samples of fine-grained clastic sediments from boreholes were selected. Stratigraphically, the reference samples belong to the Holocene. However, they are genetically linked to alluvial systems that are fed from petrologically very diverse and very wide margins. Facially, these are deposited partly from the flood plains and partly from abandoned meanders. Four core sediment samples were collected at ~10 km from the main Tisa River flow.
Eight Sava background samples were collected from the Belgrade spring, which stratigraphically belongs to the Quaternary (Pleistocene and Holocene). The Pleistocene fine-grained clastites are related to the model of small braided rivers, and those of the Holocene are related to the paleo-Sava as a meandering river.
The surface sediment samples were collected from the riverbanks using a small shovel, then stored in labeled plastic bags according to currently accepted international standards and transported to the laboratory [10,28,30].
To determine the composition of sediments, grain size and chemical analyses were conducted.
Grain size analysis was performed according to a standard wet sieving procedure for the sand fractions (using 1, 0.5, 0.25, 0.125, and 0.063 mm sieve sizes) and the standard pipet method for the <0.063 mm fraction [30].
The concentrations of macroelements were determined via X-ray fluorescence (XRF). For XRF analysis, samples of sediment were dried until constant mass at 105 °C, mixed with tableting wax in an 80:20 ratio, and pressed into pellets. Semiquantitative and qualitative analysis was performed using a Spectro Xepos Energy-Dispersive XRF (EDXRF) instrument with a binary cobalt/palladium alloy thick-target anode X-ray tube (50 W/60 kV) and combined polarized/direct excitation.
Determination of the heavy metal concentrations (As, Cd, Co, Cr, Cu, Ni, Pb, and Zn) in sediments was performed using an inductively coupled plasma optical emission spectrometer with axial view (Thermo Scientific iCAP 6000 series ICP-Spectrometer, Waltham, MA, USA). The emission wavelengths (nm) for determination were as follows: As 189.042, Cd 214.480, Co 228.616, Cr 267.716, Cu 327.393, Ni 231.604, Pb 216.997, and Zn 206.200. A more detailed procedure is given in [28,30].
The contamination factor (Cfi) was calculated as Cfi = Coi/Cni, where Coi is the concentration of heavy metals in sediment and Cni is a background value. The Cfi classes proposed by [31] are as follows: <1, low contamination factor; 1 ≤ Cfi < 3, moderate contamination factor; 3 ≤ Cfi ≤ 6, considerable contamination factor; >6, very high contamination factor.
Factor analysis was applied to identify the source of heavy metals (natural or anthropogenic) in river sediments. The factor analysis of heavy metal concentrations was conducted using SPSS 17.0 (AppOnFly, Inc., San Francisco, CA, USA).

3. Results

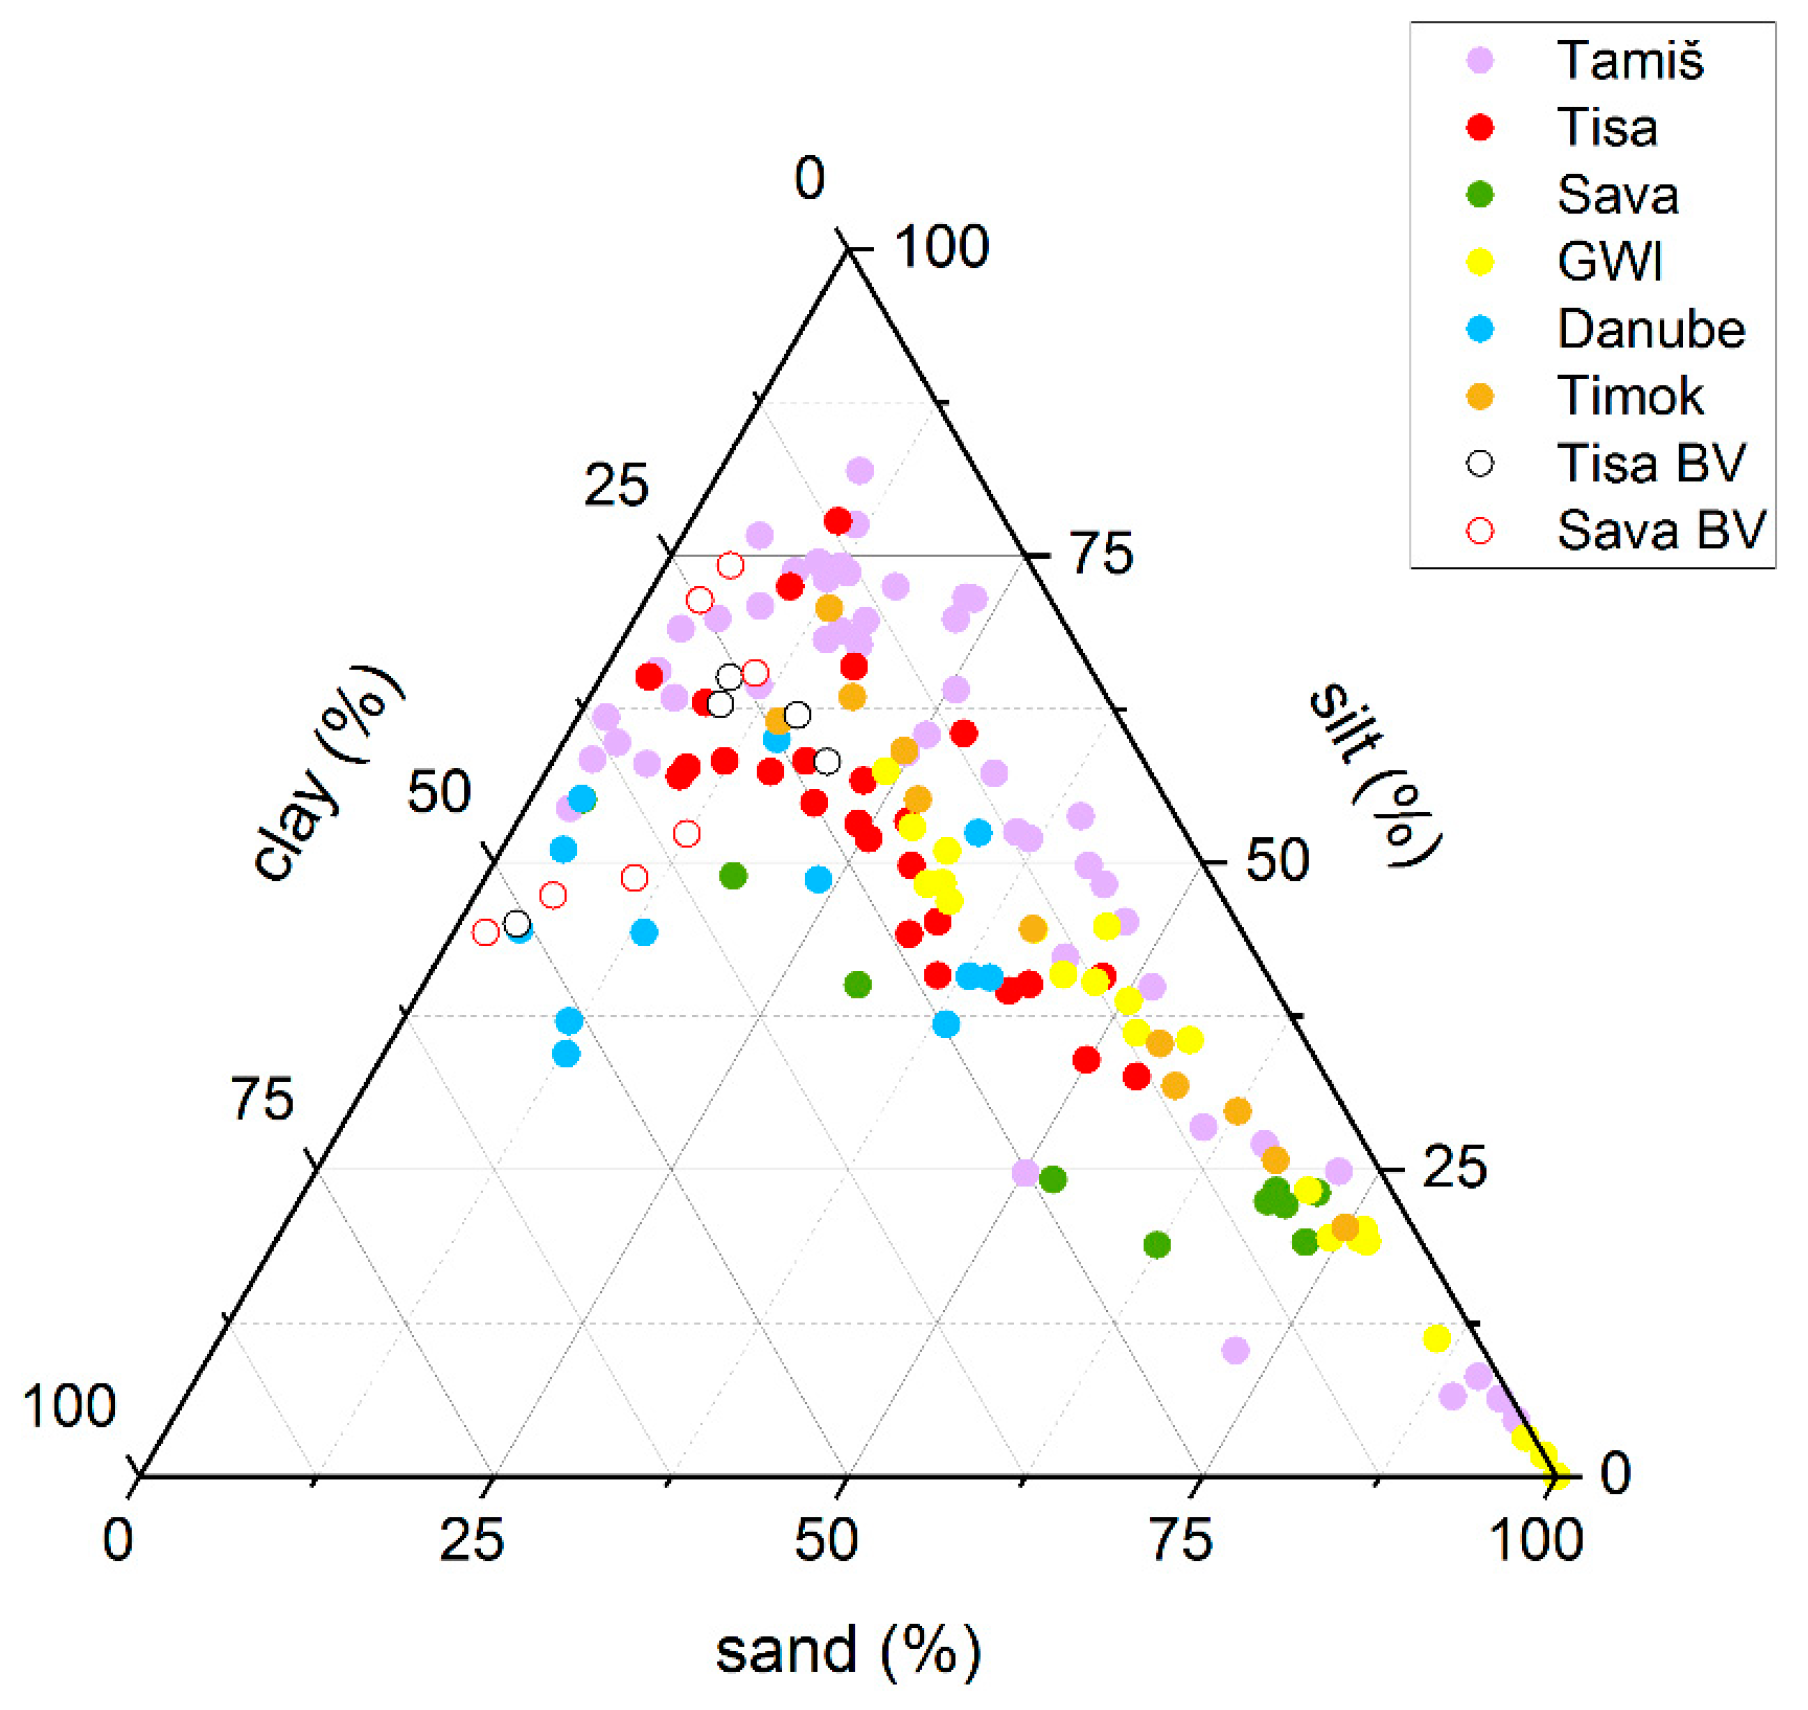
3.1. Grain Size Composition

The results of grain size analysis showed that the largest number of tested sediment samples from the Tisa, Tamiš, Sava, Danube, and Timok Rivers had a dominant silt fraction (0.05–0.005 mm). According to Sheppard’s [32] classification, these sediments are silts, clayey silts, sandy–clayey silts, and clayey–sandy silts (Figure 2). Generally, 65% of the investigated samples were defined as silts, and a smaller number of samples were dominated by clayey or sandy fractions.

3.2. Content of Macroelements

The content of macroelements in sediments from the Tisa, Tamiš, Sava, Danube, and Timok Rivers was determined to explore differences in the sources of the materials these rivers carry (Table 1).
SiO2, which in river sediments is most often present as quartz but is also a main constituent of all silicate minerals, was highest in both recent and reference sediments from the Tisa River, followed by the Timok River (46.51–58.07%) (Table 1). Aluminum, sodium, and potassium are mostly bound with clay minerals and feldspars. In the analyzed river sediments, these elements varied within small ranges: Al2O3, 13.32–16.45%; Na2O, 0.67–1.94%; K2O, 1.52–2.71%. Calcium and magnesium are primarily found in carbonate minerals, while Mg is also bound to chlorite.
The concentrations of Fe2O3, MnO, and TiO2, found in sulphides and silicates, and P2O5, mostly bound with organic matter, showed little variation between samples and were, on average, in the ranges of 5.56–7.40%, 2.22–3.80%, 0.11–0.18%, and 0.10–0.94%, respectively (Table 1). However, it is interesting that the lower end of the range was found in the Sava BV sediments, and the highest was found in the Tamiš River sediments, indicating the different sources of geological material these rivers are draining.

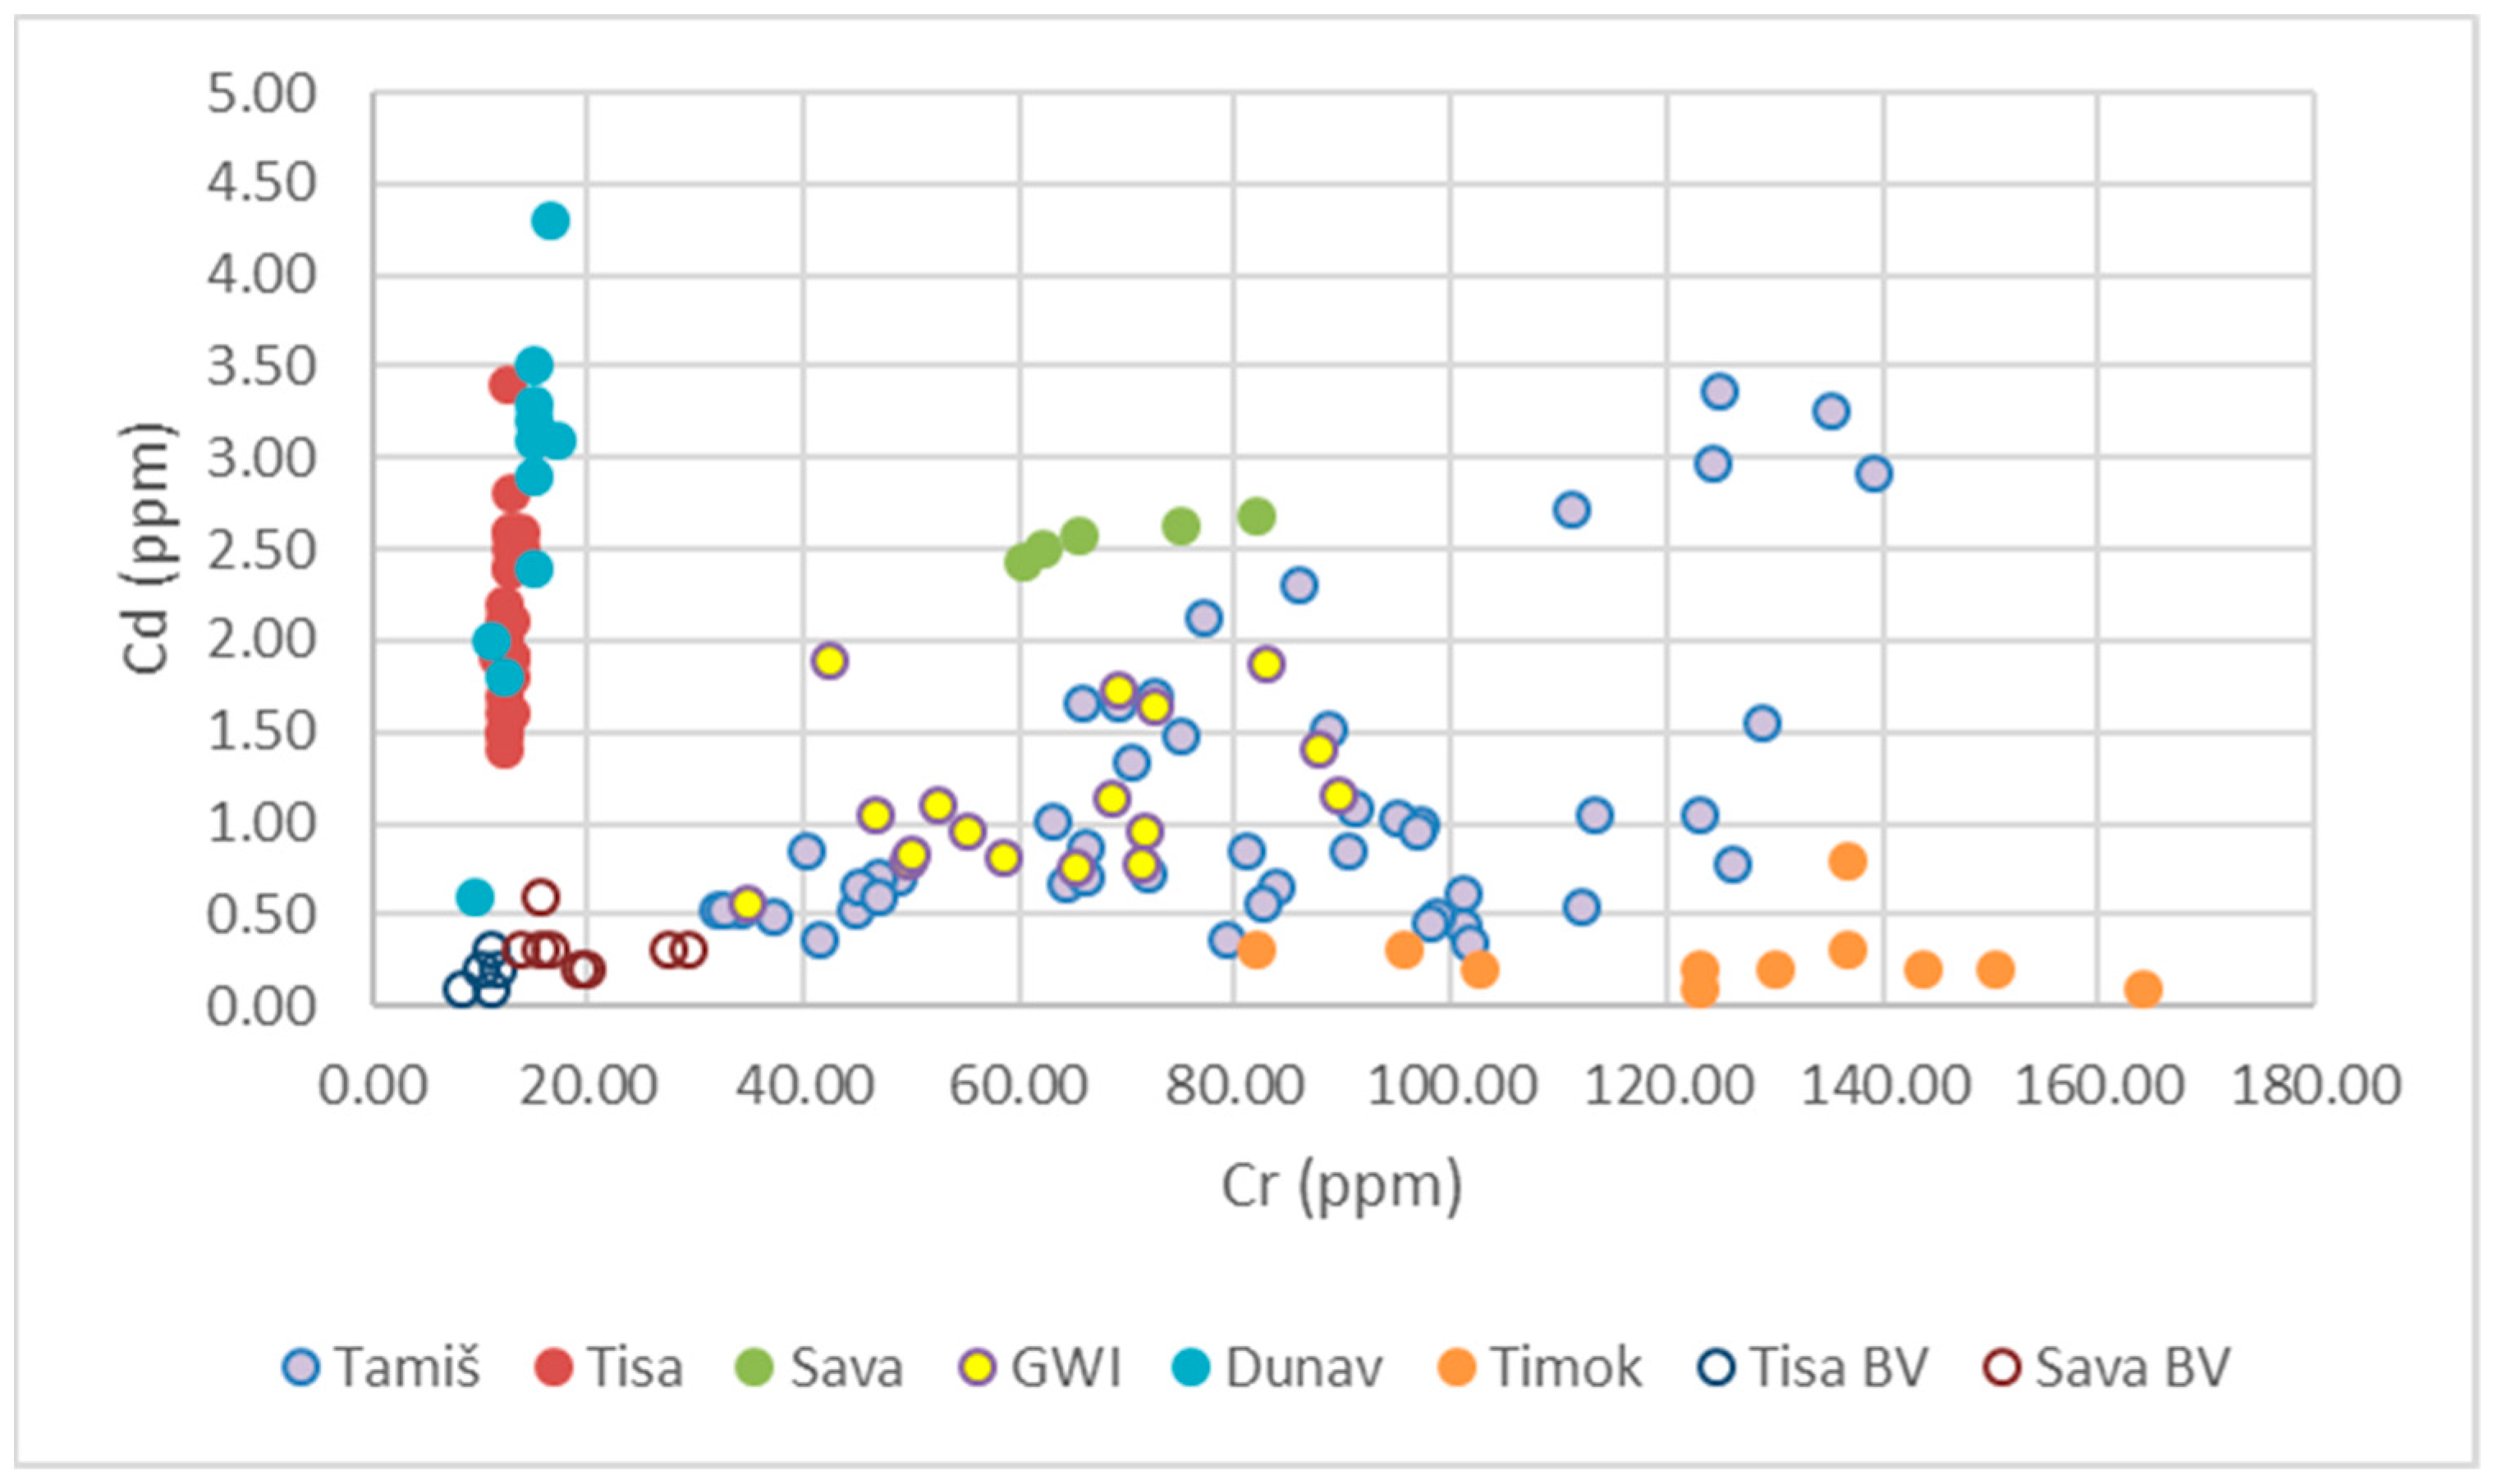
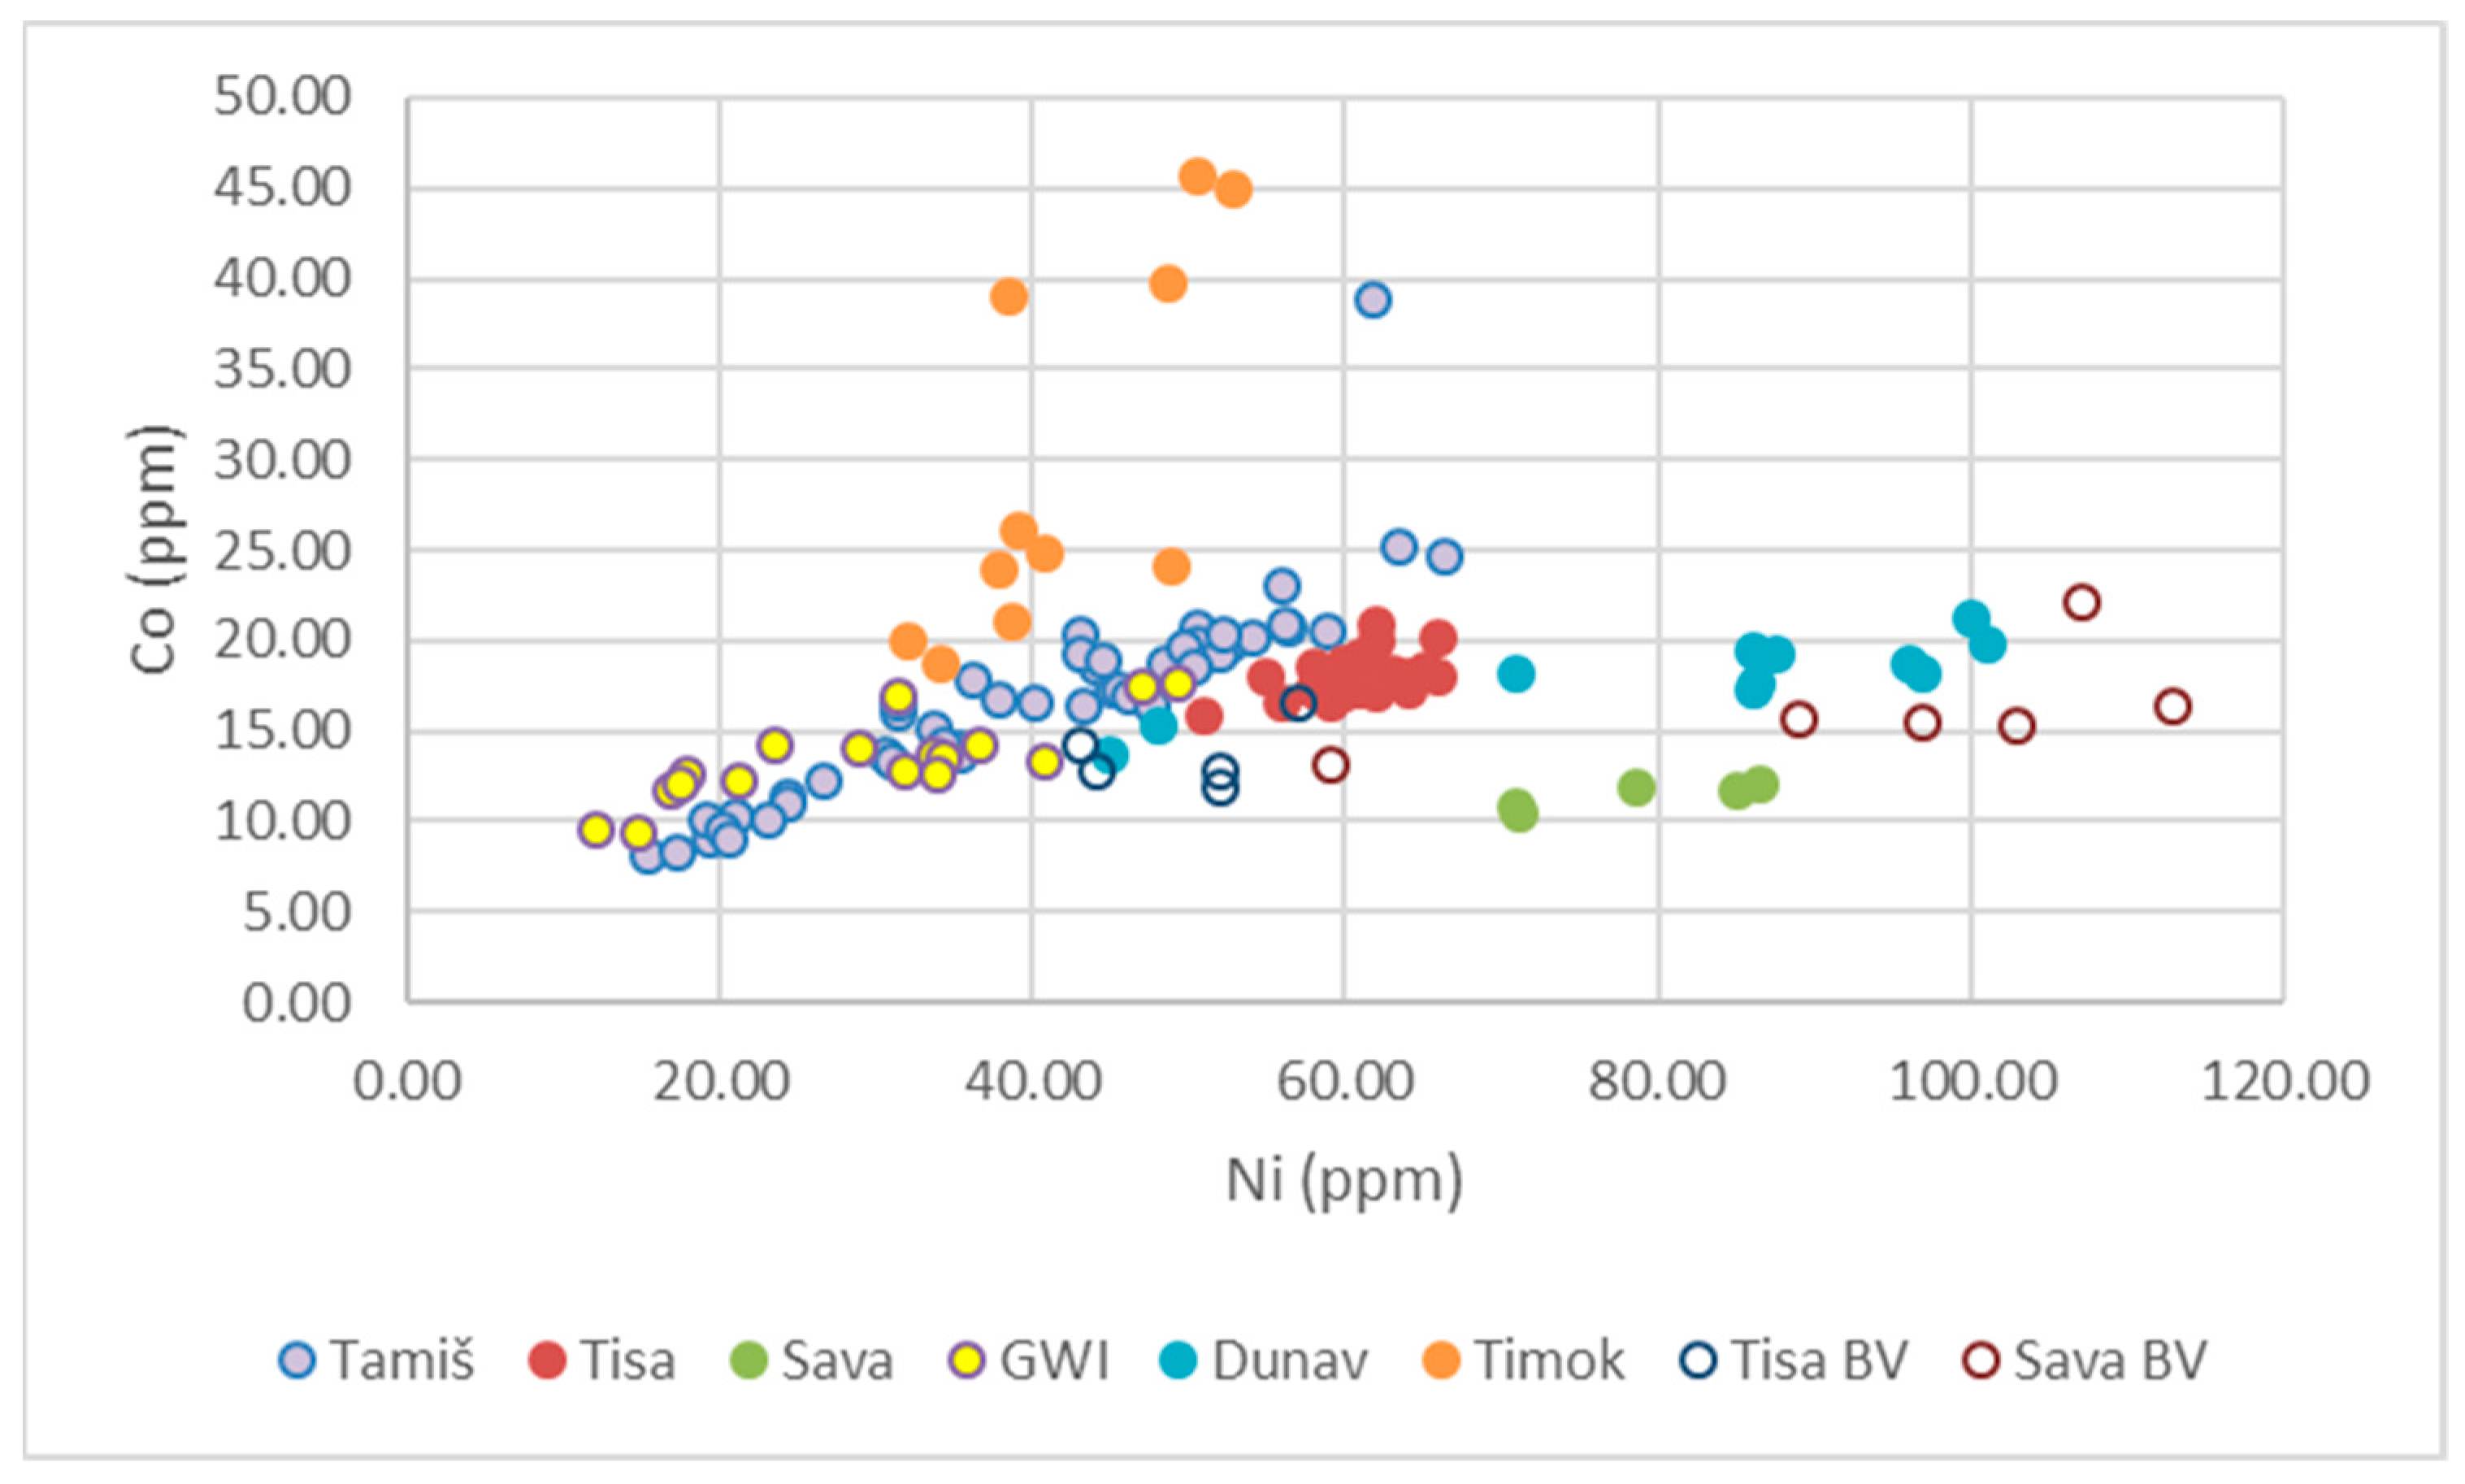
3.3. Content of Heavy Metals

The average contents of heavy metals are given in Table 2. The average concentrations of zinc in the investigated samples were in the range from 73.09 in Timok up to 353.91 ppm in the Danube sediments; those of copper were from 28.71 ppm in Sava up to 146.02 ppm in GWI; those of chromium were from 12.69 ppm in the Tisa up to 126.27 ppm in the Timok sediments; those of nickel varied from 28.96 ppm in GWI to 82.17 ppm in the Danube; those of Pb varied from 24.27 ppm in Timok samples to 91.45 ppm in the Danube sediments; those of Co ranged from 11.39 ppm in Sava to 29.82 ppm in Timok samples; those of As were from 9.84 ppm in Sava to 28.10 ppm in Tamiš; and those of Cd were from 0.26 ppm in Timok to 2.75 ppm in the Danube sediments.

4. Discussion

CaO and MgO had the highest concentrations in the Sava, GWI, Danube, and Timok Rivers, indicating limestones as one of the sources of drainage materials, but from different locations. The source of material carried by the Sava River is the Dinaric Mountains. At the time of sampling, Timok River drains limestones from east Serbia (Figure 1).
Statistical analysis was conducted using the obtained results to further explore the provenance of recent river sediments. The correlation between SiO2/Al2O3, as the main constituents of silicate minerals, and CaO/MgO, mostly originating in carbonate minerals, reveals subtle but important differences between the geological origins of the analyzed recent river sediments (Figure 3). The Sava, Danube, GWI, and sediments from the lower stretch of the Tamiš River had higher values of >2% CaO/MgO, indicating similar geological origin.
Zinc, Cu, Ni, and Cr had the highest concentrations, while Cd had the lowest concentration in all tested river sediments. The contamination factor, representing the ratio between measured concentrations in river sediment and background values, can be an indication of pollution status (Table 3). The microelement concentrations of Tisa River were compared with Tisa BV values, and the obtained results coincide with the results obtained by Štrbac et al. [10]. The concentrations of Cd were almost 12 times higher than Tisa BV values, and those of Zn and Pb were 4.4 and 3.5 times higher, respectively. Sediments at GWI, which represents sediment accumulation at the Sava and Danube Rivers’ confluence, had concentrations higher than the background values of Cu, Cd, Cr, Zn, and Pb as established by Kašanin-Grubin et al. [28]. Sediments of the Danube River showed a similar pollution status to GWI sediments and the Sava River samples, having 8.2 times higher content of Cd, 3.5 times more Cr, and 2.1 times more Zn than Sava BV samples (Table 3). Since we do not have natural background values for the Tamiš River, the concentrations of heavy metals in these sediments were compared with both Sava BV and Tisa BV. There is possible pollution with As, Cd, Cr, Cu, and Pb, but this cannot be stated as a fact, since the Tamiš River draining area is geologically different from those of the Tisa and Sava Rivers (Figure 1). This is an example where appropriate background values should be used when assessing the pollution status of a river.
Factor analysis was used to find a possible grouping of microelements and to explain their origin. The first factor explained 35% of the data and grouped Cd, Cu, Pb, and Zn, which are elements that show strong anthropogenic influence. The second factor explained 23% of the data and grouped As, Cr, and Cu, which have mixed anthropogenic and geologic origin; in the third group, with 16% of the data, were Ni and Co, elements with geologic origin (Table 4).
To further explore the origin of microelements in the tested river sediments, scatter graphs are presented in Figure 4, Figure 5 and Figure 6. Based on factor analyses, we chose the Pb–Zn scatter graph, with both parameters grouped under factor 1 as pollutants (Figure 4); the Cr–Cd scatter graph, with Cd being a parameter grouped under factor 1 as a pollutant and Cr being a parameter grouped under factor 2 for heavy metals with mixed geological and anthropogenic origin (Figure 5); and the Ni–Co scatter graph, with both elements grouped in the factor identified as being of geological origin (Figure 6).
The Pb–Zn scatter graph shows the pollution level of the analyzed river sediments. Sediments from the lower river course of the Tamiš, GWI, and Danube samples were heavily influenced by Pb. Zinc concentrations were highest in the Tamiš, Tisa, and Danube samples, indicating strong anthropogenic influence. Timok sediments and reference samples had the lowest Pb concentrations, at <40 ppm.
According to the factor analysis, Cd has anthropogenic origin and Cr has mixed origins, which can also be seen from their scatter graph (Figure 5). The concentrations of Cd were highest in the Tisa, Danube, and Sava Rivers, followed by GWI. Tisa BV and Sava BV had the lowest concentrations of both elements. Sediments from the Timok River are interesting since they had high Cr and low Cd concentrations. This indicates that the Cr is of geological origin, since Timok River is not under anthropogenic pressure. Sediments from Tamiš River form two groups: one with Cd concentrations of <2 ppm and relatively high—up to 130 ppm—concentrations of Cr, which could indicate geological origin, and the other with Cr > 2.5 ppm and Cr > 100 ppm, which could be a consequence of pollution. However, this cannot be stated as a fact without comparing these sediments with appropriate background values.
The correlation between Ni and Co, as elements of geological origin, reveals the source material in the drainage basins. Previous studies have shown elevated concentrations of Ni in sediments of the Tisa and Sava Rivers, as well as GWI, which are confirmed by the data obtained in this study. The origins of these sediments are varieties of fine-grained clastic sediments, predominantly silts, loess, and clays. However, the concentration of Co differs with the geology of the drainage basin. Sediments from the Timok River, and partly from the Tamiš River, have high concentrations of Co, indicating their geological origin represented by granite, gabro, and limestones (Figure 1).

5. Conclusions

This study highlights the importance of the selection of background values when assessing the pollution status of river sediments. Geochemical analyses proved to be a valuable tool in determining the origin of eroded material.
The correlation between SiO2/Al2O3, as main constituents of silicates, and CaO/MgO, as main constituents of carbonate minerals, revealed important differences between the geological origins of the analyzed recent river sediments.
Factor analysis grouped the microelements in the river sediments according to their provenance. The first group consists of elements that have strong anthropogenic influence—in this case, Cd, Cu, Pb, and Zn. The second group, with As, Cr, and Cu, is of mixed anthropogenic and geologic origin, and in the third group, Ni and Co are elements of geologic origin.
This study proves that natural background values should be used whenever feasible, but it is necessary that these values are specific for the studied watershed. Further investigation, which would include more river systems around the world and the collection of additional reference samples from different geological settings, is highly needed. This approach could provide the creation of a pan-European, or even global, database of reference sediments and sediments contaminated with heavy metals.

Author Contributions

Conceptualization, M.K.-G. and G.V.; methodology, M.K.-G.; formal analysis, N.A.; investigation, M.K.-G., V.G., G.V., S.S., N.A. and S.Š.; data curation, G.V., S.S. and S.Š.; writing—original draft preparation, M.K.-G.; writing—review and editing, M.K.-G., V.G., G.V., S.S., N.A. and S.Š. All authors have read and agreed to the published version of the manuscript.

Funding

This research received no external funding.

Data Availability Statement

The data presented in this study are available on request from the corresponding author.

Acknowledgments

This research was financially supported by the Ministry of Science, Technological Development and Innovation of Republic of Serbia (Contract No: 451-03-47/2023-01/200026). We are grateful to Nebojša Vasić for the useful advice provided during this study.

Conflicts of Interest

The authors declare no conflict of interest.

References

  1. Shao, J.; Yang, S.; Li, C. Chemical indices (CIA and WIP) as proxies for integrated chemical weathering in China: Inferences from analyses of fluvial sediments. Sediment. Geol. 2012, 265–266, 110–120. [Google Scholar] [CrossRef]
  2. Shou, Y.; Zhao, J.; Zhu, Y.; Qiao, J.; Shen, Z.; Zhang, W.; Han, N.; Nunez-Delgado, A. Heavy metals pollution characteristics and risk assessment in sediments and waters: The case of Tianjin, China. Environ. Res. 2020, 212, 113162. [Google Scholar] [CrossRef]
  3. Kasimov, N.; Shinkareva, G.; Lychagin, M.; Kosheleva, N.; Chalov, S.; Pashkina, M.; Thorslund, J.; Jarsjo, J. River Water Quality of the Selenga-Baikal Basin: Part I—Spatio-Temporal Patterns of Dissolved and Suspended Metals. Water 2020, 12, 2137. [Google Scholar] [CrossRef]
  4. Filgueiras, A.V.; Lavilla, I.; Bendicho, C. Evaluation of distribution, mobility and binding behavior of heavy metals in surficial sediments of Louro River (Galicia, Spain) using chemometric analysis: A case study. Sci. Total Environ. 2004, 330, 115–129. [Google Scholar] [CrossRef]
  5. Dendievel, A.; Mourier, B.; Dabrin, A.; Delile, H.; Coynel, A.; Gosset, A.; Liber, Y.; Berger, J.; Bedell, J. Metal pollution trajectories and mixture risk assessed by combining dated cores and subsurface sediments along a major European river (Rhône River, France). Environ. Int. 2020, 144, 106032. [Google Scholar] [CrossRef]
  6. Varol, M.; Şen, B. Assessment of nutrient and heavy metal contamination in surface water and sediments of the upper Tigris River, Turkey. Catena 2003, 92, 1–10. [Google Scholar] [CrossRef]
  7. Ntakirutimana, T.; Du, G.; Guo, J.; Huang, L. Pollution and potential ecological risk assessment of heavy metals in a lake. Pol. J. Environ. Stud. 2013, 22, 1129–1134. [Google Scholar]
  8. Lapwortha, D.J.; Knights, K.V.; Keyc, R.M.; Johnson, C.C.; Emmanuel Ayoade, E.; Adekanmi, M.A.; Arisekola, T.M.; Okunlolae, O.A.; Backmanf, B.; Eklundf, M.; et al. Geochemical mapping using stream sediments in west-central Nigeria: Implications for environmental studies and mineral exploration in West Africa. Appl. Geochem. 2012, 27, 1035–1052. [Google Scholar] [CrossRef]
  9. Matschullat, J.; Ottenstein, R.; Reimann, C. Geochemical background—Can we calculate it? Environ. Geol. 2000, 39, 990–1000. [Google Scholar] [CrossRef]
  10. Štrbac, S.; Kašanin-Grubin, M.; Vasić, N. Importance of background values in assessing the impact of heavy metals in river ecosystems: Case study of Tisza River, Serbia. Environ. Geochem. Health 2018, 40, 1247–1263. [Google Scholar] [CrossRef]
  11. Chelat, B.; Liu, C.; Wang, Q.; Zhang, G. Assessing the influence of lithology on weathering indices of Changjiang river sediments. Chem. Geol. 2013, 359, 108–115. [Google Scholar] [CrossRef]
  12. Tuzen, M. Determination of trace metals in the River Yesilırmak sediments in Tokat, Turkey using sequential extraction procedure. Microchem. J. 2003, 74, 105–110. [Google Scholar] [CrossRef]
  13. Gaillardet, J.; Dupre, B.; Allegre, J. Geochemistry of large river suspended sediments: Silicate weathering or recycling tracer? Geochim. Cosmochim. Acta 1999, 63, 4037–4051. [Google Scholar] [CrossRef]
  14. Turekian, K.K.; Wedepohl, D.H. Distribution of the element in some major units of the earth’s crust. Bull. Geol. Soc. Am. 1961, 72, 175–192. [Google Scholar] [CrossRef]
  15. Singh, H.; Pandey, R.; Kumar Singh, S.; Shukla, N. Assessment of heavy metal contamination in the sediment of the River Ghaghara, a major tributary of the River Ganga in Northern India. Appl. Water Sci. 2017, 7, 4133–4149. [Google Scholar] [CrossRef]
  16. Sakan, S.M.; Djordjević, D.S.; Manojlović, D.D.; Polić, P.S. Assessment of heavy metal pollutants accumulation in the Tisza river sediments. J. Environ. Manag. 2009, 90, 3382–3390. [Google Scholar] [CrossRef]
  17. Sakan, S.M.; Sakan, N.M.; Djordjević, D.S. Trace element study in Tisa River and Danube alluvial sediment in Serbia. Int. J. Sediment Res. 2013, 28, 234–245. [Google Scholar] [CrossRef]
  18. Foulds, S.A.; Brewer, P.A.; Macklina, M.G.; Haresignb, W.; Betsona, R.E.; Rassner, S.M.E. Flood-related contamination in catchments affected by historical metal mining: An unexpected and emerging hazard of climate change. Sci. Total Environ. 2014, 476–477, 165–180. [Google Scholar] [CrossRef]
  19. Covelli, S.; Fontolan, G. Application of a normalization procedure in determining regional geochemical baselines. Environ. Geol. 1997, 30, 34–45. [Google Scholar] [CrossRef]
  20. Rubio, B.; Nombela, M.A.; Vilas, F. Geochemistry of Major and Trace Elements in Sediments of the Ria de Vigo (NW Spain): An Assessment of Metal Pollution. Mar. Pollut. Bull. 2000, 40, 968–980. [Google Scholar] [CrossRef]
  21. Fok, L.; Peart, M.R.; Chen, J. The influence of geology and land use on the geochemical baselines of the East River basin, China. Catena 2013, 101, 212–225. [Google Scholar] [CrossRef]
  22. Woitke, P.; Wellmitz, J.; Helm, D.; Kube, P.; Lepom, P.; Litheraty, P. Analysis and assessment of heavy metal pollution in suspended solids and sediments of the river Danube. Chemosphere 2003, 51, 633–642. [Google Scholar] [CrossRef] [PubMed]
  23. Literathy, P.; Laszlo, F. Harmonisation of micropollutant monitoring in a large international river: Danube. Water Sci. Technol. 1995, 32, 125–137. [Google Scholar] [CrossRef]
  24. ICPDR. 2023. Available online: https://www.icpdr.org/main/international-commission-protection-danube-river-icpdr-celebrates-world-water-day-2023 (accessed on 28 August 2023).
  25. Simonović, P. The status of stocks of particular fish species in the River Tisza after the cyanide spill. Acta Biol. Iugosl. Ichthyol. Belgrade 2000, 32, 83–91. [Google Scholar]
  26. Babović, N.; Marković, D.; Dimitrijević, V.; Marković, D. Some indicators of water quality of the Tamis River. Chem. Ind. Chem. Eng. Q. 2011, 177, 107–115. [Google Scholar]
  27. Vasić, N. Kompleksna Geoekološka Istraživanja Donjeg Toka Dunava. In Report of Minisrty of Environmental Protection of the Republic of Serbia; Faculty of Mining and Geology, University of Belgrade: Belgreade, Serbia, 2009; Volume 50. (In Serbian) [Google Scholar]
  28. Kašanin-Grubin, M.; Štrbac, S.; Antonijević, S.; Djogo Mračević, S.; Randjelović, D.; Orlić, J.; Šajnović, A. Future environmental challenges of the urban protected area Great War Island (Belgrade, Serbia) based on valuation of the pollution status and ecosystem services. J. Environ. Manag. 2019, 251, 109574. [Google Scholar] [CrossRef]
  29. Babic Mladenovic, M.; Kolarov, V.; Damjanovic, V. Sediment regime of the Danube River in Serbia. Int. J. Sediment Res. 2013, 28, 470–485. [Google Scholar] [CrossRef]
  30. Kašanin-Grubin, M.; Hagemann, L.; Gajica, G.; Štrbac, S.; Jovančićević, B.; Vasić, N.; Šajnović, A.; Djogo Mračević, S.; Schwarzbauer, J. Geochronological investigation of the Danube Djerdap Lake sediments (Serbia): Sedimentology and inorganic composition. Environ. Geochem. Health 2020, 42, 693–707. [Google Scholar] [CrossRef]
  31. Hakanson, L. An ecological risk index for aquatic pollution control: A sedimentological approach. Water Resour. 1980, 14, 975–1001. [Google Scholar]
  32. Shepard, F.P. Nomenclature based on sand-silt-clay ratios. J. Sediment Petrol. 1954, 24, 151–158. [Google Scholar]
Figure 1. Map of Serbia with the analyzed rivers (right). Map of the Balkan Peninsula with mountain ranges (left).
Water 15 03406 g001
Figure 2. Grain size composition of sediments from the Tamiš, Tisa, Tisa BV (background values), Sava, SavaBV (background values), Great War Island (GWI), Danube, and Timok Rivers.
Water 15 03406 g002
Figure 3. SiO2/Al2O3 and CaO/MgO ratios in sediments from the Tisa, Tisa BV (background values), Tamiš, Sava, Sava BV (background values), Great War Island (GWI), Danube, and Timok Rivers.
Water 15 03406 g003
Figure 4. The Pb–Zn scatter graph for river sediments and background values from the Tamiš, Tisa, Tisa BV (background values), Sava, Sava BV (background values), Great War Island (GWI), Danube, and Timok Rivers.
Water 15 03406 g004
Figure 5. The Cr–Cd scatter graph for river sediments and background values from the Tamiš, Tisa, Tisa BV (background values), Sava, Sava BV (background values), Great War Island (GWI), Danube, and Timok Rivers.
Water 15 03406 g005
Figure 6. The Ni–Co scatter graph for river sediments and background values from the Tamiš, Tisa, Tisa BV (background values), Sava, Sava BV (background values), Great War Island (GWI), Danube, and Timok Rivers.
Water 15 03406 g006
Table 1. Content of major oxides (%) in sediments from the Tamiš, Tisa, Tisa BV (background values), Sava, Sava BV (background values), Great War Island (GWI), Danube, and Timok Rivers (A—average; SD—standard deviation).
SampleSiO2Al2O3Fe2O3MgOCaONa2OK2OTiO2P2O5MnO
TamišA48.9815.195.972.512.460.972.410.910.300.16
SD6.341.471.300.542.350.260.260.080.130.07
TisaA56.3715.166.322.223.361.122.570.850.230.18
SD1.660.930.560.250.890.080.160.040.010.03
SavaA48.3413.876.353.058.340.672.100.740.210.23
SD2.070.470.270.331.100.130.140.040.030.08
GWIA46.5116.457.133.809.330.702.710.920.340.18
SD2.081.211.070.321.670.130.320.110.080.05
DanubeA47.9113.995.933.118.000.842.340.690.260.14
SD0.961.350.580.291.550.110.220.020.040.03
TimokA53.1715.067.403.164.171.941.520.940.180.14
SD3.651.311.340.961.980.360.610.120.070.03
Tisa BVA58.0714.205.732.844.761.292.360.840.160.11
SD6.021.400.570.863.720.090.240.070.010.04
Sava BVA48.4613.325.562.998.270.672.280.650.100.15
SD5.033.611.270.701.980.190.740.120.030.08
Table 2. Content of heavy metal sediments (ppm) in the Tamiš, Tisa, Tisa BV (background values), Sava, Sava BV (background values), Great War Island (GWI), Danube, and Timok Rivers (A—average; SD—standard deviation).
SampleAsCdCoCrCuNiPbZnOrder of Element Content
TamišA28.101.1316.8381.7690.5040.4635.22164.92Zn > Cu > Cr > As > Ni > Pb > Co > Cd
SD8.680.815.4729.8059.3913.7228.7783.54
TisaA16.542.1218.0212.6977.5860.5649.22312.12Zn > Cu > Ni > Pb > As > Co > Cr > Cd
SD1.420.481.170.5210.413.459.2835.14
SavaA9.842.5711.3969.0828.7178.4927.29149.84Zn > Ni > Cr > Pb > Cu > Co > As > Cd
SD0.680.100.699.221.307.370.6610.76
GWIA12.971.1413.4062.87146.0228.9662.37177.13Zn > Cu > Cr > Pb > Ni > Co > As > Cd
SD7.780.422.3415.9295.8511.2028.9657.07
DanubeA15.052.7518.0514.2498.7982.1791.45353.91Zn > Cu > Pb > Ni > Co > Cr > As > Cd
SD5.551.002.132.3139.2019.5827.5893.97
TimokA18.250.2629.82126.2750.8742.0324.2773.09Cr > Zn > Cu > Ni > Co > Pb > As > Cd
SD7.320.1910.3124.5517.507.015.4714.57
Tisa BVA6.700.1813.6410.4023.8849.6014.1471.00Zn > Ni > Cu > Pb > Co > Cr > As > Cd
SD2.930.081.851.324.105.943.3412.92
Sava BVA12.580.3118.2919.6731.16126.2528.6872.50Ni > Zn > Cu > Pb > Cr > Co > As > Cd
SD9.980.124.515.7610.9663.2319.6524.81
Table 3. Contamination factor of river sediments and background values from the Tamiš, Tisa, Tisa BV, Sava, Sava BV, Great War Island (GWI), Danube, and Timok Rivers.
SampleAsCdCoCrCuNiPbZn
Sava/Sava BV0.788.200.623.510.920.620.952.07
GWI/Sava BV1.033.650.733.204.690.232.182.44
Danube/Sava BV1.208.770.990.723.170.653.194.88
Tisa/Tisa BV2.4711.781.321.223.251.223.484.40
Tamiš/Sava BV2.233.590.924.162.900.321.232.27
Tamiš/Tisa BV4.196.251.237.863.790.822.492.32
Table 4. Factor analyses for elements in river sediments and background values.
Heavy ElementsFirst FactorSecond FactorThird Factor
As 0.70
Cd0.886
Co 0.70
Cr 0.85
Cu0.580.48
Ni 0.86
Pb0.853
Zn0.897
Disclaimer/Publisher’s Note: The statements, opinions and data contained in all publications are solely those of the individual author(s) and contributor(s) and not of MDPI and/or the editor(s). MDPI and/or the editor(s) disclaim responsibility for any injury to people or property resulting from any ideas, methods, instructions or products referred to in the content.

