Article

Investigation of the Internal Flow in a Francis Turbine for Comparing the Flow Noise of Different Operation Conditions

1
Technical Management Department, Y. R. Wanjiazhai Water Multi-Purpose Dam Project Co., Ltd., Taiyuan 030000, China
2
Power Station Management Bureau, Y. R. Wanjiazhai Water Multi-Purpose Dam Project Co., Ltd., Taiyuan 030000, China
3
College of Engineering, China Agricultural University, Beijing 100083, China
4
State Key Laboratory of Hydroscience and Engineering & Department of Energy and Power Engineering, Tsinghua University, Beijing 100084, China
*
Author to whom correspondence should be addressed.
Water 2023, 15(19), 3461; https://doi.org/10.3390/w15193461
Submission received: 4 September 2023 / Revised: 21 September 2023 / Accepted: 26 September 2023 / Published: 30 September 2023
(This article belongs to the Special Issue Advances in Hydrodynamics of Water Pump Station System)

Abstract

:
Francis turbines are commonly used for water energy utilization in medium- to high-head sections. The high head may cause strong flow-induced noise problems and adverse effects during operation. In order to explore the causes and specific locations of flow-induced noise, this study evaluated the flow-induced noise of a Francis turbine under different loads. By using computational fluid dynamics simulation methods and sound power level evaluation methods, flow-induced noise analysis could be performed based on turbulent flow simulations. By comparing experimental and simulated values, three different load conditions were selected located in the allowed, restricted, and prohibited regions. The results indicated that the flow state of the operating points in the allowed region was good and the flow-induced noise was low, except near the guide vane. The swirling flow in restricted and prohibited regions was strong; in particular, the flow-induced noise in the draft tube was relatively high. Overall, the local flow-induced noise of the runner blade inlet edge was the strongest, and the relationship between the flow-induced noise of the draft tube and the rotating flow was the strongest. The flow-induced noise near the guide vane was the most related to the opening angle, and the larger the opening angle, the greater the noise was. This study can assist in the diagnosis of Francis turbine noise problems and related low-noise design in engineering.

1. Introduction

In recent years, in order to alleviate the negative effects of excessive use of fossil energy, the development and utilization of clean energy have become particularly important around the world, and water utilization is the most important. In order to efficiently utilize the water energy of rivers and oceans, many scholars have created and improved mechanical devices related to the utilization of water energy, among which the Francis turbine is the most widely used. This is a typical impact turbine with a compact structure and high operation efficiency under rated working conditions, and it can operate stably under a wide head range [1].
With the continuous improvement of the single capacity of the Francis turbine, the runner diameter is becoming larger, and more and more attention is being paid to the flow stability of the internal flow field by more and more scholars [2,3,4]. In particular, when a Francis turbine is operating under conditions that deviate from the design conditions, the flow mechanism of the fluid in the flow passage becomes more complex, as seen in situations such as deflow at the inlet edge of the blade, low-frequency vortex zones in the draft tube, cavitation in various parts of the flow passage [5,6], etc., which have a direct impact on the vibration of the unit and workshop, cavitation erosion and cracks in the runner blade, and the rupture of the cone section of the draft tube. This can affect the safe and stable operation of hydropower stations and the efficient utilization of water energy [7].
In general, high- and low-frequency noise and abnormal noise generated by structural resonance are likely to occur when mechanical vibration, electromagnetic vibration and hydraulic excitation occur in a unit [8,9]. In accordance with the actual situation, relevant means can be adopted to avoid and eliminate vibration so as to solve the problem of noise in the power station. Wang et al. [10] studied the influence of the guide vane opening angle on the induced noise of fluid flow in a Francis turbine. Adjusting the guide vane opening angle and improving the elbow section of the draft tube could reduce the noise pressure generated by fluid flow. Pang et al. [11] found that hydraulic excitation would cause resonance and abnormal noise in the pressure steel pipe in the unit. By improving the flow passage environment, the diversion plate installed at the inlet of the volute could significantly improve the situation. Liu et al. [12] studied the dynamic and static interference in the bladeless region and the hydraulic excitation in the volute of a Francis turbine and confirmed that the dynamic and static interference in the bladeless region was related to the abnormal vibration and noise of the unit. The improved blading–sand combination can effectively achieve vibration and noise reduction in power stations. Kubo et al. [13] improved the operation stability of the unit and reduced noise by repairing and improving the guide vane and runner of the turbine. Luo et al. [14] found that, when the Francis turbine was running under load conditions, the pressure shock and noise in the turbine could be effectively inhibited by proper air flow into the unit.
In general, with the continuous progress of modern manufacturing technology, mechanical noise can be greatly reduced, but hydraulic vibration noise still exists in Francis turbines [15]. As noise is easy to detect and monitor during the operation and maintenance of power stations, the noise characteristics generated by the internal flow field of Francis turbines under different working conditions can be compared and analyzed. By analyzing the causes and characteristics of different noises, the unit structure and workshop can be repaired and improved, therefore reducing the noise itself and the sound source and preventing the unit from being in a state of unsafe operation for a long time. To analyze and predict a unit’s unstable operation, Wang et al. [16] studied the operation of the Francis turbine under off-design conditions and established an evaluation method for pressure pulsation in the diversion tube that can be used to evaluate the pressure pulsation in the unit and the noise generated by the pulsation. Favrel et al. [17] carried out an excitation resonance test on a model Francis turbine in a seal hydraulic system to improve the prediction of an underwater acoustic model.
In this study, CFD software was used to model a Francis turbine, analyze its internal flow conditions and noise characteristics under different working conditions, and deeply explore the mechanism of the easily appearing noise of the Francis turbine and the commonality of related noise so as to provide a relevant technical reference for subsequent research on the noise of Francis turbines [18,19,20,21].

2. Research Object

The object of this study was a Francis turbine for a medium head section, and its relevant parameters are shown in Table 1. This Francis turbine had five key flow-passing components: the spiral case, stay vane, guide vane, runner, and draft tube. The runner was a 13-blade Francis runner. The stay vane had 24 blades and the guide vane also had 24 blades. The fluid domain was modeled as shown in Figure 1 for the computational fluid dynamics (CFD) simulation in the following sections. A set of x-y-z coordinates were defined, where z was the runner axis direction, x was the spiral case inflow direction, and y was perpendicular to the x–z plane.

3. Mathematical Methods

3.1. Basic Equations

In this case, time-averaged and Reynolds-averaged Navier–Stokes equations were used to decompose the quantities into a time-averaged component (for example, u ¯ ) and fluctuating component (for example, u’) [22]. Thus, the continuity equation and momentum equation were:
u i ¯ x i = 0
ρ u i ¯ t + ρ u j ¯ u i ¯ x j = x j ( p ¯ δ i j + 2 μ S i j ¯ ρ u i u j ¯ )
where u is the velocity, t is the time, ρ is the density, x is the coordinate component, δij is the Kroneker delta, and µ is the dynamic viscosity. The term ρuiuj’ is called the Reynolds stress. Sij is the mean rate of the strain tensor:
S i j ¯ = 1 2 ( u i ¯ x j + u j ¯ x i )
Here, the total energy equation is:
t ( ρ h t o t ) p t + x j ( ρ u j h t o t ) = x j ( λ t T x j u j h s t a ¯ ) + x j [ u j ( 2 μ S i j ¯ ρ u i u j ¯ ) ]
where T is temperature, hsta is the static enthalpy, and htot is the total enthalpy:
h t o t = h s t a + 1 2 u 2
λt is the thermal conductivity.

3.2. Turbulence Model

As the time-averaged equation is not closed, the relationship between the Reynolds stress and eddy viscosity μt can be built as follows [23]:
ρ u i u j ¯ = 2 μ t S i j ¯ 2 3 k δ i j
where k is the turbulence kinetic energy. In this study, the SST model [24] was used, which can be written as:
( ρ k ) t + ( ρ u i k ) x i = P k ρ k 3 / 2 l k w + x i [ ( μ + σ k μ t ) k x i ]
( ρ ω ) t + ( ρ u i ω ) x i = C ω P ω β ρ ω 2 + x i [ ( μ l + σ ω μ t ) ω x i ] + 2 ( 1 F 1 ) ρ σ ω 2 ω k x i ω x i
where lk-ω is the turbulence scale, Pk and Pω are the production term, F1 is the coefficient of the production term, σk is the blending function, and σω and βk are model constants.

3.3. Flow-Induced Noise Analysis
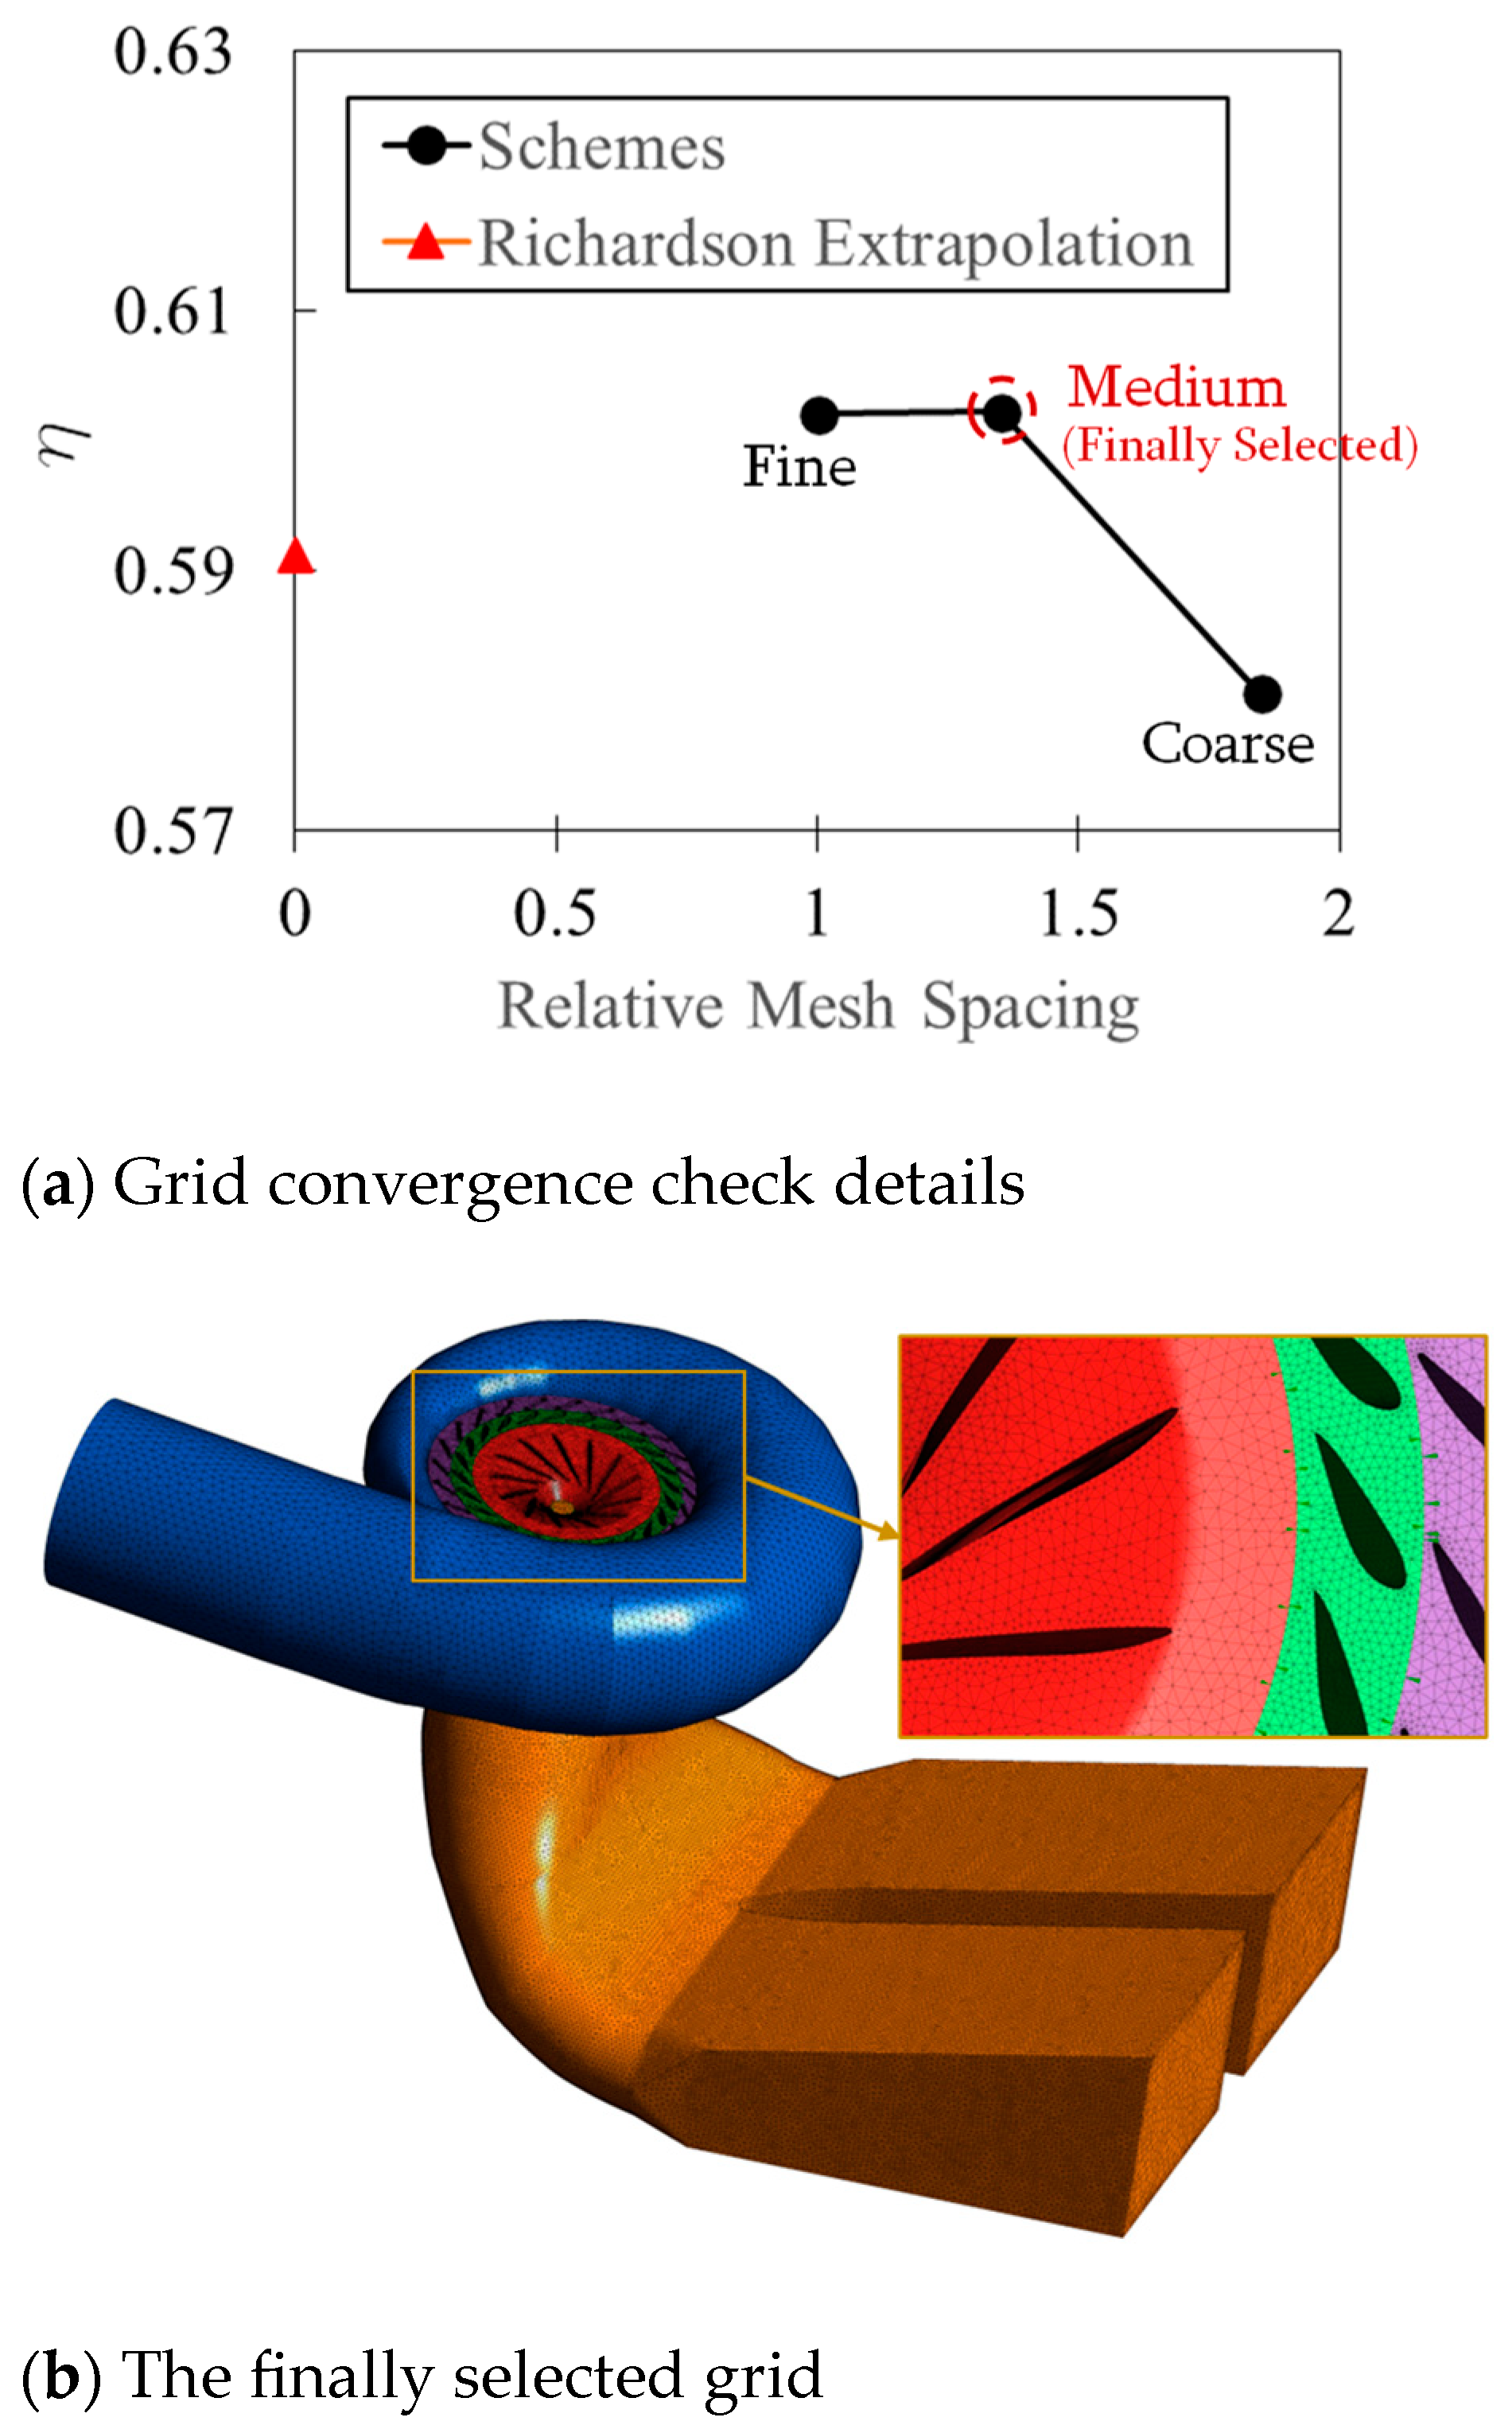
The Lighthill acoustic analogy method was applied based on the flow simulation [25]. It can be used to determine the near-field noise according to the sound power level:
W A = α ε ρ ε M t 5
where αε is a constant equal to 0.1, ε is the eddy dissipation rate, and Mt is the specific turbulence kinetic energy:
M t = 2 k V c
where Vc is the speed of sound, which is 340 m/s. The flow-induced sound power level Lsp is calculated as follows:
L s p = 10 log 10 ( W A W r e f )
where Wref is the reference sound power of 1 × 10⁻¹² W/m3.

4. Setup of CFD

In this study, the commercial software ANSYS CFX was used for CFD simulation. When simulating, the fluid medium was set as water at 20 °C. The pressure reference value was 0 Pa, which means that the simulated pressures were all absolute values. On the basis of the spiral case, stay vane, guide vane, runner, and draft tube, the computing domain connected and transmitted data to each domain through interfaces. The inlet of the spiral case was set as a total pressure-type inlet boundary, with the direction of the inflow perpendicular to the boundary and the pressure in the zero-gradient form. The outlet of the draft tube was set as a static pressure-type outlet boundary, and based on the given pressure value, the velocity was in zero-gradient form. The grid in the computational domain adopted unstructured tetrahedral elements as the main body, and the blade surface was encrypted with prism-type grids to meet the requirements of the wall function. Figure 2a shows the grid convergence check based on the convergence index (GCI) [26]. Three grid schemes following an increasing rate of mesh spacing of 1.35 were checked based on the evaluation of efficiency η. The GCI value of the coarse medium grid was 3.91% and the GCI value of the fine medium grid was 0.03%. After the checking of each component grid, the grid element number was determined, as shown in Table 2 and Figure 2a. The total number of elements was 2.75 million. The schematic map of the grid is shown in Figure 2b.
When running CFD, we first performed a 600-timestep steady simulation and monitored the residual between the continuity equation and the momentum equation. If it was less than 0.0001, convergence was considered to take place. Then, based on this, we carried out transient calculations for three runner revolutions, with 360 timesteps iterated for each cycle and 10 iterations for each step. The residual between the continuity equation and the momentum equation was still monitored, and convergence was considered to be less than 0.0001.

5. Comparison of Experimental and Numerical Results

Figure 3 shows the operation characteristic of the Francis turbine tested on site. The best efficiency region (BER) had an efficiency of 95%. The operation region was divided into three subregions: the allowed region, restricted region, and prohibited region. The division was based on the operation stability. The BER was in the allowed region. We found that the flow-induced noise was high in the restricted region and prohibited region. Therefore, three points were compared, as indicated in Figure 2. Point one was in the allowed region, and the guide vane opening angle was 24 degrees. Point two was in the restricted region, and the guide vane opening angle was 20 degrees. Point three was in the prohibited region, and the guide vane opening angle was 12 degrees. Table 3 shows a comparison of experimental and numerical results. The unit speed n11 and unit flow rate Q11 were defined as:
n 11 = n D r n H
Q 11 = Q D r n 2 H
where n is the rotational speed, H is the head, and Q is the flow rate.

6. Results of CFD

6.1. Streamlines

Figure 4 shows the distribution of streamlines in the Francis turbine’s fluid domain representing the turbulence of the flow regime, with colors used to represent the flow velocity. From Figure 4a, it can be seen that, at point one, the flow was smoother due to the operating conditions being near the BER and in the allowed operation region. The flow velocity in the spiral case was also medium-high, with an average of around 10 m/s. The flow regime in the draft tube was very smooth. From Figure 4b, it can be seen that, at point two, due to the condition being in the restricted region, the flow pattern became bad. The flow velocity in the volute decreased to approximately 5~6 m/s. The flow velocity between the guide vane and the runner was extremely high, reaching up to 25~28 m/s. There was a significant twisting flow in the draft tube, which was related to the formation of vortex rope. From Figure 4c, it can be seen that, at point three, the flow pattern became worse as the operating conditions entered the prohibited region. The flow velocity in the spiral case was also relatively low, only about 5~6 m/s. The flow velocity in the area between the guide vane and runner slightly decreased to around 16~18 m/s. There was still a significant swirling flow in the draft tube, which was related to the formation of vortex rope. In general, the flow pattern was strongly related to the operation region. The relationship between flow-induced noise and condition should be analyzed in detail.

6.2. Flow-Induced Noise

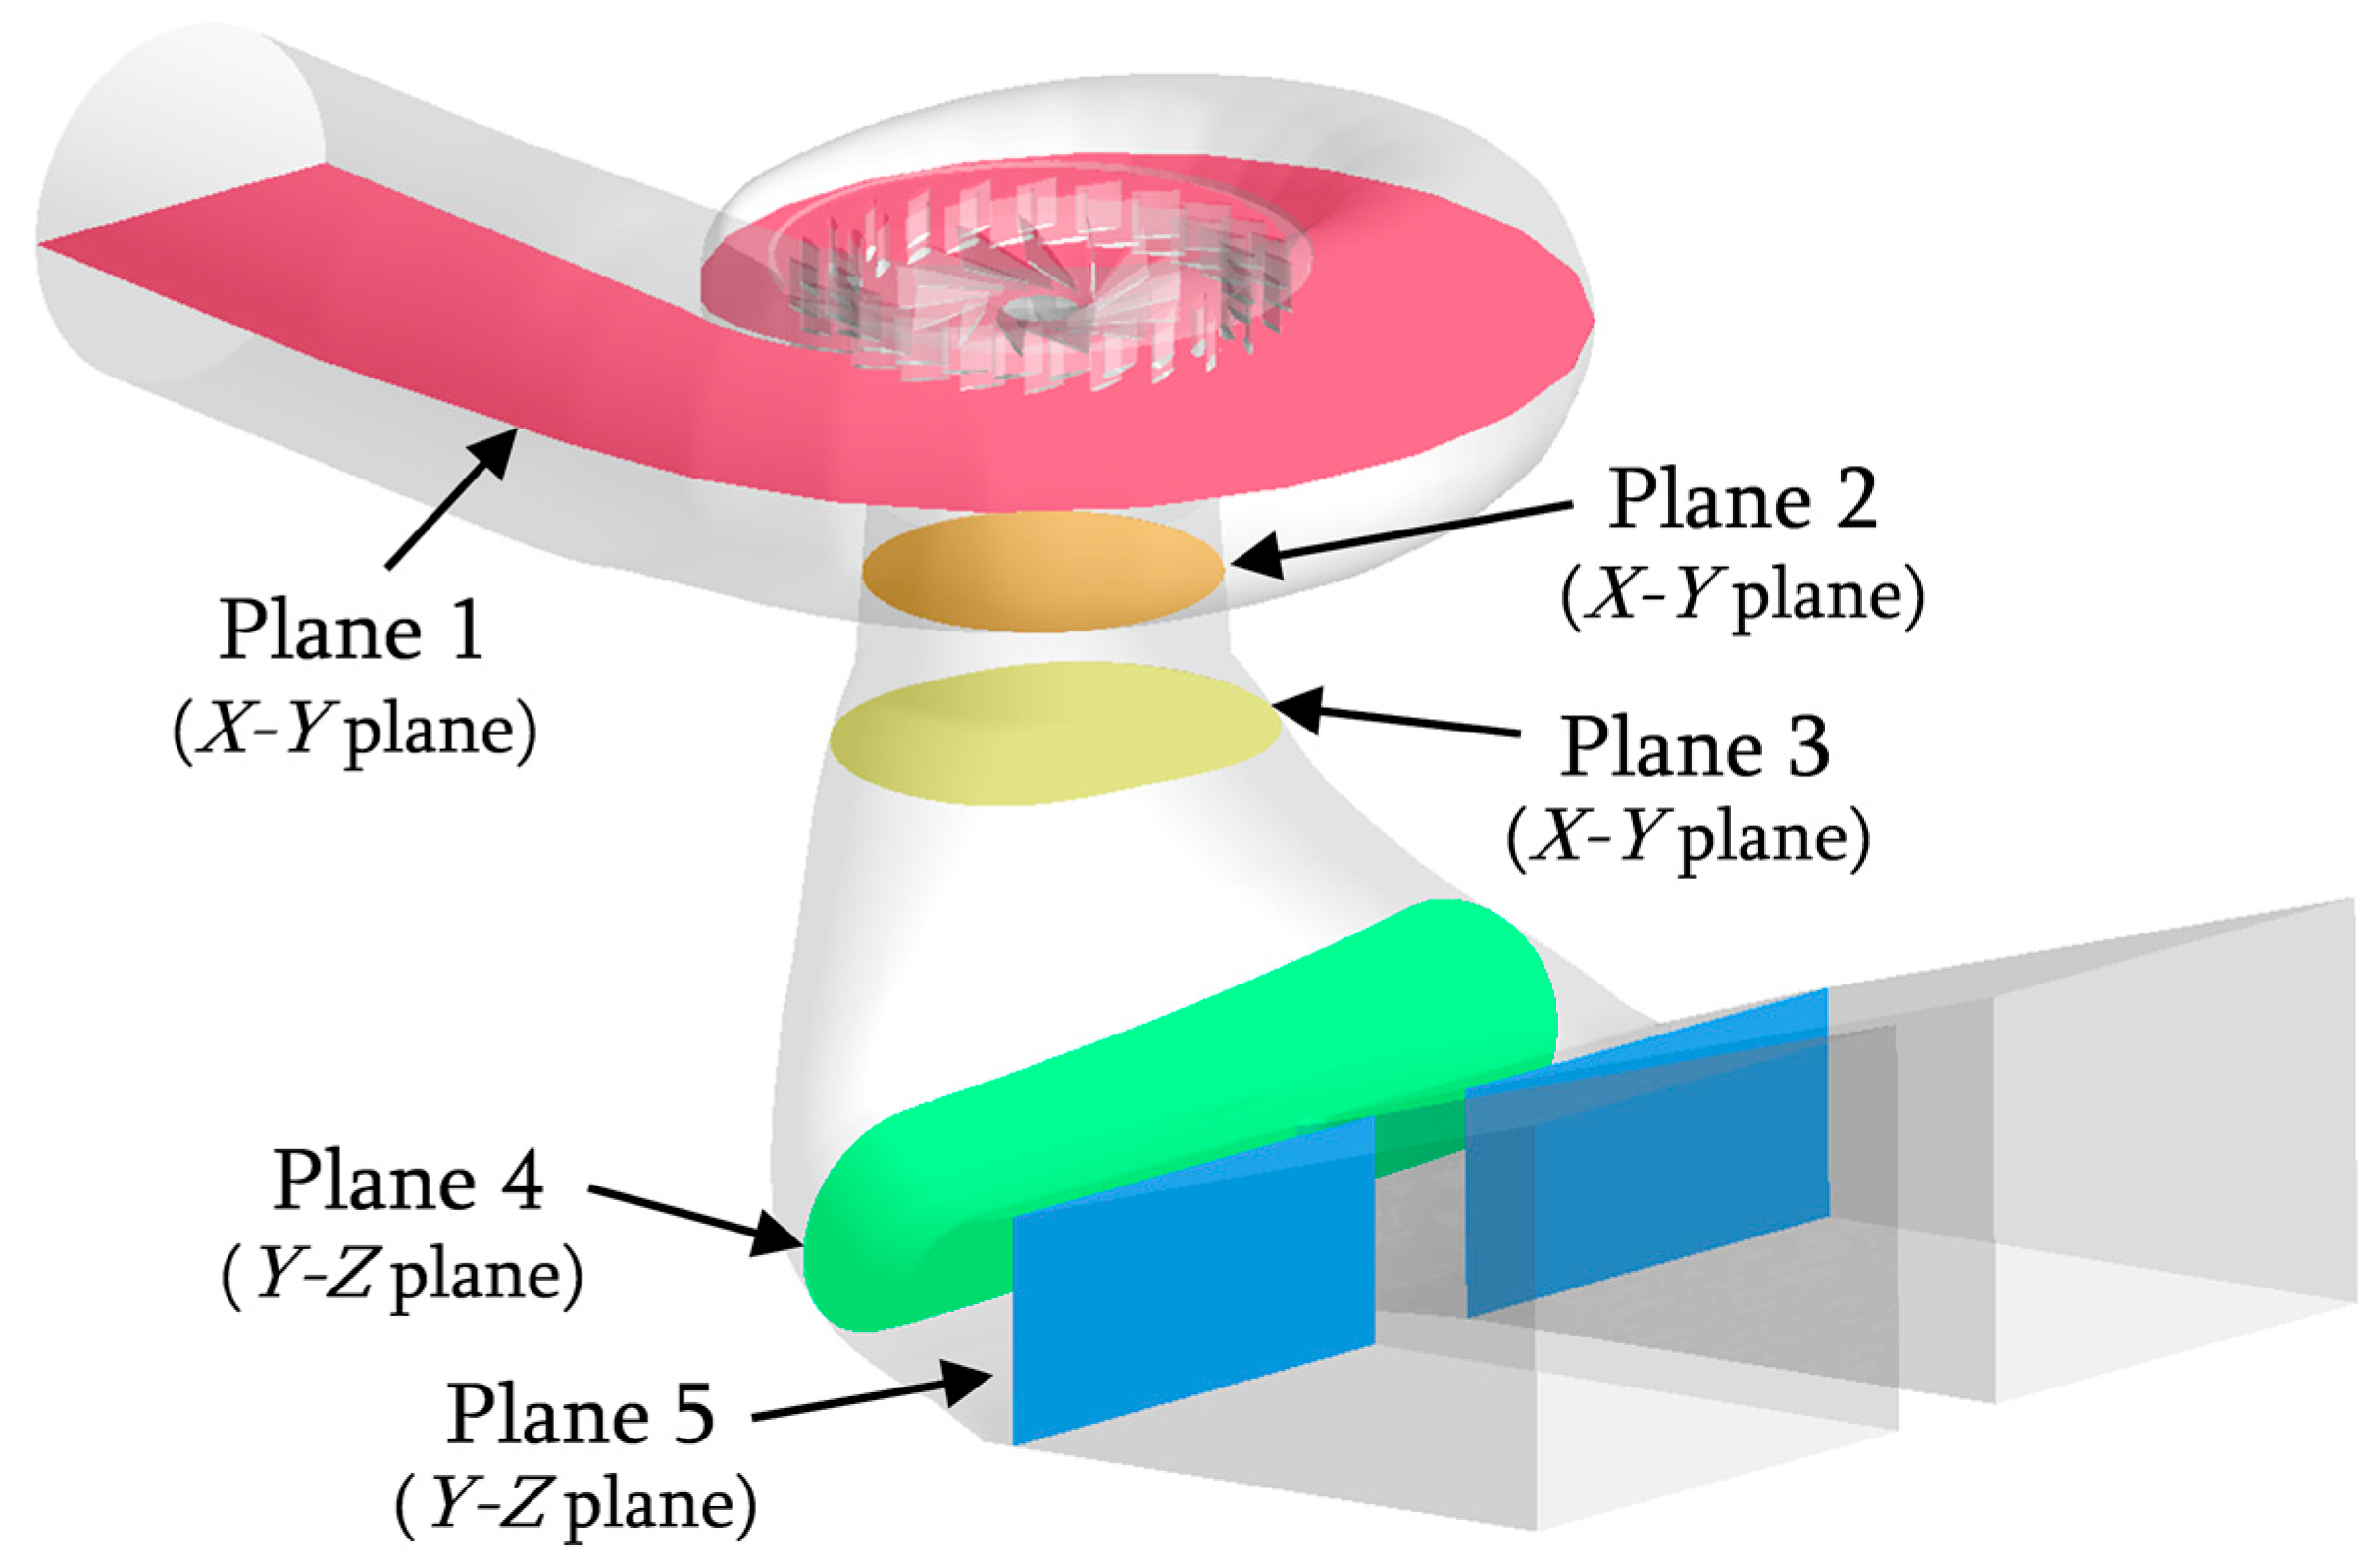
6.2.1. Reference Planes for Plotting

To analyze the specific situation of the flow-induced noise, we created a series of reference planes, as shown in Figure 5. Among them, plane one was the middle section of the spiral case and vane and was an x–y plane. Planes two and three were also x–y planes located in the straight part of the draft tube. Planes four and five were y–z planes in the diffusion part of the draft tube, which was downstream of the elbow part.

6.2.2. Contours of Flow-Induced Noise

Figure 6a shows the distribution of the sound power level Lsp at the point-one condition. On plane one of the point-one condition, it can be seen that there was an area with a very high sound power level near the inlet of the spiral case. This area was concentrated in the middle of the flow channel and closely related to the compression between fluids. As the cross-section of the spiral case continued to decrease, the sound power level gradually decreased. When the fluid entered the stay vane and guide vane, the sound power level increased. As the fluid entered the runner blade channel and began to interact with the blade, the sound power level reached its maximum value at the inlet edge of the blade, approximately 78.0 dB. At the position near the cone (plane two) of the draft tube, the sound power level gradually rose from the center to the wall up to 36.3 dB. In the middle of the straight section of the draft tube (plane three), the sound power level also showed a gradual rise from the center to the wall up to 25.0 dB. After the fluid flowed through the elbow section, near its position (plane four), the sound power level was higher at the upper wall and lower at the lower wall, reaching a maximum of 21.6 dB. At the diffusion section (plane five) downstream of the draft tube, the distribution of the sound power level showed high levels on the left and low levels on the right without obvious regularity, and the maximum value was 12.7 dB.
Figure 6b shows the distribution of the sound power level Lsp at the point-two condition. On plane one of the point-two condition, there was still a high-sound-power-level area near the inlet of the spiral case, with a larger range and high intensity. The sound power level became very low near the stay vane and guide vane, which was related to the extremely small opening angle of the guide vane, which greatly hindered the flow. In the runner, especially at the blade inlet edge, the sound power level increased. The maximum sound power level on plane one was approximately 89.9 dB, which was higher than the point-one operating condition. At the position of the draft tube near the cone (plane two), the sound power level from the center to the wall showed a trend of rising first and then falling, reaching a value of up to 63.1 dB, far higher than the point-one working condition. In the middle of the straight section of the draft tube (plane three), the sound power level also showed a trend of rising first and then falling from the center to the wall, reaching a value of up to 80.1 dB, far higher than the point-one working condition. Near the elbow (plane four), the sound power level was still higher at the upper wall and lower at the lower wall, reaching a maximum of 73.9 dB, higher than point one. At the diffusion section (plane five) downstream of the draft tube, the distribution of the sound power level showed low levels on the left and high levels on the right with no obvious regularity. The maximum value was 55.0 dB, higher than point one.
Figure 6c shows the distribution of the sound power level Lsp at the point-three condition. On plane one of the point-three condition, there was still a high-sound-power-level area near the inlet of the spiral case, and the range and intensity were larger than those of point two. The sound power level became very low near the stay vane and guide vane, similarly to point two. This was related to the flow retardation caused by the extremely small guide vane opening angle. In the runner, especially at the blade inlet edge, the sound power level increased. The maximum sound power level on plane one was approximately 94.5 dB, which was higher than both the point-one and point-two operating conditions. At the position of the draft tube near the cone (plane two), the sound power level rose first and then decreased from the center to the wall, reaching 70.6 dB at most, which was similar to point two. In the middle of the straight section of the draft tube (plane three), the sound power level also showed the trend of rising first and then falling from the center to the wall, reaching a maximum of 80.0 dB, which was similar to point two. Near the elbow (plane four), the sound power level was still higher at the upper wall and lower at the lower wall, reaching a maximum of 71.2 dB, similarly to point two. At the diffusion section (plane five) downstream of the draft tube, the distribution of the sound power level showed no obvious trend, and the maximum value was 53.6 dB, which was similar to point two.

6.2.3. The Variation in Flow-Induced Noise with Flow Direction

In order to analyze the variation in the maximum flow-induced noise with the flow direction under three working conditions, a total of seven positions labeled A~G were defined, as shown in Table 4. A was at the spiral case inlet. B was between the stay vane and guide vane. C was in the runner blade channels. D was near the runner cone in the draft tube. E was in the middle of the draft tube’s straight section. F was near the draft tube elbow section. G was in the draft tube diffusion section.
Figure 7 shows a comparison of the maximum sound power level at different positions. At position A, point one had the lowest sound power level and point three had the highest sound power level. Overall, the differences between the three operating conditions were not too significant. At position B, point one had the highest sound power level, while point two and point three had lower sound power levels. At position C, point one had the lowest sound power level and point three had the highest sound power level. The flow-induced noise generated by the interaction between the high-speed rotating blades and fluid was the strongest within the entire hydraulic turbine. At positions D, E, F, and G, the situation was quite similar. Both instances of point one had lower sound power levels, while point two and point three had higher sound power levels. In the draft tube, the gap between point one and point two/three was obvious. Along the direction of flow, flow-induced noise tended to decrease. Overall, the sound power level in the vanes was related to the opening angle of the guide vane, and flow-induced noise was lower when the opening of the guide vane was small. The sound power level in the runner was the highest, mainly at the inlet edge of the blade, and not closely related to the operating conditions. The sound power level in the draft tube had an obvious relationship with the condition: the lower the flow rate and the more serious the flow diffusion, the stronger the flow-induced noise in the draft tube.

7. Discussion

From the results of this study, it can be seen that the Francis turbine produces four main areas of flow-induced noise under different loads (Figure 8). Firstly, this occurs at the point of flow merging; in this case, mainly in the import of the spiral case. Intensification of the reduction in the flow channel area or the channel curvature can cause different flows to squeeze each other, resulting in strong flow-induced noise. Strong flow-induced noise then appears at the leading edge of the vane or runner blade. This is due to the flow and wall impact. In addition, circulating flow is one of the possible causes of flow-induced noise, as significant flow-induced noise was observed between the vane and runner. Finally, the strongly rotating vortex belt of the draft tube may interact with the wall or fluid under low loads, resulting in strong flow-induced noise.

8. Conclusions

In general, this study found some significant patterns for flow-induced noise in Francis turbines. The following three conclusions can be drawn:
(a)
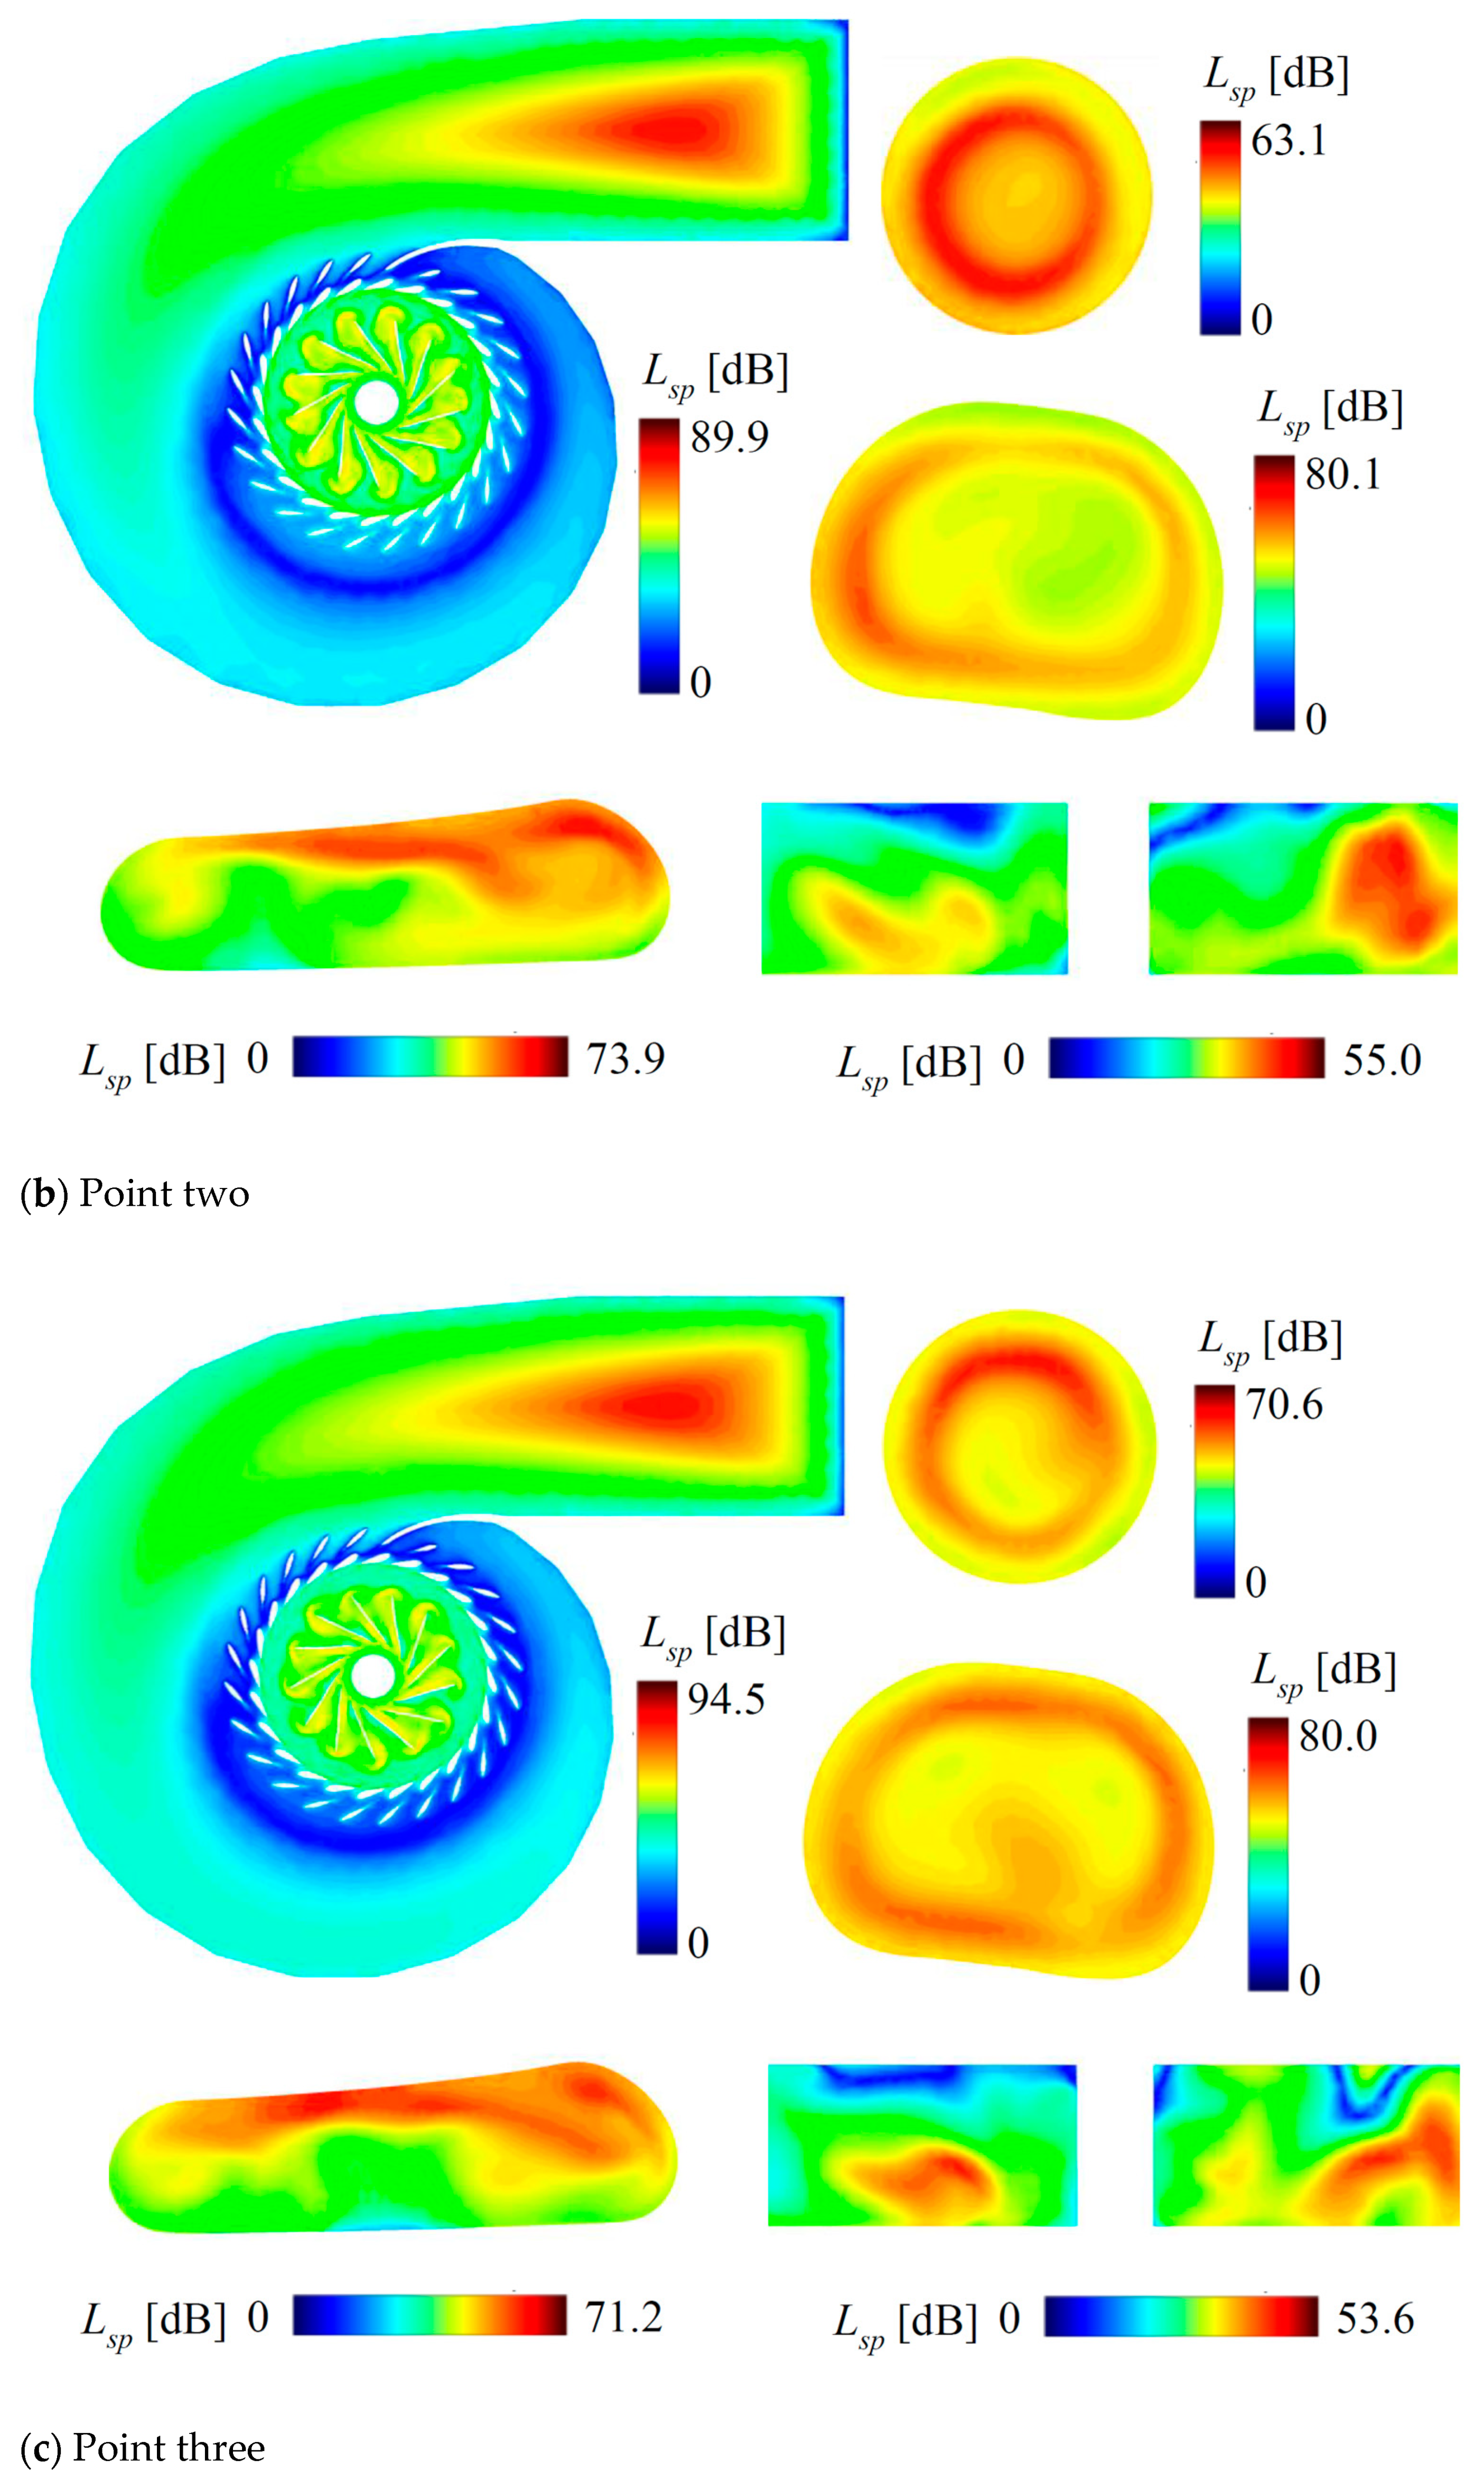
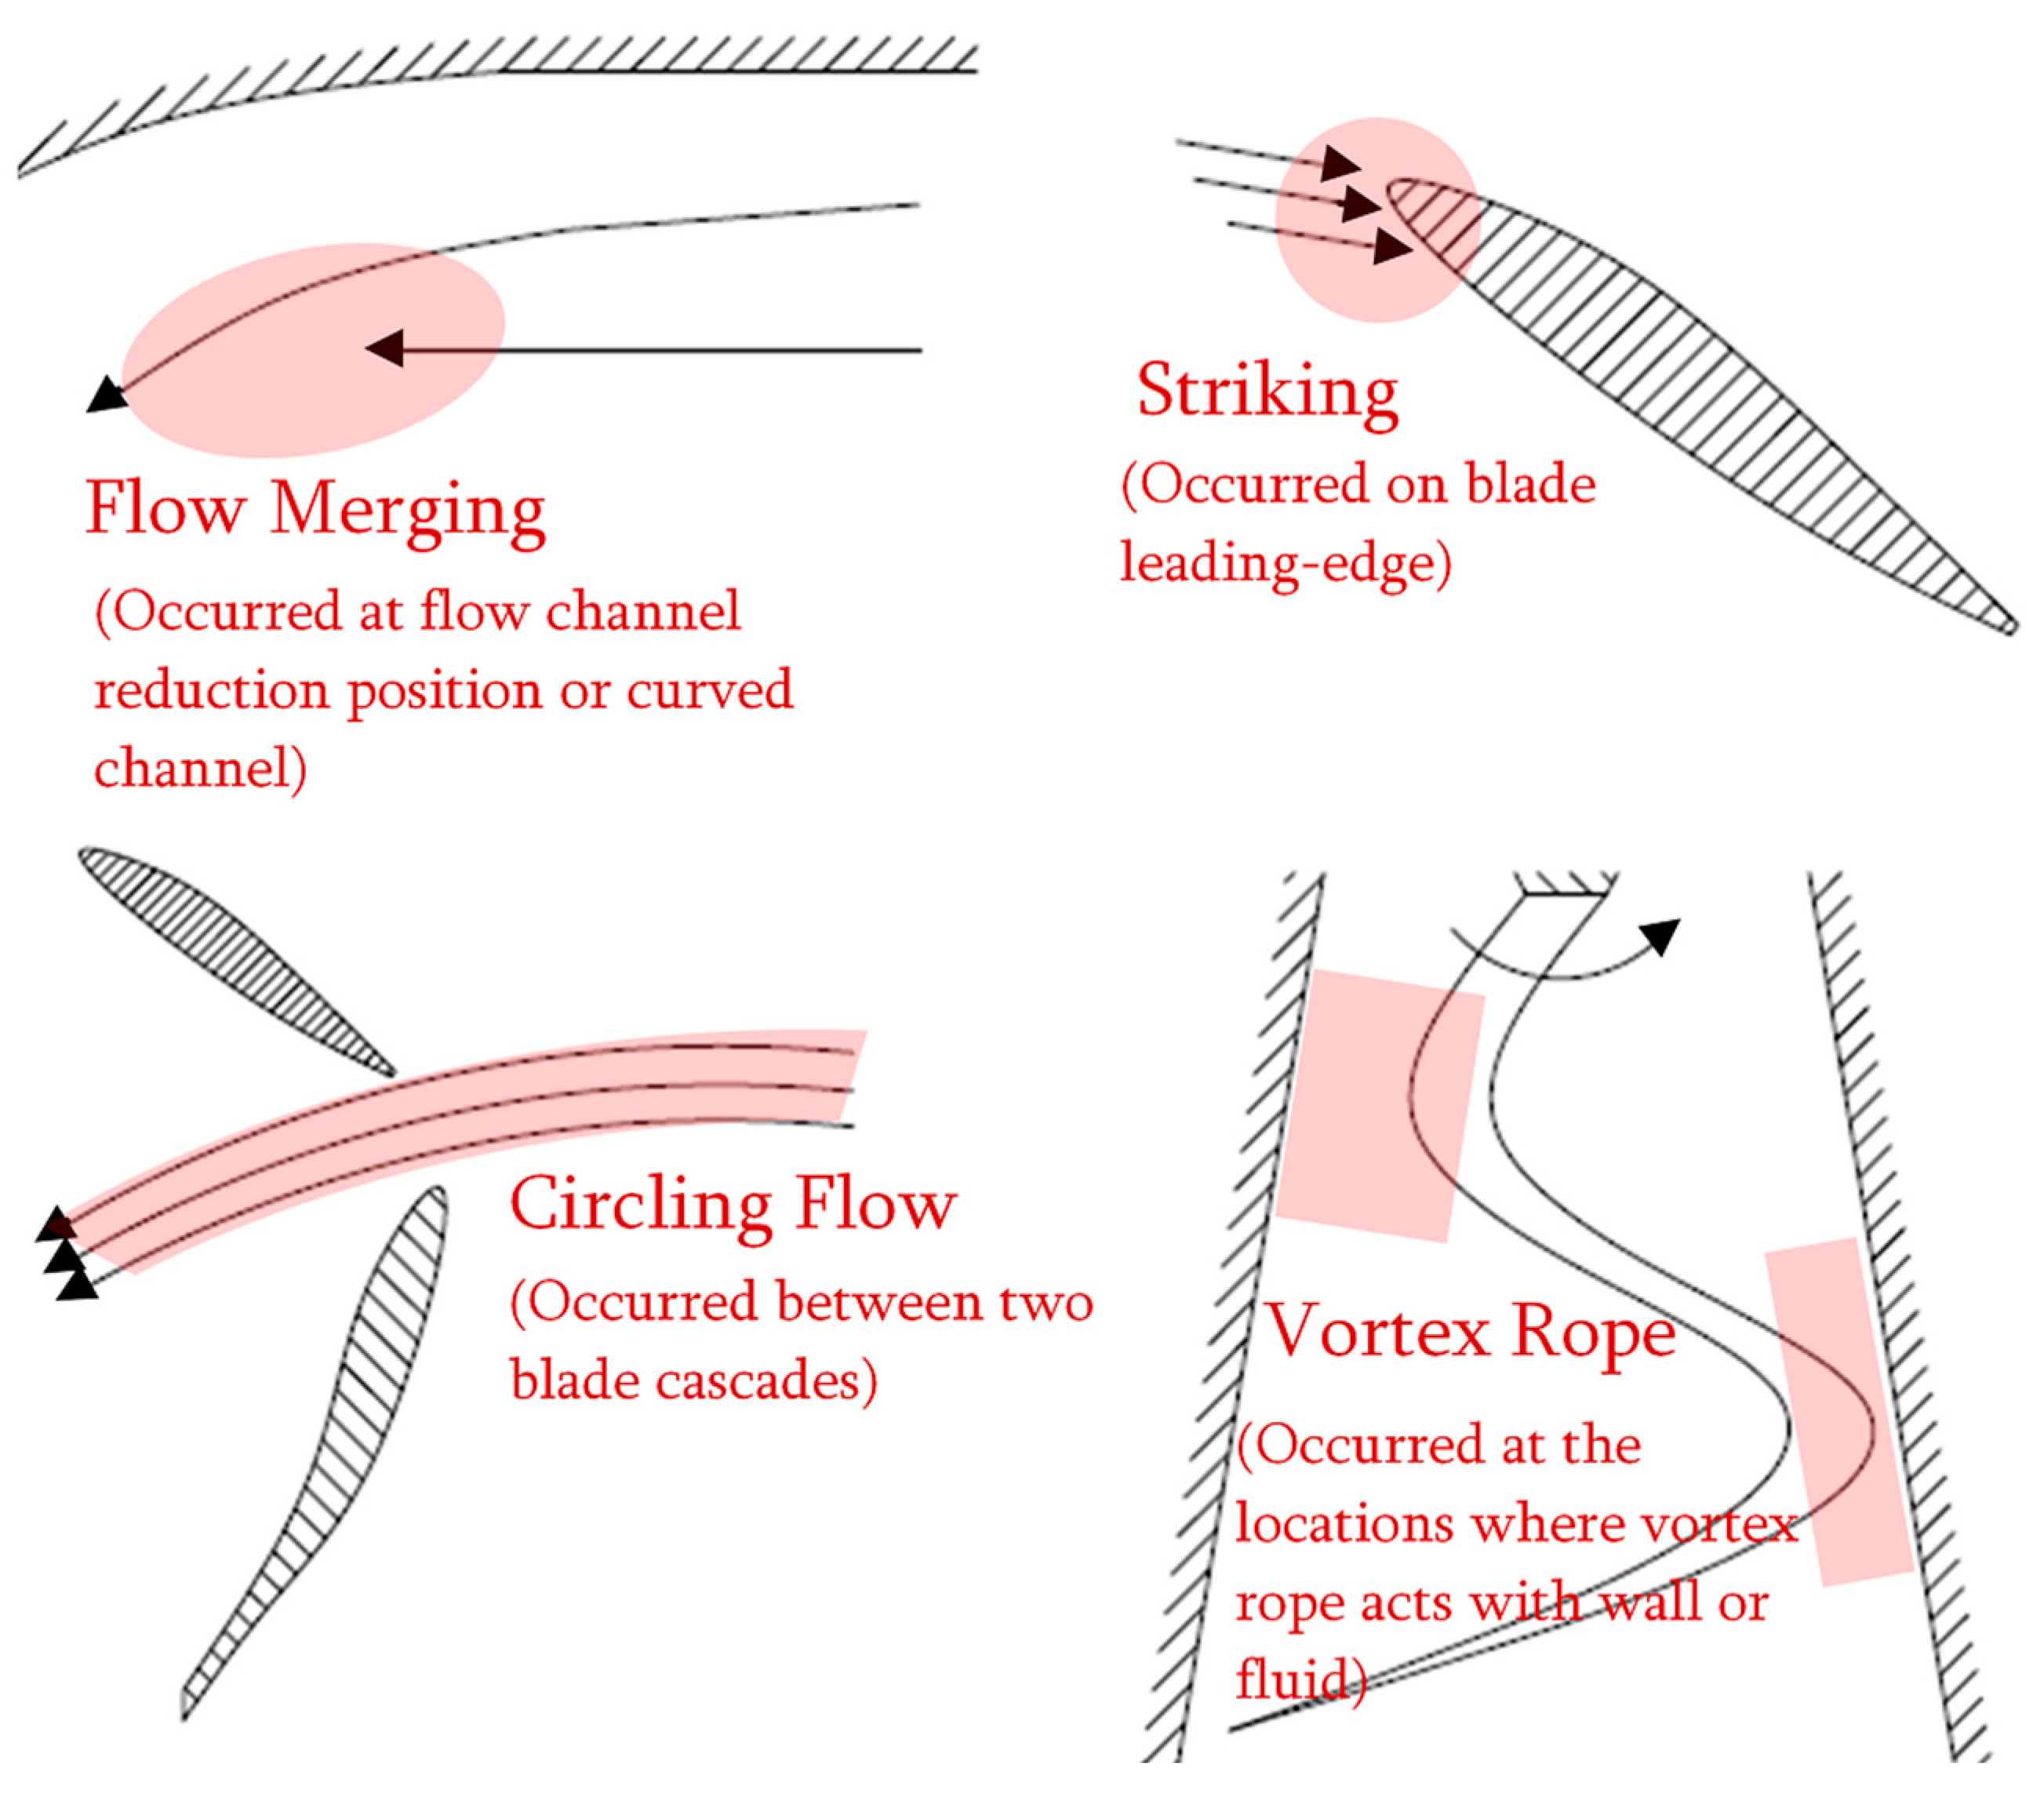
The main locations where flow-induced noise occurred included spiral case inlets, runner blade inlet edges, draft tube walls, and the middle of the draft tube. The flow-induced noise was closely related to the flow convergence and extrusion, fluid–blade interaction, draft tube rotating flow, etc. The noise caused by the interaction between the fluid and high-speed rotating runner was often the strongest;
(b)
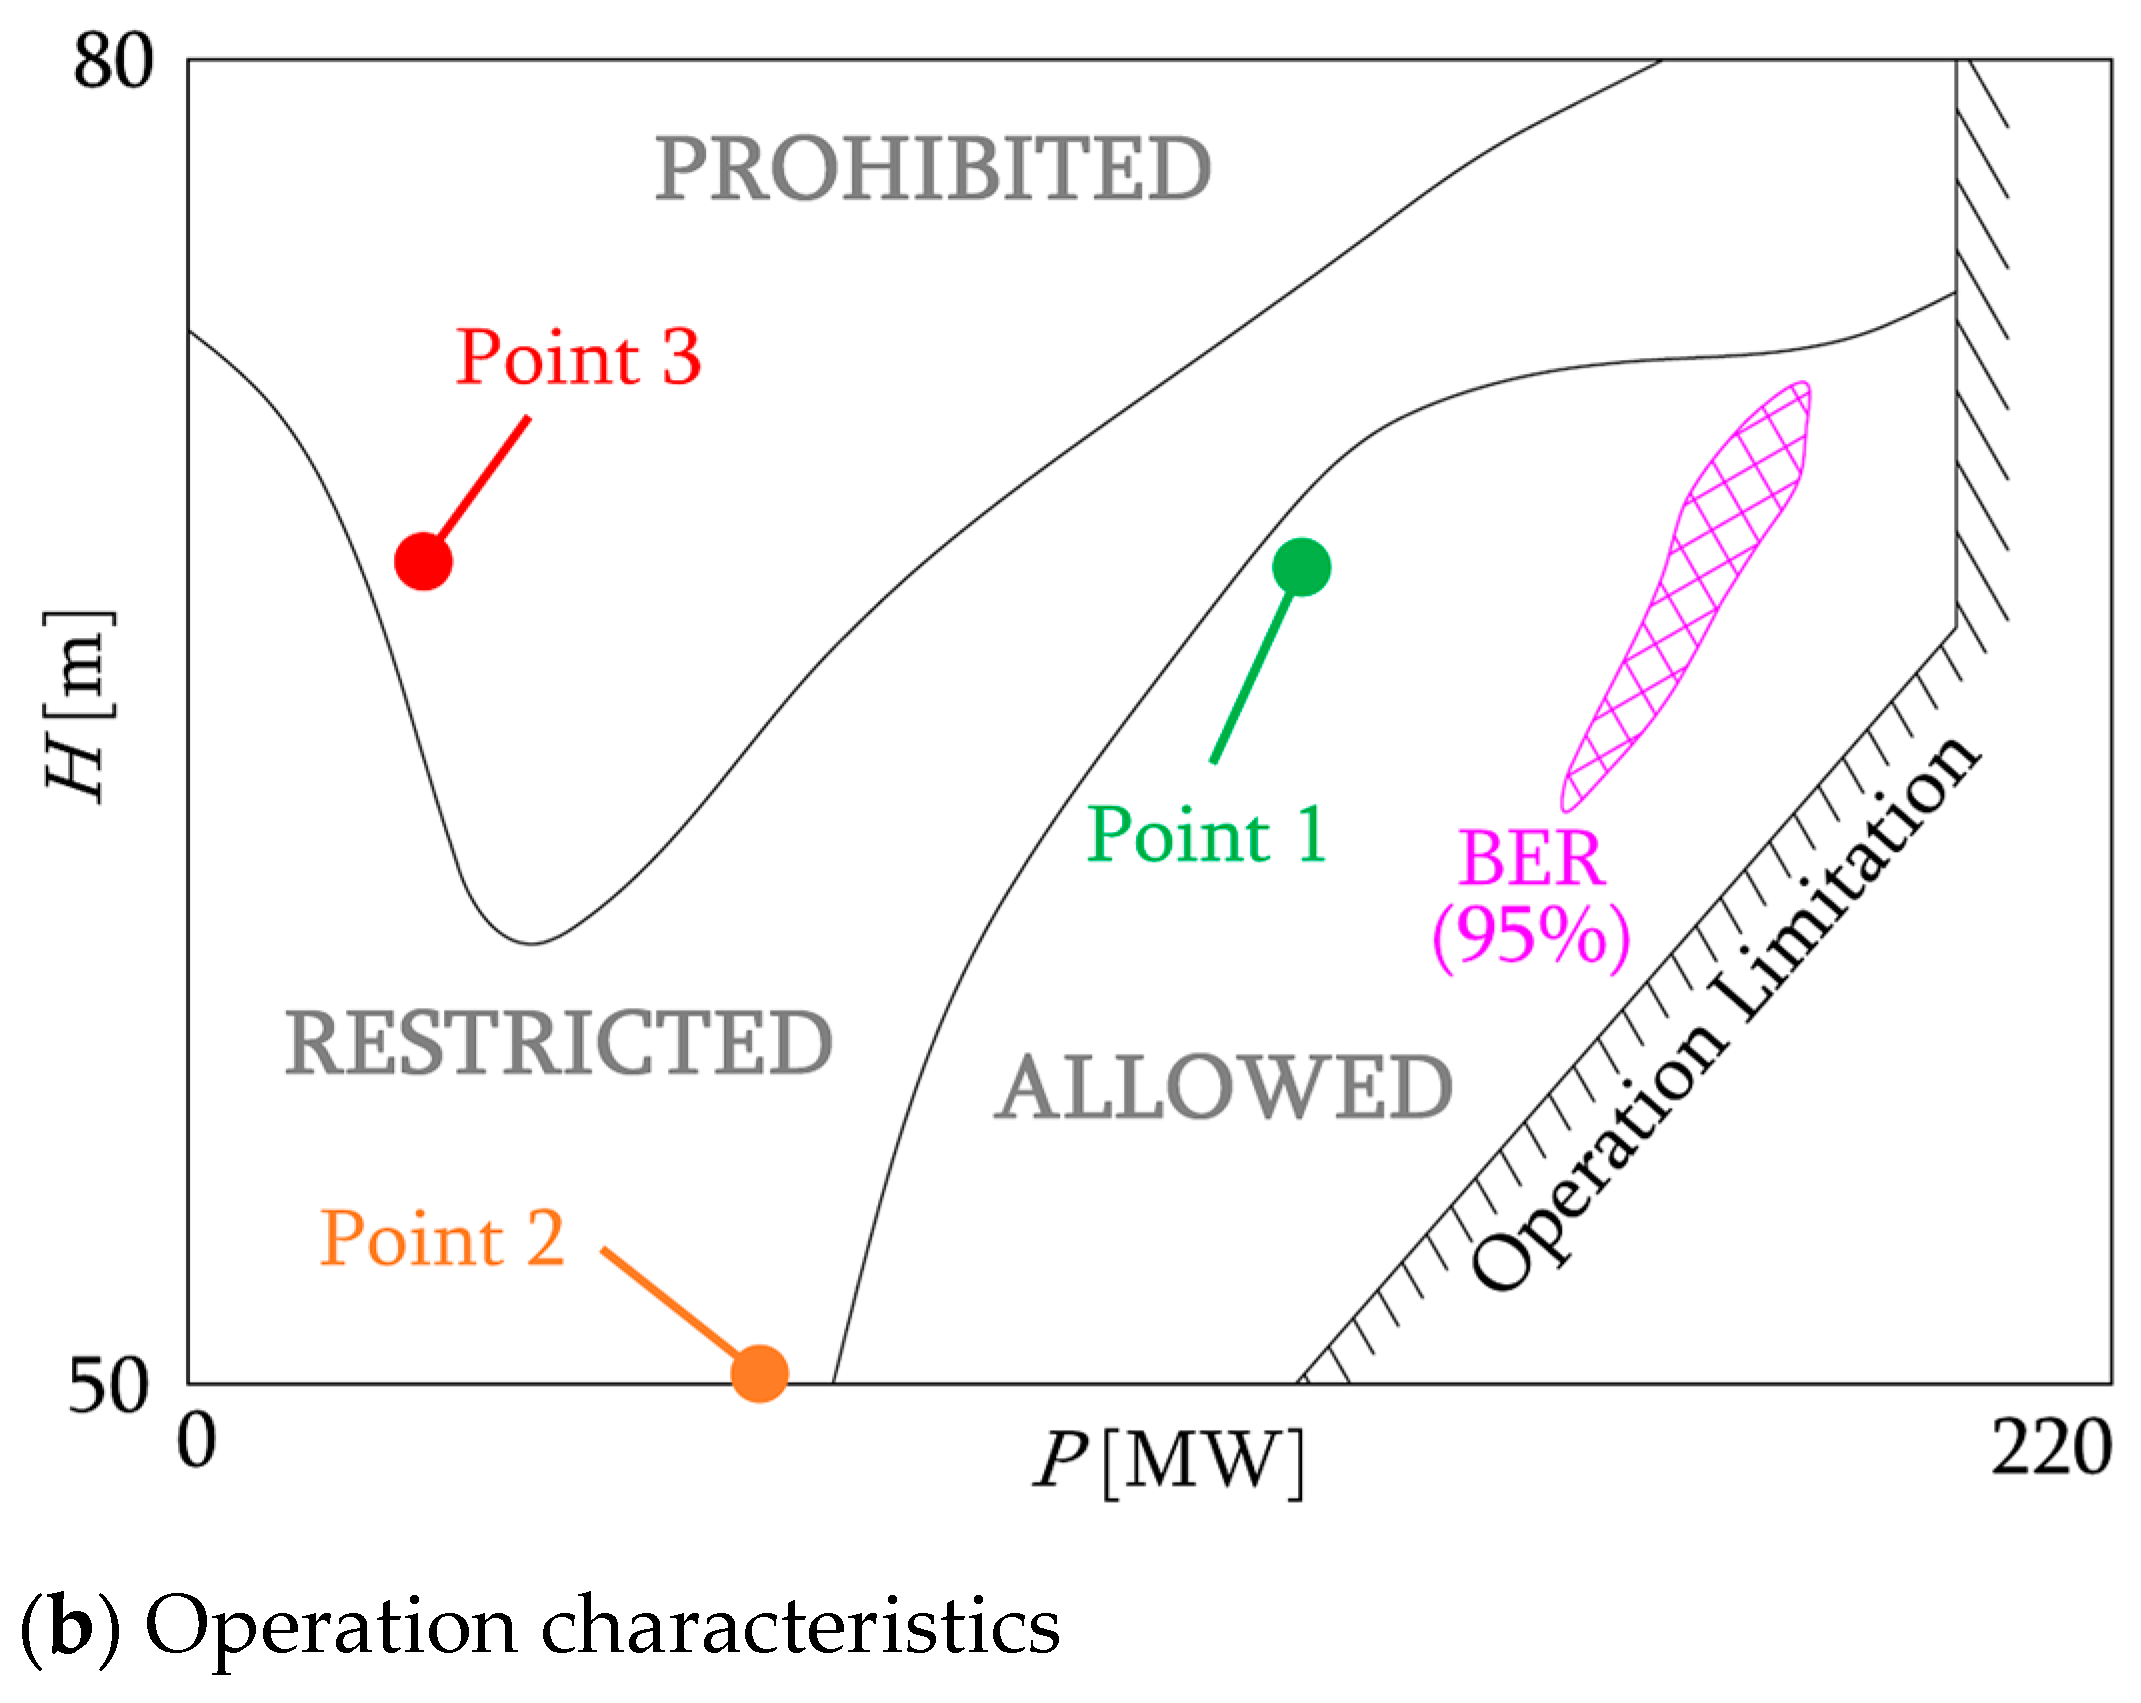
Flow-induced noise was related to the operation condition. When the turbine was operating in the allowed region (point one), the noise was lower. When the turbine was operating in the restricted region (point two) and the prohibited region (point three), the noise was higher. An exception occurred in the region near the vanes, as it was mainly affected by the opening of the guide vanes;
(c)
The difference in sound power level was related to the flow regime. When swirling flow was strong, it could cause high noise. When flow was smooth, the induced noise was low. In addition, flow-induced noise was not significant when flow was obstructed. In contrast, when the flow passed through the guide vanes at high speed, the flow-induced noise was strong.
How to reduce flow-induced noise through design methods is crucial for hydraulic turbines. This study can provide a reference basis for this issue and scientific references for engineering cases.

Author Contributions

Conceptualization, T.Z. and X.S.; methodology, Z.W.; software, D.Z.; validation, D.Z., W.G., and J.L.; formal analysis, J.L.; investigation, W.G. and G.H.; resources, Z.W.; data curation, T.Z.; writing—original draft preparation, G.H., T.Z., and J.L.; writing—review and editing, X.S. and W.G.; supervision, Z.W.; project administration, Z.W.; funding acquisition, Z.W. All authors have read and agreed to the published version of the manuscript.

Funding

This research was funded by the Open Research Fund Program of the State Key Laboratory of Hydroscience and Engineering (no. sklhse-2022-E-01).

Data Availability Statement

Data sharing is not applicable to this article.

Acknowledgments

We acknowledge the support provided for the research by the Open Research Fund Program of the State Key Laboratory of Hydroscience and Engineering.

Conflicts of Interest

The authors declare no conflict of interest.

References

  1. Zheng, Y.; Chen, D.X. Hydraulic Turbine, 3rd ed.; China Water Resources and Hydropower Press: Beijing, China, 2008; pp. 219–247. [Google Scholar]
  2. Huang, J.F.; Wang, C.Y.; Wen, J.; Rao, B.Y.; Long, L.Y. Research on Vortex of a Francis Hydro-turbine Based on CFD Technology. J. Yunnan Agric. Univ. 2010, 25, 147–151. [Google Scholar]
  3. Wan, Y.; Tan, Z.G. Vibration characteristics test-based analysis and evaluation on stability of large francis turbine-generator unit. Water Conserv. Hydropower Technol. 2014, 45, 15–19. [Google Scholar]
  4. Chen, T.; Zhang, Y.N.; Li, S.C. Instability of large-scale prototype Francis turbines of Three Gorges power station at part load. Proc. Inst. Mech. Eng. 2016, 230, 619–632. [Google Scholar] [CrossRef]
  5. Liu, D.M.; Liu, X.B.; Zhao, Y.Z. Experimental Investigation of Inter-Blade Vortices in a Model Francis Turbine. Chin. J. Mech. Eng. 2017, 30, 854–865. [Google Scholar] [CrossRef]
  6. Liu, D.M.; Liu, X.B.; Zhang, H.K. Introduction the Original Reason of Channel Vortex Based on the Cavitation Model. In Proceedings of the 35th World Congress of the International-Association-for-Hydro-Environment-Engineering-and-Research (IAHR), Chengdu, China, 8–13 September 2013. [Google Scholar]
  7. Kamal, M.; Saini, G.; Abbas, A.; Prasad, V. Prediction and analysis of the cavitating performance of a Francis turbine under different loads. Energy Sources Part A-Recovery Util. Environ. Eff. 2021, 1–25. [Google Scholar] [CrossRef]
  8. Guo, T.; Xu, L.H.; Luo, Z.M. Influence of Upstream Disturbance on Vortex Rope Evolution and Pressure Fluctuation in Draft Tube. Trans. Chin. Soc. Agric. Mach. 2022, 53, 192–201. [Google Scholar]
  9. Frunzǎverde, D.; Muntean, S.; Mǎrginean, G.; Campian, V.; Marşavina, L.; Terzi, R.; Şerban, V. Failure analysis of a Francis turbine runner. In Proceedings of the 25th IAHR Symposium on Hydraulic Machinery and Systems, Timisoara, Romania, 20–24 September 2010. [Google Scholar]
  10. Wang, H.L.; Zheng, Y.; Sun, A.R.; Zhang, F.L.; Gao, C.H.; Zhou, Y. The influence of guide vane opening on pressure pulsation characteristics and flow-induced noise in Francis turbine. South-North Water Transf. Water Sci. Technol. 2019, 16, 186–192. [Google Scholar]
  11. Pang, L.J.; Zhong, S.; Bu, L.F.; Hu, J.W. Analysis of abnormal noise of francis turbine by scene test. J. Vib. Shock 2012, 31, 39–42. [Google Scholar]
  12. Liu, P.; Chen, X.L.; Wang, Q.; Li, D. Analysis of rotor-stator interaction and vibration in high-head Francis turbines. J. Hydroelectr. Eng. 2016, 35, 91–98. [Google Scholar]
  13. Kubo, K.; Nakashima, T.; Shima, R.; Enomoto, Y. CFD-based rehabilitation for the high specific speed Francis turbine. In Proceedings of the 29th IAHR Symposium on Hydraulic Machinery and Systems (IAHR), Kyoto, Japan, 16–21 September 2018. [Google Scholar]
  14. Luo, X.; Yu, A.; Yu, W.; Wang, L.; Xu, H. Pressure oscillation suppression by air admission in a Francis turbine draft tube. In Proceedings of the 29th IAHR Symposium on Hydraulic Machinery and Systems (IAHR), Kyoto, Japan, 16–21 September 2018. [Google Scholar]
  15. Wang, H.Z.; Zhou, D.Q.; Zhang, L.G. Numerical simulation of flow noise of low specific speed Francis turbine. Hydropower Energy Sci. 2014, 32, 153–156. [Google Scholar]
  16. Wang, W.; Chen, Q.; Yan, D.; Geng, D. A novel comprehensive evaluation method of the draft tube pressure pulsation of Francis turbine based on EEMD and information entropy. Mech. Syst. Signal Process. 2019, 116, 772–786. [Google Scholar] [CrossRef]
  17. Favrel, A.; Landry, C.; Müller, A.; Avellan, F. Experimental identification and study of hydraulic resonance test rig with Francis turbine operating at partial load. In IOP Conference Series: Earth and Environmental Science; IOP Publishing: Bristol, UK, 2012. [Google Scholar]
  18. Chen, D.Y.; Zhao, W.L.; Sprott, J.C.; Ma, X.Y. Application of Takagi-Sugeno fuzzy model to a class of chaotic synchronization and anti-synchronization. Nonlinear Dyn. 2013, 73, 1495–1505. [Google Scholar] [CrossRef]
  19. Xu, B.B.; Chen, D.Y.; Zhang, H.; Zhou, R. Dynamic analysis and modeling of a novel fractional-order hydro-turbine-generator unit. Nonlinear Dyn. 2015, 81, 1263–1274. [Google Scholar] [CrossRef]
  20. Xu, B.B.; Chen, D.Y.; Zhang, H.; Wang, F.F. Modeling and stability analysis of a fractional-order francis hydro-turbine governing system. Chaos Solitons Fractals 2015, 75, 50–61. [Google Scholar] [CrossRef]
  21. Xu, B.B.; Wang, F.F.; Chen, D.y.; Zhang, H. Hamiltonian modeling of multi-hydro-turbine governing systems with sharing common penstock and nonlinear dynamic analyses under shock load. Energy Convers. Manag. 2016, 108, 478–487. [Google Scholar] [CrossRef]
  22. Chen, M. Fundamentals of Viscous Fluid Dynamics; Higher Education Press: Beijing, China, 1993. [Google Scholar]
  23. Terentiev, L. The Turbulence Closure Model Based on Linear Anisotropy Invariant Analysis; VDM Verlag: Saarbrucken, Germany, 2008. [Google Scholar]
  24. Menter, F.R. Two-Equation Eddy-Viscosity Turbulence Models for Engineering Applications. AIAA J. 1994, 32, 1598–1605. [Google Scholar] [CrossRef]
  25. Proudman, I. The generation of noise by isotropic turbulence. Proc. R. Soc. A 1952, 214, 119–132. [Google Scholar]
  26. Celik, I.B.; Ghia, U.; Roache, P.J.; Freitas, C.J.; Coleman, H.; Raad, P.E. Procedure for Estimation and Reporting of Uncertainty due to Discretization in CFD Applications. J. Fluids Eng. Trans. ASME 2008, 130, 078001. [Google Scholar]
Figure 1. The main components of the Francis turbine.
Water 15 03461 g001
Figure 2. Grid for Francis turbine’s fluid domain.
Water 15 03461 g002
Figure 3. The operation characteristics of the Francis turbine.
Water 15 03461 g003aWater 15 03461 g003b
Figure 4. The streamlines in the Francis turbine fluid domain.
Water 15 03461 g004
Figure 5. The reference planes in the Francis turbine.
Water 15 03461 g005
Figure 6. The contours of flow-induced noise Lsp in the Francis turbine.
Water 15 03461 g006aWater 15 03461 g006b
Figure 7. Comparison of the maximum sound power levels at different positions.
Water 15 03461 g007
Figure 8. The schematic map of the locations where high flow-induced noise occurs.
Water 15 03461 g008
Table 1. Parameters of the Francis turbine.
ParameterValue
Rotor diameter Drn5.80 m
Rated output power Pr183.7 MW
Rated flow rate Qr301 m3/s
Rated rotation speed nr100 r/min
Rated head Hr68.0 m
Maximum output power Pmax204.1 MW
Turbine installation height Hins895.00 m
Table 2. Grid number details.
ComponentGrid Element Number
Spiral case209,260
Stay vane558,230
Guide vane623,824
Runner897,680
Draft tube464,692
Total2,753,686
Table 3. Comparison of experimental and numerical results.
PointCFD EfficiencyExperimental Efficiencyn11Q11
Point One91.05%90.51%77.850.7864
Point Two71.72%70.32%78.550.3678
Point Three55.25%52.88%91.210.3495
Table 4. Positions for comparing the maximum flow-induced noise.
Symbol of PositionPosition Description
AAt spiral case inlet
BBetween stay vane and guide vane
CIn runner blade channels
DNear runner cone in draft tube
EMiddle of draft tube straight section
FNear draft tube elbow section
GIn draft tube diffusion section
Disclaimer/Publisher’s Note: The statements, opinions and data contained in all publications are solely those of the individual author(s) and contributor(s) and not of MDPI and/or the editor(s). MDPI and/or the editor(s) disclaim responsibility for any injury to people or property resulting from any ideas, methods, instructions or products referred to in the content.

