Abstract
To explore the influence of sample preparation methods on the permeability and microstructure of remolded loess, remolded loess collected from Heifangtai was taken as the research object. A total of 40 sets of falling-head permeability tests were conducted using two commonly used sample preparation methods, and five different dry density and four initial water content conditions. Additionally, the electrical conductivity of the leachate and the microscopic structure of the samples were analyzed. The results demonstrate that compared to the transfer wetting method, the homogeneity of samples prepared using the pre-wetting method is inferior. This difference is particularly evident when the initial water content is high. Due to the long duration of the permeability test, the pore structure is prone to change, resulting in relatively higher permeability coefficients. Moreover, the total dissolved solids (TDS) of the leachate exhibit a significant decrease with increasing seepage time, indicating the loss of soluble salts. Microscopic structural analysis reveals that samples prepared using the pre-wetting method exhibit a greater number of large pores and aggregates, which are intrinsic factors contributing to the observed differences in permeability between the two sample preparation methods. Furthermore, it should be noted that the impact of the sample preparation method on the permeability of remolded loess is more significant when the dry density is relatively low (specifically, less than 1.45 g/cm3). Conversely, when the dry density is higher, the influence becomes less pronounced.
1. Introduction
China is one of the countries with the most widespread distribution of loess in the world, accounting for approximately 6.8% of its total land area. Loess is mainly distributed in the northwest region of China known as the Loess Plateau [1,2,3]. This plateau is situated in arid and semi-arid climatic zones, and has experienced intensive and large-scale irrigation activities that have led to numerous geological disasters like landslides and subsidence [4,5,6,7]. Heifangtai in Gansu Province serves as a resettlement area for the Liujiaxia Reservoir, and has experienced frequent loess landslides due to large-scale agricultural irrigation. These landslides have caused significant loss of life and property for the local residents. As one of the most typical areas exhibiting loess landslide induced by irrigation, Heifangtai is known as a “microcosm of loess landslide geological disasters in the Loess Plateau” and has garnered attention from scholars [8,9,10]. The destruction of loess slopes in the region is influenced by several factors, including soil structure, shear strength, and pore water chemistry [11,12,13,14], which are closely related to soil permeability.
In previous research, a significant number of laboratory experiments have been conducted to investigate the hydraulic properties of loess. Remolded loess samples are commonly used as a means to reflect the hydraulic characteristics of in situ loess and guide engineering activities. The sample preparation process plays a critical role in determining the hydraulic properties of remolded soil samples in laboratory geotechnical tests. For compacted samples, the typical procedure involves drying and pulverizing the soil into a dry powder, which is then sieved to obtain a homogeneous texture. Subsequently, the dry powder is mixed with sprayed water to achieve the desired initial weight moisture content. The moist soil is then compacted under static or dynamic conditions to reach a target dry unit weight (or void ratio). During the rehydration process of the dried soil powder, the formation of aggregates composed of fine soil particles occurs [15]. Changes in moisture content during the sample preparation process influence the compactness of unsaturated loess and alter particle arrangement, thereby impacting the heterogeneity and permeability of the soil [16]. The sample preparation method has a remarkable influence on the internal structure of the soil and directly affects the mechanical properties of the samples. Consequently, it is crucial to consider the soil formation process when applying these samples in engineering practice.
The main factors that contribute to differences in microstructure and control the permeability of compacted loess are the initial water content and compaction degree. Hao found that the initial water content of uncompacted unsaturated loess usually influences the structural characteristics of the loess after compaction [17]. Lu et al. discovered that the initial water content of loess significantly influences changes in pore structure, with greater changes observed at higher initial water contents [18]. Zhai et al. [19,20,21] found that changes in moisture content affect the distribution of soil–water characteristic curves and are linked to pore size distribution. Xu et al. discovered that dry density has two different effects on the permeability of saturated loess. In low-density soil, small particle migration can block pores and reduce permeability. In high-density soil, bonding materials dissolve, increasing pore size and enhancing permeability [22]. Cuisinier et al. found that the water content and dry density predominantly affect the distribution of larger-pore voids during compaction, thus affecting permeability [23]. Yuan et al. noted that increasing the dry density of loess decreases the volume of large pores and increases the volume of small and medium-sized pores, ultimately resulting in lower saturated permeability coefficient [24]. Zhang et al. [25] discovered that clay particles disperse and cause damage to the pore structure after water absorption and expansion. Wei et al. found that changes in loess permeability are closely related to pore size distribution, and the throat size distribution in loess pores plays a decisive role in determining permeability [26,27]. Guo et al. have shown that the saturated hydraulic conductivity decreases as the dry density or molding water content increases, due to a reduction in cumulative volume and porosity, leading to a gradual decline in hydraulic conductivity [28]. These changes have a significant impact on the strength of the soil and can lead to variations in slope stability. At the same time, it is also found that during the seepage process, loss of salt in the soil can increase pore size and cause the interior to become loose, thereby affecting the soil’s permeability. Qajar found that the dissolution of chemicals is a homogenization of pore structure [29]. The presence of salt in saline soil can also have a significant impact on permeability. The presence of sulfate (Na2SO4) can cause further structural changes in eroded soil, leading to the gradual development of internal cracks [30]. When soluble salts are involved in soil permeation, more pronounced changes in soil structure and permeability occur [31].
In addition, a large number of tests have found that sample preparation methods had a significant effect on the physicochemical properties and pore characteristics of the sample. Nimmo et al. observed up to a fivefold difference in unsaturated hydraulic conductivity between sandy soil samples prepared using different compaction methods [32]. Jang et al. used electron microscopy to demonstrate that dry-packed samples had more ordered internal arrangements and evenly distributed pores compared to wet-packed samples, indicating that sample preparation could result in different initial structures [33]. Delage et al. quantitatively studied the microstructure of compacted silt and found that the preparation method significantly influenced the pore size distribution of the soil; wet samples exhibited a significant matrix-type structure, while dry samples formed a skeleton structure made up of powder aggregates, which directly impacted the mechanical properties of the samples [34]. Gao et al. discovered that reconstituted specimens demonstrated higher strength, larger stiffness, and more obvious morphology than compacted samples under the same conditions, with mercury intrusion testing revealing a unimodal pore size distribution in reconstituted samples and a bimodal distribution in compacted samples. [35]. Teng et al. used nuclear magnetic resonance technology to test the pore distribution of powdered soil under different compaction methods and found that the sample preparation had a significant influence on the saturated hydraulic conductivity coefficient. They suggested that the variation in the pore structure of the soil during the flow of water in the soil should be observed in studies of permeability tests [36]. Therefore, whether the soil sample preparation method will affect the pore characteristics of the soil mass, and then affect its structure and permeability, is a problem worthy of attention.
The primary objective of this study is to explore the influence of different sample preparation methods on the permeability of remolded loess. Its specific aims are as follows: (1) Investigate the variations in permeability of loess with different dry density, while exploring the interactions among internal components during long-term seepage processes. (2) Analyze the pore structure and contact mechanisms of remolded loess under different sample preparation methods, in order to reveal the impact of sample preparation conditions on the microstructure and permeability of remolded loess. (3) Combine macroscopic experiments and qualitative analysis of microscopic characteristics to reveal the internal factors of permeability changes resulting from different sample preparation methods.
2. Materials and Methods
2.1. Sample Characteristics
The soil sample examined in this study was collected from Yongjing County, Gansu Province, located in the western Loess Plateau of China at coordinates 36°06′35.15″ N and 103°20′11.79″ E. The site belongs to the fourth-level terrace of the Yellow River, and the sampled loess layer is approximately 3 m below the surface. The soil material is identified as Q3 loess (also known as Malan loess in China), which appears yellow in color and exhibits uniform texture, loose structure, and fine particles. The undisturbed dry density of the loess was measured as 1.35 g/cm3 with a moisture content of 7.01%. Following transportation of the soil sample to the laboratory, physical properties were assessed in accordance with ASTM 2006 [37] protocols, which are indicated in Table 1. Subsequently, the mineral composition of the loess was examined via X-ray diffraction analysis, presented in Table 2. Based on the soil classification set forth in ASTM D2487, the test soil was categorized as low-plasticity clay (CL). Laser particle size analysis using a Bettersize 2000 instrument was employed to measure the particle size distribution of the loess. Results revealed that the sample comprised 21.42% clay particles (d < 0.005 mm), 70.29% silt particles (0.005 mm < d < 0.075 mm), and 8.29% sand particles (d > 0.075 mm), as illustrated in Figure 1. The maximum dry density obtained from the laboratory compaction test was 1.65 g/cm3, with an optimum moisture content of 15.6%.

Table 1.
Basic physical properties of loess.
Table 2.
Mineralogical composition of loess.
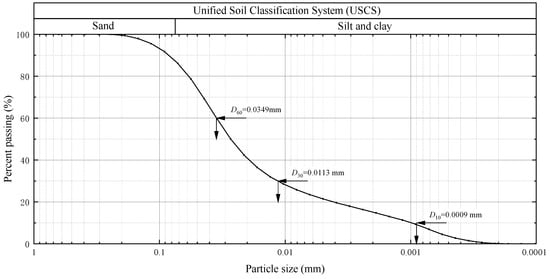
Figure 1.
Particle size distribution of samples (D10, D30, and D60 are the particle sizes corresponding to 10%, 30%, and 60% finer materials on the cumulative particle size distribution curve, respectively).
2.2. Experimental Design
The permeability coefficient was measured using the laboratory falling-head method. Two methods for preparing remolded loess were considered: pre-wetting method and transfer wetting method. Based on the initial dry density and water content of the undisturbed soil samples, as well as the maximum dry density and optimum water content in the laboratory, four water content levels (5%, 10%, 15%, 20%) and five dry density levels (1.25 g/cm3, 1.35 g/cm3, 1.45 g/cm3, 1.55 g/cm3, 1.65 g/cm3) were selected, resulting in a total of 40 sets of falling-head permeability tests. The specific experimental design is presented in Table 3.
Table 3.
Permeability test method design.
2.3. Sample Preparation
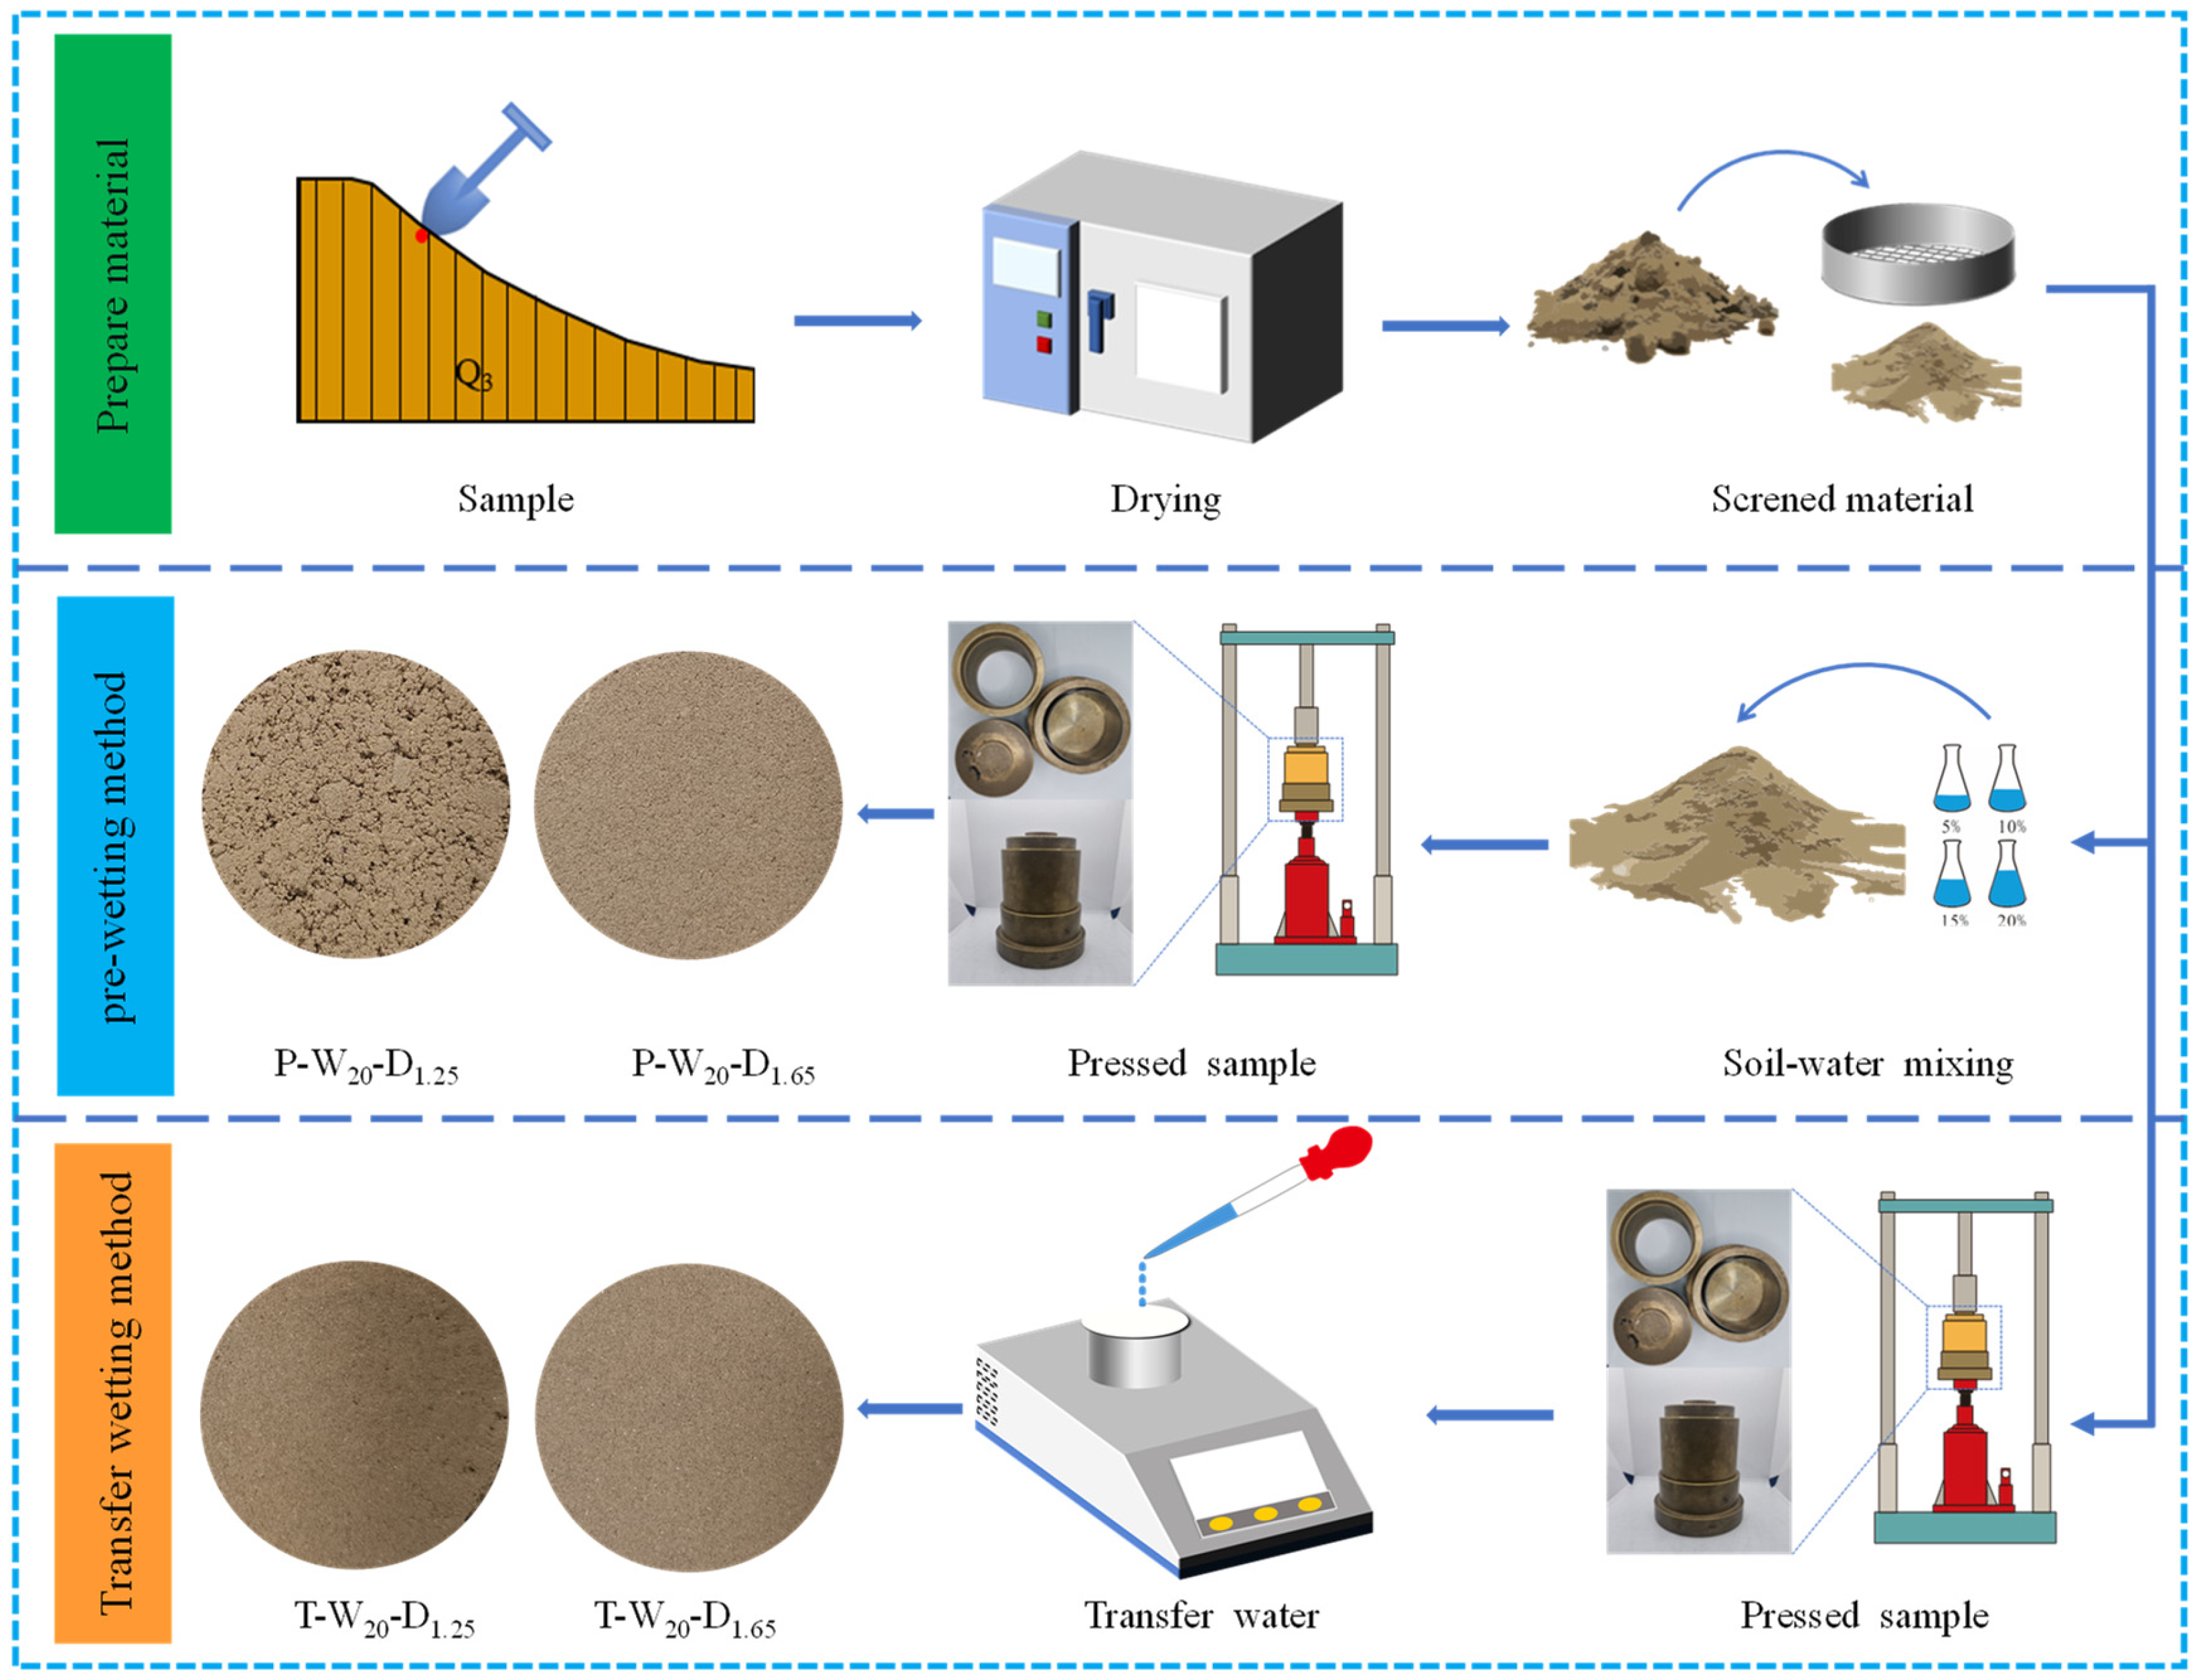
The sample preparation process for the entire experiment is shown in Figure 2 and can be roughly divided into the following steps:

Figure 2.
Sample-making process.
Preparation of Experimental Materials: The loess collected from the field was baked in an oven at 105 °C for over 8 h. Once the temperature was lowered to room temperature, impurities and roots were removed from the soil using a 2 mm sieve [43]. The sieved soil samples were sealed and stored in a dry environment.
Sample Configuration: Distilled water was sprayed onto the surface of dry soil according to the pre-designed moisture content (5%, 10%, 15%, 20%). The soil was then wrapped in plastic wrap and sealed for at least 72 h at room temperature (20 °C) to ensure thorough mixing of soil and water.
Sample Preparation: The pre-wet preparation method according to the preset dry density and ring knife specifications (inner diameter 61.8 mm, height 40 mm) accurately weighed the wet soil mass to 0.01 g. The wet soil was poured into the compactor, leveled, and compressed with static pressure at a stable rate. After reaching the target height, pressure application was stopped, and the sample was kept in this state for 10 min to ensure stable internal structure formation. The transfer wetting method used the water film transfer method to increase water content [44,45]. The preparation method of the transfer wetting method was similar to that of the pre-wetting method; an annular sample with 5% moisture content was prepared first. The amount of water required to increase each dry density annular sample to the target moisture content was calculated. The top and bottom of the annular sample were placed on wet filter paper. Distilled water was slowly dropped onto the filter paper from the top and bottom surfaces using a pipette; the process was performed on an electronic balance. This allowed the water to slowly penetrate into the soil. After even distribution of water inside the sample, the top and bottom were tied with permeable stone, wrapped in plastic wrap, and stored in a humidifier at room temperature (20 °C) for 72 h [46]. The water content was measured again using a weighing method, with error control within ±0.2% of the target moisture content [47]. Finally, the wrapped samples were stored in the constant humidity incubator for further use.
2.4. Permeability Coefficient Test
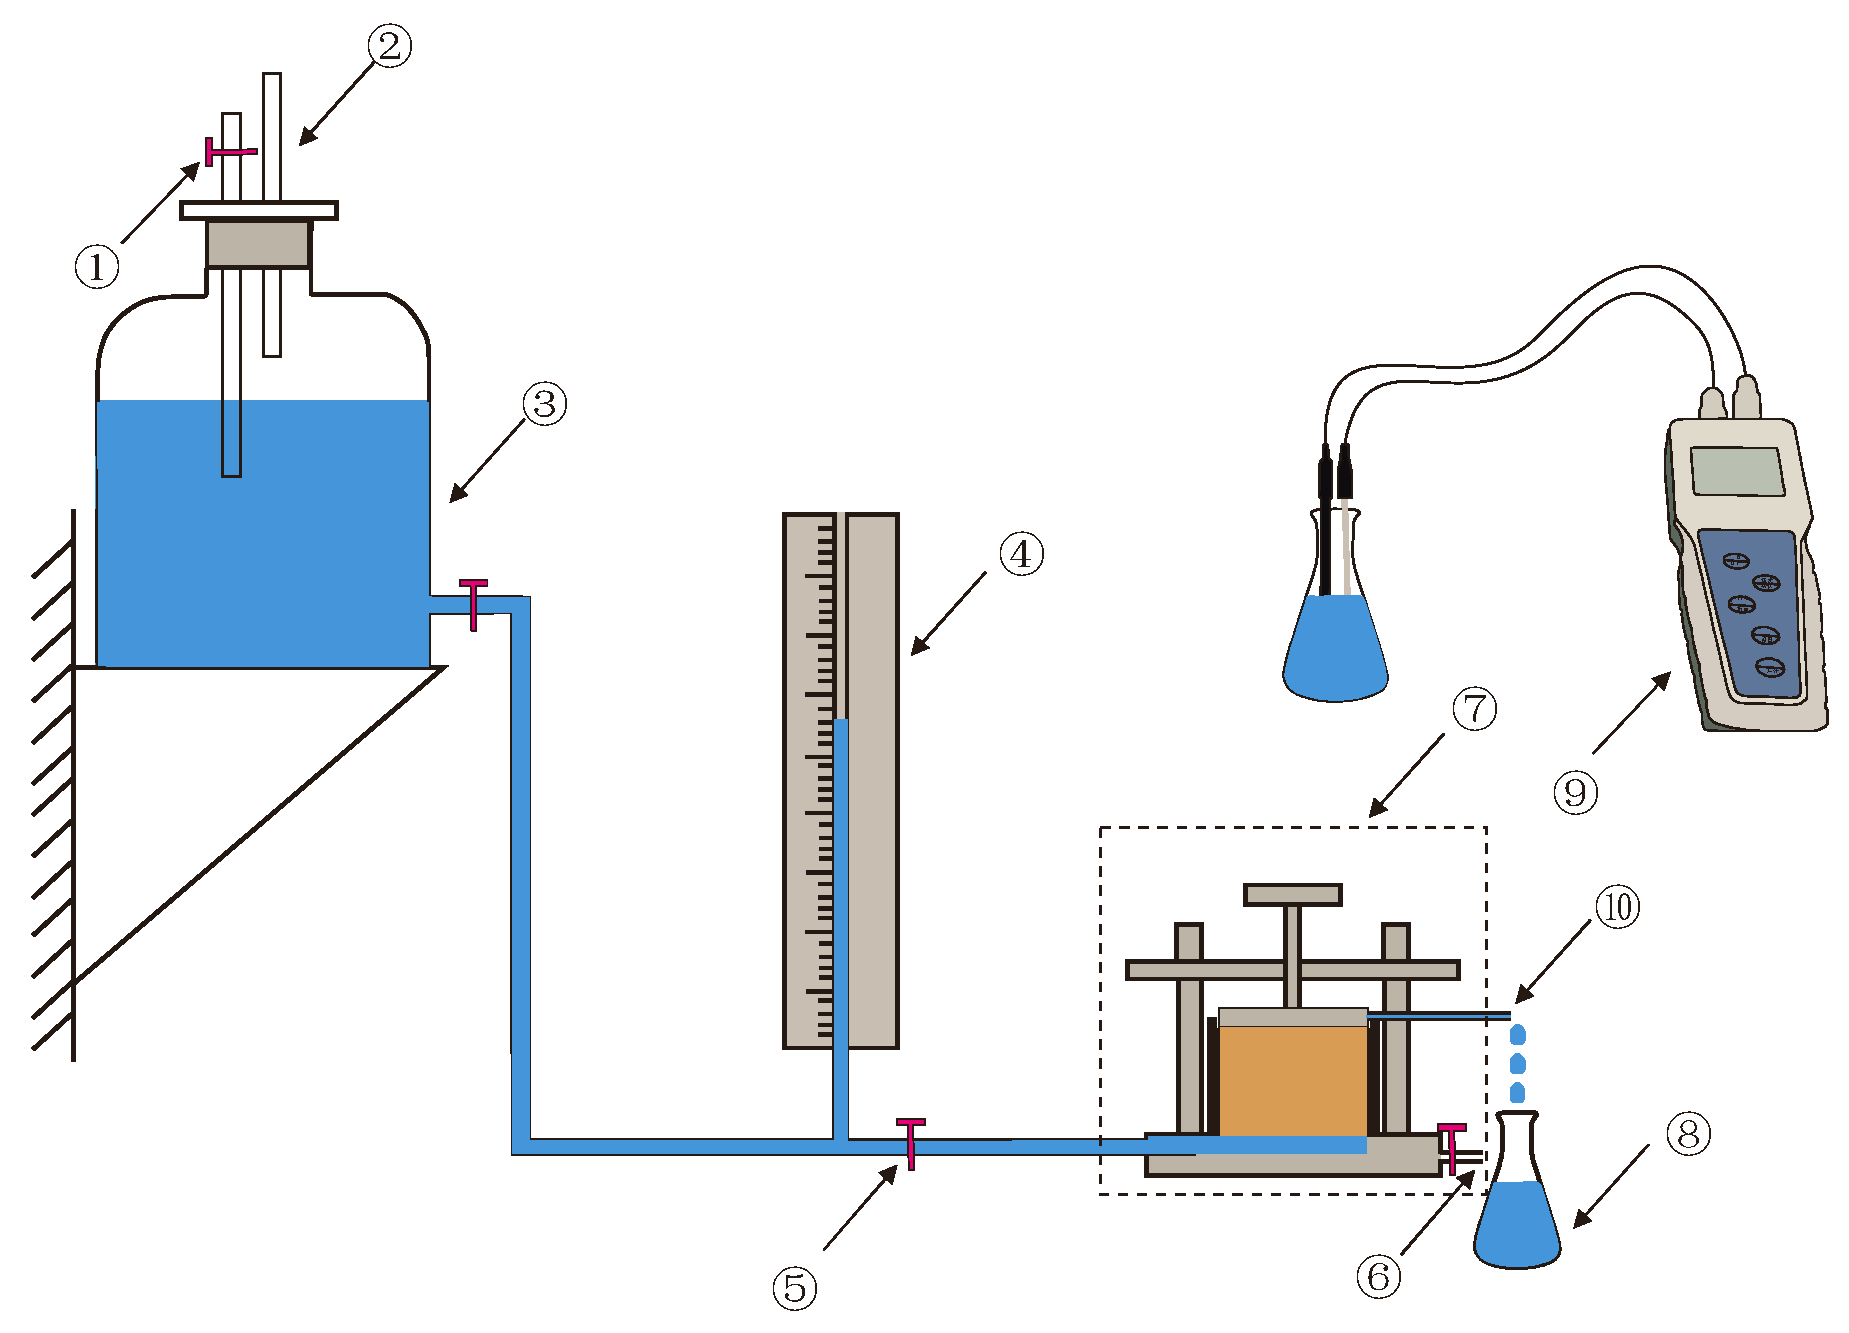
The constant-head permeability test [48,49] and the falling-head permeability test [28] are widely used to study soil permeability. For coarse-grained soils with high permeability, a constant-head test is typically used. However, for fine-grained soils with low permeability, a falling-head test is often more suitable [50], as it enables quicker completion of multiple repeat tests [51]. These factors ensure that the experiment can be conducted smoothly. Therefore, in this study, the falling-head test method was selected, and the permeameter (TST-55, Nanjing soil instrument Factory Co., Ltd., Nanjing, China) was used to test the permeability coefficient. Samples prepared using any of the sample preparation methods were placed in the TST-55 permeameter to measure the permeability coefficient. The electrical conductivity of the leachate was measured during the permeability test. Conductivity was measured using a portable conductivity meter (DDBJ-350, INESA Scientific Instrument Co., Ltd., Shanghai, China). To eliminate the effect of ions present in the percolating fluid on the conductivity, distilled water was used as the percolating fluid. The entire testing process is illustrated in Figure 3.
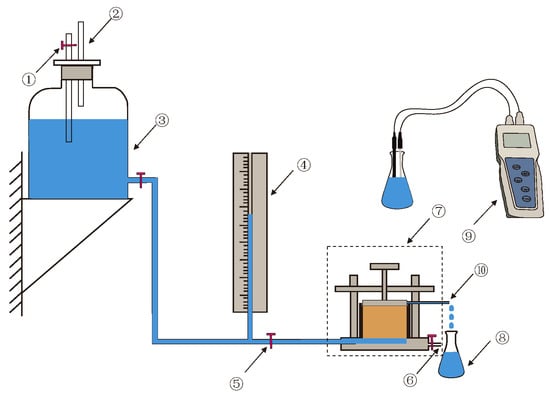
Figure 3.
Permeability coefficient test device diagram: (1) inlet; (2) vent; (3) water supply bottle; (4) pressure gauge tube; (5) water stop clamp; (6) exhaust port; (7) permeameter; (8) conical bottle; (9) conductivity meter; (10) outlet.
The general process of the experiment and testing is as follows:
a. Connect the instrument and saturate the sample. The sample can be saturated directly using the variable head permeability apparatus until a uniform and continuous flow is achieved at the outlet, indicating that the sample is essentially saturated. Subsequently, the coefficient of permeability is tested.
b. Fill the piezometer with water to a certain height, record the initial water head height and start time of the test. When the water in the piezometer flows to a certain height below, measure the water head height and the temperature and conductivity values of the permeated water within this interval.
c. Repeat step b to continuously measure the coefficient of permeability. In order to reduce errors caused by different water head heights in the measuring pressure tube, keep h1 and h2 approximately equal in each test to maintain a constant hydraulic gradient.
d. When the elapsed time for a single sample (h1 − h2) is roughly equal or the conductivity of the permeating solution stabilizes within a certain range, the permeability testing for the single sample is terminated.
The permeability coefficient k is calculated according to the following equation:
where kT is the permeability coefficient at temperature T °C; a represents the cross-sectional area of the water head pipe (cm2); L represents the seepage path, the height of the sample (cm); A represents the cross-sectional area of the sample (cm2); (t2 − t1) represents the time difference between the start and end times (s); h1 and h2 represent the initial and final water heads, respectively (cm).
The viscosity of a liquid is a characteristic that affects its resistance to movement and is related to temperature. The permeability is sensitive to temperature because it reflects the ease with which fluids flow through pore spaces. To prevent temperature from affecting the results of the permeability coefficient, a standard temperature of 20 °C is used. When the actual temperature deviates from 20 °C, k is adjusted according to the following equation:
where K20 and KT are permeability coefficient at 20 °C and T °C, respectively, and η20 and ηT are the coefficients of dynamic viscosity at 20 °C and T °C, respectively.
2.5. Microstructure Testing
In this study, the evaluation of pore structure following partial seepage was conducted using the Stemi-508 body microscope and the Nikon polarizing microscope. The remodeled loess samples were prepared through the following steps. Soil columns with a thickness of approximately 2 cm were extracted from the sample surface, dried to remove moisture, treated with a curing agent for solidification, and allowed to naturally harden after the curing process. Subsequently, the samples were subjected to grinding and light dissection. A field of view measuring 2 cm × 2 cm was selected for observation and photography using a stereoscope, with a magnification of 20 times. The captured images were stitched together for analysis of surface porosity. Moreover, a portion of the dissected specimens was sliced and magnified 100 times under a polarized light microscope, providing a wider field of view with clear boundaries of pores and particles. This allowed for improved identification of cement and agglomerates, facilitating the observation of soil particle aggregation phenomena.
3. Results and Analysis
3.1. Permeability Test Results of Remolded Loess under Pre-Wetting
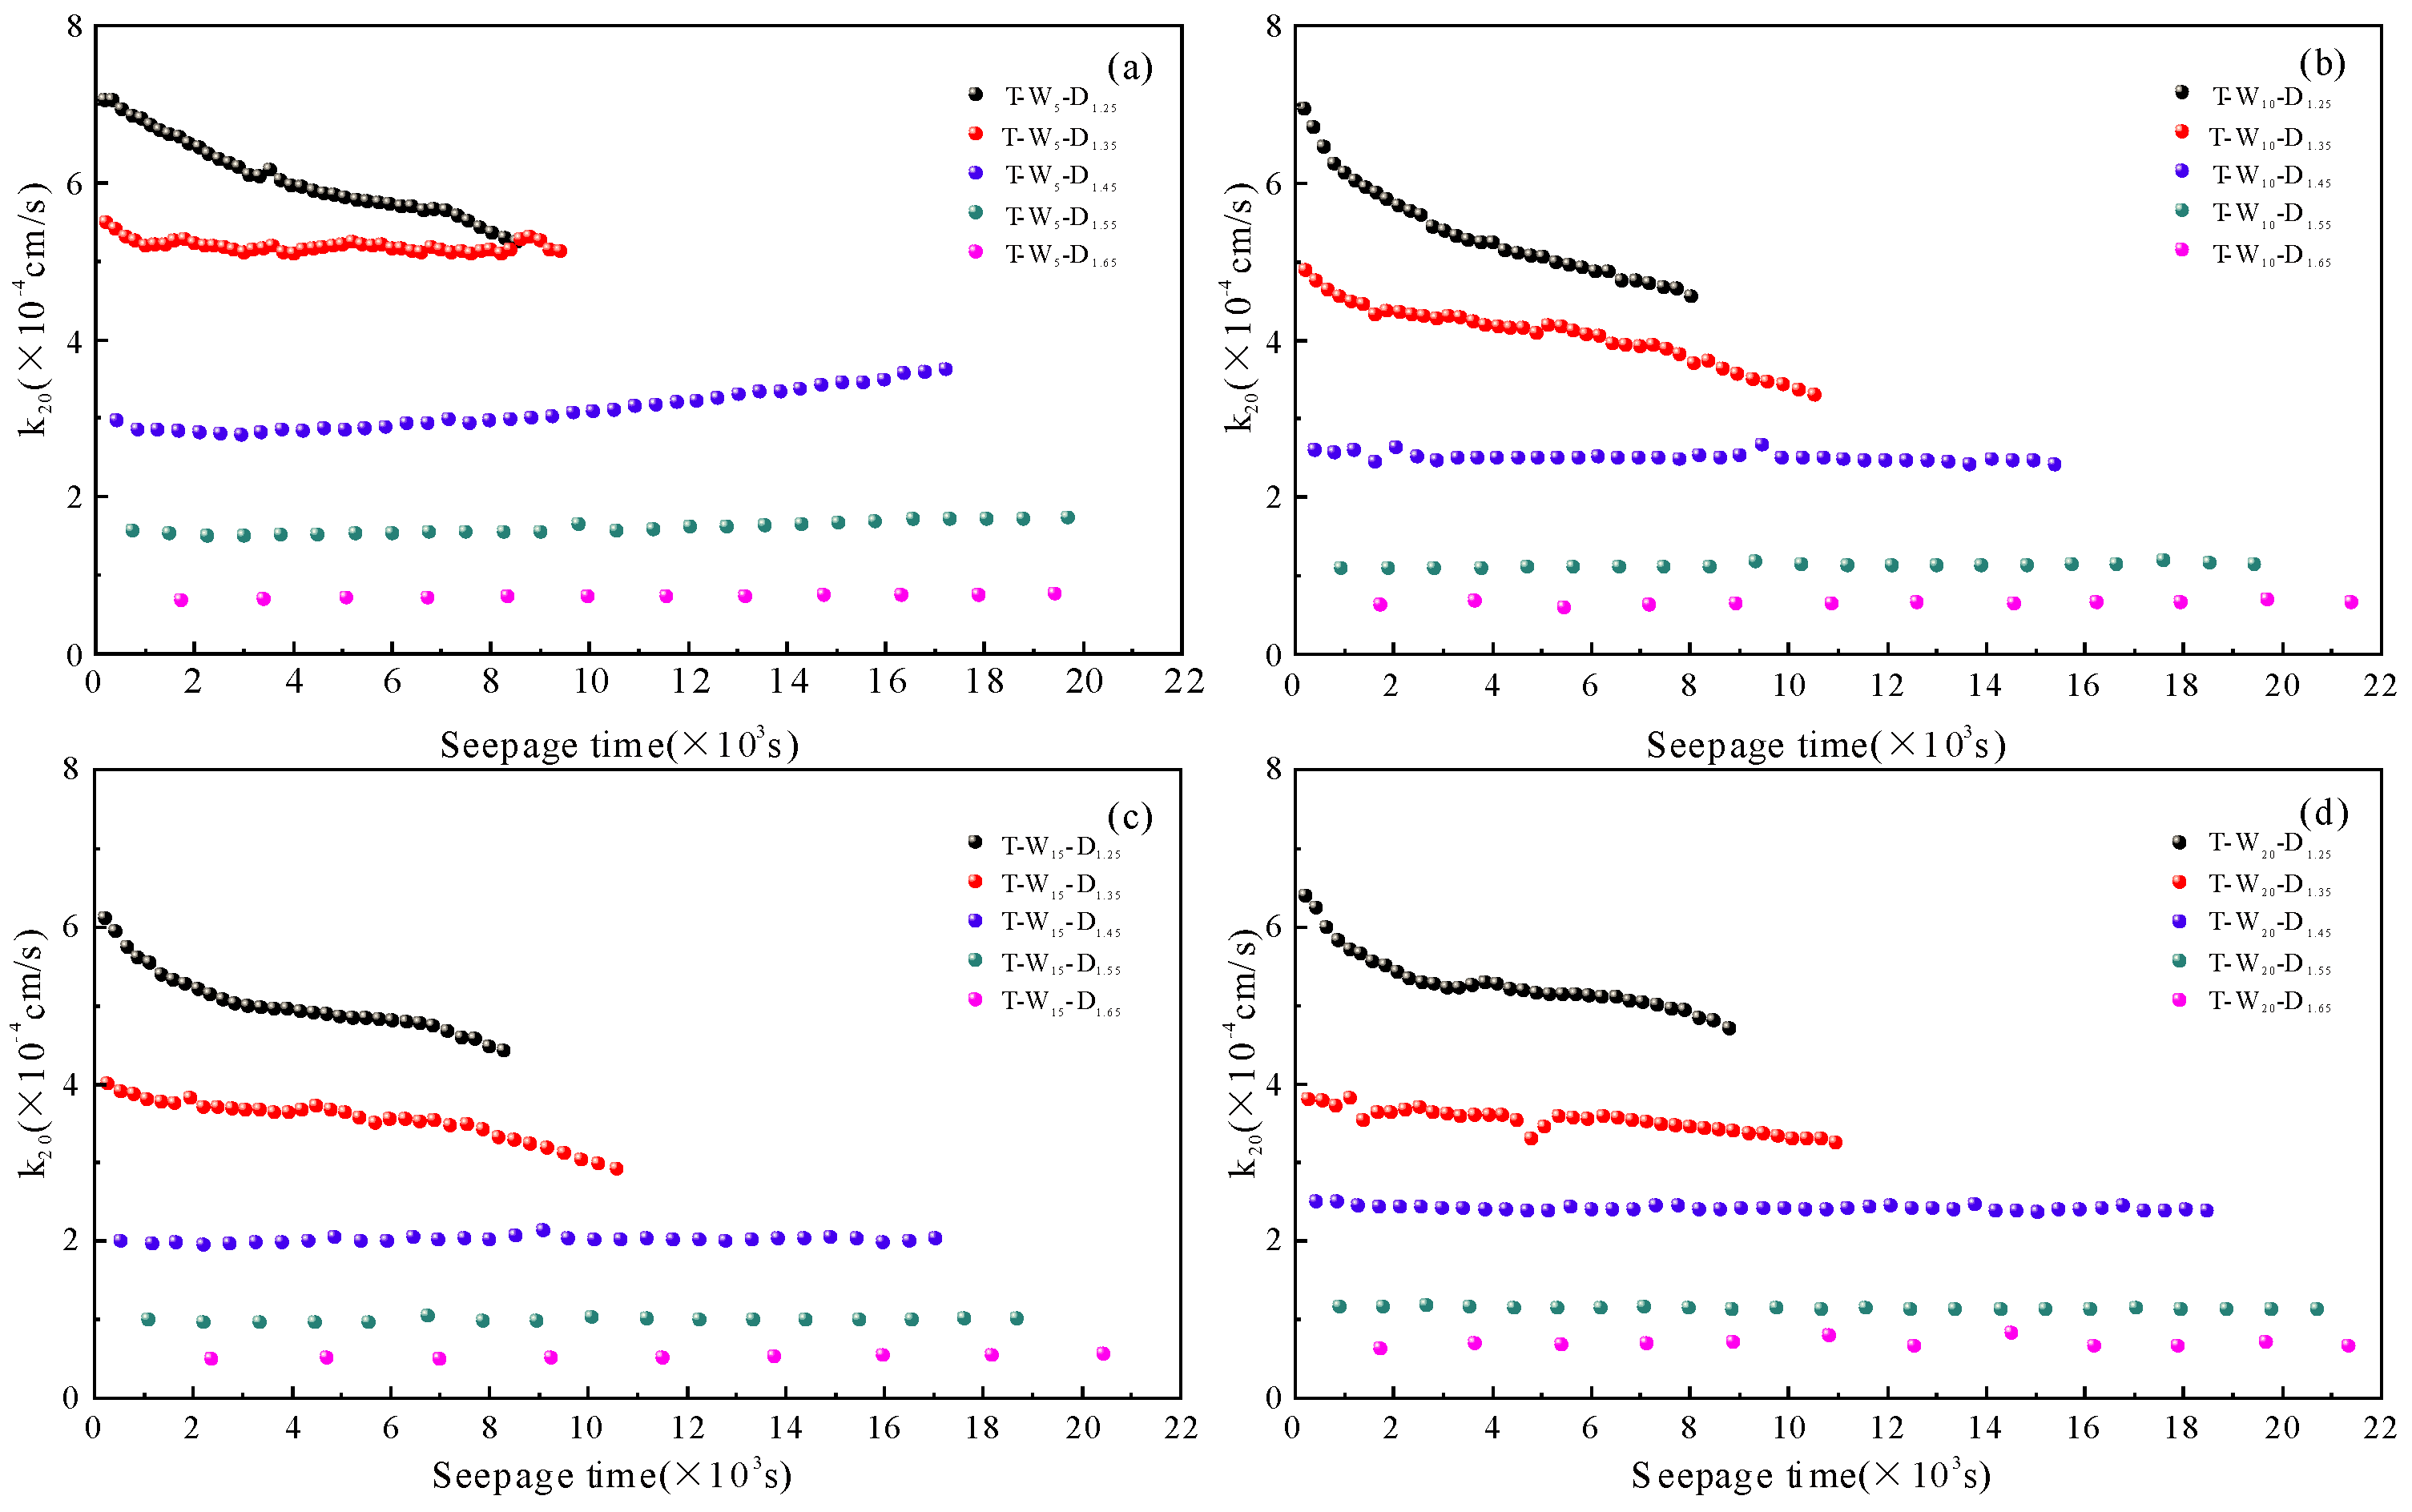
(1) Permeability Coefficient of Samples with Different Initial Water Content and Dry Density Conditions
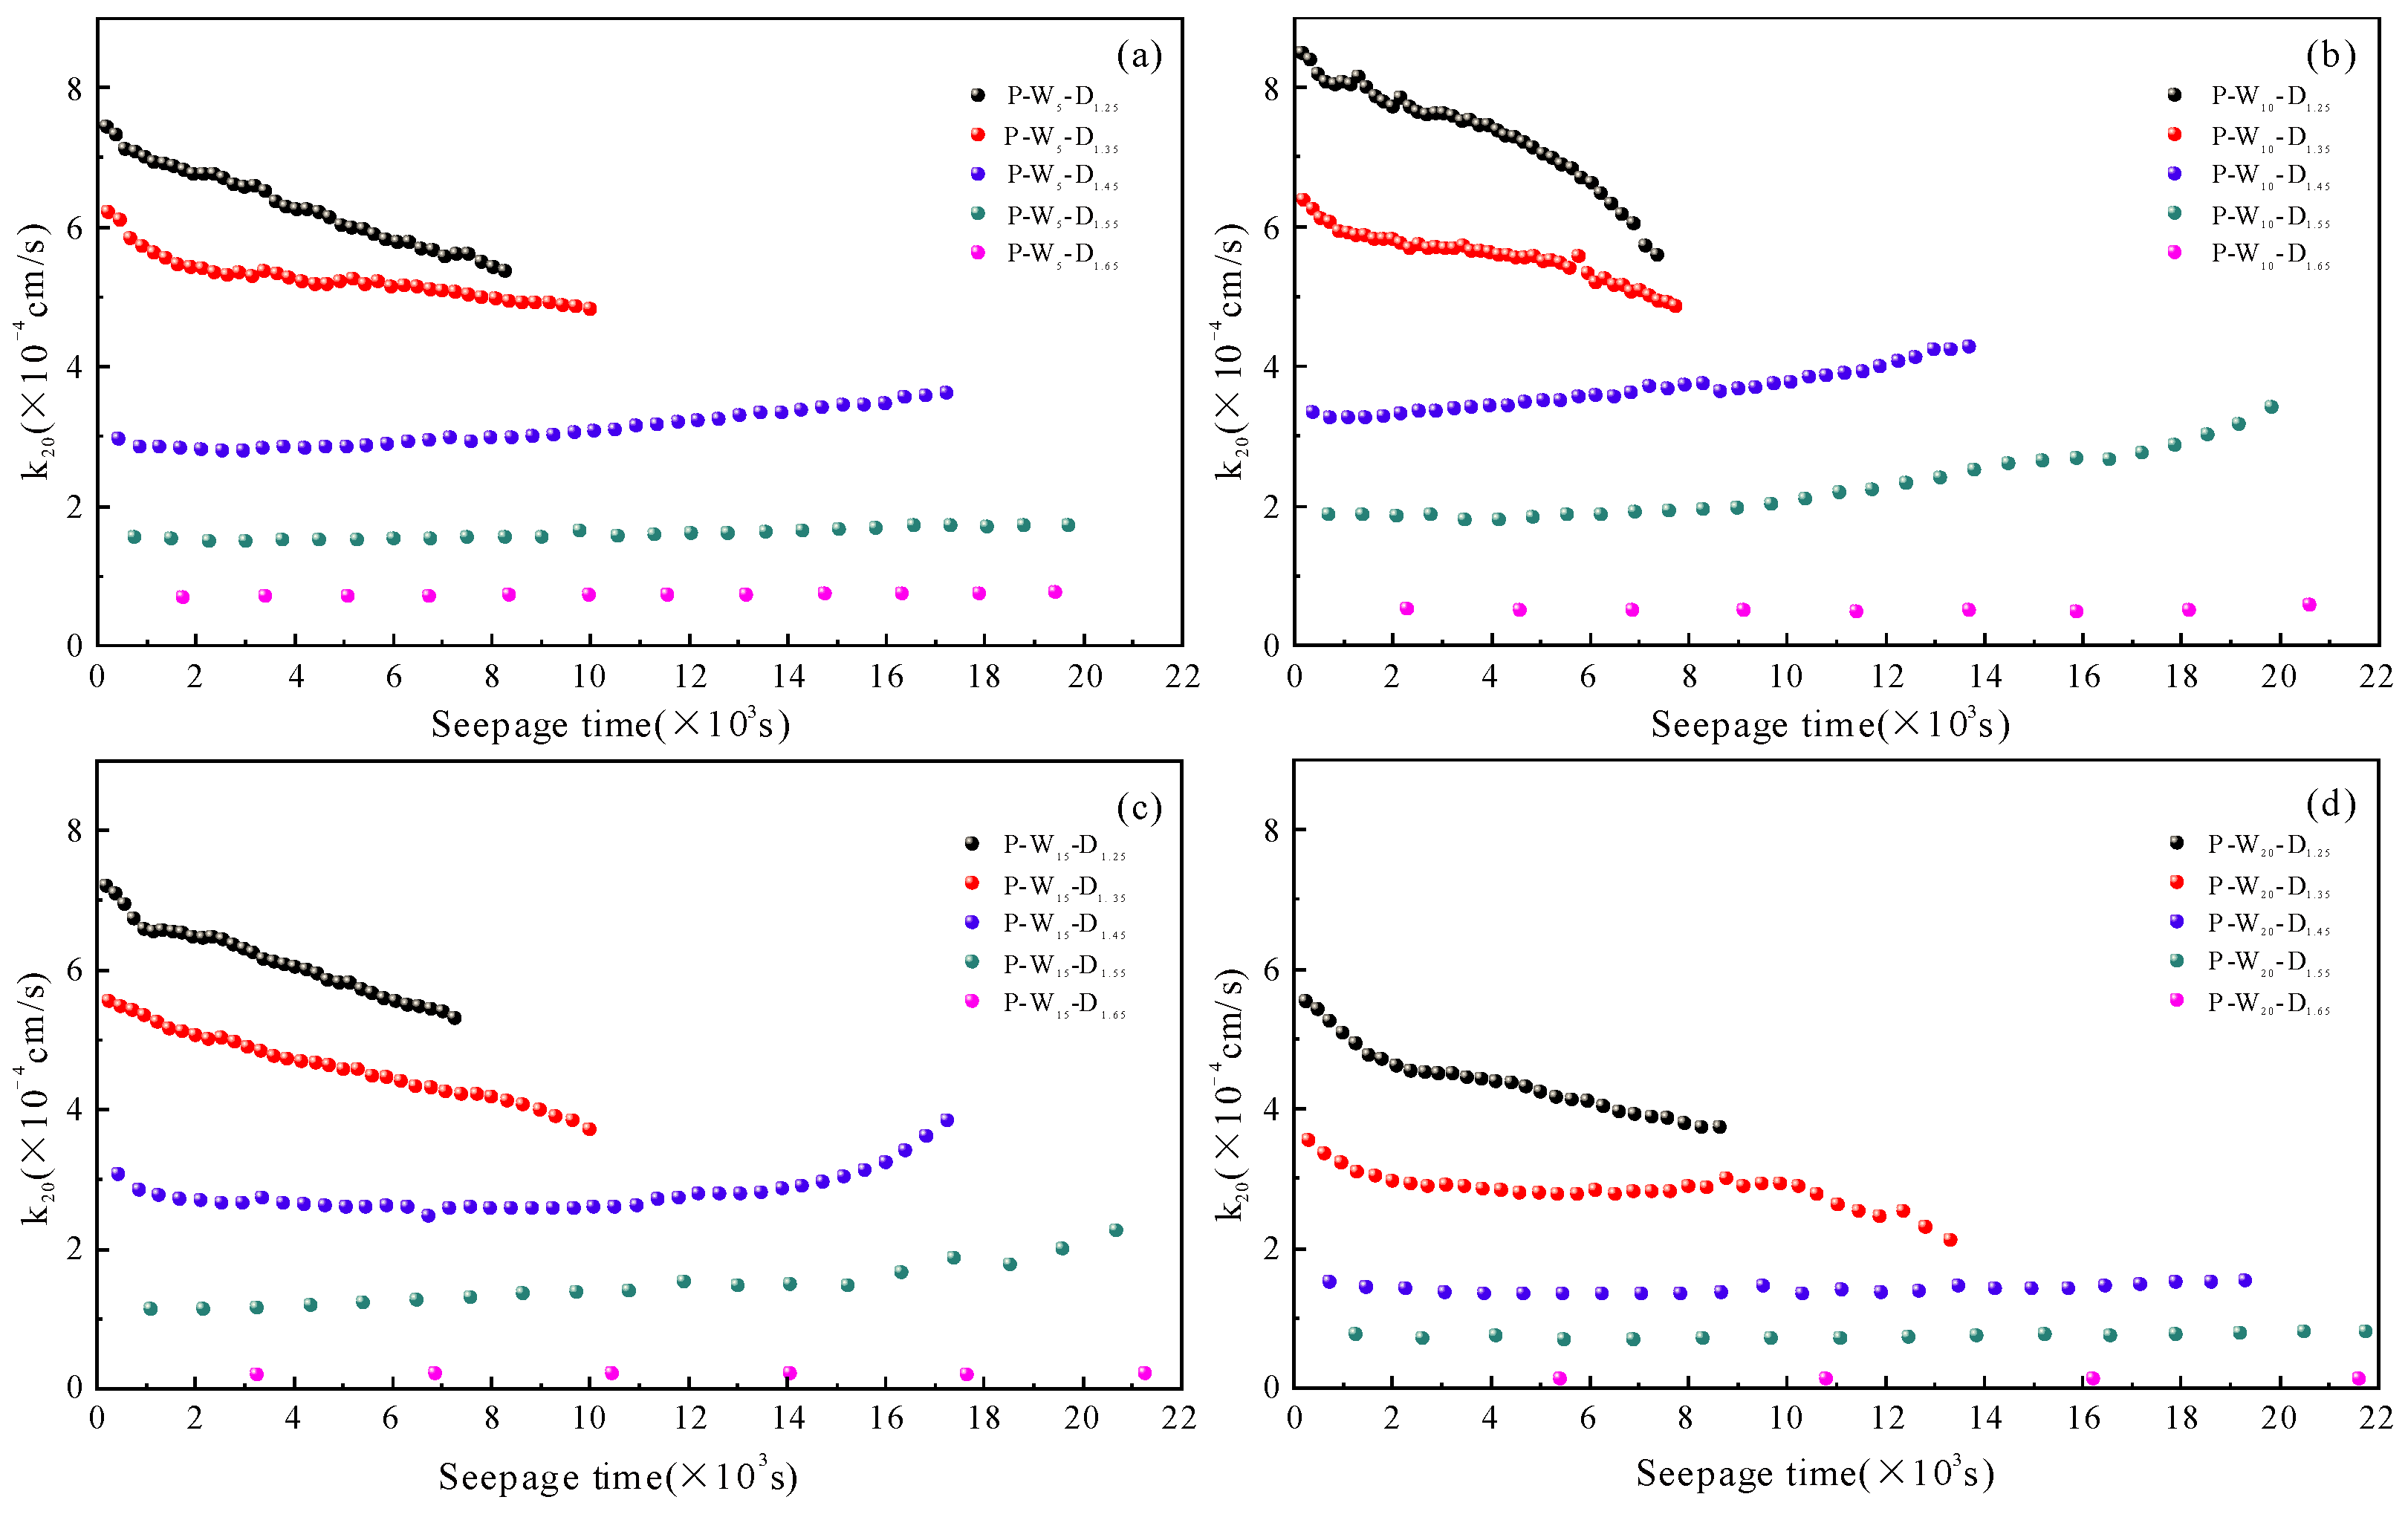
The variation of permeability coefficient over time for the samples prepared using the pre-wetting method is depicted in Figure 4. The results indicate that increasing the dry density reduces the permeability coefficient of the samples, and the trend of changes in the permeability coefficient with seepage time varies among different samples. For samples with low compaction degree and loose particle structure at dry density of 1.25 g/cm3 and 1.35 g/cm3, the permeability coefficient decreases continuously with an increase in seepage time, and the decrease is more significant at lower dry density. Conversely, for samples with dry density of 1.45 g/cm3, 1.55 g/cm3, and 1.65 g/cm3, the permeability coefficient is relatively small and remains stable. In some cases, the permeability coefficient slightly increases within a small range with an increase in seepage time, and this phenomenon is most evident at water contents of 10% and 15%. Samples with different dry density exhibit two types of changes in permeability coefficient over seepage time: a decrease for lower dry density and an increase for higher dry density. When the dry density is constant, the permeability coefficient decreases as the initial water content increases, and this effect is most pronounced at lower dry density. Furthermore, as the dry density increases, the extent of permeability decrease becomes weaker.
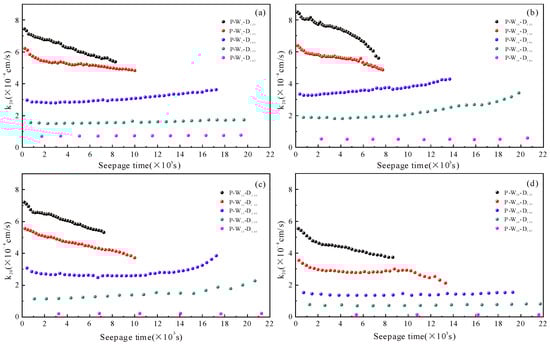
Figure 4.
Variation in Permeability Coefficient of Samples with Different Dry Density under Pre-Wetting Method over seepage Time. (a) 5% moisture content; (b) 10% moisture content; (c) 15% moisture content; (d) 20% moisture content.
(2) Electrical Conductivity of Samples with Different Initial Water Content and Dry Density Conditions
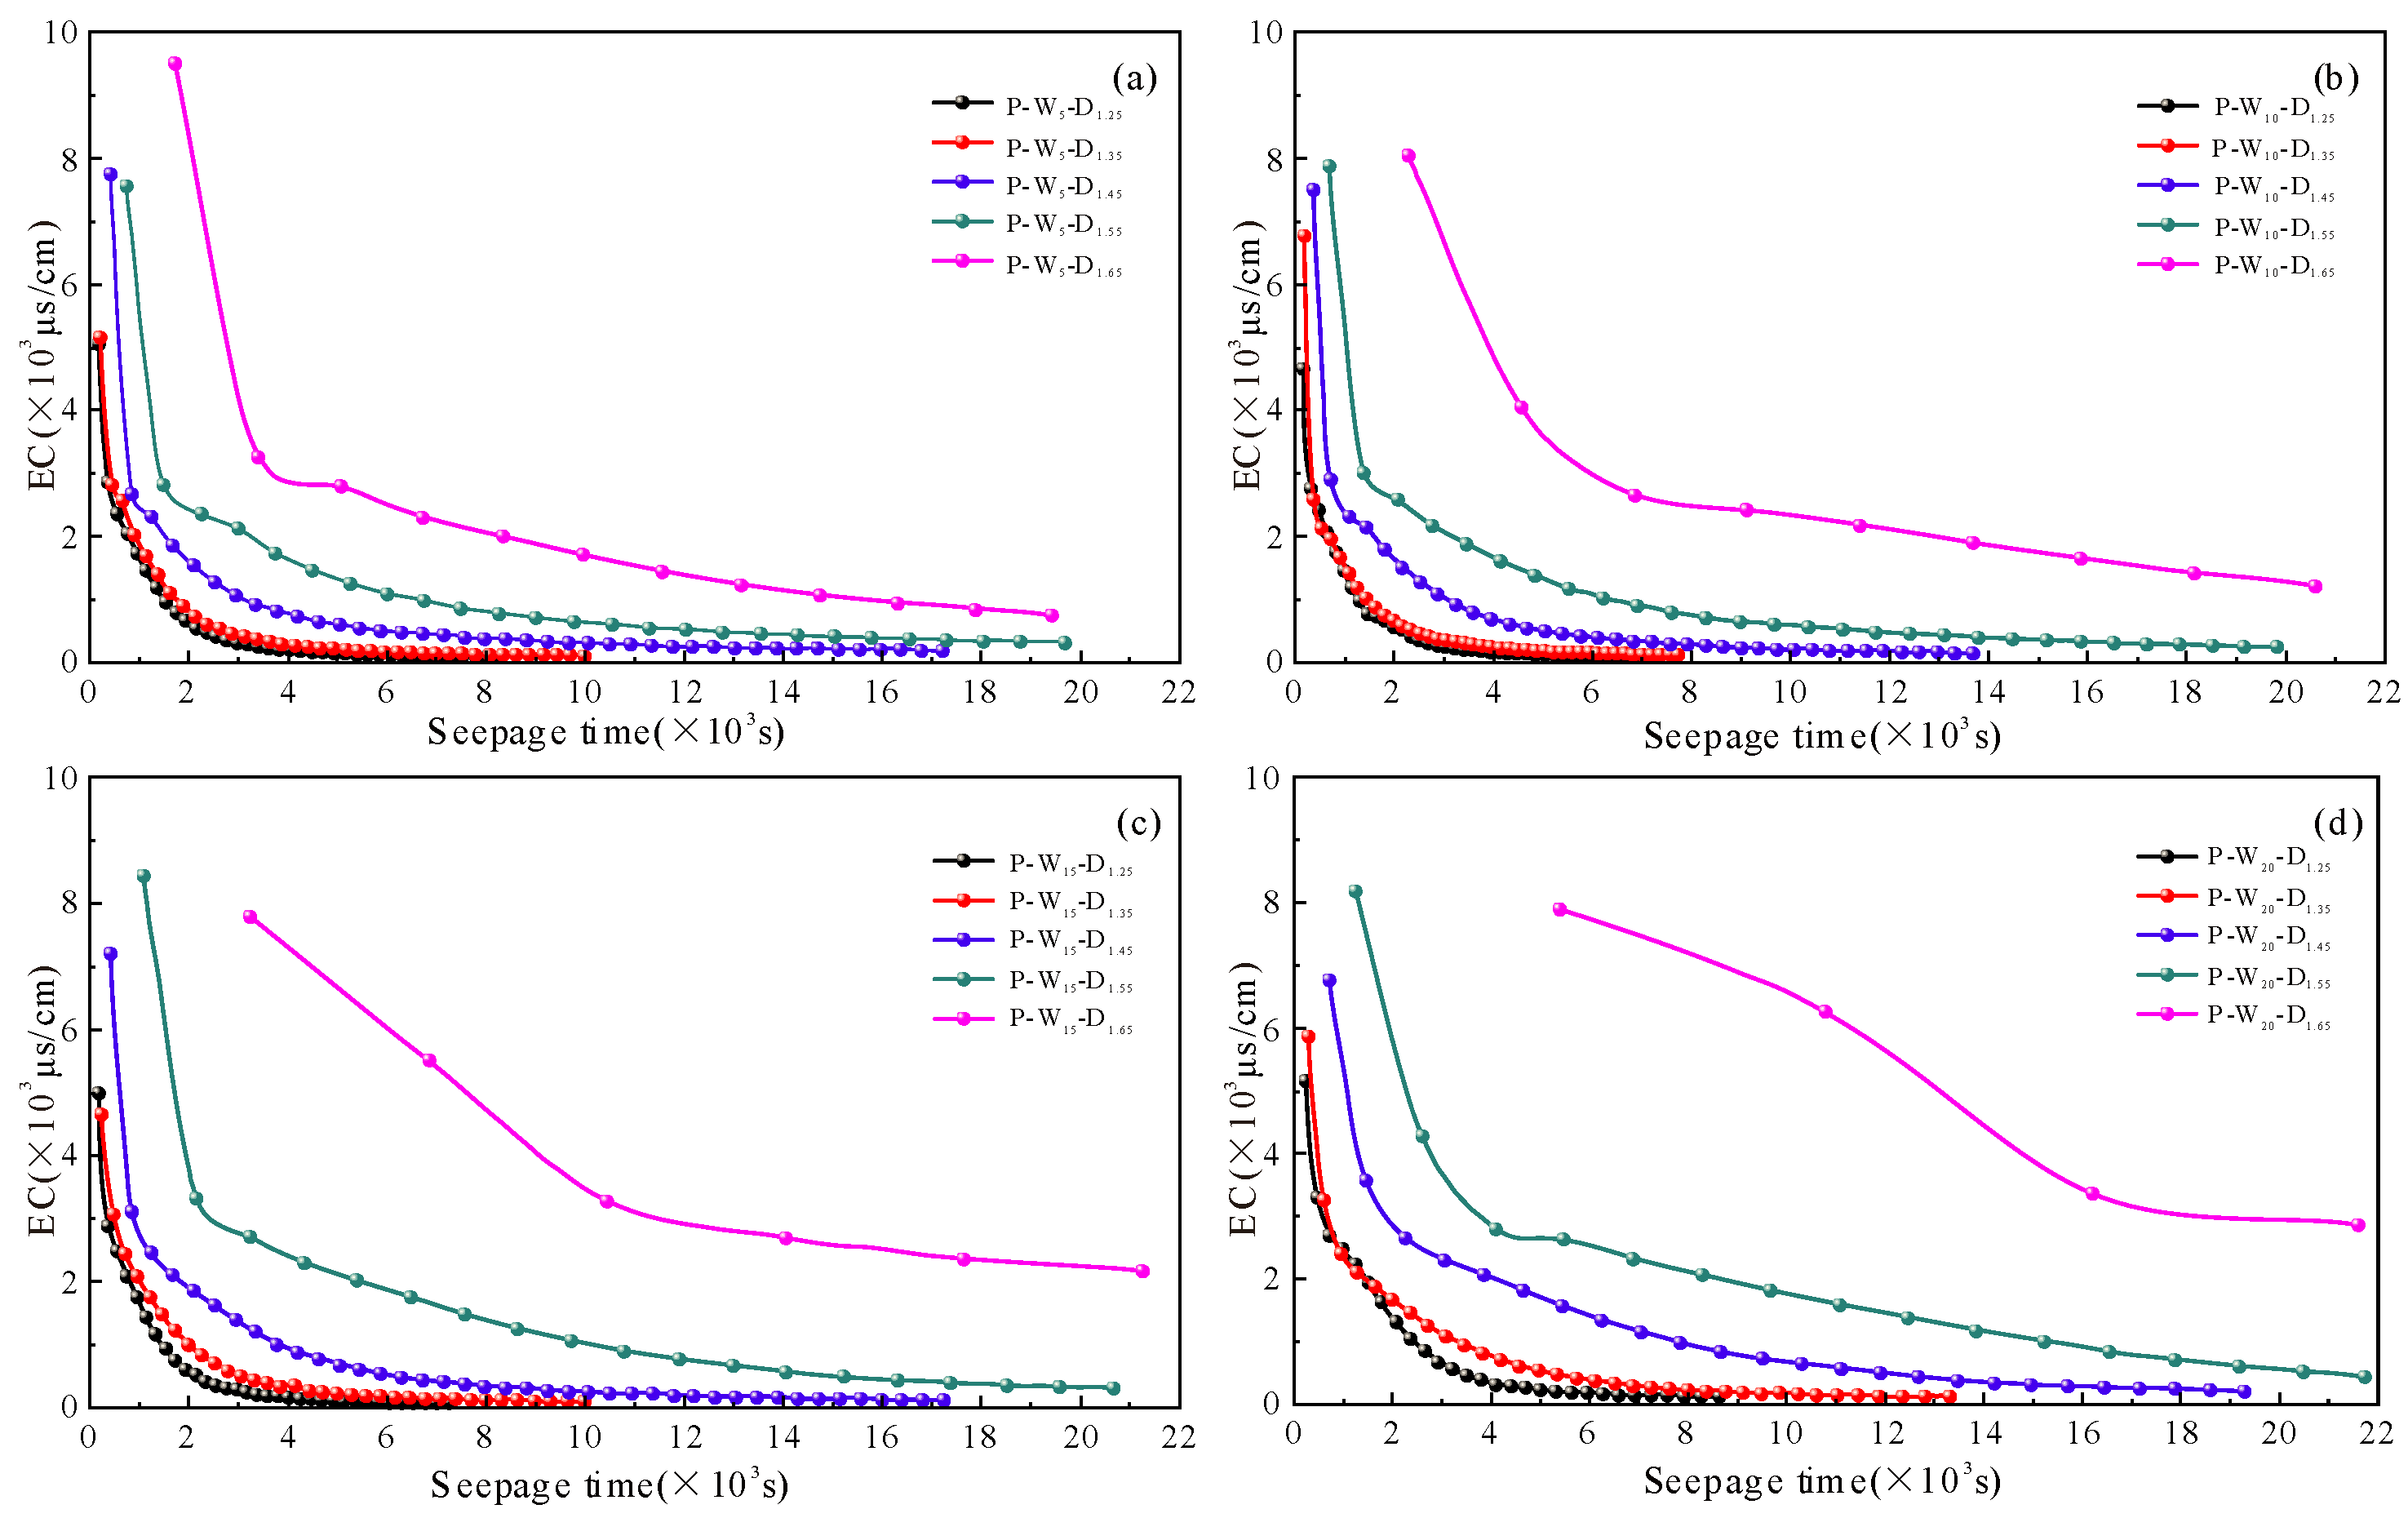
The presence of salt in soil can significantly affect the pore structure, which in turn impacts its permeability [47]. During experiments, the EC value is a sensitive indicator of changes in salt solution concentration [52]. Figure 5 illustrates the electrical conductivity changes of the leachate from each sample as a function of seepage time at various water contents ranging from 5% to 20%. The change in EC values can provide a qualitative analysis of the transport of soluble salts in soil with moisture.
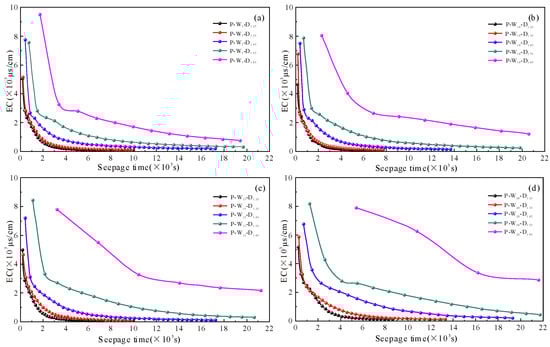
Figure 5.
Variation in Electrical Conductivity of Samples with Different Dry Density under Pre-wetting Method over seepage Time. (a) 5% moisture content; (b) 10% moisture content; (c) 15% moisture content; (d) 20% moisture content.
The exudation rate of soluble salts in the sample is fastest with a dry density of 1.25 g/cm3, and the exudation rate of soluble salts decreases continuously with increasing dry density. The peak electrical conductivity of different samples occurs at the beginning of the experiment, with higher dry density and lower water contents resulting in higher peak electrical conductivities. Generally, the initial electrical conductivity values range between 6 × 10³ μs/cm and 8 × 10³ μs/cm when the salt content in the samples is highest. As the seepage time increases, the flowing liquid continuously carries salt out of the pores of the samples. The trend of electrical conductivity changes in different samples is roughly similar, except for the time it takes for the curve to reach a horizontal value. When the dry density is low, the sample porosity is high, distilled water flows rapidly through the pores, and the rate of salt leaching is high, causing a rapid decrease in leachate electrical conductivity. In contrast, when the dry density is high, the pore size of the sample is smaller, and the rate of salt leaching is slower, resulting in a relatively slower change in electrical conductivity of the leachate. Water content has a weaker influence on the change in electrical conductivity of samples with low dry density, but a stronger influence on samples with high dry density.
3.2. Permeability Test Results of Remolded Loess under Transfer Wetting Method
(1) Permeability Coefficient of Samples with Different Initial Water Content and Dry Density Conditions
The permeability coefficient of samples under different dry density with the transfer wetting method is illustrated in Figure 6. The results demonstrate that the permeability coefficient decreases as the dry density increases under the same water content. Specifically, higher dry density corresponds to lower permeability coefficients. In general, the permeability coefficient of samples under the transfer wetting method exhibits two trends over time. For samples with low dry density (1.25 g/cm3 and 1.35 g/cm3), the permeability coefficient shows a continuous decreasing trend with seepage time. However, this trend is less pronounced compared to that observed in the pre-wetting method. As the dry density increases from 1.45 g/cm3 to 1.65 g/cm3, the degree of decrease in the permeability coefficient also decreases, indicating that the decrease in permeability coefficient with increasing dry density is not linear. For samples with dry density greater than 1.45 g/cm3, the permeability coefficient changes only within a very small range during seepage. Additionally, for samples with a water content of 5%, the permeability coefficient slightly increases with seepage time, while for samples with other water contents, the curve showing the relationship between the permeability coefficient and time is approximately horizontal.
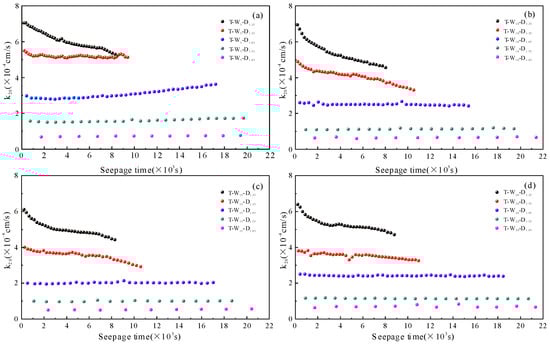
Figure 6.
Variation in Permeability Coefficient of Samples with Different Dry Density under Transfer wetting method over seepage Time. (a) 5% moisture content; (b) 10% moisture content; (c) 15% moisture content; (d) 20% moisture content.
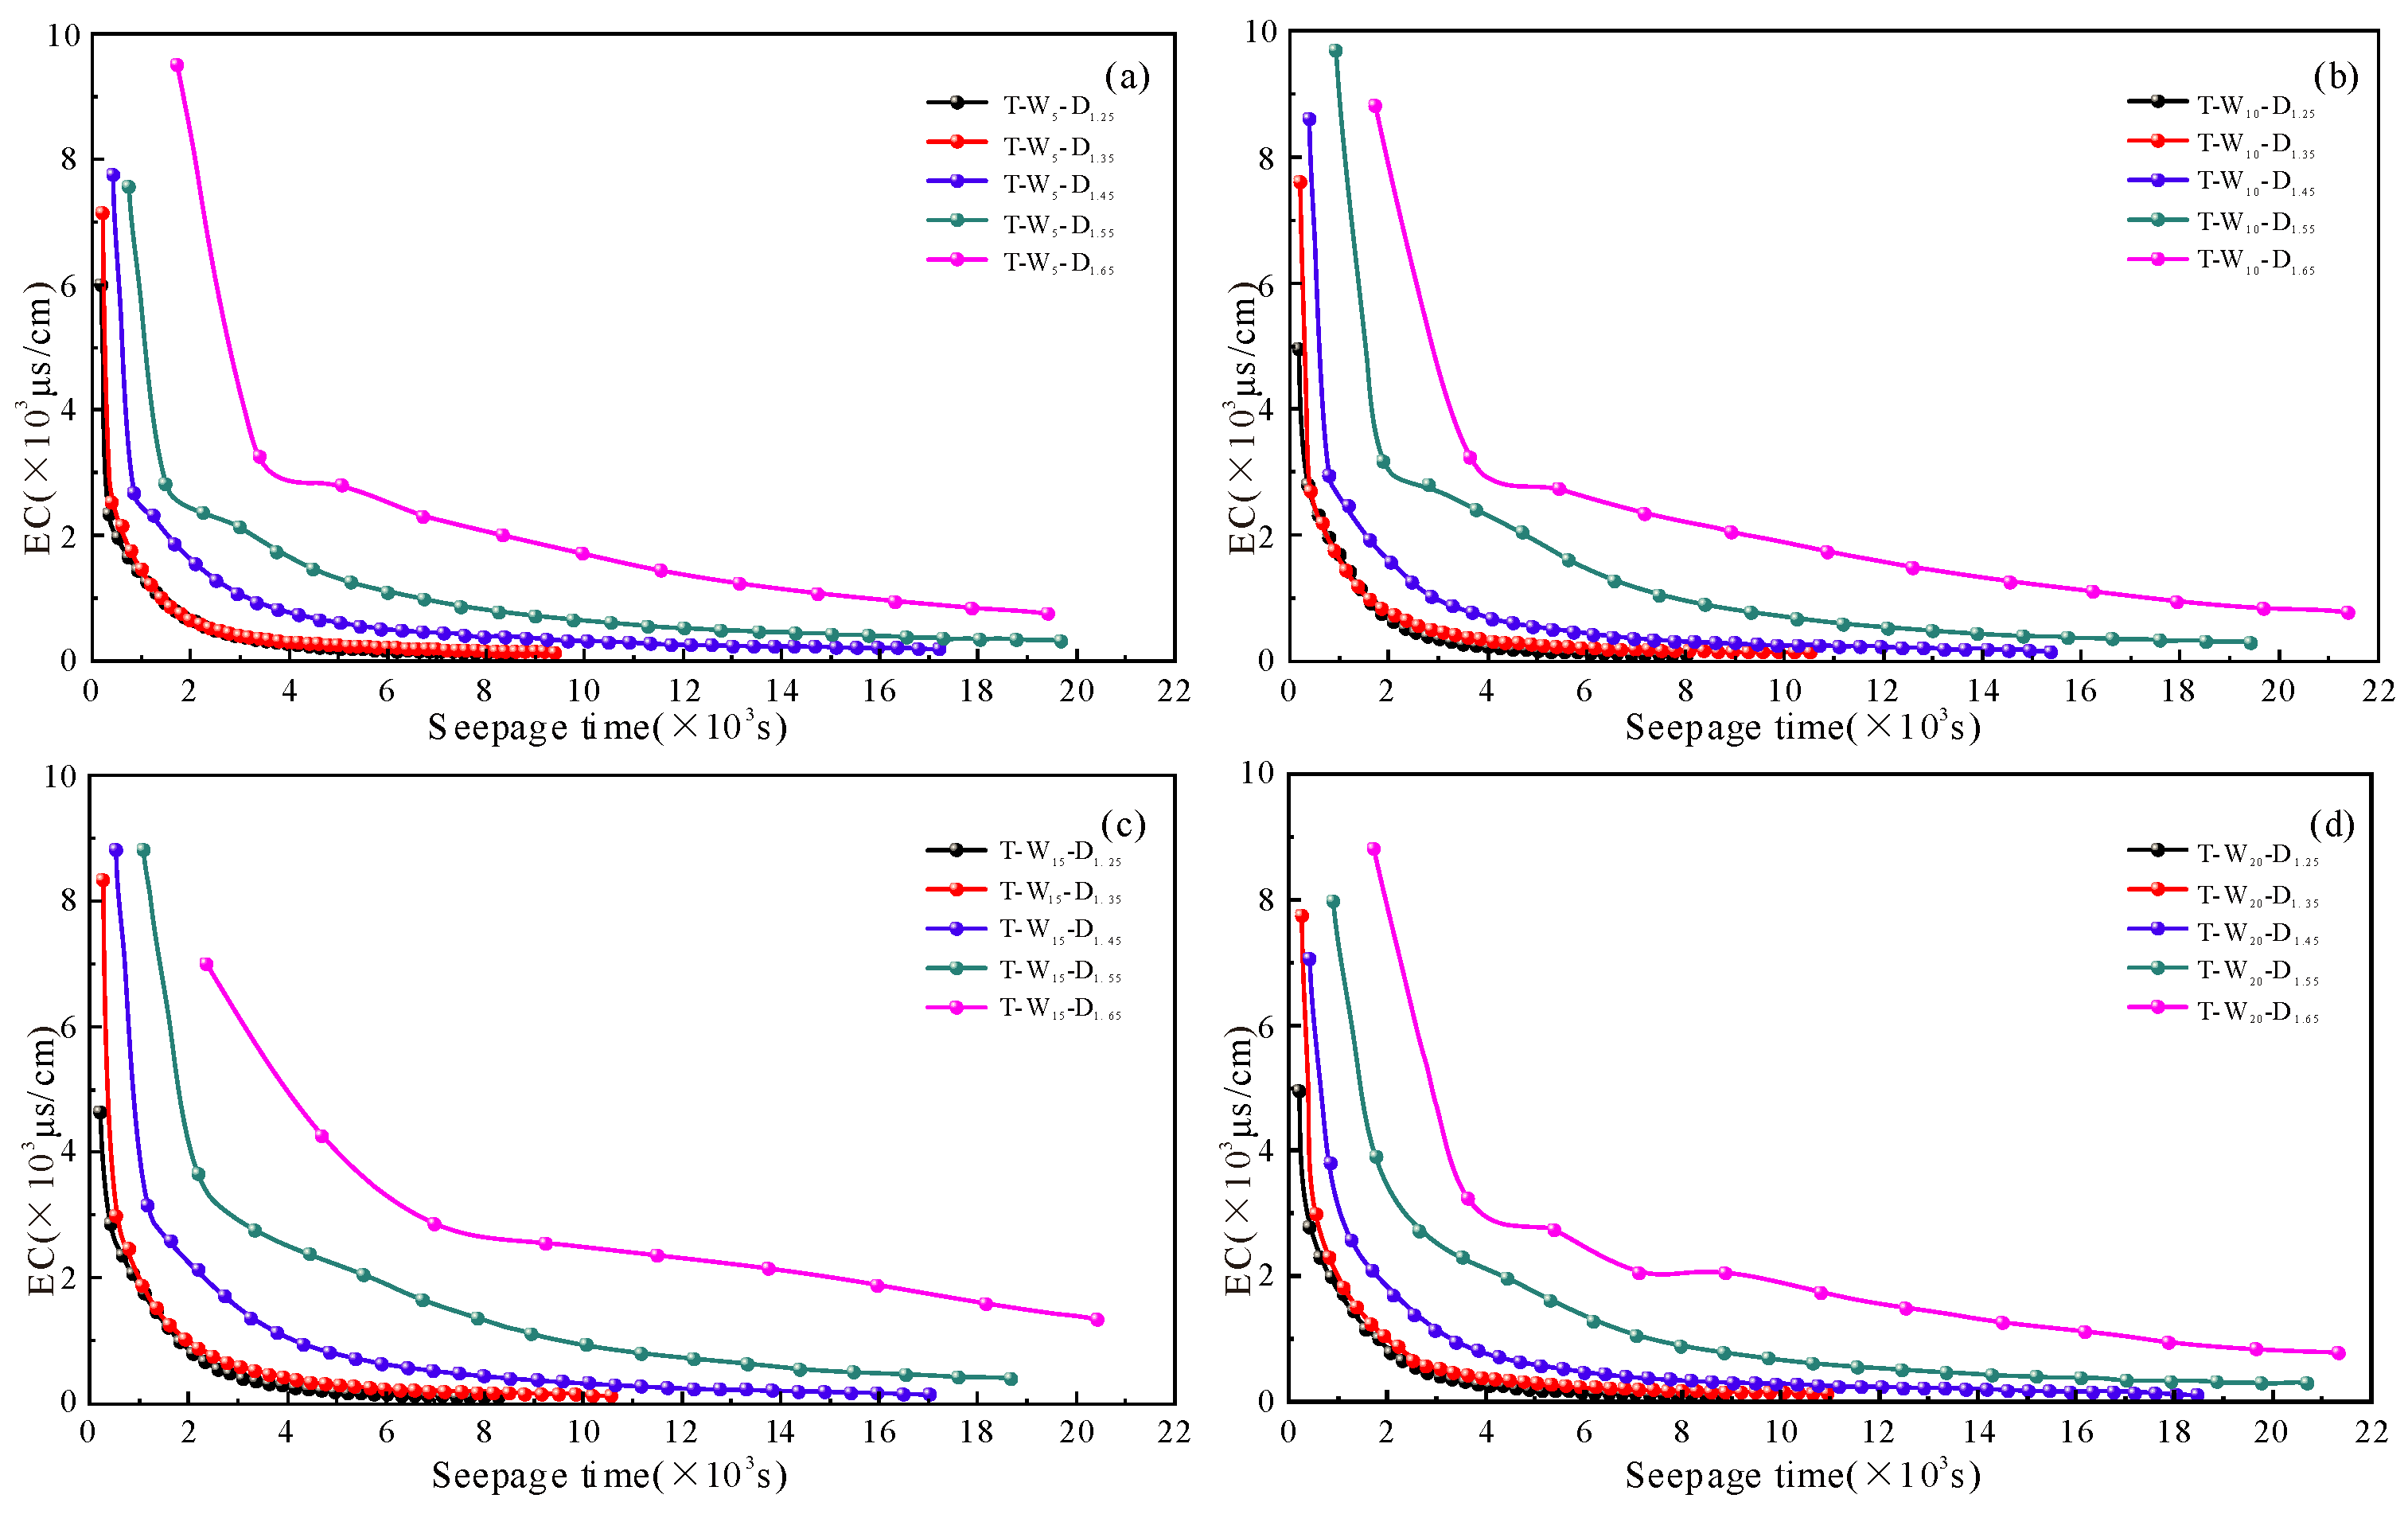
(2) Electrical Conductivity of Samples with Different Initial Water Content and Dry Density Conditions
Figure 7 illustrates the changes in conductivity under the transfer wetting method. The results show that at the beginning of the experiment, the conductivity value was approximately 8 × 10³ μs/cm, which was when the sample had the highest salt accumulation. Despite differences in the degree of curve bending, the trend of conductivity variation for each sample produced by the transfer wetting method was consistent. The lower the dry density, the less the soil mass per unit volume, and the lower the salt content in the soil. The corresponding peak conductivity is low. As the volume of pores in the sample increased, liquid flow became easier, resulting in faster changes in effluent conductivity, exhibiting a steep drop in conductivity over time and ultimately stabilizing at a lower conductivity value. With an increase in sample dry density, the porosity decreased, resulting in an increase in the peak conductivity and a higher bending point on the curve. The rate of salt diffusion into the soil gradually slowed down, leading to a decrease in the rate of decline in effluent conductivity and ultimately stabilizing at a relatively higher conductivity value. There was almost no difference in the conductivity variations at different levels of water content, indicating that the change in conductivity is more influenced by dry density than by water content.
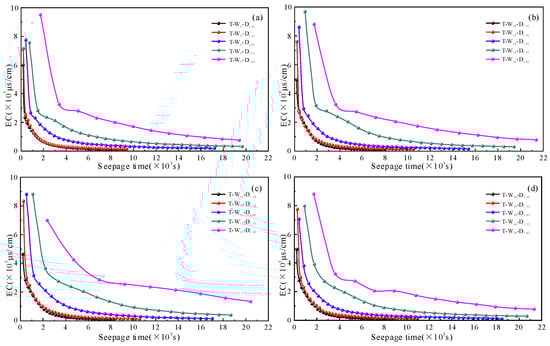
Figure 7.
Variation in Electrical Conductivity of Samples with Different Dry Density under Transfer wetting Method over seepage Time. (a) 5% moisture content; (b) 10% moisture content; (c) 15% moisture content; (d) 20% moisture content.
4. Discussion
4.1. Effect of Dry Density on the Permeability
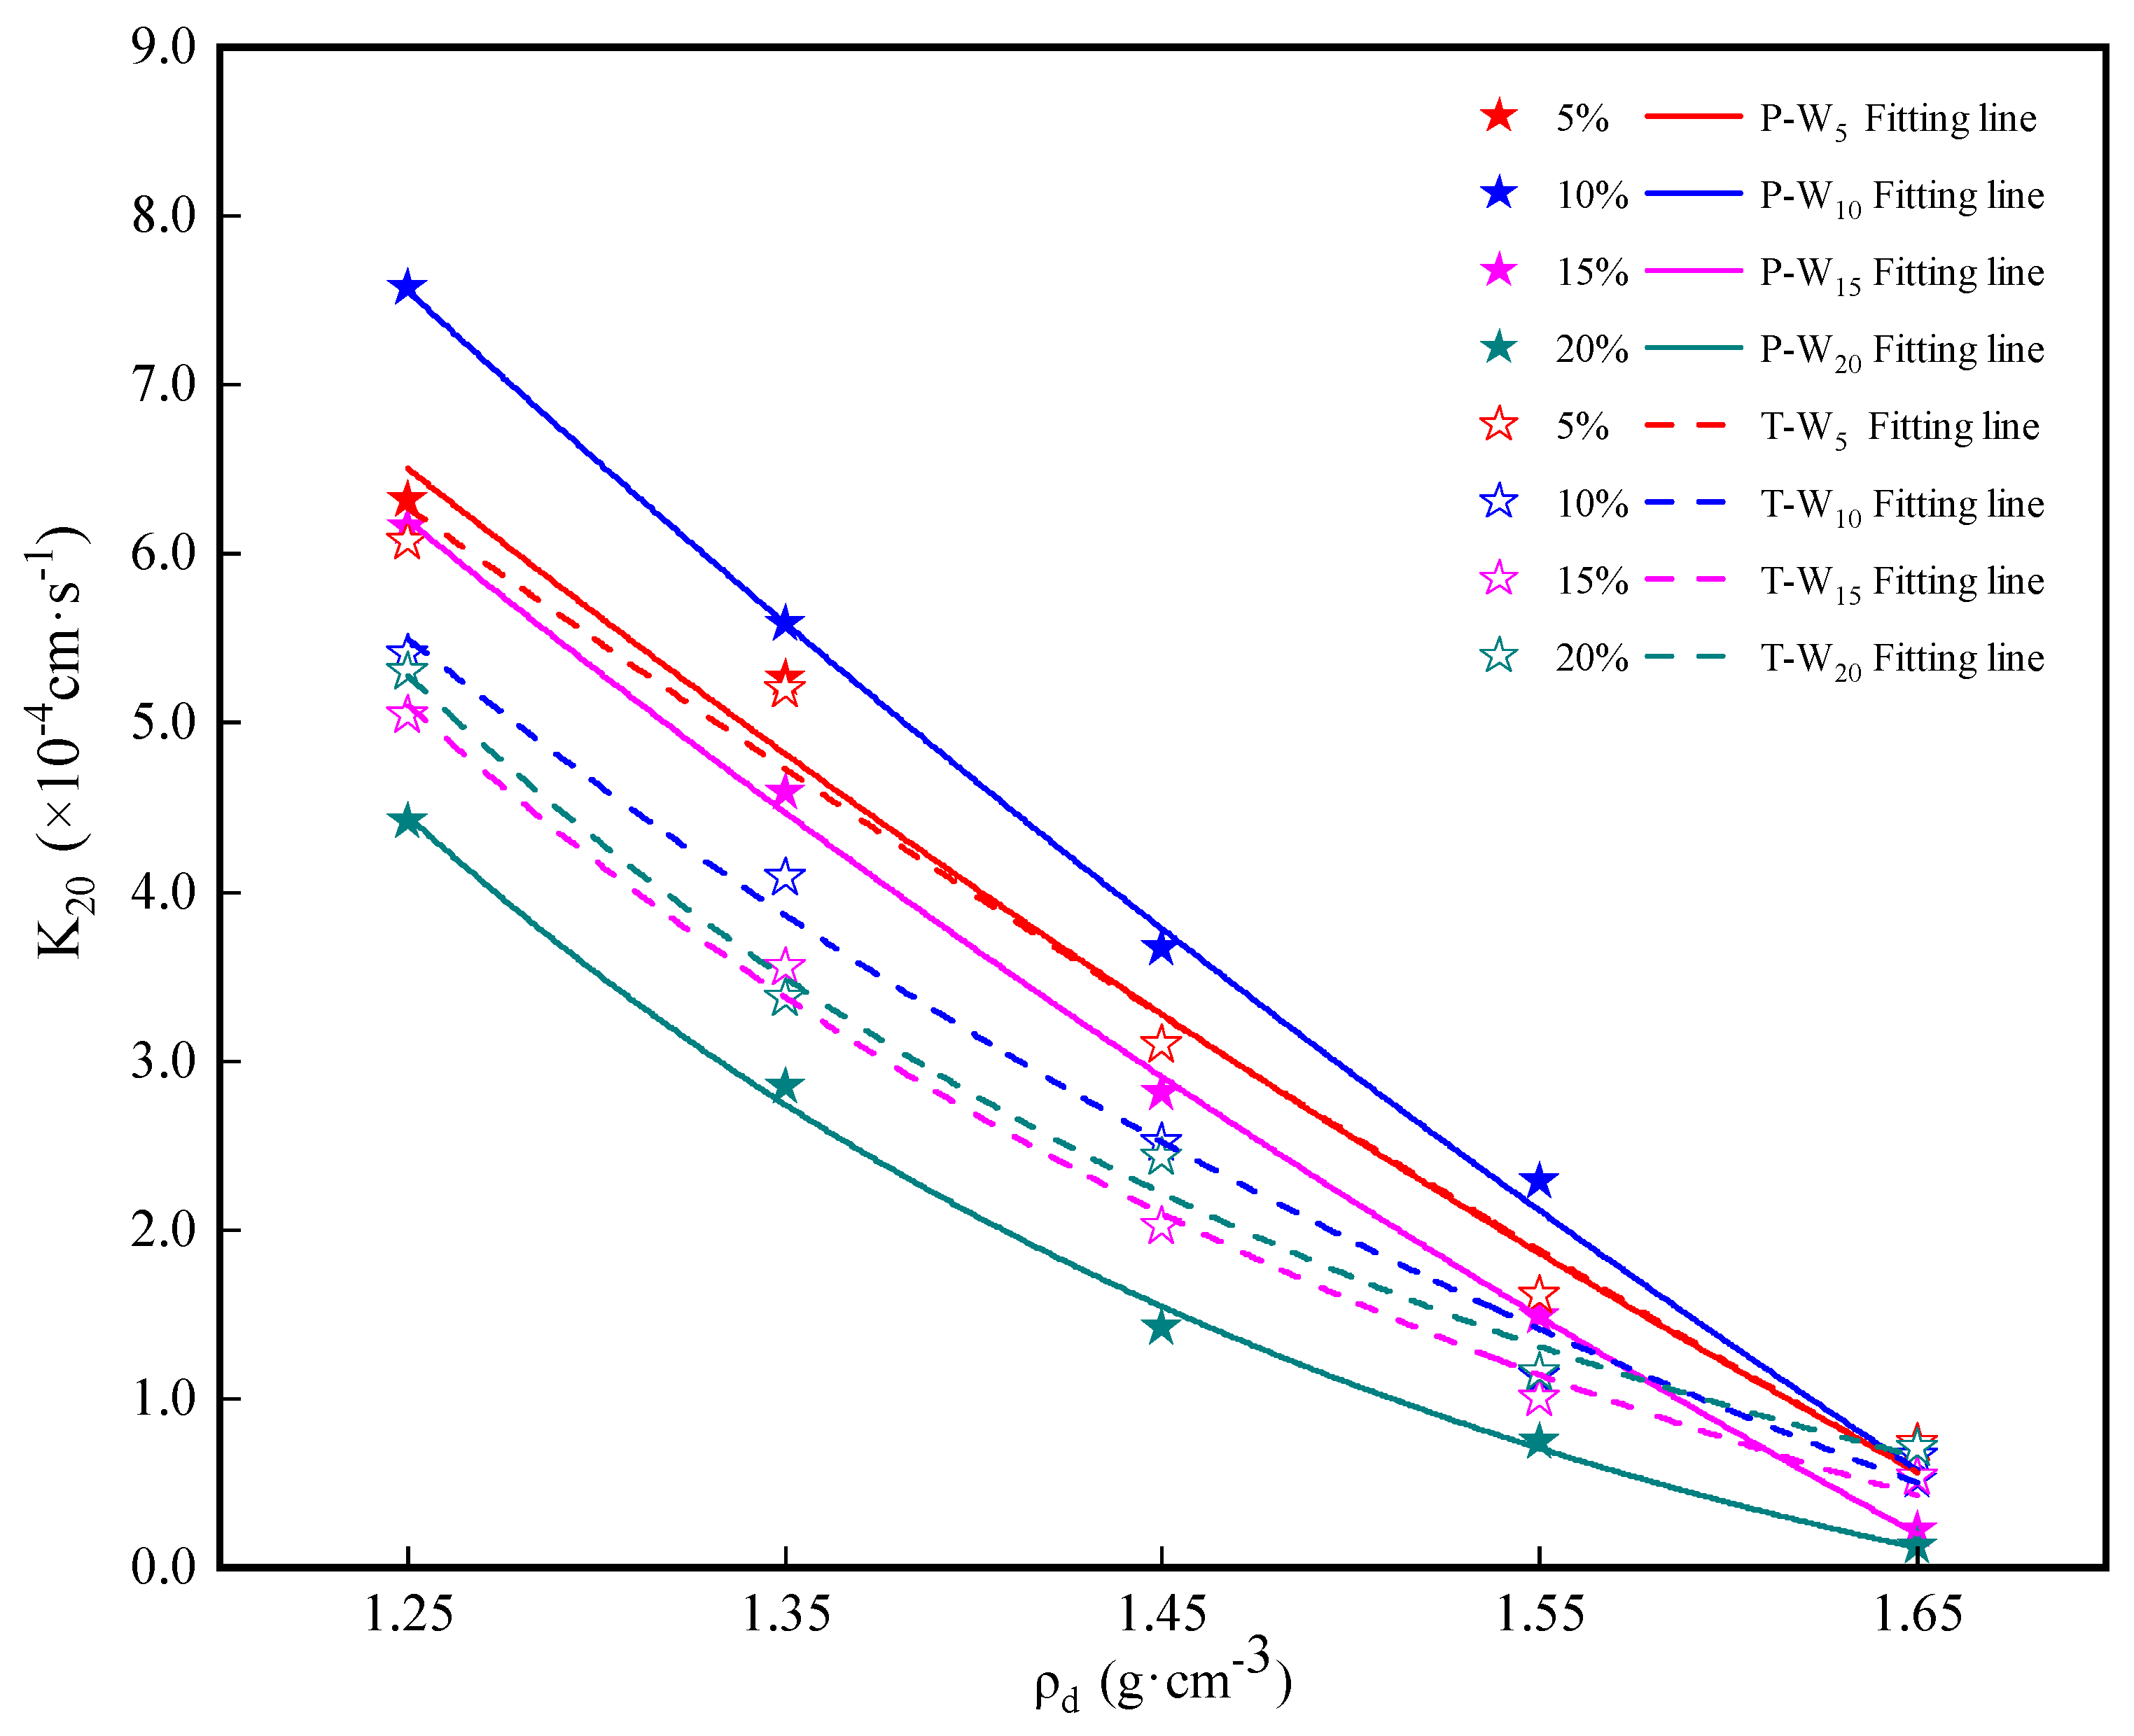
During the seepage, the permeability coefficient of remolded loess undergoes continuous changes. In order to better characterize the relationship between permeability coefficient and dry density of remolded loess, the test results were averaged to obtain the variation characteristics of the permeability coefficient under different sample preparation methods with changes in dry density (Figure 8). The permeability coefficient of remolded loess decreases as the dry density increases, and the decrease in permeability coefficient with increasing dry density is non-linear. The negative exponential function was used to fit the permeability coefficient of remolded loess at various dry density under different water contents, and the fitting results showed that the correlation coefficients were all greater than 0.98. This indicates that the permeability coefficient exhibits a good negative exponential relationship with dry density during the seepage.
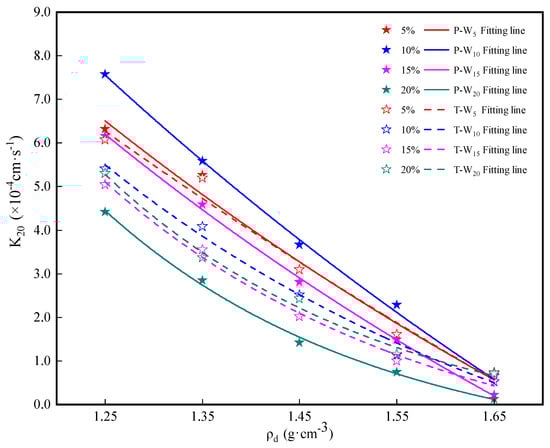
Figure 8.
Permeability coefficient variation with dry density for remolded loess samples prepared using different methods.
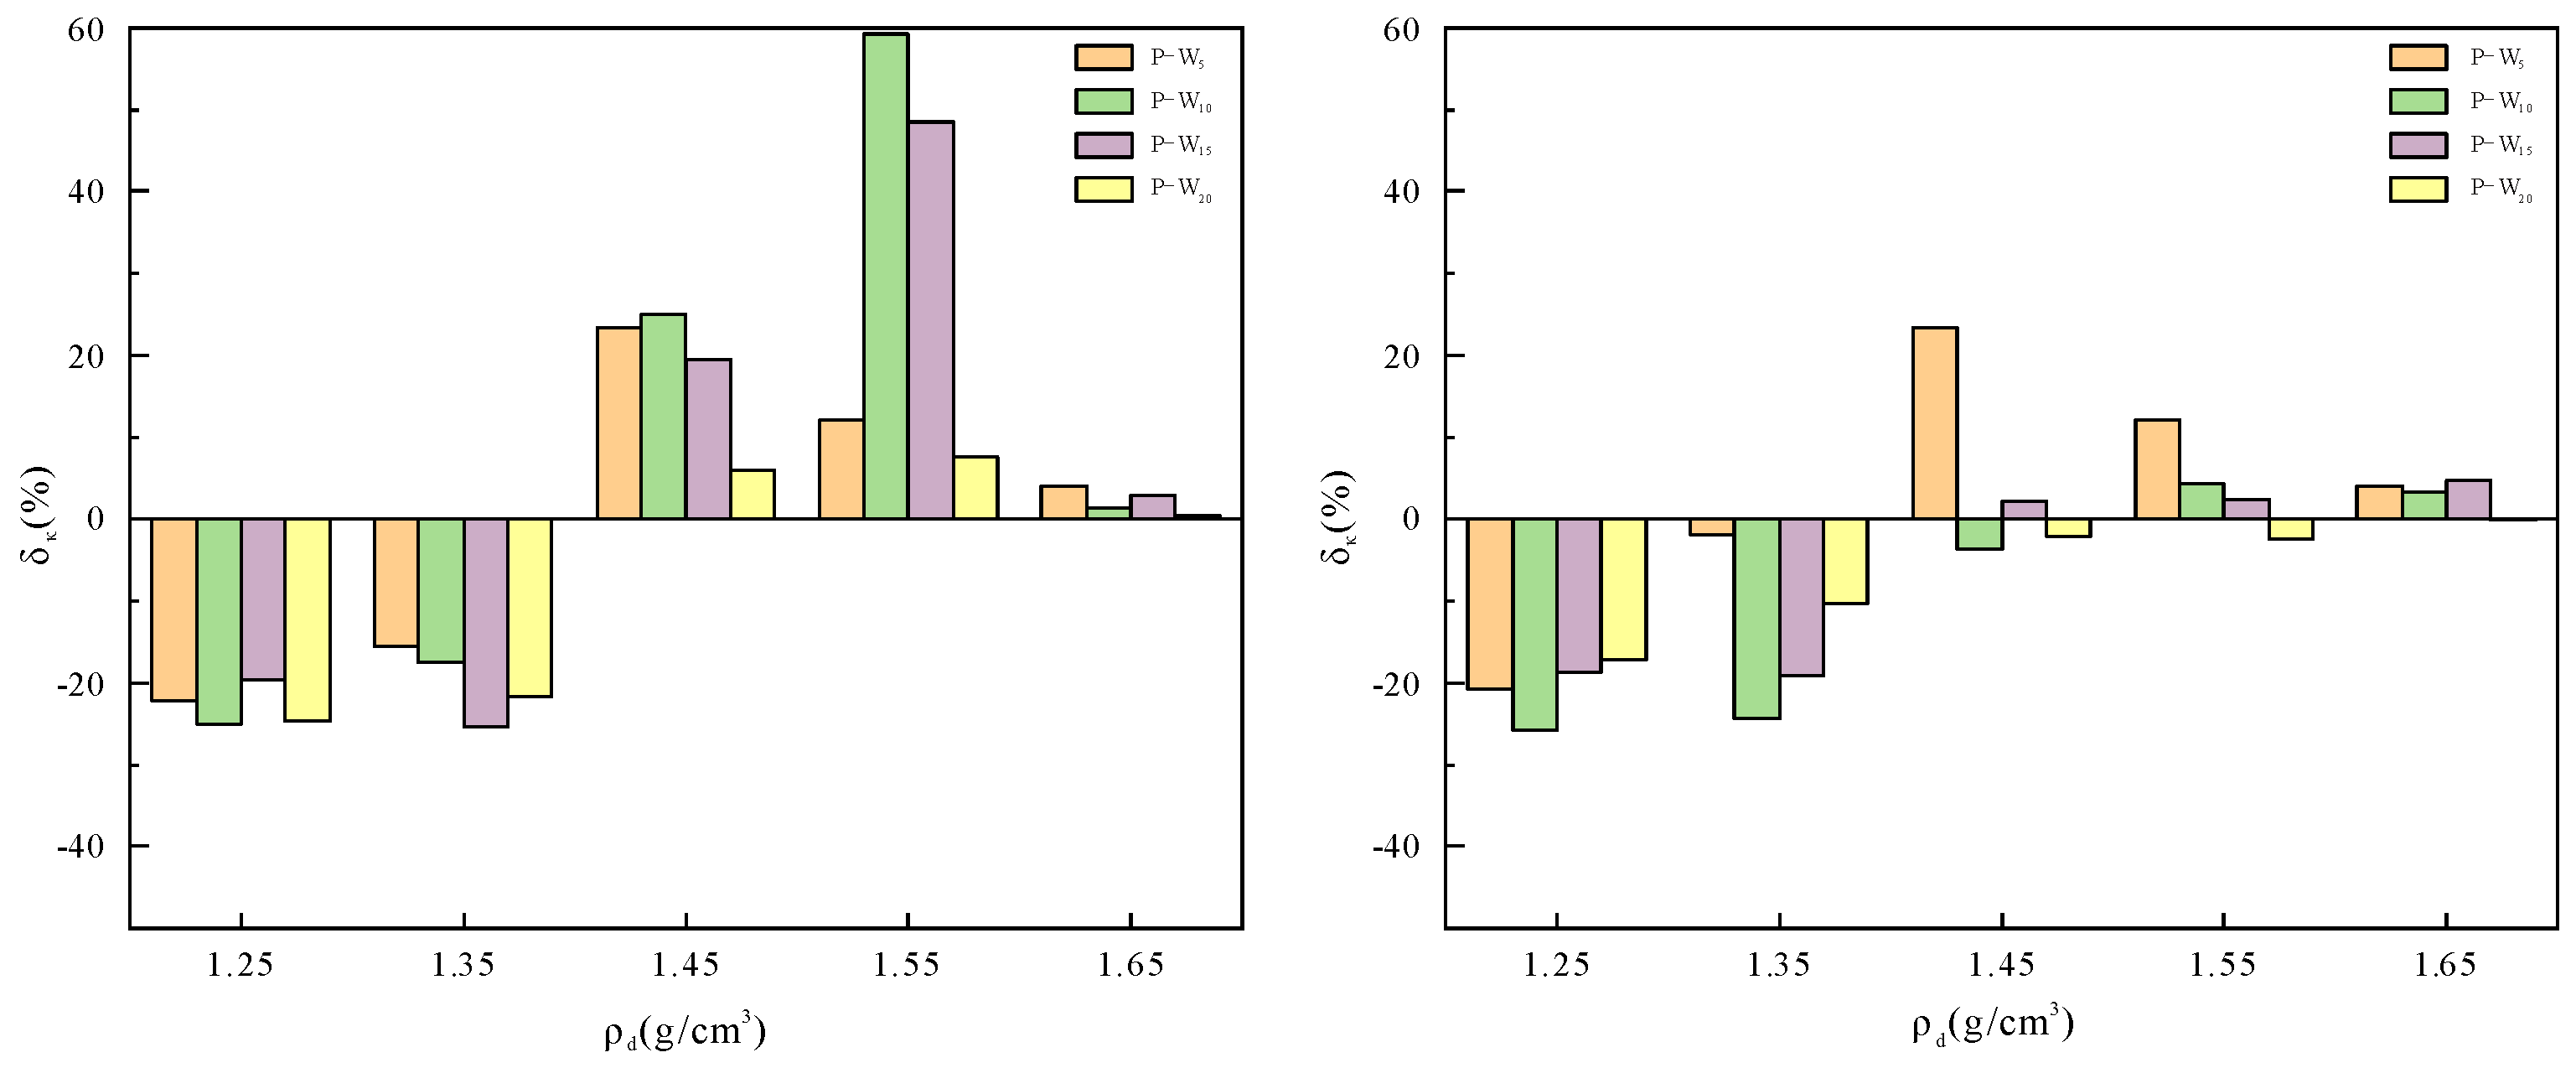
Loess is a material with significant structural performance, and dry density is a commonly used indicator that characterizes the compactness of soil. It is also one of the crucial factors that affect the permeability of compacted loess [53,54]. Dry density can directly reflect the impact of pore structure compactness on permeability as it is fundamentally determined by the particle skeleton structure’s tightness in the soil [55,56]. To quantitatively evaluate the degree of change in permeability coefficient with dry density, the increase in permeability coefficient (ΔK) and the relative increase rate of permeability coefficient δK are calculated using the following formulas:
where ΔK represents the increase in permeability coefficient (cm/s) and δK represents the relative increase rate of permeability coefficient (%). Ki and Ke indicate the initial and final permeability coefficients (cm/s) during the seepage period, respectively.
Based on the analysis of Figure 9, it is evident that when dry density is less than 1.45 g/cm3 under both sample preparation methods, the final permeability coefficient is less than the initial permeability coefficient, with a decrease in permeability coefficient of around 20%. The degree of decrease in permeability coefficient gradually decreased with the increase in dry density. Low dry density samples have a low degree of compaction and a large void ratio. As water flows through the pores of the soil, erosion occurs, which causes the aggregation particles to break into smaller pieces. Fine particles move upward along the direction of flow, forming a structure with a tight upper section and a loose lower section. When the water head pressure changes, the loose pore structure in the lower section is prone to collapse, causing pore blockage and changing the uniformity of the soil sample structure. This results in the degradation of the soil structure along the direction of flow, reducing the effective pores for flow. For dry density greater than 1.45 g/cm3, the relative increase rate of permeability coefficient no longer decreases but instead begins to increase. Samples with higher dry density have a high degree of compaction, and the initial pore structure is stable. During the process of flow, this dense pore structure remains mostly unchanged, and the number of primary pore channels remains constant. With the progress of flow, the binding film formed on the surface of particles near the primary pore channel and small substances dissolved in the flow bring out soil, increasing the effective void ratio and permeability of the soil. When the dry density increases to 1.65 g/cm3, the soil reaches its most compact state. The contact between soil particles and water molecules is the closest, and the basic structure of the soil is composed of single particles and aggregates. As the particle arrangement becomes denser, more aggregates form [57], and the volume of voids between aggregates decreases continuously. As the dry density increases to a certain extent, the proportion of large and medium pores in the soil will become relatively small [58]. This leads to a lower level of soil permeability, with the rate of change in permeability coefficient tending to zero.
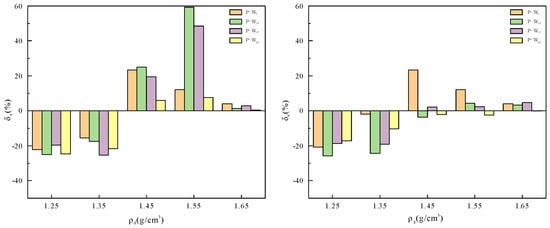
Figure 9.
Characteristics of permeability coefficient increment with respect to dry density variation.
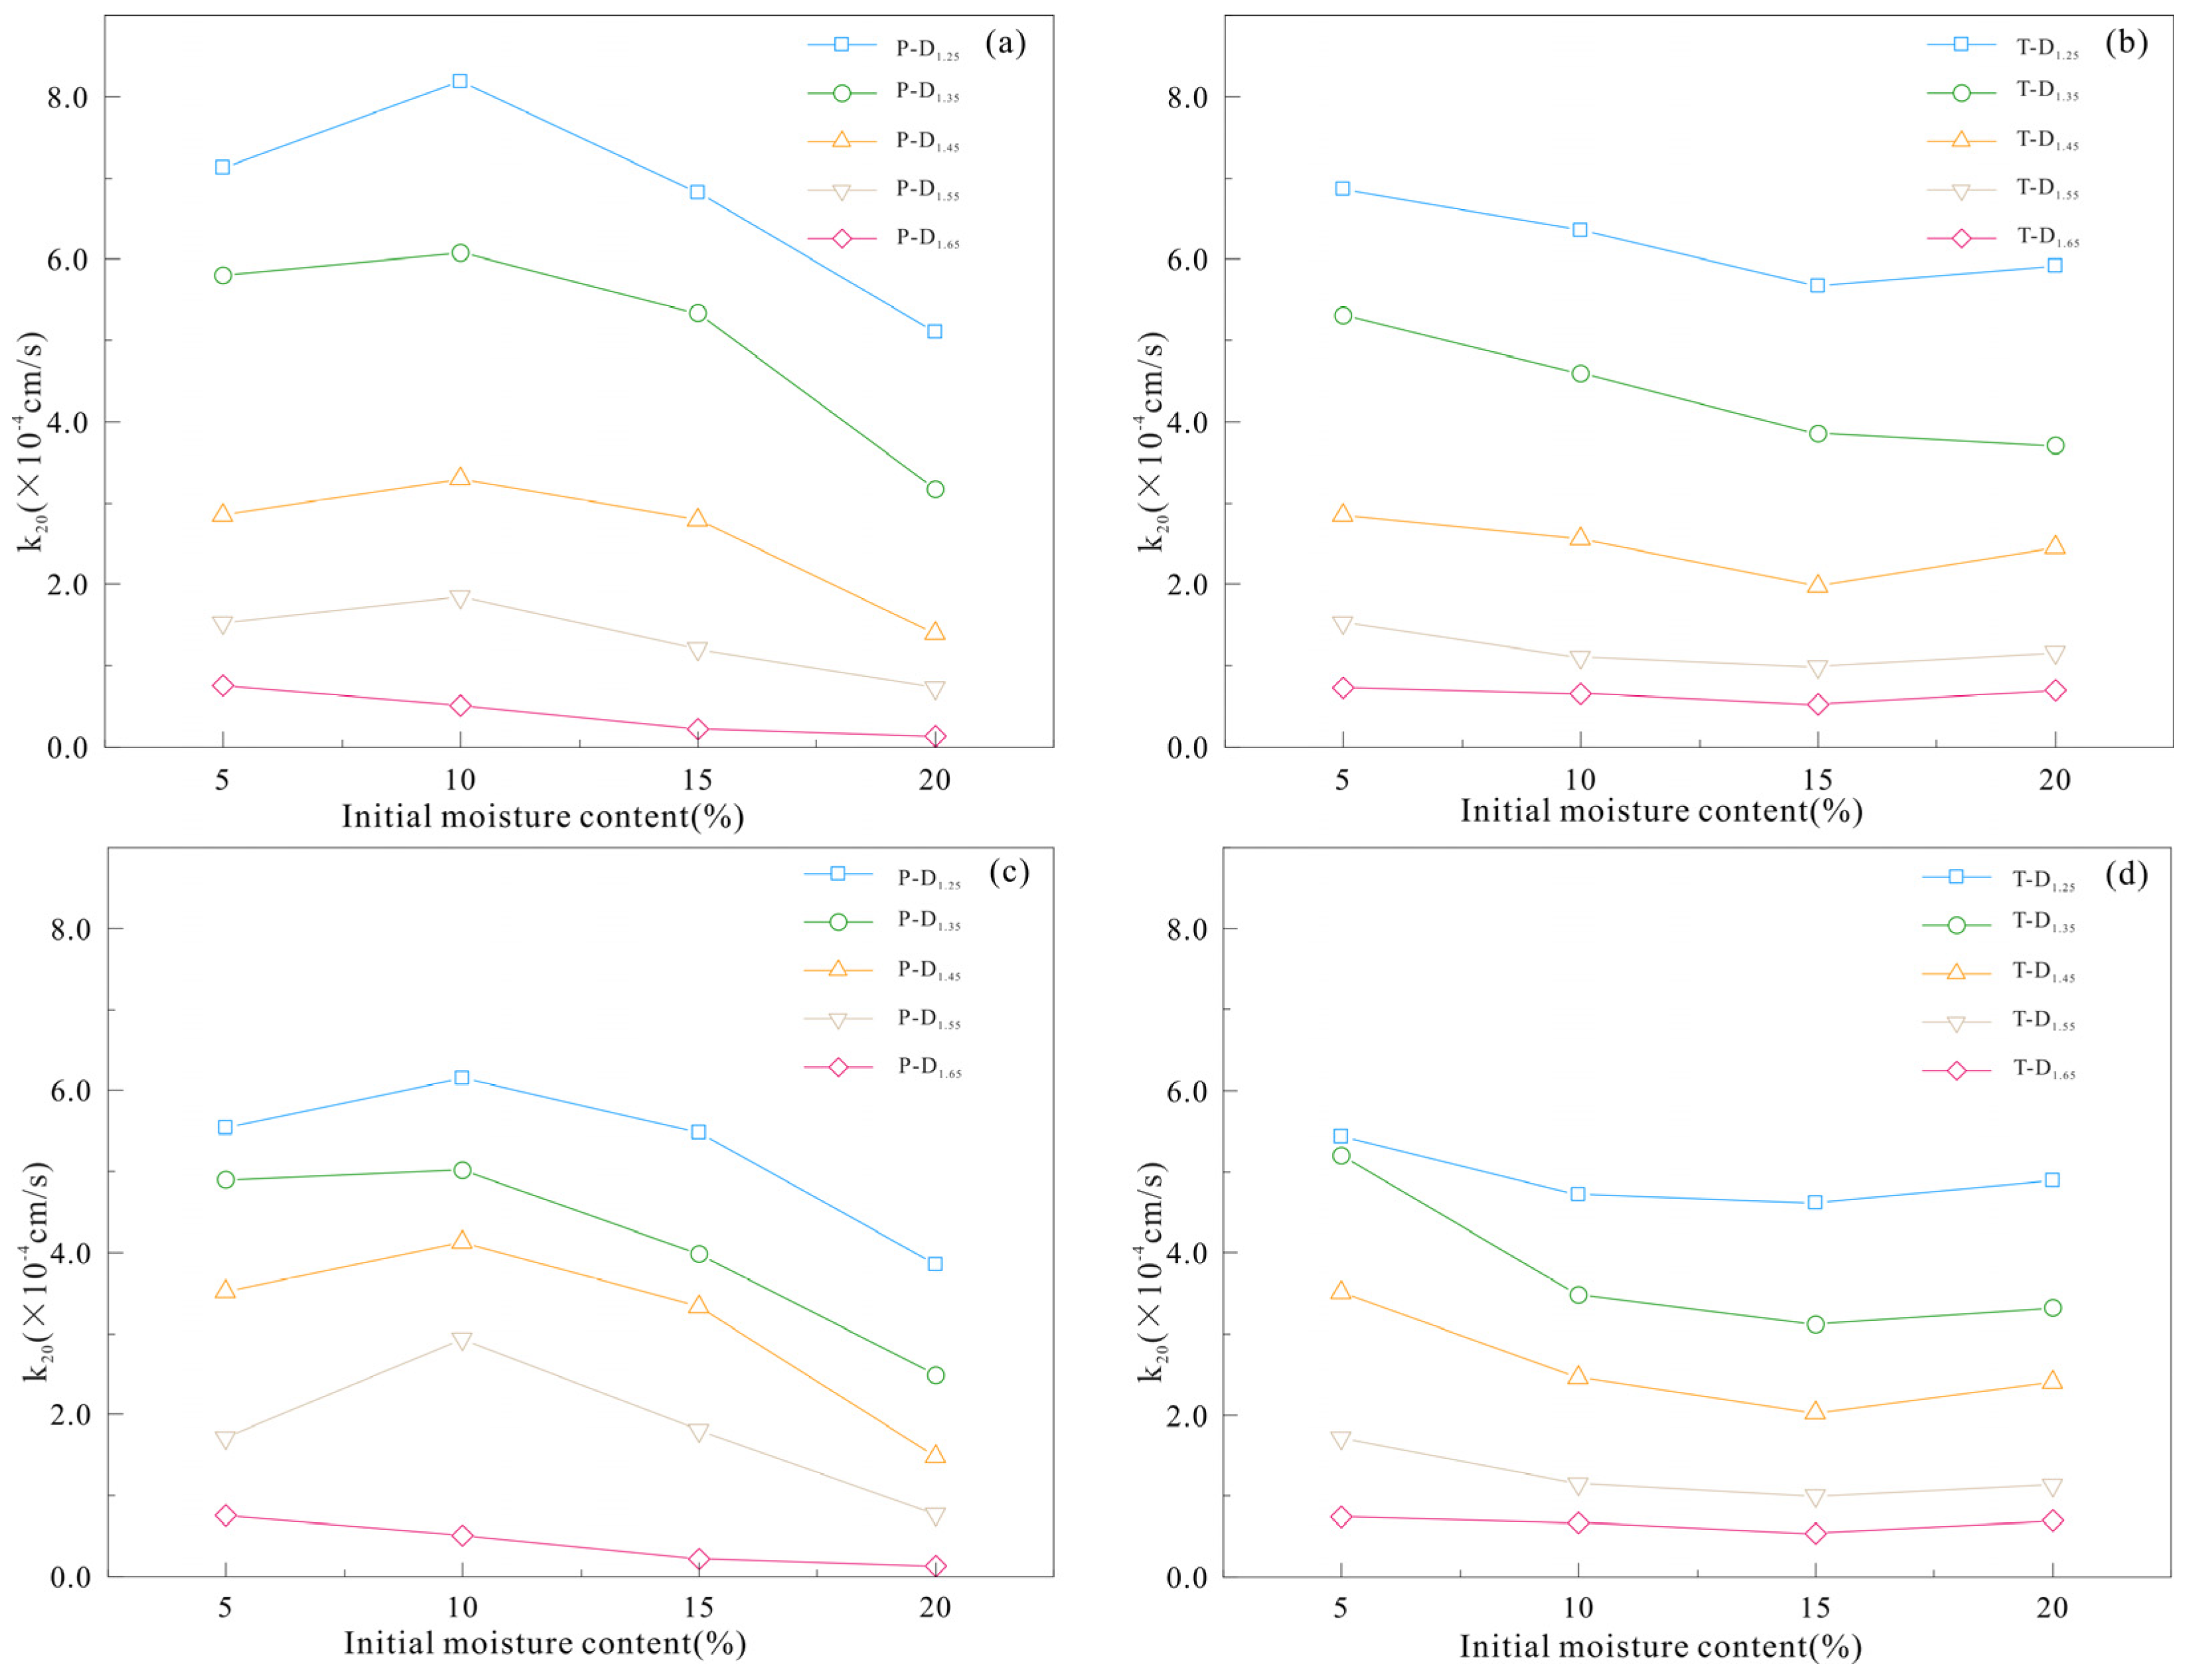
4.2. Effect of Initial Moisture Content on the Permeability
Figure 10a,b depict the initial-stage permeability characteristics of samples prepared using two different methods, as a function of water content. Figure 10c,d show the final-stage permeability characteristics of samples prepared using two different methods, as a function of water content. Under both sample preparation methods, the permeability of the remolded loess decreases with an increase in the initial moisture content. However, due to the poor pore uniformity during the pre-wetting method under different initial moisture content conditions, the permeability is higher compared to the samples prepared using the wetting method under the same conditions. The permeability of loess decreases with increasing initial water content due to a series of physicochemical reactions that occur in the presence of minerals such as calcite, dolomite, chlorite, and illite, which are abundant in loess. As the initial water content increases, the hydration of carbonate minerals leads to the formation of calcium carbonate cemented particles that fill the pores in the loess, thereby decreasing its permeability [59,60]. Moreover, increasing the soil water content causes more water molecules to come into contact with dry soil particles, thickening the surface-bound water film on each particle. This results in a decrease in the total porosity of the sample with a constant sample volume. At the same dry density, the effective permeable pore channels decrease, resulting in a lower permeability of the sample. In addition, an increase in water content causes clay minerals to adsorb water and expand, filling the internal pores of the sample and blocking the throat of the pores, leading to a decrease in the connectivity of the pores and thus a decrease in the permeability of the sample.
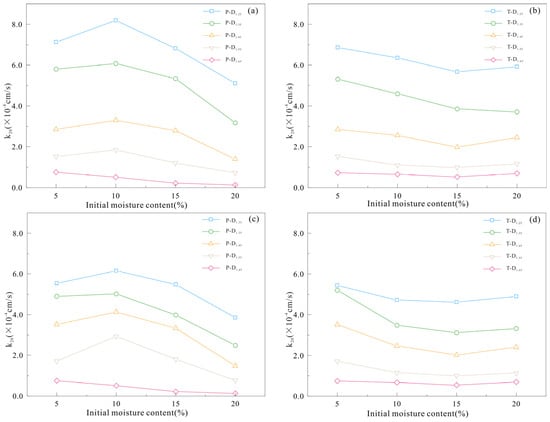
Figure 10.
Characteristics of variation of permeability coefficient with initial water content using different methods: (a) the initial stage of pre-wetting method, (b) the initial stage of transfer wetting method, (c) the final stage of pre-wetting method, (d) the final stage of transfer wetting method.
The pre-wetting method used at a 10% water content results in a good balance between soil particles and water, with particles arranged in good agreement, resulting in high pore penetrability and good permeability. The transfer wetting method used when the water content changes to 20% shows an increase in permeability, with the soil being influenced by the already-formed pore structure. The binding water film around the soil particles cannot continue to increase indefinitely, and some of the water exists in the form of free water in the soil pores, which softens and dissolves the binding water film around the particles during the seepage process. This increases pore penetrability, effective porosity, and enhances permeability.
Under both sample preparation methods, the initial water content has a more significant effect on the permeability of loess when the dry density is lower. The higher the clay content, the greater the possibility of cementation occurring in the clay components, and the easier it is for the soil to have an unstable structure due to the cohesion of the clay aggregates and the morphological characteristics of the silt particles. This may lead to infiltration collapse in low-density pre-wetted samples. This collapse is the result of the combined action of primary and secondary microstructures. The former comprises large amounts of weakly cemented, unsaturated, porous pure clay, and clay–silt mixed aggregates, which collapse the overall structure when they are relaxed after wetting. The latter is caused by unstable particle contacts and clay coatings on silt particles, leading to weaker permeability.
4.3. Relationship between Concentration of Leaching Solution (TDS), Dry Density, and Permeability
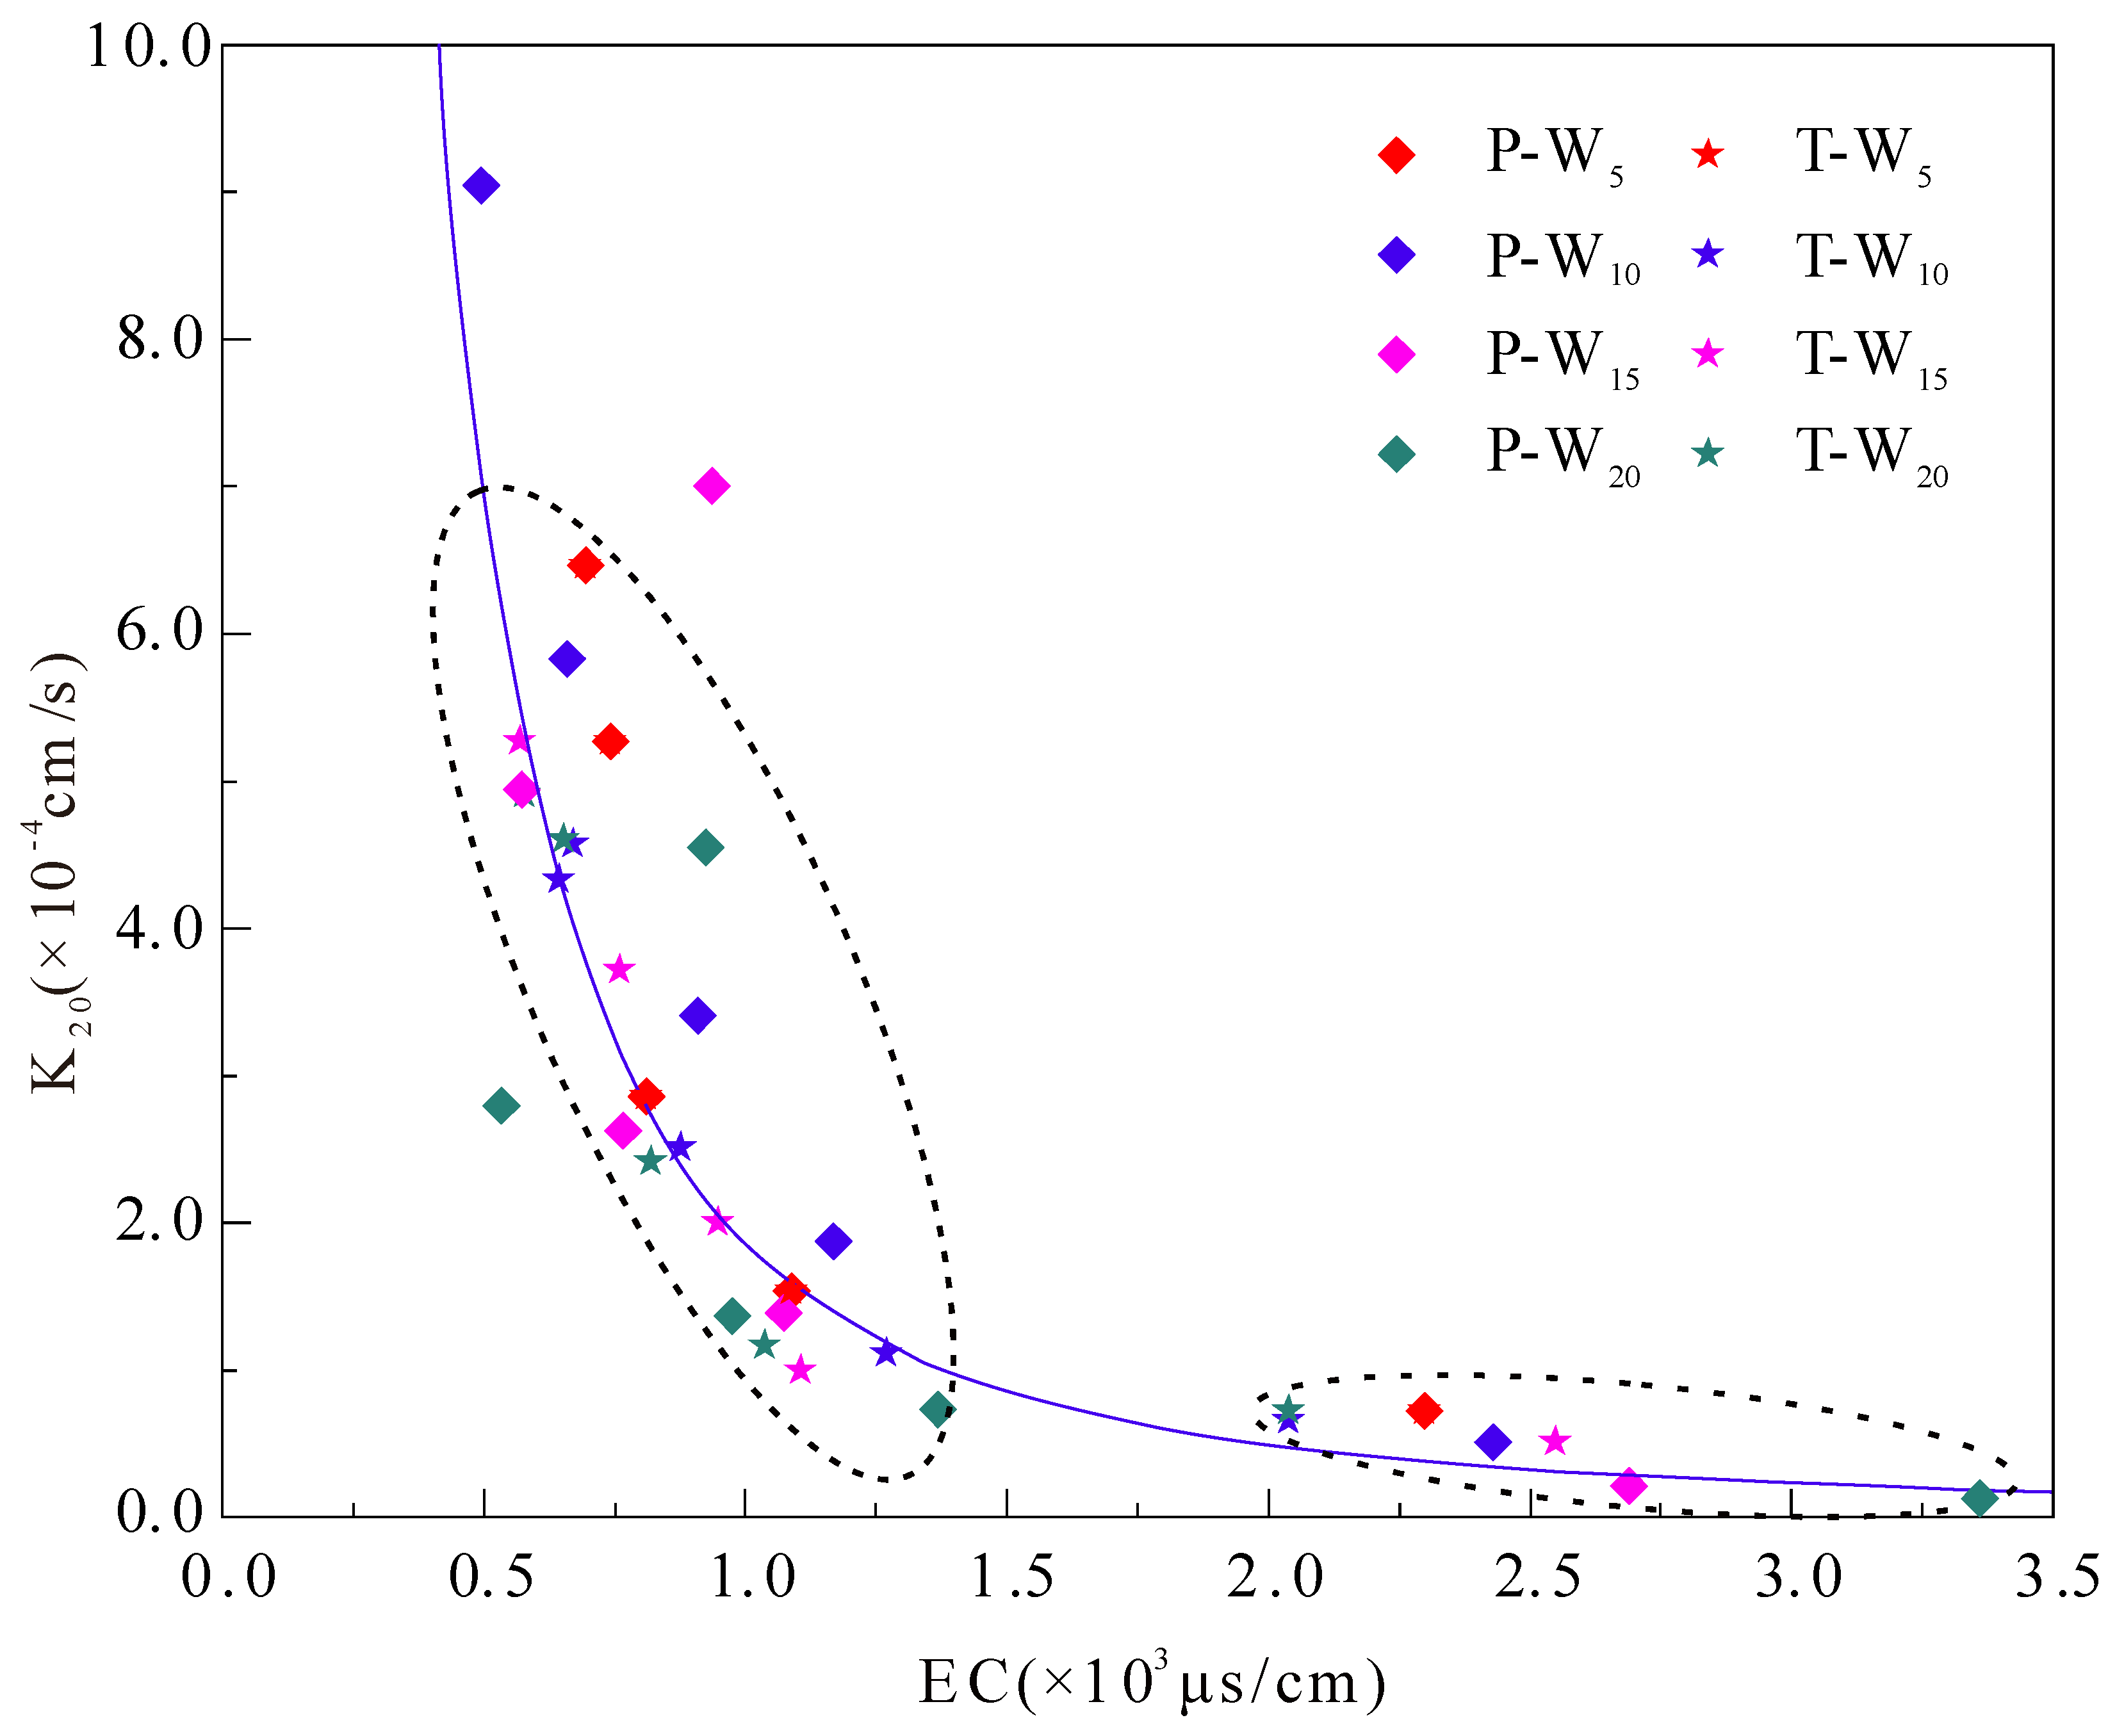
The experiment revealed that the concentration of leachate varies significantly under the combined effects of water, soil, and salt. Previous research has shown that the abrupt change in electrical conductivity can partly reflect changes in the internal structure of the soil. By selecting the electrical conductivity values at the point of transition from steep to gentle and their corresponding permeability coefficients for each sample, we constructed the distribution relationship shown in Figure 11. The hydraulic conductivity of soil changes as a result of the interactions between water, soil particles, and chemical substances [52,61]. Ions in the pore water can cause the dissolution of structural media, altering the pore characteristics and ultimately the soil permeability [62]. Salt content in the soil changes with the movement of water, and there exists a certain relationship between the electrical conductivity of leachate and soil moisture content, bulk density, and cation exchange capacity, which partly indicates the salt content and its changes in the soil [63,64]. The pore liquid exists in the soil pores, and the connectivity of pores is affected by the internal structure of the soil, which also impacts the electrical conductivity of leachate to some extent. The experimental soil contains a high content of fine clay particles, affecting the deposition and dispersion of surface substances and influencing the pore structure and surface double layer structure of the soil. Stronger soil permeability corresponds to stronger ion-exchange capacity between the aqueous solution and the soil, and vice versa. Electrical conductivity and permeability coefficients are concentrated in two areas, showing an aggregation trend of low electrical conductivity and high permeability, and high electrical conductivity and low permeability, respectively.
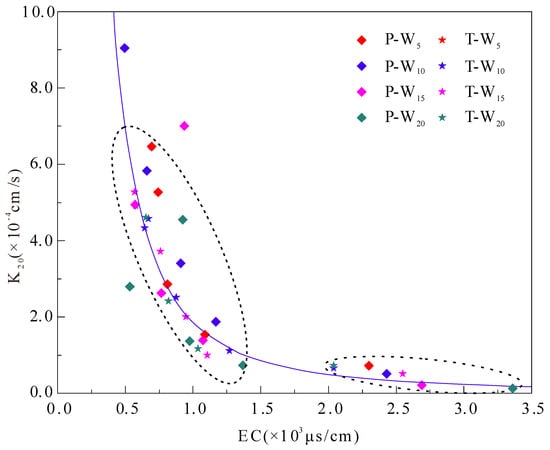
Figure 11.
Characteristics of permeability coefficient variation with respect to electrical conductivity.
4.4. Effect of Sample Preparation Method on Permeability
4.4.1. Pore Distribution Characteristics under Sample Preparation Method
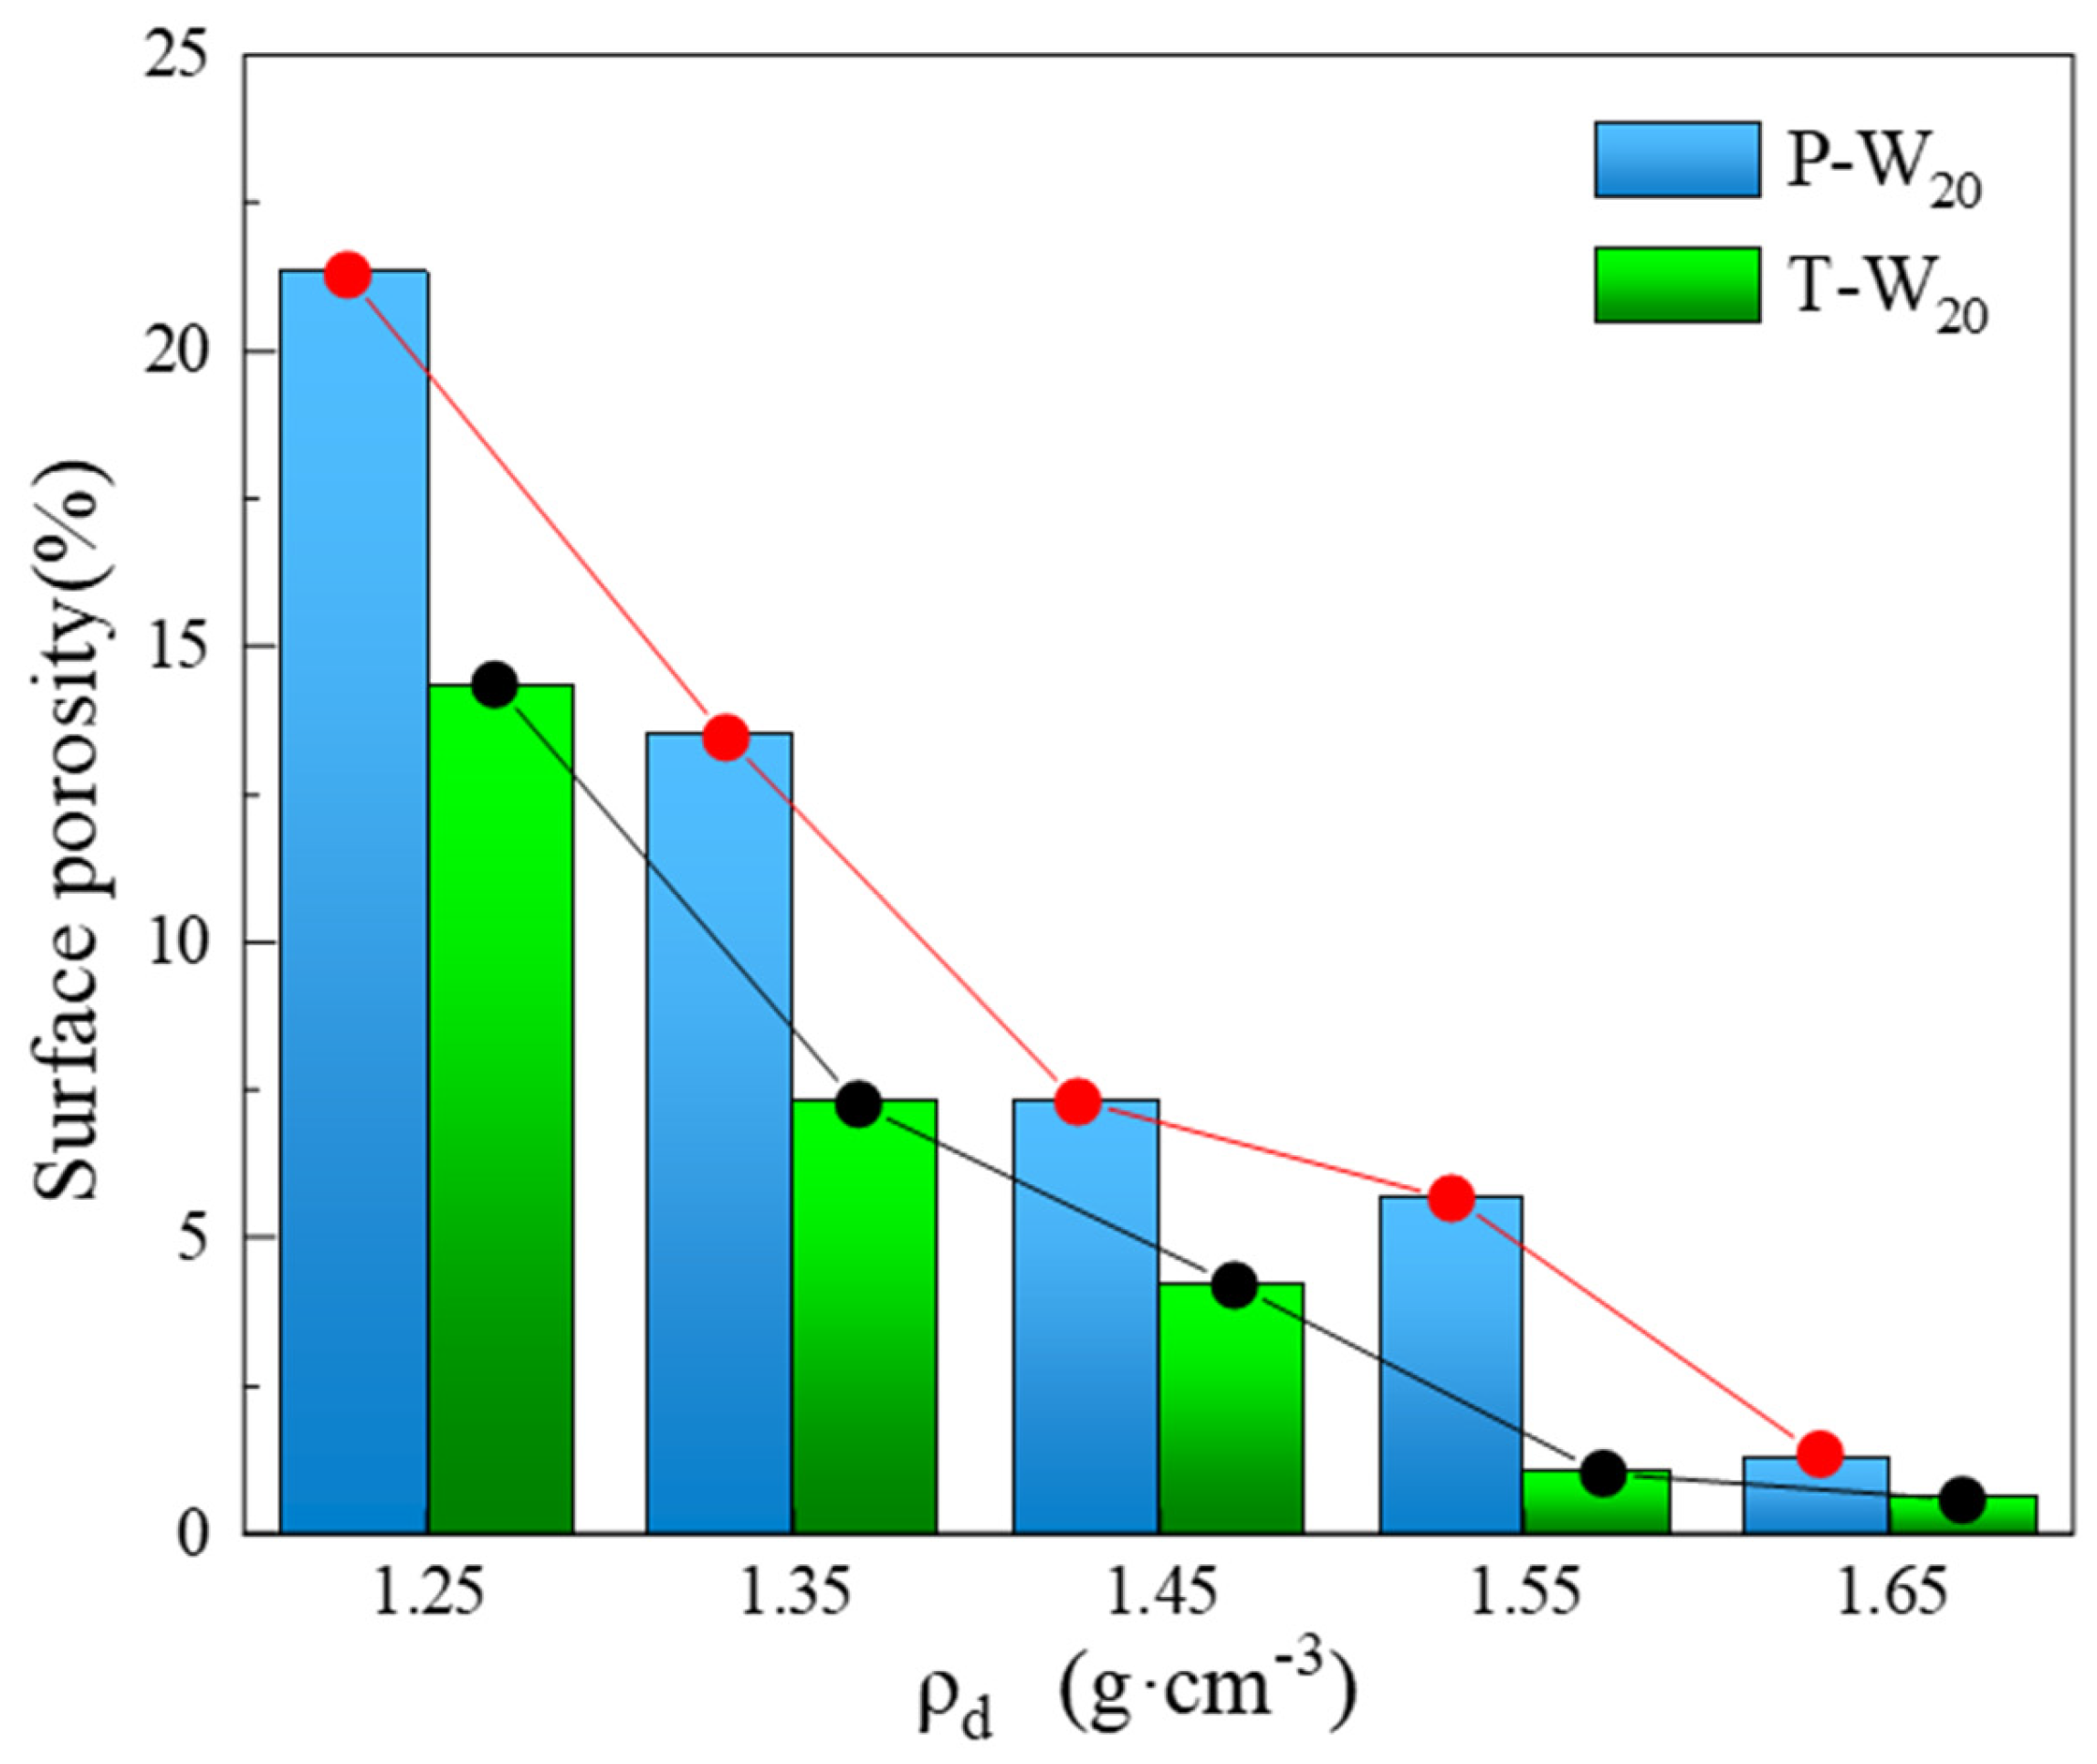
In this experiment, selected samples after seepage were subjected to fine-pore structural analysis. The images captured using the Stemi-508 body microscope were processed and stitched together, and then binarized to extract the pores. The results of the surface porosity of the specimens are presented in Figure 12. It was observed that the surface porosity of samples prepared using the pre-wetting method was higher at the same dry density. As the dry density increased, the surface of the samples tended to become denser, resulting in a reduction in surface porosity. The reduction percentages were found to be 6.97%, 6.16%, 3.125%, 4.66%, and 0.67%. Additionally, the ratio of larger pores in the samples prepared using the transfer wetting method was lower compared to the samples prepared using the pre-wetting method. This indicates that fine pores are more likely to form under the transfer wetting method. Loess has preferential flow based on large-pore channels during seepage [65,66,67]. The pre-wetting method increases the initial bonding degree of the soil, causing it to form more large-pore structures during compaction, indirectly increasing the possibility of preferential flow. Therefore, samples prepared under the transfer wetting method have lower permeability at the same water content and dry density than those obtained under the pre-wetting method.

Figure 12.
Characteristics of porosity variation with dry density on the sample surface.
The permeability of loess is closely linked to the pore channels between its soil particles. Due to its high water sensitivity, loess undergoes structural changes upon contact with water, leading to alterations in its permeability [68]. Compaction and water content are crucial factors that affect the microstructure of compacted loess [69]. In the process of preparing samples using the pre-wetting method, extensive interactions between water molecules and soil particles during the particle wetting stage result in the formation of a thick water film. As clay mineral particles absorb water, they swell and form interconnections, creating a cohesive aggregate structure. During compaction, large pores visible to the naked eye are formed, while in the molding process, particles of the aggregate are arranged in a spaced-out pattern, forming a porous structure (as shown in Figure 13a,c,a’,c’). The surface structure of the sample is loose, the pore distribution is not uniform, there are more large pores, and the water-conducting pores are more developed to form a better channel for seepage. The transfer wetting method sample has low initial water content, less particle surface cementation material, uniform macro-expression of the particle texture, no obvious phenomenon, a tight compaction process of particle arrangement, and uniform pore size formation. Moreover, when the water film transfer method is used to increase the water content of the sample, the water is endowed with the pore space of the soil body and then slowly with a combination of particles, and then the physical and chemical changes take place. Thus, in this process, a sample has been compacted into a certain size of ring knife sample, and a certain arrangement has been formed between the particles; with a certain pore structure, water molecules in the process of combining with the soil particles are more likely to thicken the water film of individual particles and seldom form a large cementing material so as to produce the agglomerated granular structure, comprising compacted samples of the pore size distribution of a relatively more centralized, macroscopic performance of the surface, which is dense, with a slightly greater large-pore size and more developed medium-sized pores (as shown in Figure 13b,d,b’,d’).
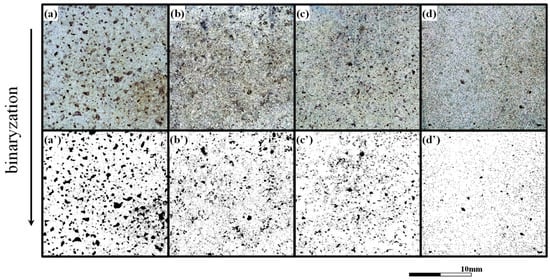
Figure 13.
Characteristics of surface pore density variation for samples prepared using different methods (Figure (a): P-W20-D1.35, Figure (b): T-W20-D1.35, Figure (c): P-W20-D1.55, Figure (d): T-W20-D1.55; Figures (a’–d’) show their binarized images).
4.4.2. Cementation Degree and Contact Relation Characteristics of Soil Particles under Sample Preparation Method
After the experimentation, a meticulous process of curing, polishing, and thin-slice preparation was undertaken for a specific portion of the sample. Subsequently, the prepared slices were subjected to observation under a Nikon polarizing microscope, employing a magnification of 100 times. This carefully chosen magnification not only provided a broad and comprehensive field of view but also rendered the pores and particle boundaries remarkably distinct. Moreover, the cementitious materials and aggregates exhibited excellent discernibility, enabling precise analysis and quantification. The distribution and aggregation characteristics of skeletal particles, agglomerates, and pores in the sample are illustrated in Figure 14. Under the pre-wetting method, the sample exhibits a greater number of large-sized pores, while small-sized pores are interspersed within the larger pore spaces. The skeletal particles are dispersed randomly, with fine particles bonding to form larger agglomerates (Figure 14a,c). Under the transfer wetting method, the sample exhibits fewer large-sized pores, with a predominance of smaller-sized pores. The distribution of skeletal particles appears more uniform, resulting in the formation of smaller aggregates (Figure 14b,d).
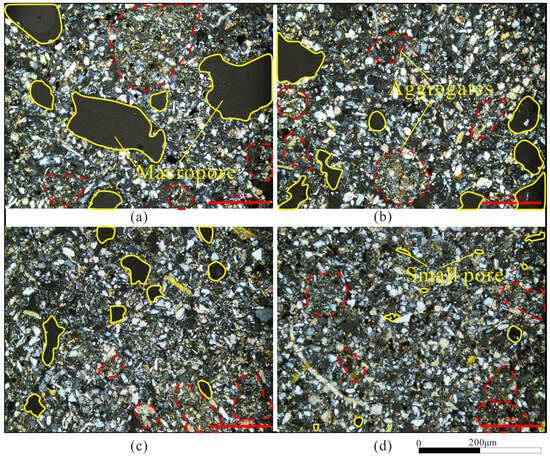
Figure 14.
Mineral aggregation characteristics for samples prepared using different methods (Figure (a): P-W20-D1.35, Figure (b): T-W20-D1.35, Figure (c): P-W20-D1.55, Figure (d): T-W20-D1.55).
Loess pores can be classified into two main categories: interparticle pores and bonding material pores. The former can be further divided into scaffold pores and inlay pores. The microstructure characteristics of the samples are summarized in Table 4. At low dry density, the soil structure is loose, and the particle arrangement is scattered, resulting in high soil porosity. Skeleton particles primarily contact through edges or corners, forming a framework that supports seven aerial pores, which account for a significant proportion of the total pore space (as shown in Figure 14a,b). As the compactness increases, soil particles pack more tightly, with skeleton particles intertwining and stacking together firmly. Particle contact is mainly through edges or surfaces, creating more inlay pores that exhibit slit-like shapes and smaller diameters. These pores are typically more stable than scaffold pores. Fine particles and easily soluble salts often fill the pores among the skeleton particles, forming some bonds between them. This results in a decrease in the proportion of scaffold pores and an increase in the ratio of inlay pores and bonding material pores (as shown in Figure 14c,d).
Table 4.
Microstructure characteristics of sample.
During seepage, low-dry-density soils have larger pore diameters and higher porosity. Once the seepage fluid fills the pores, particles experience buoyancy from the pore water pressure. Under hydraulic pressure, the pores in the soil expand and connect with each other through weak interparticle bonds, forming preferential seepage paths. Long-term seepage causes soil particles to float, altering their positions within the soil. Larger particles are pushed together under the hydraulic pressure, further enlarging the preferential seepage path. Fine particles seep through the soil matrix [70,71] and gradually move upward. Easily soluble salt particles are carried out of the soil along with the seepage water, increasing the total porosity of the soil. This leads to more-frequent movement of fine particles and gradual accumulation of larger particles at the bottom of the soil, blocking the pores and reducing the soil permeability. This phenomenon causes infiltration subsidence and structural damage to the soil (as shown in Figure 15a). High-dry-density soils have smaller pore diameters and lower porosity during seepage. The flow path remains stable, and the hydraulic pressure does not significantly impact the particle arrangement. The soil can only establish a stable seepage path by connecting some weakly bonded pores under the effect of permeation pressure. Over time, salt particles and some weak bonding materials are eroded by seepage, but the main seepage channels remain stable, and the permeability remains relatively low and constant (as shown in Figure 15b). Therefore, in engineering practice, it is recommended to control the compaction degree as much as possible to ensure that the soil has a high dry density and stable pore structure. This can effectively reduce the risk of structural damage and soil instability caused by seepage-induced geological hazards during water seepage.
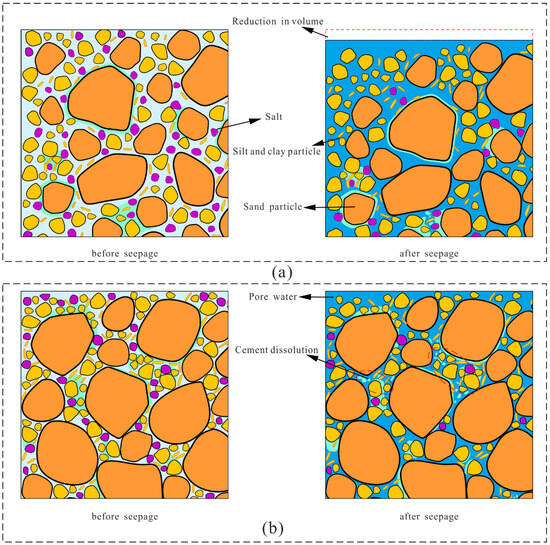
Figure 15.
Evolution diagrams of flow components: (a) low dry density, and (b) high dry density.
5. Conclusions
In this study, the influence of sample preparation methods on the permeability of remolded loess was investigated through falling-head permeability tests. The permeability coefficients and leachate conductivity of samples prepared using different methods were measured. The face porosity of the samples was analyzed under a stereomicroscope, while the pore size and aggregate size were examined using a polarizing microscope. The changes in the permeability of remolded loess were analyzed by combining macroscopic experiments and microscopic structural analysis of the samples’ preparation methods. Based on the experimental results, the mechanisms behind the changes in the permeability performance of remolded loess were discussed, leading to the following conclusions:
1. The sample preparation method, initial moisture content, and dry density exert a significant influence on the permeability of remolded loess.
2. Compared to the transfer wetting method, samples prepared by using the pre-wetting method exhibit poorer homogeneity, particularly noticeable at higher initial moisture contents. Over prolonged permeability tests, the pore structure is prone to alterations, leading to higher permeability coefficients.
3. Monitoring the total dissolved solids (TDS) in the infiltrating fluid during the permeation process reveals that soluble salts within the soil progressively leach out with the infiltrating liquid, thereby impacting both the soil structure and permeability regardless of the sampling method employed.
4. Comparing the microstructure of the two sample preparation methods, the samples subjected to the pre-wetting method have a greater number of large pores and an obvious aggregate structure, which is also the internal factor leading to the difference in permeability between the two sample preparation methods.
5. While the impact of the sampling method on the permeability of remolded loess is minimal when the dry density is relatively high (specifically exceeding 1.45 g/cm3), it is crucial to consider the influence of the sampling method when investigating the permeability of remolded loess under lower dry density.
Author Contributions
All the authors have made great contributions to the writing and revision of this article. Among them, J.M. and S.L. designed the experiments; Y.Q., Y.G. and Y.A. carried out the experiments; Y.Q. and Y.G. analyzed the experimental results; J.M. assisted with the conceptualization of the study and the data interpretations; S.L. and Y.Q. drew the figures. In particular, Z.D. made valuable revisions to the manuscript and all the authors agreed on both the content and the form of the final revised version, J.M. being the person responsible for this article, S.L. the corresponding author. All authors have read and agreed to the published version of the manuscript.
Funding
This work was supported by the National Natural Science Foundation of China (No. 41602359, 41907255, 42177155), the Natural Science Basic Research Plan in Shaanxi Province of China (No. 2017JQ4019), Science and Technology Program by Department of Transport of Gansu Province (Grant No. 2021-25).
Data Availability Statement
Not applicable.
Conflicts of Interest
The authors declare no conflict of interest.
References
- Xianmo, Z.; Yushan, L.; Xianglin, P.; Shuguang, Z. Soils of the loess region in China. Geoderma 1983, 29, 237–255. [Google Scholar] [CrossRef]
- Derbyshire, E. Geological hazards in loess terrain, with particular reference to the loess regions of China. Earth-Sci. Rev. 2001, 54, 231–260. [Google Scholar] [CrossRef]
- Gao, Y.; Qian, H.; Li, X.; Chen, J.; Jia, H. Effects of lime treatment on the hydraulic conductivity and microstructure of loess. Environ. Earth Sci. 2018, 77, 529. [Google Scholar] [CrossRef]
- Zhang, D.; Wang, G.; Chunyong, L.; Chen, J.; Zhou, Y. A rapid loess flowslide triggered by irrigation in China. Landslides 2009, 6, 55–60. [Google Scholar] [CrossRef]
- Wen, B.; He, L. Influence of lixiviation by irrigation water on residual shear strength of weathered red mudstone in Northwest China: Implication for its role in landslides’ reactivation. Eng. Geol. 2012, 151, 56–63. [Google Scholar] [CrossRef]
- Deng, L.-S.; Fan, W.; Yin, Y.-P.; Cao, Y.-B. Case Study of a Collapse Investigation of Loess Sites Covered by Very Thick Loess-Paleosol Interbedded Strata. Int. J. Geomech. 2018, 18, 05018009. [Google Scholar] [CrossRef]
- Wu, L.Z.; Selvadurai, A.P.S.; Zhang, L.M.; Huang, R.Q.; Huang, J. Poro-mechanical coupling influences on potential for rainfall-induced shallow landslides in unsaturated soils. Adv. Water Resour. 2016, 98, 114–121. [Google Scholar] [CrossRef]
- Meng, X.; Derbyshire, E. Landslides and Their Control in the Chinese Loess Plateau: Models and Case Studies from Gansu Province, China; Engineering Geology Special Publications; Geological Society: London, UK, 1998; Volume 15, pp. 141–153. [Google Scholar]
- Xu, L.; Dai, F.; Tu, X.B.; Tham, L.; Zhou, Y.; Iqbal, J. Landslides in a Loess Platform, North-west China. Landslides 2013, 11, 993–1005. [Google Scholar] [CrossRef]
- Xu, L.; Coop, M.; Zhang, M.; Wang, G. The Mechanics of a Saturated Silty Loess and Implications for Landslides. Eng. Geol. 2017, 236, 29–42. [Google Scholar] [CrossRef]
- Liang, C.; Cao, C.; Wu, S. Hydraulic-mechanical properties of loess and its behavior when subjected to infiltration-induced wetting. Bull. Eng. Geol. Environ. 2016, 77, 385–397. [Google Scholar] [CrossRef]
- Anthony, E.; Agunwamba, J. Experimental Determination of Dispersion Coefficient in Soil. Emerg. Sci. J. 2018, 2, 213–218. [Google Scholar]
- Li, J.; Leao, T. Application of Nor Sand Constitutive Model in a Highway Fill Embankment Slope Stability Failure Study. Civ. Eng. J. 2018, 4, 2252. [Google Scholar] [CrossRef]
- Kassou, F.; Bouziyane, J.; Ghafiri, A.; Sabihi, A. Slope Stability of Embankments on Soft Soil Improved with Vertical Drains. Civ. Eng. J. 2020, 6, 164–173. [Google Scholar] [CrossRef]
- Tarantino, A.; Col, E.D. Compaction behaviour of clay. Géotechnique 2008, 58, 199–213. [Google Scholar] [CrossRef]
- Wang, L.-Y.; Chen, W.-Z.; Zhang, Y.-J.; Zhang, X.-D.; Vuik, C. Investigating Effects of Heterogeneity and Fracture Distribution on Two-Phase Flow in Fractured Reservoir with adaptive time strategy. Transp. Porous Media 2023, 149, 175–203. [Google Scholar] [CrossRef]
- Hao, Y.-Z.; Wang, T.-H.; Wang, J.-J. Structural properties of unsaturated compacted loess for various sample moisture contents. Arab. J. Geosci. 2019, 12, 258. [Google Scholar] [CrossRef]
- Lu, J.; Wang, T.-H.; Cheng, J.W.-C.; Yang, T.; Luo, Y. Permeability anisotropy of loess under the influence of dry density and freeze-thaw cycles. Int. J. Geomech. 2019, 19, 04019103. [Google Scholar] [CrossRef]
- Zhai, Q.; Rahardjo, H.; Satyanaga, A. Uncertainty in the estimation of hysteresis of soil–water characteristic curve. Environ. Geotech. 2017, 6, 204–213. [Google Scholar] [CrossRef]
- Leong, E.; Wijaya, M.; Tong, W.; Lu, Y. Examining the Contact Filter Paper Method in the Low Suction Range. Geotech. Test. J. 2020, 43, 20190237. [Google Scholar] [CrossRef]
- Zhai, Q.; Rahardjo, H.; Satyanaga, A.; Dai, G.-L.; Du, Y.-J. Effect of the uncertainty in soil-water characteristic curve on the estimated shear strength of unsaturated soil. J. Zhejiang Univ.-Sci. A 2020, 21, 317–330. [Google Scholar] [CrossRef]
- Xu, P.; Zhang, Q.; Qian, H.; Qu, W.; Li, M. Microstructure and permeability evolution of remolded loess with different dry density under saturated seepage. Eng. Geol. 2020, 282, 105875. [Google Scholar] [CrossRef]
- Cuisinier, O.; Auriol, J.-C.; Le Borgne, T.; Deneele, D. Microstructure and hydraulic conductivity of a compacted lime-treated soil. Eng. Geol. 2011, 123, 187–193. [Google Scholar] [CrossRef]
- Kangze, Y.; Ni, W.-K.; Lü, X.; Wang, X.-J. Permeability characteristics and structural evolution of compacted loess under different dry density and wetting-drying cycles. PLoS ONE 2021, 16, e0253508. [Google Scholar]
- Zhang, Y.; Zou, Y.; Zhang, Y.; Wang, L.; Liu, D.; Sun, J.; Ge, H.; Zhou, D. Experimental study on characteristics and mechanisms of matrix pressure transmission near the fracture surface during post-fracturing shut-in in tight oil reservoirs. J. Pet. Sci. Eng. 2022, 219, 111133. [Google Scholar] [CrossRef]
- Wei, Y.-N.; Fan, W.; Yu, N.; Deng, L.-S.; Wei, T. Permeability of loess from the South Jingyang Plateau under different consolidation pressures in terms of the three-dimensional microstructure. Bull. Eng. Geol. Environ. 2020, 79, 4841–4857. [Google Scholar] [CrossRef]
- Li, X.; Li, L. Quantification of the pore structures of Malan loess and the effects on loess permeability and environmental significance, Shaanxi Province, China: An experimental study. Environ. Earth Sci. 2017, 76, 523. [Google Scholar] [CrossRef]
- Guo, Y.; Ni, W.; Kou, Z.; Zhao, Y.; Nie, Y. Experimental Study on the Permeability of Compacted Loess. Soil Mech. Found. Eng. 2020, 57, 394–400. [Google Scholar] [CrossRef]
- Qajar, J.; Arns, C.H. A comparative study of micro-CT and mercury intrusion techniques for predicting permeability and surface area evolution during chemical dissolution. Adv. Water Resour. 2022, 168, 104301. [Google Scholar] [CrossRef]
- Xu, J.; Li, Y.; Wang, S.; Wang, Q.; Ding, J. Shear strength and mesoscopic character of undisturbed loess with sodium sulfate after dry-wet cycling. Bull. Eng. Geol. Environ. 2019, 79, 1523–1541. [Google Scholar] [CrossRef]
- Liu, D.; She, D.; Mu, X. Water flow and salt transport in bare saline-sodic soils subjected to evaporation and intermittent irrigation with saline/distilled water. Land Degrad. Dev. 2019, 30, 1204–1218. [Google Scholar] [CrossRef]
- Nimmo, J.R.; Akstin, K.C. Hydraulic conductivity of a sandy soil at low water content after compaction by various methods. Soil Sci. Soc. Am. J. 1988, 52, 303–310. [Google Scholar] [CrossRef]
- Jang, D.J.; Frost, J.D.; American Society of Civil Engineers. Sand Structure Differences Resulting from Specimen Preparation Procedures. In Speciality Conference, Geotechnical Earthquake Engineering and Soil Dynamics, 75th ed.; American Society of Civil Engineers: Seattle, WA, USA, 1998; pp. 234–245. [Google Scholar]
- Delage, P.; Audiguier, M.; Cui, Y.-J.; Howat, M. Microstructure of a compacted silt. Can. Geotech. J. 2011, 33, 150–158. [Google Scholar] [CrossRef]
- Gao, Y.; Sun, D.; Zhou, A. Hydromechanical behaviour of unsaturated soil with different specimen preparations. Can. Geotech. J. 2015, 53, 909–917. [Google Scholar] [CrossRef]
- Teng, J.; Kou, J.; Zhang, S.; Sheng, D. Evaluating the Influence of Specimen Preparation on Saturated Hydraulic Conductivity Using Nuclear Magnetic Resonance Technology. Vadose Zone J. 2019, 18, 180179. [Google Scholar] [CrossRef]
- ASTM. Annual Book of ASTM Standards; ASTM: West Conshohocken, PA, USA, 2006. [Google Scholar]
- ASTM (2009) D7263; Standard Test Methods for Laboratory Determination of Density (Unit Weight) of Soil Specimens. ASTM International: West Conshohocken, PA, USA.
- ASTM (2010) D4318; Standard Test Methods for Liquid Limit, Plastic Limit, and Plasticity Index of Soils. ASTM International: West Conshohocken, PA, USA.
- ASTM (2010) D2216; Standard Test Methods for Laboratory Determination of Water (Moisture) Content of Soil and Rock by Mass. ASTM International: West Conshohocken, PA, USA.
- ASTM (2014) D854; Standard Test Methods for Specific Gravity of Soil Solids by Water Pycnometer. ASTM International: West Conshohocken, PA, USA.
- ASTM (2011) D2487; Standard Practice for Classification of Soils for Engineering Purposes (Unified Soil Classification System). ASTM International: West Conshohocken, PA, USA.
- Zhaoqiang, J.; Ren, T.; Hu, C. Soil Thermal Conductivity as Influenced by Aggregation at Intermediate Water Contents. Soil Sci. Soc. Am. J. 2011, 75, 26–29. [Google Scholar]
- Liu, W.; Wang, Q.; Lin, G.; Chen, W. Effect of pre-dynamic loading on dynamic liquefaction of undisturbed loess. Bull. Earthq. Eng. 2020, 18, 5779–5806. [Google Scholar] [CrossRef]
- Zhang, X.; Lu, Y.; Li, X.; Lu, Y.; Pan, W. Microscopic structure changes of Malan loess after humidification in South Jingyang Plateau, China. Environ. Earth Sci. 2019, 78, 287. [Google Scholar] [CrossRef]
- Yan, X.; Duan, Z.; Sun, Q. Influences of water and salt contents on the thermal conductivity of loess. Environ. Earth Sci. 2021, 80, 52. [Google Scholar] [CrossRef]
- Xu, P.; Zhang, Q.; Qian, H.; Qu, W. Effect of Sodium Chloride Concentration on Saturated Permeability of Remolded Loess. Minerals 2020, 10, 199. [Google Scholar] [CrossRef]
- Jafari, R.; Sheikh, V.; Hossein-Alizadeh, M.; Rezaii-Moghadam, H. Effect of Soil Sample Size on Saturated Soil Hydraulic Conductivity. Commun. Soil Sci. Plant Anal. 2017, 48, 908–919. [Google Scholar] [CrossRef]
- Zhang, Y.; Qian, H.; Hou, K.; Qu, W. Investigating and predicting the temperature effects of permeability for loess. Eng. Geol. 2021, 285, 106050. [Google Scholar] [CrossRef]
- Romero, E.; Simms, P. Microstructure Investigation in Unsaturated Soils: A Review with Special Attention to Contribution of Mercury Intrusion Porosimetry and Environmental Scanning Electron Microscopy. Geotech. Geol. Eng. 2008, 26, 705–727. [Google Scholar] [CrossRef]
- Liu, Z.; Dugan, B.; Masiello, C.A.; Barnes, R.T.; Gallagher, M.E.; Gonnermann, H. Impacts of biochar concentration and particle size on hydraulic conductivity and DOC leaching of biochar–sand mixtures. J. Hydrol. 2016, 533, 461–472. [Google Scholar] [CrossRef]
- Yilmaz, G.; Yetimoglu, T.; Arasan, S. Hydraulic conductivity of compacted clay liners permeated with inorganic salt solutions. Waste Manag. Res. J. Int. Solid Wastes Public Clean. Assoc. ISWA 2008, 26, 464–473. [Google Scholar] [CrossRef] [PubMed]
- Rabot, E.; Wiesmeier, M.; Schlüter, S.; Vogel, H.J. Soil structure as an indicator of soil functions: A review. Geoderma 2018, 314, 122–137. [Google Scholar] [CrossRef]
- Xu, P.; Zhang, Q.; Qian, H.; Li, M.; Yang, F. An investigation into the relationship between saturated permeability and microstructure of remolded loess: A case study from Chinese Loess Plateau. Geoderma 2021, 382, 114774. [Google Scholar] [CrossRef]
- Hao, Y.-Z.; Wang, T.-H.; Jin, X.; Cheng, L.; Li, J.-L. Experimental Study on the Saturated Compacted Loess Permeability under K0 Consolidation. Adv. Civ. Eng. 2020, 2020, 1426485. [Google Scholar]
- Liu, J.; Li, X.; Xue, Q.; Guo, Z. Experimental study on air permeability and microscopic mechanism of intact and remolded Malan loess, Loess Plateau, China. Bull. Eng. Geol. Environ. 2020, 79, 3909–3919. [Google Scholar] [CrossRef]
- Wei, Y.-N.; Fan, W.; Yu, B.; Deng, L.-S.; Wei, T. Characterization and evolution of three-dimensional microstructure of Malan loess. Catena 2020, 192, 104585. [Google Scholar] [CrossRef]
- Li, X.; Zhang, L.M. Characterization of dual-structure pore-size distribution of soil. Can. Geotech. J. 2009, 46, 129–141. [Google Scholar] [CrossRef]
- Sun, X.; Miao, L.; Chen, R.; Wang, H.; Wu, L.; Xia, J. Liquefaction Resistance of Biocemented Loess Soil. J. Geotech. Geoenvironmental Eng. 2021, 147, 04021117. [Google Scholar] [CrossRef]
- Wang, X.; Nackenhorst, U. A coupled bio-chemo-hydraulic model to predict porosity and permeability reduction during microbially induced calcite precipitation. Adv. Water Resour. 2020, 140, 103563. [Google Scholar] [CrossRef]
- Dutta, J.; Mishra, A.K. A study on the influence of inorganic salts on the behaviour of compacted bentonites. Appl. Clay Sci. 2015, 116–117, 85–92. [Google Scholar] [CrossRef]
- Meng, J.; Li, X.-A. Effects of carbonate on the structure and properties of loess and the corresponding mechanism: An experimental study of the Malan loess, Xi’an area, China. Bull. Eng. Geol. Environ. 2019, 78, 4965–4976. [Google Scholar] [CrossRef]
- Corwin, D.L.; Lesch, S.M. Apparent soil electrical conductivity measurements in agriculture. Comput. Electron. Agric. 2005, 46, 11–43. [Google Scholar] [CrossRef]
- Sudduth, K.A.; Myers, D.B.; Kitchen, N.R.; Drummond, S.T. Modeling soil electrical conductivity-depth relationships with data from proximal and penetrating ECa sensors. Geoderma 2013, 199, 12–21. [Google Scholar] [CrossRef]
- Mooney, S.J. Three-dimensional visualization and quantification of soil macroporosity and water flow patterns using computed tomography. Soil Use Manag. 2002, 18, 142–151. [Google Scholar] [CrossRef]
- Luo, L.; Lin, H.; Halleck, P. Quantifying Soil Structure and Preferential Flow in Intact Soil Using X-ray Computed Tomography. Soil Sci. Soc. Am. J. 2008, 72, 1058–1069. [Google Scholar] [CrossRef]
- Katuwal, S.; Norgaard, T.; Moldrup, P.; Lamandé, M.; Wildenschild, D.; de Jonge, L.W. Linking air and water transport in intact soils to macropore characteristics inferred from X-ray computed tomography. Geoderma 2015, 237–238, 9–20. [Google Scholar] [CrossRef]
- Yue, F.; Ren, X.; Wang, X.; Tian, W. Experimental Study on the Influence of Soil Structure Index on Loess Permeability. Adv. Mater. Sci. Eng. 2022, 2022, 9618732. [Google Scholar] [CrossRef]
- Li, P.; Pan, Z.H.; Xiao, T.; Wang, J. Effects of molding water content and compaction degree on the microstructure and permeability of compacted loess. Acta Geotech. 2022, 18, 921–936. [Google Scholar] [CrossRef]
- Fannin, R.; Slangen, P. On the distinct phenomena of suffusion and suffosion. Géotechnique Lett. 2014, 4, 289–294. [Google Scholar] [CrossRef]
- Hunter, R.; Bowman, E. Visualisation of seepage-induced suffusion and suffosion within internally erodible granular media. Géotechnique 2018, 68, 918–930. [Google Scholar] [CrossRef]

Disclaimer/Publisher’s Note: The statements, opinions and data contained in all publications are solely those of the individual author(s) and contributor(s) and not of MDPI and/or the editor(s). MDPI and/or the editor(s) disclaim responsibility for any injury to people or property resulting from any ideas, methods, instructions or products referred to in the content. |
© 2023 by the authors. Licensee MDPI, Basel, Switzerland. This article is an open access article distributed under the terms and conditions of the Creative Commons Attribution (CC BY) license (https://creativecommons.org/licenses/by/4.0/).