Abstract
In the Zeroud basin, a diverse array of methodologies were employed to assess, simulate, and predict the quality of groundwater intended for irrigation. These methodologies included the irrigation water quality indices (IWQIs); intricate statistical analysis involving multiple variables, supported with GIS techniques; an artificial neural network (ANN) model; and an XGBoost regression model. Extensive physicochemical examinations were performed on groundwater samples to elucidate their compositional attributes. The results showed that the abundance order of ions was Na+ > Ca2+ > Mg2+ > K+ and SO42− > HCO3− > Cl−. The groundwater facies reflected Ca-Mg-SO4, Na-Cl, and mixed Ca-Mg-Cl/SO4 water types. A cluster analysis (CA) and principal component analysis (PCA), along with ionic ratios, detected three different water characteristics. The mechanisms controlling water chemistry revealed water–rock interaction, dolomite dissolution, evaporation, and ion exchange. The assessment of groundwater quality for agriculture with respect IWQIs, such as the irrigation water quality index (IWQI), sodium adsorption ratio (SAR), sodium percentage (Na%), soluble sodium percentage (SSP), potential salinity (PS), and residual sodium carbonate (RSC), revealed that the domination of the water samples was valuable for agriculture. However, the IWQI and PS fell between high-to-severe restrictions and injurious-to-unsatisfactory. The ANN and XGBoost regression models showed robust results for predicting IWQIs. For example, ANN-HyC-9 emerged as the most precise forecasting framework according to its outcomes, as it showcased the most robust link between prime attributes and IWQI. The nine attributes of this model hold immense significance in IWQI prediction. The R2 values for its training and testing data stood at 0.999 (RMSE = 0.375) and 0.823 (RMSE = 3.168), respectively. These findings indicate that XGB-HyC-3 emerged as the most accurate forecasting model, displaying a stronger connection between IWQI and its exceptional characteristics. When predicting IWQI, approximately three of the model’s attributes played a pivotal role. Notably, the model yielded R2 values of 0.999 (RMSE = 0.001) and 0.913 (RMSE = 2.217) for the training and testing datasets, respectively. Overall, these results offer significant details for decision-makers in managing water quality and can support the long-term use of water resources.
1. Introduction
In Mediterranean semi-arid regions, which are distinguished by water resource scarcity and spatio-temporal climate variability, socioeconomic development is directly related to the availability of groundwater resources [1]. Nonetheless, the overexploitation of these resources in recent decades has increased the vulnerability of these important resources due to climate change and human activities [2]. Agricultural activities correspond to the primary uses of water resources in the world, which are greatly influenced by climate change, as well as demographic and socioeconomic factors [3]. This manifests as a significant decrease in surface drainage and groundwater recharge, as well as the degradation of water quality, increasing consumption conflicts, ecosystem degradation, and the salinization of groundwater in aquifers [4]. Thus, these negative impacts on water resources caused by climate change and human activity have led governments and international organizations to be convinced that they represent a threat to the environment and human health. Furthermore, numerous research studies have demonstrated that groundwater is one of the most sensitive systems, exhibiting the quantitative and qualitative impacts of climate change and anthropogenic activities on this resource [5,6]. As a result, research on the composition of groundwater in regional aquifers has increased significantly in recent years [7]. In this context, the Zeroud basin in Tunisia consists of heterogeneous sediments that host a complex aquifer system characterized by the superposition of several aquifer levels. Under the conditions of climate change, the groundwater resources of this aquifer system have become a major source of water for agriculture, drinking, and manufacturing processes. Consequently, the intensive exploitation of these resources has led to water deficit and groundwater quality deterioration in the studied region. No specific research studies have been conducted to assess the water quality of this aquifer system, which is affected by climate change and socio-economic activities. In contrast, previous studies have focused on the hydrodynamic functioning of the Zeroud aquifer system and the impact of dam water infiltration on the chemical composition of groundwater resources [2,7,8].
This situation has raised concerns relating to the deleterious effects on groundwater resources for the following reasons: (1) the rate of groundwater replenishment of the aquifer is not accurately determined; (2) the acute environmental damage related large-scale groundwater contamination puts a strain on the existing fresh water that supports regional development. To solve these issues, an original approach based on multivariate statistical analysis (cluster analysis (CA) and principal component analysis (PCA)), a quantitative method allowing for the classification of groundwater samples, was adopted to examine the correlations between physicochemical parameters, to assess the similarity between the studied groundwater samples, and to identify the potential processes that control groundwater mineralization [9,10]. In fact, CA, which has been utilized in several previous studies to assess groundwater chemistry, can provide reliable data for interpreting hydrochemical results. Moreover, PCA was utilized to identify mineralization processes, monitor geochemical composition, and evaluate groundwater quality [11,12].
The composition of groundwater results from prolonged interactions with its surroundings, and it is profoundly influenced by geological, climatic, and human factors [13,14]. The quality of groundwater is significantly affected by physicochemical patterns arising from geological settings and human practices [15]. Geological condition and anthropogenic processes like recharging, aquifer characteristics, contact time, and geochemical processes, such as mineral solubility, dissolution, and ion exchange, play pivotal roles in shaping the geochemical attributes of groundwater availability for irrigation [16,17,18]. Statistical analysis and imitative approaches, such as Piper diagrams, Gibbs diagrams, Chadha diagrams, and the ionic ratio are powerful and useful tools for evaluating the chemical characteristics of groundwater and the underlying factors [19,20,21,22]. Geochemical models are valuable in computing chemical reactions occurring in groundwater systems; comprehensive processes like solid dissolution and precipitation; ion exchange; and sorption by clay minerals [23,24,25,26,27,28]. Statistical correlation analysis, which establishes connections between various physicochemical factors, holds promise for advancing groundwater quality management. Moreover, integrated multivariate statistical approaches, such as CA and PCA, are powerful tools in identifying significant physicochemical characteristics and discerning relationships among these variables, contributing to a deeper understanding of the primary drivers influencing the distribution of physicochemical variables [15,24,29].
The preservation of irrigation water quality stands as a pivotal global research area, with numerous studies introducing hydrochemical indices for comprehensive evaluations. The utilization of irrigation water quality indices (IWQIs) has emerged as the preferred approach for assessing water quality and has been developed by different researchers [30,31]. These indices rely on the nature and concentration of salts in the water, with concerns related to water quality deterioration encompassing heightened salinity, reduced permeability, and exposure to highly toxic elements. A variety of methodologies have been performed to evaluate water quality for agriculture through the conversion of multiple physicochemical components into a single value that indicates the suitability of water quality for irrigation purposes [32,33]. Diverse investigations have utilized IWQIs alongside other indices like SAR, Na%, SSP, PS, and RSC to evaluate the effectiveness of using GW for irrigation [34,35]. Furthermore, geographic information systems (GIS) can play a key role in mitigating some of these challenges, particularly by combining water quality assessment methodologies with spatial analysis tools, thereby significantly enhancing the visualization of research findings [36].
Model-based feature selection approaches, such as the one mentioned, pinpoint a group of features that possess robust discriminative and predictive capabilities [37]. By eliminating superfluous features and curtailing overfitting, this approach can enhance model performance. Additionally, it retains the original feature representation, contributing to better interpretability [38]. Feature selection methods are becoming increasingly crucial for modeling and prediction [39]. Numerous studies have explored the application of diverse strategies for data dimensionality reduction. In the context of partial least square regression (PLSR) models, the importance of the feature is evident from the weighted regression coefficients assigned to each variable in the PLS model [40]. Both random forest (RF) and decision tree (DT) methodologies rank all variables in terms of their relevance [41]. Glorfeld [42] devised a back-propagation neural network index to pinpoint the most crucial variables. Moreover, the selection of hyperparameters exerts a significant impact on the efficacy of every machine learning (ML) model. This impact contains various advantages, such as the amplification of performance in ML algorithms [43], the establishment of consistent and equitable grounds for scientific investigations [44], and the potential to mold the predictive model through its potential influence on training algorithm behaviors [45]. Through the manipulation of hyperparameters, one holds the capacity to notably sway the precision of predicting quality parameters relevant to the subject variables.
The present study intends to provide useful scientific knowledge about the hydrodynamic functioning of the aquifer system and the dominant geochemical factors that influence groundwater chemical constituents in such a semi-arid region. In fact, the knowledge of groundwater hydrodynamics and dominant hydrochemical processes in this region can assist decision-makers when planning current and future water resource management practices. Therefore, particular emphasis will be placed on the following: (1) the geometry and structure of the hydrological system and its hydrodynamic operation, (2) the impact of natural and anthropogenic activities on groundwater quality, (3) the assessment of groundwater quality for agricultural uses, and (4) the identification of the accuracy and quantity of IWQIs for groundwater resources using the ANN and XGBoost models.
2. Methodology
2.1. Area of Investigation
The Zeroud basin covers an area of about 1500 square kilometers and is the largest basin on the Kairouan plain, Central Tunisia. The study area is bordered to the north by the Merguellil basin, to the west by the Drâa Affane, Siouf, and Cherahil mountain ranges, to the south by Sebkhet Mecherta, and to the east by Sebkhet Kelbia (Figure 1). The climate is semi-arid with high seasonal variations in climatic parameters. The rainy season lasts from October to March and rainfall varies widely, ranging from less than 200 to 500 mm. The average temperature is between 14 and 20 °C. The evaporation rate gradually increases from April, with an average of about 1600 mm. The surface water network consists mainly of the very old Zeroud river and its tributaries that correspond to river Hatob in the north and Wadi Hatab in the southern part. The latter flow from the surrounding highlands that culminate at 1350 m (a.s.l.), near the Algerian border toward Sebkhet Kelbia and Sebkhet Mecherta.

Figure 1.
Map of the study area and investigated groundwater samples (Zeroud plain, Central Tunisia).
2.2. Geology and Hydrogeology
The Zeroud Plain is part of the Eastern Tunisian Foreland [46]. The later is related to contractional deformation associated with eastward propagate thrusting (Figure 2a) [47,48,49]. The investigated area is characterized by geological formations belonging to the Triassic–Quaternary interval [50] (Figure 2a). The Triassic sediments, which occur mainly in the northeastern part of the plain consist of clay–silt–gypsum and dolomite. The Eocene–Oligocene deposits that cover the Triassic sediments are part of the Fortuna formation of the Cherahil and Siouf mountains and are composed of marl, gypsum, and sandstone. On the Fortuna Formation lie the Pliocene deposits, which correspond to limestone and marl found in the Draa Affane mountain, northwestern part of the Zeroud basin. The Quaternary sediments covering most of the plain consist mainly of alluvium and crustal limestone. These deposits are covered by eroded Quaternary crusts of varying thicknesses and consist mainly of coarse sands [51,52].
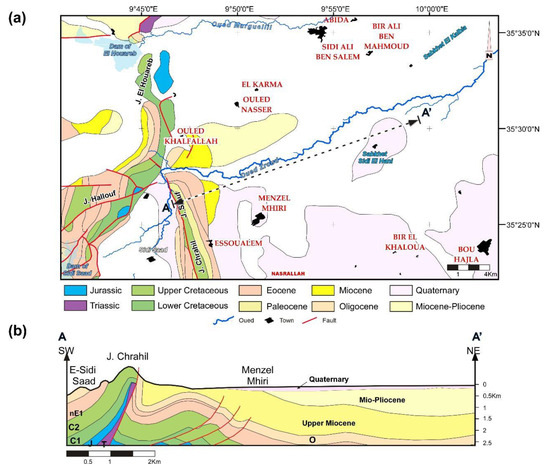
Figure 2.
(a) Geological map of the Zeroud plain, Tunisia; (b) schematic NE-trending geological cross-section across the Zeroud plain showing the geometry of the deep Mio-Plio-Quaternary basin.
Previous hydrogeological studies in the Zeroud basin have shown that Plio-Quaternary deposits encompass a relatively complex aquifer system hosting the major GW resources in central Tunisia [7,53,54,55]. These heterogeneous deposits, which are formed alternately by sandy silt, coarse sand, and gravel separated by levels of lenticular clay, host a multilayer and multi-productive aquifer system separated by impermeable lenticular levels of marl and clay (Figure 2b). Bel Haj Salem [7] showed the presence of nine saturated horizons separated by discontinuous layers of impermeable to semi-permeable deposits, which vary considerably in depth from 15 to 360 m. This may suggest hydrogeological continuity of the unconfined water table throughout the plain. On the other hand, the faults of Elhdadja and Sherahil in the western part of the study area have led to the structuring of the Zeroud basin in horst and graben, generating large variation in the thickness of the Plio-Quaternary aquifer levels and promoting vertical communication between the overlaying aquifer levels. The complexity of the structure and the geometry and lithology of this aquifer system have greatly influenced the hydrodynamic functioning of the different reservoir levels, highlighted through a lateral and vertical change in the hydrodynamic parameters, including permeability, porosity, storage coefficient, and hydraulic gradient.
2.3. Sampling and Analysis
During the present study, a total of 40 groundwater samples were collected in one week, during the dry season, for hydrochemical analyses (Figure 1) (the collection and analysis of the sample were performed in duplicate). Physicochemical variables such as temperature (T°C), pH, total dissolved solids (TDS), and electrical conductivity (EC) were determined in the field utilizing portable Consort C535 Multi-Parameter, allowing for temperature compensation and calibration with appropriate standards. The contents of major cations (Ca, Mg, Na, and K) were analyzed in filtered samples utilizing a High-Performance Liquid Chromatograph (HPLC) equipped with IC-PakTM CM/D columns, using nitric acid and EDTA as eluents. Anion content was determined utilizing a Metrohm liquid chromatograph equipped with CI SUPER-SEP columns, using acetonitric and phthalic acid as eluents. The limit of detection for overall ions was 0.04 mg/l. The total alkalinity (HCO3) was determined via titration with 0.1 HCl against methyl orange and bromocresol green indicators. Physicochemical analysis of the groundwater samples was conducted at the Laboratory of Radio-Analysis and Environment of the National Engineering School of Sfax, Tunisia. The major ion concentrations were converted to milliequivalents per liter, and the analytical accuracy of the measurements was about 5%. The ion charge balance error for all groundwater samples was less than 5%, which is within the acceptable limit.
2.4. Multivariate Statistical Analysis
Over the last few years, a wide range of multivariate statistical methods have been commonly used to study environmental and hydrogeological phenomena, especially those related to the assessment of groundwater quality [56]. During this research, CA and PCA, which were performed using STATISTICA software (version 8.0), were applied to investigate 40 groundwater samples.
2.4.1. Cluster Analysis (CA)
The utilization of CA for the study of water resources is a statistical method that is used to group water samples according to their properties [57,58]. It is a common method used to classify observations or variables into more or less homogeneous groups and to highlight their relationships. The cluster process, which is repeated until a single cluster that contains all variables is found, can be displayed in a tree structure called a dendrogram. Different groups of sampled boreholes can be generated by breaking down the dendrogram at different levels. Different levels of the dendrogram can be broken down to generate different groups of sampled boreholes that are based on the most significant chemical variables. This method is based on a calculation of similarity between two models using a distance measurement, of which the most popular is the Euclidean distance [59,60].
2.4.2. Principal Component Analysis (PCA)
The application of PCA in hydrochemical studies is an effective and valuable tool that can provide useful information on the complex associations and relationships between geochemical variables [61,62,63]. Moreover, the PCA method is performed for identifying and expressing similarities and differences, and aggregating samples according to their hydrochemical properties. Indeed, PCA uses factor analysis to identify the causes of changes in water quality by evaluating the variation in the various tested parameters [11,12]. The KMO and Bartlett’s tests were used to gauge the data’s suitability for factor analysis, evaluating the sample’s suitability for each individual variable in the model. KMO concentrations between 0.8 and 1, 0.5 and 0.8, and less than 0.5 were all considered to be suitable or desirable, respectively [64].
2.5. Indexing Approach
2.5.1. Chloro-Alkaline Indexes (CAIs)
The indexing approach can be used to identify the origin and the relationships between the major ions such as Ca + Mg − (Na + K) vs. (HCO3 − (SO4 + Cl), Ca + Mg vs. HCO3, Ca + Mg vs. HCO3 + SO4, and Mg/Na vs. Mg/Ca. Chloro-alkaline indexes (CAIs) are a tracer of cation exchange reactions that occur between GW and clayey minerals. There are two chloro-alkaline indexes (CAIs), CAI-I and CAI-II, that can be used to interpret cation exchange reactions. These indices are calculated according to formulas (1) and (2) using concentration, expressed in meq/L [65].
2.5.2. Irrigation Water Quality Indices (IWQIs)
The IWQIs are a set of physicochemical variables that are used to assess water quality by reducing the enormous amount of data into a simple and easy expression [15,66,67]. The IWQIs are valuable and highly useful indicators for the assessment and management of soil resources and agricultural production. In fact, irrigation water can affect soil properties and crop yields in a complex manner due to the multiple effects of water quality variables. The IWQI, SAR, Na%, SSP, PS, and RSC were calculated using the physicochemical characteristics for the GW samples, as given in Table 1.

Table 1.
The IWQIs, equations, and documented references.
To calculate the IWQI, the following equation was used to apply a non-dimensional scale with a range of 0−100 to the relationships between variables such as SAR, EC, Cl−, Na+, and HCO3− [34].
Specifically, Qi denotes the outcome of the quality measurement within the tolerance limits, and Wi denotes the weight of each variable (Table 2).
where Xinf: the value corresponding to the class’s lower limit, Xij: the observed value for each variable, Qimap: the class amplitude, and Xamp: the amplitude class that the variable falls within. Finally, the following equation (Equation (5)) was used to obtain the Wi values.
where i = the number of physicochemical parameters chosen by the model, ranging from 1 to n, j = the number of factors selected by the model between 1 and k, and F = the auto-value of component 1. A = the substantial ranged of parameter i by factor j.
Table 2.
The referenced limit of values for the variables used to calculate quality measurement (Qi).
2.6. Machine Learning Approaches
2.6.1. Back-Propagation neural network (BPNN)
An extensively utilized variant of synthetic neural networks is the backpropagation neural network (BPNN) structure [72]. Comprising three tiers, the BPNN includes the input layer responsible for supplying the network with data, the hidden layer situated between the input and output layers, and the output layer generating outcomes based on inputs. The artificial neural network represents a form of machine learning methodology that incorporates multiple tiers for deriving advanced attributes from raw input information. This network encompasses dual concealed layers, wherein the quantity of nodes is determined by the precision of regression. These submerged layers constitute the "activation" nodes and are commonly identified through their weights. The ANN configuration explores diverse options for the first and second hidden layers (ranging from 1 to 14), along with activation functions (‘identity’, ‘logistic’, ‘tanh’, and ‘relu’). The final layer showcases the anticipated value of the gauged parameter. Models of artificial neural networks are all-encompassing mathematical constructs that mimic human cognitive abilities in relation to recognizing and forecasting patterns, facilitated by an assembly of neurons or nodes linked via weighted associations [73,74].
The system underwent training for a minimum of 1000 rounds, or until the error measurement approached a value of 10−4. Employing the leave-one-out validation (LOOV) technique, the validation process was applied to the training dataset to ascertain the appropriate number of neurons in the concealed layer of this model. In consideration of memory limitations, the Broyden–Fletcher–Goldfarb–Shanno (lbfgs) optimizer was employed to enhance the speed of algorithmic execution [75]. The algorithm outlined in [76,77,78,79] was utilized to identify the most valuable attribute, which contributed to both heightened accuracy in predicting future outcomes within the regression model and a reduction in data dimensionality.
2.6.2. XGBoost Regression
A cutting-edge algorithm called XGBoost, recognized for its adept handling of sparsity, was proposed. It serves as an open-source tool tailored for approximate tree learning. This innovation, XGBoost, has demonstrated its prowess in diminishing computational expenses while elevating model performance [80]. Its popularity is widespread, and it has found applications across various domains [81,82]. In this investigation, data partitioning ensues through employment of the Python library sklearn. The consequential procedure entails training the XGBoost regression model on the training subset, gauging its efficacy on the validation subset, and subsequently employing it on the test subset to affirm the model’s performance [80]. The XGBoost regression model was configured with a range of hyperparameters to optimize its performance. The learning rates explored included 0.1, 0.01, and 0.001, affecting the rate at which the model adapts to the data. For the parameter estimators, which pertain to the number of boosting rounds, values were tested at 100, 500, and 1000. Additionally, the ‘max_depth’ parameter, which determines the maximum depth of each decision tree within the ensemble, was varied using values of 3, 5, 7, and 9. These comprehensive parameter combinations were systematically examined to find the optimal configuration for the XGBoost regression model.
2.7. Datasets and Software for Data Analysis and Processing
The SPSS software version 22 (Statistical Package for the Social Sciences) was used to conduct statistical analyses on the physicochemical traits and IWQIs. Chadha’s diagram was employed to identify the hydrogeochemical evolution and water types based on anion and cation compositions [83]. For anions and cations, the Gibbs graph is frequently used in OriginPro 2022 v. 9 to demonstrate the relationship between water chemistry and aquifer metric attributes [84,85]. CA and PCA were applied using statistical software (Version 8) to identify the essential components of groundwater and to improve assessments of water quality by condensing data analysis into observable patterns [86]. ArcGIS software version 10.5 was utilized to create spatial distribution maps via inverse distance-weighted (IDW) raster interpolation.
Approximately 40 groundwater samples were employed throughout both stages of training, cross-validation (CV), and validation. For the training and CV of the regression model, a subset of 32 samples, accounting for 80% of the total, was used. The remaining 28 instances, constituting 20%, were employed to assess the model’s performance. This assessment involved comparing forecasted values against computed values. Employing the leave-one-out cross-validation approach (LOOCV), the model underwent training and validation. In each iteration of LOOCV, the model utilized the remaining data for training while excluding one sample for validation. This method was adopted to mitigate overfitting tendencies, thus enhancing the accuracy of the model’s predictive prowess [18]. For all tasks encompassing data analysis, model construction, and data preparation, Python 3.7.3 was employed. Specifically, the BPNN and XGBoost modules within the Scikit-learn package version 0.20.2 were investigated for their applicability in regression tasks. The data were scrutinized using a system powered by an Intel Core i7-3630QM central processing unit clocked at 2.4 GHz, coupled with 8 GB of RAM. As seen in Figure 3, the suggested approach was composed of a sequence of sequential steps: (a) utilizing unique hydrogeochemical attributes as inputs for the XGBoost and ANN models, (b) partitioning the dataset and executing training using the LOOCV method, (c) assessing the effectiveness of the model, (d) adjusting the model’s hyperparameters to enhance its efficiency, (e) retaining the finest model and selecting the top-notch variables, and (f) generating predictions concerning groundwater quality markers.
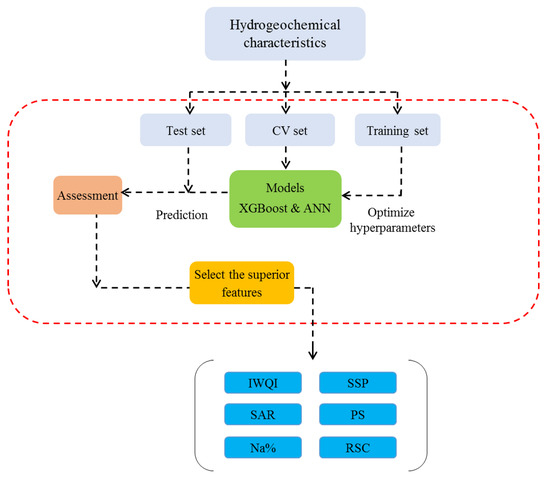
Figure 3.
Flowchart for the proposed method.
2.8. Model Evaluation
The assessment of a regression model’s performance involved the utilization of two metrics: the coefficient of determination (R2) and the root mean square error (RMSE), as outlined in references [87,88]. The ensuing list enumerates all the parameters under discussion: "Kact" signifies the empirically derived actual value, "Kp" stands for the forecasted or simulated value, "Kave" represents the mean value, and "N" denotes the total count of data points.
Root mean square error:
Coefficient of determination:
3. Results and Discussion
3.1. Groundwater Hydrochemical Properties
To characterize groundwater quality in the Zeroud basin, it is advantageous to classify the studied groundwater samples based on their physico-chemical parameters and ionic species, which were assessed according to the standard limits for irrigation water activities (Table 3) [89]. The Zeroud groundwater samples had pH values ranging from 6.7 to 7.73, with an average of 7.286, suggesting that the water samples were slightly alkaline and fell within the pH range of (6.5–8.4) recommended for irrigation purposes [89]. These slightly neutral to alkaline values of pH were probably due to the alteration of feldspars and some carbonated minerals [90]. The electrical conductivity (EC) values in the groundwater samples varied significantly from 1514.7 to 5185.9 μS.cm−1. The highest EC values, exceeding the standard limits for irrigation (3000 μS/cm), were recorded in the downstream part of the plain, reflecting the salt dissolution effect and/or the impact of anthropogenic activities, related to the return flow of contaminated irrigation water [91]. According to the TDS values, which varied from 969.43 to 3319 mg/L, about 75% of the groundwater samples were unsuitable for irrigation.
Table 3.
Results of the groundwater samples that are descriptive and include irrigation activity standard limit.
The relative order of major cation abundance was Na+, Ca2+, Mg2+, and K+, with averages of 356.7, 237.3, 99.03, and 13.43 mg/L, respectively. The most abundant anion was SO42−, followed by Cl− and HCO3−, with average contents of 764.2, 512.2, and 190.7 mg/L. These relatively high concentrations result mainly from water–rock interactions processes related to the dissolution of evaporated minerals and/or cation exchanges with clay minerals [7,92,93]. Furthermore, the high concentrations of SO42− and Ca2+ were closely related to the presence of an important component of recharge whereby sulphate enriches waters of the Sidi Saad dam.
The sodium concentration in groundwater varied between 99.86 and 663.8 mg/L, with an average of 357.77 mg/L, suggesting that all samples were below the FAO standard irrigation limit [91]. The sodium concentration were increased from the northwest to the east and the south of the Zeroud basin, which could induce long-term soil salinization and sodification risks. The potassium content in the studied groundwater ranged from 0.275 to 26.6 mg/L, with an average of 17.70 mg/L, highlighting that Zeroud groundwater is unsuitable for irrigation. High concentrations of potassium were recorded due to potash feldspar weathering and/or the use of chemical fertilizers in the form of NPK [94].
The calcium concentration in groundwater gradually increased from the east to the west towards the Sidi Saad dam, and varied considerably between 64.36 and 419.05 mg/L. According to irrigation standard limit [91], most of the groundwater samples had calcium levels that are very close to or above the threshold. These relatively important concentrations of calcium may be related to the dissolution of gypsum and the incongruent dissolution of dolomite, known as dedolomitization [95,96]. Indeed, when gypsum dissolves, calcium levels increase, resulting in a state of supersaturation compared to calcite and precipitation. The concentration of bicarbonate decreases as calcite precipitation progresses, resulting in greater saturation of groundwater compared to dolomite [97]. When these conditions are present, dolomite undergoes an incongruous dissolution, which is known as dedolomitization. The equation that describes the dedolomitization process is as follows:
Magnesium concentration, which significantly varied between 24.25 and 156.2 mg/L, increased from east to west in the study area, indicating that 92% of groundwater samples were above the FAO standard limit [91]. These relatively high concentration of magnesium in groundwater may be associated with dissociation of the ferromagnesian minerals and the cation exchange procedure. This may reflect a significant effect of residence time, which increases in the same direction as groundwater flow [93,96].
According to the bicarbonate concentration in the groundwater, which ranged from 97.6 to 323.3mg/L, all GW samples were within the satisfactory limit of for irrigation of about 610 mg/L. The Zeroud Plain aquifer’s groundwater had a chloride content that ranged from 149.8 to 512.2 mg/L. The chloride content of all the groundwater samples was below the standard limit for irrigation. The concentration of chloride was high in the vicinity of the discharge area due to the dissolution of halite (NaCl) and the mixing with water from Sebkhat Sidi Elhani, in the eastern part of the study area. Furthermore, confirmation of NaCl dissolution was provided by Na/Cl ratios close to 1 and the sub-saturation state of groundwater with respect to the halite mineral [98,99]. The sulphate contents in the groundwater varied from 206.9 to 1121.13 mg/L, with an average of 764.2 mg/L. About 25% of the groundwater samples had sulphate contents below the FAO standard limit and, about 75% of them were above the FAO standard limit [91]. The sulphate contents were caused by the dissolution of the gypsum (Equation (9)) and/or anhydrite (Equation (10)) minerals according to the following equations:
Physicochemical parameters are expressed in mg/L, except pH and EC (µS/cm). FAO *: Food and Agricultural Organization [91].
3.2. Groundwater Facies and Source Identification
3.2.1. Groundwater Type
Groundwater can be classified into different water facies by ranking ions according to their degree of domination. Various diagrams, including Piper’s, can be used to identify chemical water facies [22]. The Piper diagram made it possible to classify the groundwater of the Zeroud basin into two different chemical water-types, namely, Ca-Mg-SO4 and Na-Cl (Figure 4). These two water facies are distinguished primarily by their predominant anion proportions, particularly sulphate and chloride, contrarily to cations, where the majority of samples exhibit a general tendency towards the sodium pole. Some other groundwater samples are distinguished by a mixed water-type, which probably reflects the effect of the mixing between water masses from different origins related to the vertical mixing between superimposed aquifer levels [100]. Indeed, the overlying and underlying aquifer levels are separated by either semi-permeable levels or discontinuous layers of lenticular clay, generating vertical communication that affects the physicochemical properties of groundwater. However, the Gibbs diagram, which is widely used as a tool for studying the relationship between water chemistry and aquifer materials, revealed that most samples fell into the field of evaporation dominance, except only one sample, which was found to have rock weathering dominance (Figure 4b). These results indicate that groundwater composition was mainly governed by the contribution of solute-enriched water originating from the dissolution of evaporated minerals and the return of irrigation water [2,7,17]. However, these samples exhibit a tendency towards rock weathering at the pole, which reflects the impact of the cation exchange process.

Figure 4.
Groundwater types and geochemical control processes with respect to Piper diagram and Gibbs diagram: (a) TDS vs. Na/Na + Ca, and (b) TDS vs. Cl/Cl + HCO3.
3.2.2. Ion Exchange Processes
When clay minerals are relatively abundant in the aquifer system, ion exchange can play a crucial role as a process controlling GW mineralization. Indeed, clay minerals have a general tendency to equilibrate their electrostatic charge by fixing monovalent cations (Na+; K+) and releasing bivalent cations (Ca2+ and Mg2+), or vice versa. The plot of [(Ca2+ + Mg2+) – (Na++ K+)] vs. [HCO3− – (SO42– + Cl−)] shows that the majority of GW samples are placed in box D, indicating an inversely proportional relationship between bivalent and monovalent ions (Figure 5a). This may highlight the significant influence of ionic exchange on GW mineralization in the Zeroud basin [17,94]. Furthermore, the plots of (Ca2+ + Mg2+) versus HCO3− (Figure 5b), as well as (Ca2+ + Mg2+) versus (HCO3− + SO42–) (Figure 5c) show that the majority of Zeroud GW samples have excess calcium and magnesium compared to bicarbonate and sulphate (Figure 5d). This situation is related to the phenomenon of cation exchanges with clay minerals, which are relatively abundant in the studied aquifer system [101]. During this process, Ca2+ and Mg2+, which were previously adsorbed on the surface of clay minerals, exchanged the existing Na+ and K+ ions in groundwater. This ion exchange process occurs according to the following equations [7,93].
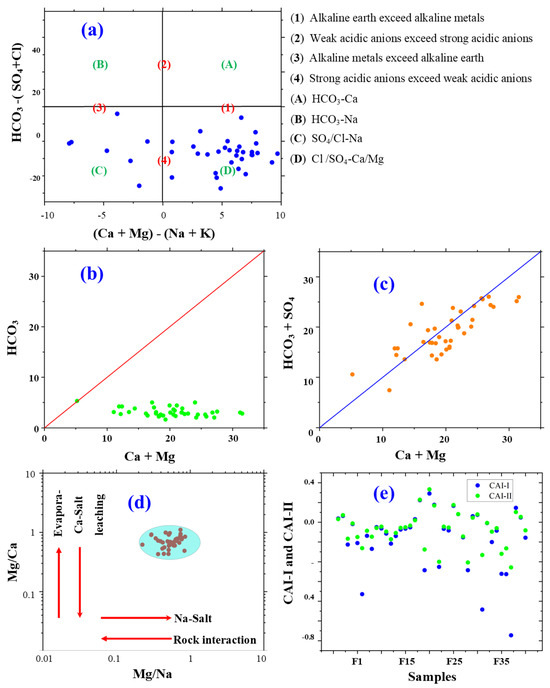
Figure 5.
The relationships between the main cations and anions for groundwater samples according to stoichiometry: (a) Ca + Mg − (Na + K) vs. (HCO3−(SO4 + Cl), (b) Ca + Mg vs. HCO3, (c) Ca + Mg vs. HCO3 + SO4, (d) Mg/Na vs. Mg/Ca, (e) samples vs. CAI-I and CAI-II.
Chlor-alkali was used to identify the ion exchange process between the minerals in the aquifer and the groundwater. In general, the CAI values, such as CAI-I and CAI-II, showed that the majority of the samples had a negatives value (Figure 5e), indicating that various cation exchanges occurred at these locations within the research region [102,103]. Additionally, the CAI values of several samples throughout this time were opposite, showing a significant tendency for cation interchange between K+ and Na+ in the study area’s groundwater and Mg2+ and Ca2+ in the surrounding rock.
3.3. Analysis of Multivariate Statistics
3.3.1. Cluster Analysis (CA)
The groundwater samples were classified into three different groups using a dendrogram of variables based on the concentration of major ions and TDS (Figure 6a). The first group (G1) characterizes the groundwater samples collected from the downstream part of the Sidi Saad dam, west of the Zeroud plain. The groundwater samples in this group have the highest concentration of HCO3−, Ca2+, Mg2+, and K+ and relatively lower SO42− content, highlighting the effect of dolomite dissolution and cation exchange with clayey mineral (Figure 6b).
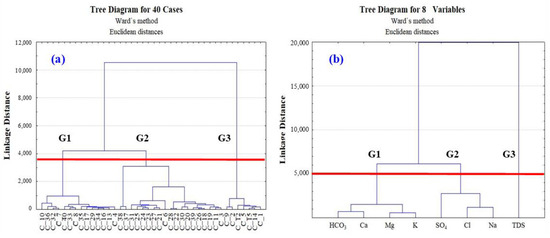
Figure 6.
Cluster dendrogram for variables. (a) 40 Cases, (b) 8 variables, G1 (group 1), G2 (group 2), G3 (group 3).
The groundwater samples of the second group (G2), which were collected from the central part of the study area, show the dominance of Na+, Cl−, SO42−, and TDS, suggesting that mineralization is strongly associated with the dissolution of evaporative minerals (halite, gypsum, and anhydrite) and the return flow of irrigation water. The third group that corresponds to the groundwater sampled from the southern part of the plain has the highest TDS values. This lends support to the combined effects of natural and anthropogenic mineralization processes, which increase towards the discharge areas.
3.3.2. Principal Component Analysis (PCA)
In order to assess whether the data could be utilized for PCA, the correlation matrix and Bartlett’s test of sphericity were applied. The resulting KMO value (0.571) was above 0.5, while the Bartlett’s test of sphericity value (0.000) was below 0.05. For factor analysis, which evaluates the sample adequacy for each individual variable in the model, the KMO and Bartlett’s tests are measurements of how suitable the data are. The correlation coefficients for the retained items were higher than 0.3. According to Mustapha et al. [104], correlation coefficients less than 0.3 and Bartlett’s test values greater than 0.05 were not taken into account.
PCA was applied to the Zeroud groundwater using eight physicochemical parameters, in particular, Na+, K+, Mg2+, Ca2+, Cl−, SO42−, HCO3−, and TDS (Figure 7). The first two factors (F1and F2) that display the most variance were preserved. These two factors explain 79.73% of the total variance, with 66.5% and 13.23% for F1 and F2, respectively. The factor F1 has a strong positive correlation with bicarbonates in the variable space, but it has a negative correlation with the rest of the major elements and TDS. This may reflect the relatively low salinity of groundwater samples corresponding to this factor. The Factor F2 exhibits strong positive correlations with Ca2+, Mg2+, SO42−, and TDS, indicating that the mineralization of these groundwater samples is mostly acquired through water–rock interaction processes (dissolution of sulphate minerals). By contrasting Ca2+ and Mg2+ with Na+ and K+, the F2 axis demonstrates that the ion exchange process has significantly influenced the chemical composition of the groundwater in the study area.
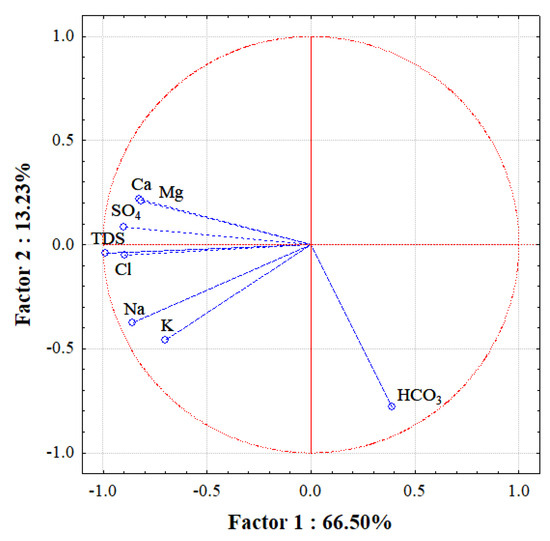
Figure 7.
Plots of PCA scores for F2 vs. F1.
3.4. Irrigation Water Quality Indices (IWQIs)
The assessment of agricultural soil water quality and its influence on crop quality necessitate the examination of several pivotal indicators. These indicators can encompass individual chemical markers [31,105] or a collective set of indicators [34,106]. By interpreting the outcomes derived from these indicators, decision-makers can formulate suitable strategies for the management of irrigation water. This is precisely the focus of the present study, which delves into the following indicators. The classification of water quality for irrigation purposes was executed based on established parameter value ranges, employing the six IWQIs, as outlined in Table 4.
Table 4.
Statistical analysis and IWQIs classification.
3.4.1. The IWQI Classification
The IWQI, derived using the equation presented in Table 1 [34], stands as a fundamental tool for assessing water quality within the study region. This index intricately quantifies the diverse facets of water composition that can significantly impact its suitability for agricultural irrigation. In this comprehensive evaluation, water quality is judiciously categorized into five distinct classes [91], each conveying specific implications for irrigation practices and soil health. These classes are thoughtfully apportioned across the dataset, yielding an intriguing distribution: 2.5% of samples reflected a lower irrigation restriction, 7.5% demonstrated moderate restriction, a substantial 45% exhibit high restriction, and an equivalent 45% portray severe restriction. This meticulously delineated distribution is vividly illustrated through Figure 8a, providing a visually captivating representation of the heterogeneous nature of water quality across the study area. The numeric values assigned to the IWQI encompass a remarkable span, ranging from 22.1 to 80.3, while the aggregate average is registered at 42.4. Such a diverse range of values underscores the multifaceted attributes contributing to water quality. Geospatial analysis (Figure 8a) accentuates the presence of distinct locales marked by compromised water quality, evoking concerns regarding its viability for irrigation endeavors and its potential ramifications for soil health. It is noteworthy that a substantial majority of the water samples, representing 90%, exhibit water quality levels that may be deemed unsuitable for irrigation purposes. This revelation holds profound significance, as these conditions bear the potential to exert detrimental effects on soil permeability, nutrient availability, and overall agricultural productivity. Consequently, innovative approaches for sustainable water management are imperative, aimed at mitigating negative impacts on soil integrity and enhancing the overall robustness of irrigation practices within the study region.
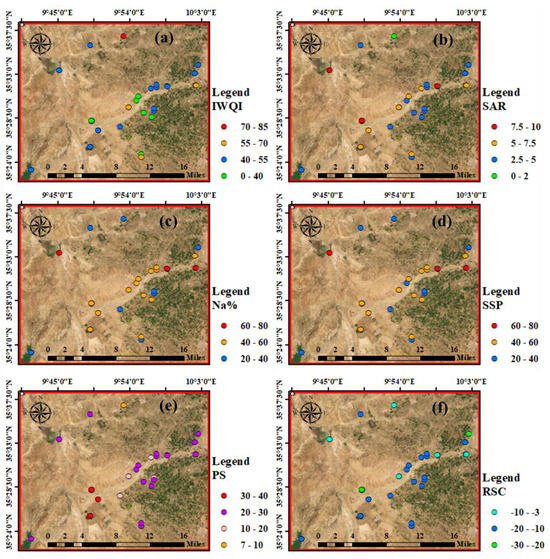
Figure 8.
Spatial distribution maps of IWQIs: (a) IWQI, (b) SAR, (c) Na%, (d) SSP, (e) PS, and (f) RSC.
3.4.2. Impact on Soil Composition
Irrigation water quality significantly shapes soil composition, exerting pronounced effects on permeability, filtration rate, and aeration due to its unique chemical attributes [107]. Among these, the concentration of sodium ions stands as particularly pivotal. Elevated levels of sodium disrupt soil filtration mechanisms, displacing calcium and magnesium ions through the process of adsorption [108]. In the endeavor to assess the aptness of water for irrigation, SAR, Na%, and SSP indicators emerge as valuable tools. These indices, meticulously computed by taking into account sodium, calcium, and magnesium concentrations, not only facilitate the identification of areas vulnerable to soil degradation but also offer a basis for informed soil management strategies.
For SAR, Na%, and SSP, the gamut of values is quite diverse. The minimum values recorded are 1.8, 28.6, and 28.2, respectively, while the upper limits peak at 8, 63.5, and 63. Remarkably, the average values for these indices manifest at 2.56, 28.29, and 27.57, sequentially. The classification derived from these indices offers intriguing insights: a striking 100% of the water samples find themselves within the excellent category. However, a nuanced exploration uncovers a vital detail: 7.5% of the water samples, pertaining to both Na% and SSP indices, exhibit a discernible deterioration in irrigation water quality (Figure 8b–d). These regions of concern predominantly emerge in the northeastern and northwestern sections of the study area. These locales, where water samples gravitate towards the doubtful and unsuitable classifications, raise pertinent questions about the feasibility of irrigation endeavors. This nuanced analysis underscores the dynamic interplay between irrigation water quality, soil integrity, and agricultural productivity. The intricate relationship between sodium levels and soil health underscores the need for tailored management approaches in specific regions to mitigate the negative impacts on soil structure and fertility.
3.4.3. Precipitation of Alkali Elements and RSC
Another pivotal facet exerting influence over irrigation water quality is the presence of excessive carbonates and bicarbonates in relation to divalent cations like Ca2⁺ and Mg2⁺ ions. This imbalance has the potential to precipitate alkali metals, primarily Ca2⁺ and Mg2⁺, which, in turn, can impede the quality of irrigation water. As a consequence of the precipitation of Ca2⁺ and Mg2⁺ ions as carbonate minerals, both the SAR value and sodium ion concentrations could experience elevation [70]. This phenomenon’s consequences resonate significantly, particularly in regions characterized by arid to semi-arid conditions. In such contexts, high RSC levels possess the inherent capability to disrupt the physical properties of soil. By promoting the dissociation of organic matter, the culmination of this process often manifests as a distinct black stain on the soil surface following desiccation [100,109]. In our study, the RSC was meticulously computed to gauge the potential precipitation of Ca2⁺ and Mg2⁺ on the particles of the soil surface. The significance of the RSC is well-established in regions marked by arid and semi-arid climates, as higher values correlate with soil sodification and salinization [110]. Our study revealed a noteworthy classification, denoted through Figure 8f, based on RSC values. Within this classification framework, irrigation water with an RSC exceeding 2.5 is deemed unsuitable for irrigation, while water with an RSC less than 1.25 is deemed suitable. A middle ground is carved for water presenting an RSC ranging from 1.25 to 2.5, rendering it doubtful for irrigation use [70]. The intriguing revelation of our study lies in the fact that all groundwater samples showcased an RSC value below the threshold of 1.25. This collective observation resoundingly underscores the suitability and safety of GW for irrigation purposes.
3.4.4. Potential Salinity Index (PS)
The evaluation of irrigation water’s suitability for agricultural lands hinges on the PS, a parameter computed based on chloride and sulfate ion concentrations [71]. The PS index classification system stratifies values into tiers: Excellent-to-good (PS < 3.0), good-to-injurious (PS = 3.0–5.0), and injurious-to-unsatisfactory (PS > 5.0). Examining the PS index outcomes reveals a noteworthy trend: every single water sample, constituting the entire dataset at 100%, falls within the category deemed injurious-to-unsatisfactory (Figure 8e). This observation carries implications far beyond water quality alone; it heralds potential negative ramifications for soil structure, nutrient availability, and agricultural productivity. The repercussions of such a classification necessitate thoughtful intervention strategies to ensure sustainable soil and water management. The cumulative effect of utilizing water samples with injurious-to-unsatisfactory PS index values can lead to compromised soil health, reduced crop yield, and hindered agricultural sustainability. To address this, it is paramount to implement tailored management practices that strike a balance between irrigation efficiency and soil fertility preservation. Incorporating measures such as improved irrigation scheduling, the adoption of water-saving techniques, and the judicious use of soil amendments can mitigate the adverse impact of unsuitable irrigation water on soil quality. Furthermore, robust monitoring systems and the regular assessment of water sources can aid in identifying changes in water quality, enabling timely adjustments to irrigation practices. By proactively addressing the challenges posed by water with high PS index values, agricultural stakeholders can safeguard both soil productivity and long-term environmental sustainability.
3.5. Machine Learning Models
Table 5 and Figure 9 illustrate the amalgamation of the analyzed hydrogeochemical traits (HyC), finest parameters, and outputs from the ANN model concerning RMSE and R2. This amalgamation was achieved through the training, CV, and assessment of the test dataset, all aimed at evaluating groundwater quality. These factors achieved excellent scores in evaluating the criteria being examined. Utilizing the distinctive traits of the super elements (independent variables) during neural network training enabled precise anticipation of the examined parameters (dependent variable). The ANN-HyC-9 emerged as the most precise forecasting framework according to its outcomes, as it showcased the most robust link between prime attributes and IWQI. The nine attributes of this model hold immense significance in IWQI forecasting. The R2 values for its training and testing data stood at 0.999 (RMSE = 0.375) and 0.823 (RMSE = 3.168), respectively. The ANN-HyC-3 system demonstrated superior performance in assessing SAR. The R2 scores obtained from both the training and testing datasets were exceptionally high, registering at 0.999 (with an accompanying RMSE of 0.003) and 0.999 (while maintaining an RMSE of 0.005), correspondingly. The ANN-HyC-6 framework exhibited the highest precision in identifying Na%, as evidenced by an R2 value of 0.999 (with a corresponding RMSE of 0.015) for the training set and 0.999 (with a corresponding RMSE of 0.167) for the testing set. The ANN-HyC-3 framework exhibited superior performance compared to the rest in forecasting SSP. This particular model attained an R2 value of 0.999 (with a RMSE of 0.023) for the training set, and an equally remarkable R2 value of 0.999 (with a RMSE of 0.056) for the test set. The ANN-HyC-3 model for PS projection surpassed expectations, achieving a remarkable R2 value of 0.999 (RMSE = 0.003) for both the training and test sets. The ANN-HyC-4 model surpassed expectations in projecting RSC, achieving an R2 value of 0.999 (RMSE = 0.003) for training and testing. As per studies [103,111], there was an enhancement in the anticipated outcome. To enhance the resilience of regression algorithms for prediction, multiple measures were required throughout the training process. These included the refinement of advanced features and the adjustment of model hyperparameters.
Table 5.
Outcomes of ANN model based on hydrogeochemical characteristics.
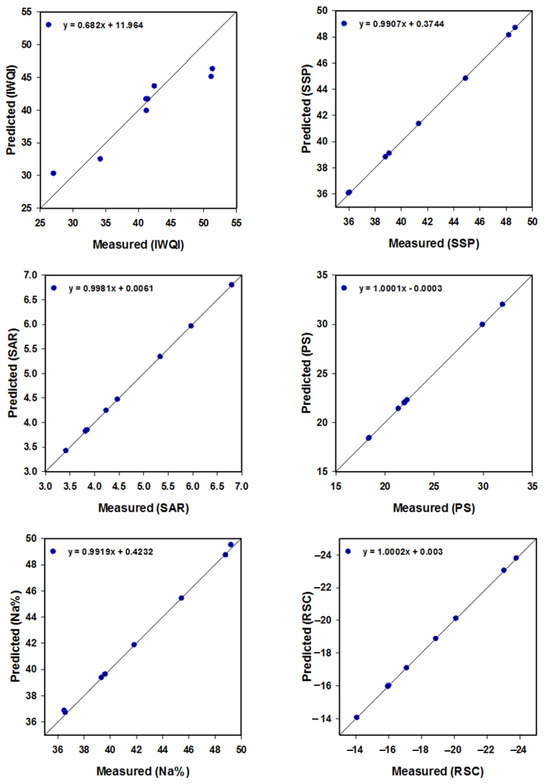
Figure 9.
Relationships between employing the ANN models to measure and validate output datasets (IWQI, SAR, Na%, SSP, PS, and RSC).
In Table 5, h1 and h2 denote the quantity of neurons present within the two concealed layers, and Fn signifies the activation function employed.
As presented in Table 6 and Figure 10, the utilization of the XGBoost model involved the application of hydrogeochemical attributes to screen the elevated-level variables. These particular attributes proved instrumental in the determination of groundwater quality, encompassing IWQI, SAR, Na%, SSP, PS, and RSC. The tabulated information in Table 6 visually represents the integration of hydrogeochemical elements into the training process of the XGBoost model, enabling the prediction of the investigated parameters. These findings indicate that XGB-HyC-3 emerged as the most accurate forecasting model, displaying a stronger connection between IWQI and its exceptional characteristics. In prognosticating IWQI, approximately three of the model’s attributes played a pivotal role. Notably, the model yielded R2 values of 0.999 (RMSE = 0.001) and 0.913 (RMSE = 2.217) for the training and testing datasets, correspondingly. The top-performing model for SAR measurement was XGB-HyC-3. In terms of R2 scores, it achieved 0.999 (RMSE = 0.039) during training and 0.888 (RMSE = 0.371) during testing. Regarding precision, the XGB-HyC-2 model outshone its counterparts in predicting Na%. The model achieved an R2 score of 0.999 for the training dataset and 0.786 for the testing dataset (accompanied by RMSE values of 0.001 and 2.212, sequentially). The XGB-HyC-2 model exhibited superior performance in forecasting SSP. It achieved an R2 score of 0.999 (with an RMSE of 0.001) during training and 0.803 (with an RMSE of 2.118) during testing. The XGB-HyC-4 model demonstrated remarkable precision in predicting PS. It displayed strong performance, with R2 values of 0.999 and 0.689 for the training and testing sets, along with RMSE values of 0.031 and 2.615, respectively. The XGB-HyC-2 model outperformed the other models in forecasting RSC, displaying strong results, with R2 values of 0.999 and 0.874 for the training and testing sets. The associated RMSE values were 0.002 and 1.161.
Table 6.
Outcomes of XGBoost model based on hydrogeochemical characteristics.
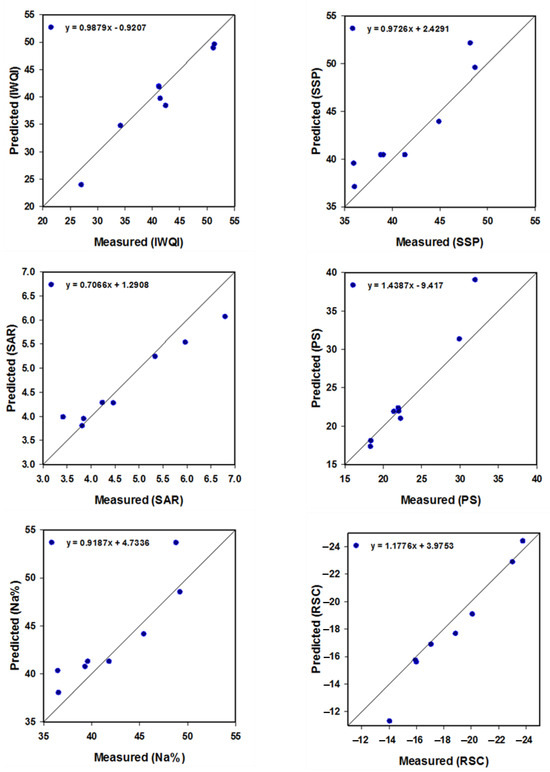
Figure 10.
Relationships between employing the XGBoost models to measure and validate output datasets (IWQI, SAR, Na%, SSP, PS, and RSC).
In Table 6, LR influences the rate of convergence, Ne determines the count of boosting trees, and Md specifies the depth of each tree.
4. Conclusions
The evaluation of water quality assumes paramount significance in the proficient management of water reservoirs, ascertaining their appropriateness for both human utilization and environmental stability. The outcomes of this study demonstrated that the sequence of ion abundance was Na+ > Ca2+ > Mg2+ > K+ and SO42− > HCO3− > Cl−. The identified water classifications included Ca-Mg-SO4, Na-Cl, and a hybrid of Ca-Mg-Cl/SO4. CA and PCA, coupled with ionic ratios, discerned three distinct water profiles. The underlying mechanisms steering water chemistry encompassed interactions between water and rocks, the dissolution of dolomite, evaporation, ion exchange, and human-induced activities. The appraisal of groundwater quality for irrigation, predicated based on indices, such as IWQI, SAR, Na%, SSP, PS, and RSC, unveiled that a substantial proportion of the water samples met acceptable standards. Nevertheless, the IWQI and PS values exhibited high-to-severe constraints, which ranged from injurious-to-unsatisfactory levels. This research contributes novel insights to the realm of groundwater quality assessment for irrigation in the Zeroud basin, Tunisia.
This innovative utilization of a combination of advanced methodologies, including WQIs, intricate statistical analyses, GIS integration, and ANN and XGBoost implementation, provides a comprehensive and multifaceted perspective on groundwater quality dynamics. Furthermore, the identification of distinctive water classifications, the elucidation of underlying mechanisms, and the comprehensive evaluation of irrigation-related indices collectively offer valuable contributions to the understanding of water quality management in similar geographical contexts. This study serves as a foundation for sustainable water resource management and informs potential interventions to ensure both human and environmental welfare.
Author Contributions
Conceptualization, S.B.H.S., M.H.E., M.R.A., A.M.E.-S. and M.G.; fieldwork, S.B.H.S., A.G., I.B.S. and A.B.M.; software, M.H.E., M.R.A., A.M.E.-S., M.F., O.E., S.E., S.B., H.I. and M.G.; validation, K.Z., A.M.E.-S., M.F., O.E., S.E., S.B., H.I. and M.G.; formal analysis S.B.H.S., A.G., I.B.S., A.B.M. and K.Z.; investigation, S.B.H.S., A.G., I.B.S., A.B.M. and K.Z.; resources, M.H.E., M.R.A., A.M.E.-S., S.B. and M.G.; data curation, S.B., H.I. and M.G.; writing—original draft preparation, M.H.E., M.R.A., A.M.E.-S., A.G. and M.G.; writing—review and editing, K.Z., A.G., M.H.E., M.G., K.K.Y. and S.E.; supervision, S.B., M.R.A., M.G. and S.E.; project administration, S.B.H.S. All authors have read and agreed to the published version of the manuscript.
Funding
This work was funded by King Saud University through the Researchers Supporting Project (number RSP2023R133), King Saud University, Riyadh, Saudi Arabia.
Institutional Review Board Statement
Not applicable.
Informed Consent Statement
Not applicable.
Data Availability Statement
All data are provided in the tables and figures.
Acknowledgments
The authors extend their thanks to Mohamed Gharbi for his cooperation and scientific discussion. The authors extend their appreciation to King Saud University for funding this work through the Researchers Supporting Project (number RSP2023R133), King Saud University, Riyadh, Saudi Arabia.
Conflicts of Interest
The authors declare that they have no known competing financial interest or personal relationships that could have appeared to influence the work reported in this paper.
References
- Tramblay, Y.; Koutroulis, A.; Samaniego, L.; Vicente-Serrano, S.M.; Volaire, F.; Boone, A.; Le Page, M.; Llasat, M.C.; Albergel, C.; Burak, S.; et al. Challenges for drought assessment in the Mediterranean region under future climate scenarios. Earth-Sci. Rev. 2020, 210, 103348. [Google Scholar] [CrossRef]
- Derwich, L.J.; Zouar, K.; Michelot, J.L. Recharge and paleorecharge of the deep groundwater aquifer system in the Zeroud Basin (Kairouan plain, Central Tunisia). Quat. Int. 2012, 257, 56–63. [Google Scholar] [CrossRef]
- Alexakis, D.E. Meta-Evaluation of Water Quality Indices. Application into Groundwater Resources. Water 2020, 12, 1890. [Google Scholar] [CrossRef]
- Ismail, E.; Snousy, M.G.; Alexakis, D.E.; Gamvroula, D.E.; Howard, G.; El Sayed, E.; Ahmed, M.S.; Ali, A.; Abdelhalim, A. Multivariate Statistical Analysis and Geospatial Mapping for Assessing Groundwater Quality in West El Minia District, Egypt. Water 2023, 15, 2909. [Google Scholar] [CrossRef]
- Biswas, M.R.; Alzubaidi, M.S.; Shah, U.; Abd-Alrazaq, A.A.; Shah, Z. A Scoping Review to Find out Worldwide COVID-19 Vaccine Hesitancy and Its Underlying Determinants. Vaccines 2021, 9, 1243. [Google Scholar] [CrossRef] [PubMed]
- Ismail, E.; Snousy, M.G.; Alexakis, D.E.; Abdelhalim, A.; Ahmed, M.S.; Elsayed, E. Diagnosis of Groundwater Quality in North Assiut Province, Egypt, for Drinking and Irrigation Uses by Applying Multivariate Statistics and Hydrochemical Methods. Water 2023, 15, 2812. [Google Scholar] [CrossRef]
- Salem, S.B.H.; Chkir, N.; Zouari, K.; Cognard-Plancq, A.L.; Valles, V.; Marc, V. Natural and artificial recharge investigation in the Zéroud Basin, Central Tunisia: Impact of Sidi Saad Dam storage. Environ. Earth Sci. 2011, 66, 1099–1110. [Google Scholar] [CrossRef]
- Gaagai, A.; Boudoukha, A.; Benaabidate, L. Failure Simulation of Babar Dam–Algeria and Its Impact on the Valley Downstream Section. J. Water Land Dev. 2020, 44, 75–89. [Google Scholar] [CrossRef]
- Meng, S.X.; Maynard, J. Use of statistical analysis to formulate conceptual models of geochemical behavior: Water chemical data from the Botucatu aquifer in São Paulo state, Brazil. J. Hydrol. 2001, 250, 78–97. [Google Scholar] [CrossRef]
- Farnham, I.M.; Johannesson, K.H.; Singh, A.K.; Hodge, V.F.; Stetzenbach, K.J. Factor analytical approaches for evaluating groundwater trace element chemistry data. Anal. Chim. Acta 2003, 490, 123–138. [Google Scholar] [CrossRef]
- Roubil, A.; El Ouali, A.; Bülbül, A.; Lahrach, A.; Mudry, J.; Mamouch, Y.; Essahlaoui, A.; El Hmaidi, A.; El Ouali, A. Groundwater Hydrochemical and Isotopic Evolution from High Atlas Jurassic Limestones to Errachidia Cretaceous Basin (Southeastern Morocco). Water 2022, 14, 1747. [Google Scholar] [CrossRef]
- Lu, Y.; Tang, C.; Chen, J.; Chen, J. Groundwater Recharge and Hydrogeochemical Evolution in Leizhou Peninsula, China. J. Chem. 2015, 2015, 1–12. [Google Scholar] [CrossRef]
- Yang, M.; Zhao, A.; Ke, H.; Chen, H. Geo-Environmental Factors’ Influence on the Prevalence and Distribution of Dental Fluorosis: Evidence from Dali County, Northwest China. Sustainability 2023, 15, 1871. [Google Scholar] [CrossRef]
- Kumar, P.J.S.; James, E.J. Geostatistical and geochemical model-assisted hydrogeochemical pattern recognition along the groundwater flow paths in Coimbatore district, South India. Environ. Dev. Sustain. 2017, 21, 369–384. [Google Scholar] [CrossRef]
- Gaagai, A.; Boudoukha, A.; Boumezbeur, A.; Benaabidate, L. Hydrochemical characterization of surface water in the Babar watershed (Algeria) using environmetric techniques and time series analysis. Int. J. River Basin Manag. 2017, 15, 361–372. [Google Scholar] [CrossRef]
- Shakeri, A.; Ghoreyshinia, S.; Mehrabi, B. Surface and Groundwater Quality in Taftan Geothermal Field, SE Iran. Water Qual. Expo. Heal. 2014, 7, 205–218. [Google Scholar] [CrossRef]
- Gad, M.; El-Hendawy, S.; Al-Suhaibani, N.; Tahir, M.U.; Mubushar, M.; Elsayed, S. Combining Hydrogeochemical Characterization and a Hyperspectral Reflectance Tool for Assessing Quality and Suitability of Two Groundwater Resources for Irrigation in Egypt. Water 2020, 12, 2169. [Google Scholar] [CrossRef]
- Elsayed, S.; Hussein, H.; Moghanm, F.S.; Khedher, K.M.; Eid, E.M.; Gad, M. Application of Irrigation Water Quality Indices and Multivariate Statistical Techniques for Surface Water Quality Assessments in the Northern Nile Delta, Egypt. Water 2020, 12, 3300. [Google Scholar] [CrossRef]
- Zhai, Y.; Zheng, F.; Zhao, X.; Xia, X.; Teng, Y. Identification of hydrochemical genesis and screening of typical groundwater pollutants impacting human health: A case study in Northeast China. Environ. Pollut. 2019, 252, 1202–1215. [Google Scholar] [CrossRef] [PubMed]
- Zhang, J.; Du, D.; Ji, D.; Bai, Y.; Jiang, W. Multivariate Analysis of Soil Salinity in a Semi-Humid Irrigated District of China: Concern about a Recent Water Project. Water 2020, 12, 2104. [Google Scholar] [CrossRef]
- Liu, S.; Li, H.; Yang, J.; Ma, M.; Shang, J.; Tang, Z.; Liu, G. Using Self-Organizing Map and Multivariate Statistical Methods for Groundwater Quality Assessment in the Urban Area of Linyi City, China. Water 2023, 15, 3463. [Google Scholar] [CrossRef]
- Piper, A.M. A graphic procedure in the geochemical interpretation of water-analyses. Eos Trans. Am. Geophys. Union 1944, 25, 914–928. [Google Scholar] [CrossRef]
- Gad, M.; Saad, A. Hydrogeochemical evaluation of fractured Limestone aquifer by applying a geochemical model in eastern Nile Valley, Egypt. Environ. Earth Sci. 2017, 76, 1–11. [Google Scholar] [CrossRef]
- Parra, V.; Muñoz, E.; Arumí, J.L.; Medina, Y. Analysis of the Behavior of Groundwater Storage Systems at Different Time Scales in Basins of South Central Chile: A Study Based on Flow Recession Records. Water 2023, 15, 2503. [Google Scholar] [CrossRef]
- Al-Ruwaih, F.M. Hydrogeology and Groundwater Geochemistry of the Clastic Aquifer and Its Assessment for Irrigation, Southwest Kuwait. In Aquifers–Matrix and Fluids; IntechOpen Limited: London, UK, 2018. [Google Scholar] [CrossRef]
- Flores, Y.G.; Eid, M.H.; Szűcs, P.; Szőcs, T.; Fancsik, T.; Szanyi, J.; Kovács, B.; Markos, G.; Újlaki, P.; Tóth, P.; et al. Integration of Geological, Geochemical Modelling and Hydrodynamic Condition for Understanding the Geometry and Flow Pattern of the Aquifer System, Southern Nyírség–Hajdúság, Hungary. Water 2023, 15, 2888. [Google Scholar] [CrossRef]
- Al-Mashreki, M.H.; Eid, M.H.; Saeed, O.; Székács, A.; Szűcs, P.; Gad, M.; Abukhadra, M.R.; AlHammadi, A.A.; Alrakhami, M.S.; Alshabibi, M.A.; et al. Integration of Geochemical Modeling, Multivariate Analysis, and Irrigation Indices for Assessing Groundwater Quality in the Al-Jawf Basin, Yemen. Water 2023, 15, 1496. [Google Scholar] [CrossRef]
- Eid, M.H.; Elbagory, M.; Tamma, A.A.; Gad, M.; Elsayed, S.; Hussein, H.; Moghanm, F.S.; Omara, A.E.-D.; Kovács, A.; Péter, S. Evaluation of Groundwater Quality for Irrigation in Deep Aquifers Using Multiple Graphical and Indexing Approaches Supported with Machine Learning Models and GIS Techniques, Souf Valley, Algeria. Water 2023, 15, 182. [Google Scholar] [CrossRef]
- Athamena, A.; Menani, M.R. Nitrogen flux and hydrochemical characteristics of the calcareous aquifer of the Zana plain, north east of Algeria. Arab. J. Geosci. 2018, 11, 356. [Google Scholar] [CrossRef]
- Aravinthasamy, P.; Karunanidhi, D.; Rao, N.S.; Subramani, T.; Srinivasamoorthy, K. Irrigation risk assessment of groundwater in a non-perennial river basin of South India: Implication from irrigation water quality index (IWQI) and geographical information system (GIS) approaches. Arab. J. Geosci. 2020, 13, 1–14. [Google Scholar] [CrossRef]
- Kawo, N.S.; Karuppannan, S. Groundwater quality assessment using water quality index and GIS technique in Modjo River Basin, central Ethiopia. J. Afr. Earth Sci. 2018, 147, 300–311. [Google Scholar] [CrossRef]
- Nagaraju, A.; Muralidhar, P.; Sreedhar, Y. Hydrogeochemistry and Groundwater Quality Assessment of Rapur Area, Andhra Pradesh, South India. J. Geosci. Environ. Prot. 2016, 04, 88–99. [Google Scholar] [CrossRef]
- El Osta, M.; Hussein, H.; Tomas, K. Numerical Simulation of Groundwater Flow and Vulnerability in Wadi El-Natrun Depression and Vicinities, West Nile Delta, Egypt. J. Geol. Soc. India 2018, 92, 235–247. [Google Scholar] [CrossRef]
- Meireles, A.C.M.; de Andrade, E.M.; Chaves, L.C.G.; Frischkorn, H.; Crisostomo, L.A. A new proposal of the classification of irrigation water. Rev. Ciência Agronômica 2010, 41, 349–357. [Google Scholar] [CrossRef]
- Gharbi, A.; Ibn Ali, Z.; Zairi, M. Groundwater suitability for drinking and agriculture purposes using irrigation water quality index and multivariate analysis: Case of Sidi Bouzid aquifer, central Tunisia. Environ. Earth Sci. 2019, 78, 692. [Google Scholar] [CrossRef]
- Khouni, I.; Louhichi, G.; Ghrabi, A. Use of GIS based Inverse Distance Weighted interpolation to assess surface water quality: Case of Wadi El Bey, Tunisia. Environ. Technol. Innov. 2021, 24, 101892. [Google Scholar] [CrossRef]
- Beltrán, N.; Duarte-Mermoud, M.; Salah, S.; Bustos, M.; Peña-Neira, A.; Loyola, E.; Jalocha, J. Feature selection algorithms using Chilean wine chromatograms as examples. J. Food Eng. 2005, 67, 483–490. [Google Scholar] [CrossRef]
- Guyon, I.; Elisseeff, A. An Introduction to Variable and Feature Selection. J. Mach. Learn. Res. 2003, 3, 1157–1182. [Google Scholar]
- Schulze, F.; Wolf, H.; Jansen, H.; van der Veer, P. Applications of artificial neural networks in integrated water management: Fiction or future? Water Sci. Technol. 2005, 52, 21–31. [Google Scholar] [CrossRef] [PubMed]
- ElMasry, G.; Sun, D.-W.; Allen, P. Near-infrared hyperspectral imaging for predicting colour, pH and tenderness of fresh beef. J. Food Eng. 2012, 110, 127–140. [Google Scholar] [CrossRef]
- Strobl, C.; Boulesteix, A.-L.; Kneib, T.; Augustin, T.; Zeileis, A. Conditional variable importance for random forests. BMC Bioinform. 2008, 9, 307. [Google Scholar] [CrossRef]
- Glorfeld, L.W. A Methodology for simplification and interpretation of backpropagation-based neural network models. Expert Syst. Appl. 1996, 10, 37–54. [Google Scholar] [CrossRef]
- Melis, G.; Dyer, C.; Blunsom, P. On the State of the Art of Evaluation in Neural Language Models. arXiv 2017. [Google Scholar] [CrossRef]
- Bergstra, J.; Yamins, D.; Cox, D. Making a Science of Model Search: Hyperparameter Optimization in Hundreds of Dimensions for Vision Architectures. In Proceedings of the International Conference on Machine Learning, PMLR, Atlanta, GA, USA, 17–19 June 2013; pp. 115–123. [Google Scholar]
- Wu, J.; Chen, X.-Y.; Zhang, H.; Xiong, L.-D.; Lei, H.; Deng, S.-H. Hyperparameter optimization for machine learning models based on Bayesian optimization b. J. Electron. Sci. 2019, 17, 26–40. [Google Scholar] [CrossRef]
- Khomsi, S.; Ben Jemia, M.G.; de Lamotte, D.F.; Maherssi, C.; Echihi, O.; Mezni, R. An overview of the Late Cretaceous–Eocene positive inversions and Oligo-Miocene subsidence events in the foreland of the Tunisian Atlas: Structural style and implications for the tectonic agenda of the Maghrebian Atlas system. Tectonophysics 2009, 475, 38–58. [Google Scholar] [CrossRef]
- Soumaya, A.; Ben Ayed, N.; Delvaux, D.; Ghanmi, M. Spatial variation of present-day stress field and tectonic regime in Tunisia and surroundings from formal inversion of focal mechanisms: Geodynamic implications for central Mediterranean. Tectonics 2015, 34, 1154–1180. [Google Scholar] [CrossRef]
- Gharbi, M.; Bellier, O.; Masrouhi, A.; Espurt, N. Recent spatial and temporal changes in the stress regime along the southern Tunisian Atlas front and the Gulf of Gabes: New insights from fault kinematics analysis and seismic profiles. Tectonophysics 2014, 626, 120–136. [Google Scholar] [CrossRef]
- Bahrouni, N.; Bouaziz, S.; Soumaya, A.; Ben Ayed, N.; Attafi, K.; Houla, Y.; El Ghali, A.; Rebai, N. Neotectonic and seismotectonic investigation of seismically active regions in Tunisia: A multidisciplinary approach. J. Seism. 2013, 18, 235–256. [Google Scholar] [CrossRef]
- Bédir, M. Mécanismes Géodynamiques Des Bassins Associés Aux Couloirs de Coulissements de La Marge Atlasique de La Tunisie: Seismo-Stratigraphie, Séismo-Tectonique et Implications Pétrolières. Ph.D. Thesis, Faculté des Sciences Mathématiques, Physiques et Naturelles de Tunis, Tunis, Tunisia, 1995. [Google Scholar]
- Lachaal, F.; Azaiez, H.; Bruni, R.; Gabtni, H.; Bedir, M. Aquifer Structuring and Hydrogeological Investigation in North African Regions Using Geophysical Methods: Case Study of the Aquifer System in the Kairouan Plain (Central Tunisia). In Geology of North Africa and the Mediterranean: Sedimentary Basins and Georesources; Springer: Cham, Switzerland, 2023; pp. 247–260. [Google Scholar] [CrossRef]
- Bédir, M.; El Asmi, A.M. New insights into Upper Cretaceous hydrocarbon traps of platform-basin flanks in the Sahel Eastern Tunisian petroleum province: Inferred optimal hydrocarbon reserves accumulations. J. Pet. Sci. Eng. 2023, 220. [Google Scholar] [CrossRef]
- Nazoumou, Y. Modélisation de La Recharge Artificielle Des Nappes de La Plaine de Kairouan. Ph.D. Thesis, Ecole Nationale d’Ingénieurs de Tunis, Tunis, Tunisia, 1996. [Google Scholar]
- Castany, G.; Mathieu, G. Les Fosses d’effondrement de Tunisie: Géologie & Hydrologie. In Régence de Tunis (Protectorat Français), Direction des Travaux Publics; Impr. S.A.P.I. Tunis: Tunis, Tunisia, 1948. [Google Scholar]
- Besbes, M. Etude Hydrogéologique de La Plaine de Kairouan Sur Modèles Mathématiques.; DRE: Tunis, Tunisia, 1975. [Google Scholar]
- Chaudhry, A.K.; Kumar, K.; Alam, M.A. Groundwater contamination characterization using multivariate statistical analysis and geostatistical method. Water Supply 2019, 19, 2309–2322. [Google Scholar] [CrossRef]
- Kumar, S.; Kumar, A.; Jha, P.V.N.; Sahoo, S.K.; Ranjan, R.K. Groundwater quality and its suitability for drinking and irrigational purpose in Bhojpur district: Middle Gangetic plain of Bihar, India. Water Supply 2022, 22, 7072–7084. [Google Scholar] [CrossRef]
- Gaagai, A. Etude de l’évolution de la qualité des eaux du barrage de Babar (Sud-Est Algérien) et l’impact de la rupture de la digue sur l’environnement. Ph.D. Thesis, University of Batna 2, Batna, Algeria, 2017. [Google Scholar] [CrossRef]
- Dash, S.; Kalamdhad, A.S. Hydrochemical dynamics of water quality for irrigation use and introducing a new water quality index incorporating multivariate statistics. Environ. Earth Sci. 2021, 80, 1–21. [Google Scholar] [CrossRef]
- Athamena, A.; Gaagai, A.; Aouissi, H.A.; Burlakovs, J.; Bencedira, S.; Zekker, I.; Krauklis, A.E. Chemometrics of the Environment: Hydrochemical Characterization of Groundwater in Lioua Plain (North Africa) Using Time Series and Multivariate Statistical Analysis. Sustainability 2022, 15, 20. [Google Scholar] [CrossRef]
- Ghodbane, M.; Benaabidate, L.; Boudoukha, A.; Gaagai, A.; Adjissi, O.; Chaib, W.; Aouissi, H.A. Analysis of Groundwater Quality in the Lower Soummam Valley, North-East of Algeria. J. Water Land Dev. 2022, 54, 1–12. [Google Scholar]
- Hinge, G.; Bharali, B.; Baruah, A.; Sharma, A. Integrated groundwater quality analysis using Water Quality Index, GIS and multivariate technique: A case study of Guwahati City. Environ. Earth Sci. 2022, 81, 1–15. [Google Scholar] [CrossRef]
- Elsayed, S.; Gad, M.; Farouk, M.; Saleh, A.H.; Hussein, H.; Elmetwalli, A.H.; Elsherbiny, O.; Moghanm, F.S.; Moustapha, M.E.; Taher, M.A.; et al. Using Optimized Two and Three-Band Spectral Indices and Multivariate Models to Assess Some Water Quality Indicators of Qaroun Lake in Egypt. Sustainability 2021, 13, 10408. [Google Scholar] [CrossRef]
- Patil, V.B.B.; Pinto, S.M.; Govindaraju, T.; Hebbalu, V.S.; Bhat, V.; Kannanur, L.N. Multivariate statistics and water quality index (WQI) approach for geochemical assessment of groundwater quality—a case study of Kanavi Halla Sub-Basin, Belagavi, India. Environ. Geochem. Heal. 2020, 42, 2667–2684. [Google Scholar] [CrossRef]
- Schoeller, H. Geochemistry of Groundwater. In Groundwater Studies—An International Guide for Research and Practice; UNESCO: Paris, France, 1977; pp. 1–18. [Google Scholar]
- Dimri, D.; Daverey, A.; Kumar, A.; Sharma, A. Monitoring water quality of River Ganga using multivariate techniques and WQI (Water Quality Index) in Western Himalayan region of Uttarakhand, India. Environ. Nanotechnology, Monit. Manag. 2020, 15, 100375. [Google Scholar] [CrossRef]
- Pak, H.Y.; Chuah, C.J.; Tan, M.L.; Yong, E.L.; Snyder, S.A. A framework for assessing the adequacy of Water Quality Index – Quantifying parameter sensitivity and uncertainties in missing values distribution. Sci. Total. Environ. 2020, 751, 141982. [Google Scholar] [CrossRef] [PubMed]
- Richards, L.A. Diagnosis and Improvement of Saline and Alkali Soils; US Department of Agriculture: Washington, DC, USA, 1954; Volume 78, ISBN 0038-075X. [Google Scholar]
- Ravikumar, P.; Mehmood, M.A.; Somashekar, R.K. Water quality index to determine the surface water quality of Sankey tank and Mallathahalli lake, Bangalore urban district, Karnataka, India. Appl. Water Sci. 2013, 3, 247–261. [Google Scholar] [CrossRef]
- Eaton, F.M. SIGNIFICANCE OF CARBONATES IN IRRIGATION WATERS. Soil Sci. 1950, 69, 123–134. [Google Scholar] [CrossRef]
- Doneen, L.D. Water Quality for Agriculture, Department of Irrigation; University of California: Davis, CA, USA, 1964; 48. [Google Scholar]
- Schalkoff, R.J. Artificial Neural Networks; McGraw-Hill Higher Education: New York, NY, USA, 1997; ISBN 0-07-057118-X. [Google Scholar]
- Haykin, S. Self-Organizing Maps. In Neural Networks–A Comprehensive Foundation; Prentice Hall PTR: Upper Saddle River, NJ, USA, 1999; pp. 443–483. [Google Scholar]
- Li, J.; Yoder, R.E.; Odhiambo, L.O.; Zhang, J. Simulation of nitrate distribution under drip irrigation using artificial neural networks. Irrig. Sci. 2004, 23, 29–37. [Google Scholar] [CrossRef]
- Byrd, R.H.; Lu, P.; Nocedal, J.; Zhu, C. A Limited Memory Algorithm for Bound Constrained Optimization. SIAM J. Sci. Comput. 1995, 16, 1190–1208. [Google Scholar] [CrossRef]
- Elsayed, S.; Gupta, M.; Chaudhary, G.; Taneja, S.; Gaur, H.; Gad, M.; Hamdy Eid, M.; Kovács, A.; Péter, S.; Gaagai, A.; et al. Interpretation the Influence of Hydrometeorological Variables on Soil Temperature Prediction Using the Potential of Deep Learning Model. Knowl. Based Eng. Sci. 2023, 4, 55–77. [Google Scholar] [CrossRef]
- Bai, B.; Rao, D.; Chang, T.; Guo, Z. A nonlinear attachment-detachment model with adsorption hysteresis for suspension-colloidal transport in porous media. J. Hydrol. 2019, 578, 124080. [Google Scholar] [CrossRef]
- Yang, M.; Wang, H.; Hu, K.; Yin, G.; Wei, Z. IA-Net$:$ An Inception–Attention-Module-Based Network for Classifying Underwater Images From Others. IEEE J. Ocean Eng. 2022, 47, 704–717. [Google Scholar] [CrossRef]
- Nong, X.; Lai, C.; Chen, L.; Shao, D.; Zhang, C.; Liang, J. Prediction modelling framework comparative analysis of dissolved oxygen concentration variations using support vector regression coupled with multiple feature engineering and optimization methods: A case study in China. Ecol. Indic. 2023, 146. [Google Scholar] [CrossRef]
- Chen, T.; Guestrin, C. XGBoost: A Scalable Tree Boosting System. In Proceedings of the 22nd ACM SIGKDD International Conference on Knowledge Discovery and Data Mining, ACM, San Francisco, CA, USA, 13 August 2016; pp. 785–794. [Google Scholar]
- Chen, R.-C.; Caraka, R.E.; Arnita, N.E.G.; Pomalingo, S.; Rachman, A.; Toharudin, T.; Tai, S.-K.; Pardamean, B. An End to End of Scalable Tree Boosting System. Sylwan 2020, 165, 1–11. [Google Scholar]
- Lee, C.; Lee, S. Exploring the Contributions by Transportation Features to Urban Economy: An Experiment of a Scalable Tree-Boosting Algorithm with Big Data. Land 2022, 11, 577. [Google Scholar] [CrossRef]
- Chadha, D.K. A proposed new diagram for geochemical classification of natural waters and interpretation of chemical data. Hydrogeol. J. 1999, 7, 431–439. [Google Scholar] [CrossRef]
- Vasanthavigar, M.; Srinivasamoorthy, K.; Prasanna, M.V. Evaluation of groundwater suitability for domestic, irrigational, and industrial purposes: A case study from Thirumanimuttar river basin, Tamilnadu, India. Environ. Monit. Assess. 2011, 184, 405–420. [Google Scholar] [CrossRef]
- Gibbs, R.J. Mechanisms Controlling World Water Chemistry. Science 1970, 170, 1088–1090. [Google Scholar] [CrossRef]
- Rakotondrabe, F.; Ngoupayou, J.R.N.; Mfonka, Z.; Rasolomanana, E.H.; Abolo, A.J.N.; Ako, A.A. Water quality assessment in the Bétaré-Oya gold mining area (East-Cameroon): Multivariate Statistical Analysis approach. Sci. Total. Environ. 2018, 610-611, 831–844. [Google Scholar] [CrossRef]
- Malone, B.P.; Styc, Q.; Minasny, B.; McBratney, A.B. Digital soil mapping of soil carbon at the farm scale: A spatial downscaling approach in consideration of measured and uncertain data. Geoderma 2017, 290, 91–99. [Google Scholar] [CrossRef]
- Saggi, M.K.; Jain, S. Reference evapotranspiration estimation and modeling of the Punjab Northern India using deep learning. Comput. Electron. Agric. 2019, 156, 387–398. [Google Scholar] [CrossRef]
- Ayers, R.S.; Westcot, D.W. Water Quality for Agriculture; FAO Irrigation and Drainage Paper; FAO: Rome, Italy, 1985; ISBN 978-92-5-102263-4. [Google Scholar]
- Moussa, R.S.; Alma, M.M.M.; Laouli, M.S.; Natatou, I.; Habou, I. Caractérisation physico-chimique des eaux des aquifères du Continental Intercalaire/Hamadien et du Continentalsiems Terminal de la région de Zinder (Niger). Int. J. Biol. Chem. Sci. 2019, 12, 2395. [Google Scholar] [CrossRef]
- Ayers, R.; Westcott, D. Water Quality for Agriculture. FAO Irrigation and Drainage Paper 29 Rev. 1; FAO: Rome, Italy, 1994. [Google Scholar]
- Mhamdi, A.; Moussaoui, I.; Khalfi, C.; Tarki, M.; Dassi, L. Assessment of groundwater mineralization processes in the Garâat Douza-Tebeddit shallow aquifer, Southwestern Tunisia: An integrated geoelectrical and hydrochemical approach. Carbonates Evaporites 2022, 37, 1–16. [Google Scholar] [CrossRef]
- Ben Moussa, A.; Chandoul, S.; Mzali, H.; Salem, S.B.H.; Elmejri, H.; Zouari, K.; Hafiane, A.; Mrabet, H. Hydrogeochemistry and evaluation of groundwater suitability for irrigation purpose in the Mornag region, northeastern Tunisia. Environ. Dev. Sustain. 2020, 23, 2698–2718. [Google Scholar] [CrossRef]
- Gaagai, A.; Aouissi, H.A.; Bencedira, S.; Hinge, G.; Athamena, A.; Heddam, S.; Gad, M.; Elsherbiny, O.; Elsayed, S.; Eid, M.H.; et al. Application of Water Quality Indices, Machine Learning Approaches, and GIS to Identify Groundwater Quality for Irrigation Purposes: A Case Study of Sahara Aquifer, Doucen Plain, Algeria. Water 2023, 15, 289. [Google Scholar] [CrossRef]
- Jacobson, A.; Wasserburg, G. Anhydrite and the Sr isotope evolution of groundwater in a carbonate aquifer. Chem. Geol. 2005, 214, 331–350. [Google Scholar] [CrossRef]
- El Mejri, H.; Ben Moussa, A.; Zouari, K. The use of hydrochemical and environmental isotopic tracers to understand the functioning of the aquifer system in the Bou Hafna and Haffouz regions, Central Tunisia. Quat. Int. 2014, 338, 88–98. [Google Scholar] [CrossRef]
- Blubaugh, D.J.; Atamian, M.; Babcock, G.T.; Golbeck, J.H.; Cheniae, G.M. Photoinhibition of hydroxylamine-extracted photosystem II membranes: Identification of the sites of photodamage. Biochemistry 1991, 30, 7586–7597. [Google Scholar] [CrossRef]
- Gamvroula, D.; Alexakis, D.; Stamatis, G. Diagnosis of groundwater quality and assessment of contamination sources in the Megara basin (Attica, Greece). Arab. J. Geosci. 2012, 6, 2367–2381. [Google Scholar] [CrossRef]
- Xiao, Y.; Zhang, J.; Long, A.; Xu, S.; Guo, T.; Gu, X.; Deng, X.; Zhang, P. Hydrochemical Characteristics and Formation Mechanism of Quaternary Groundwater in Baoshan Basin, Western Yunnan, China. Water 2023, 15, 2736. [Google Scholar] [CrossRef]
- Gad, M.; El-Safa, M.M.A.; Farouk, M.; Hussein, H.; Alnemari, A.M.; Elsayed, S.; Khalifa, M.M.; Moghanm, F.S.; Eid, E.M.; Saleh, A.H. Integration of Water Quality Indices and Multivariate Modeling for Assessing Surface Water Quality in Qaroun Lake, Egypt. Water 2021, 13, 2258. [Google Scholar] [CrossRef]
- El Osta, M.; Masoud, M.; Alqarawy, A.; Elsayed, S.; Gad, M. Groundwater Suitability for Drinking and Irrigation Using Water Quality Indices and Multivariate Modeling in Makkah Al-Mukarramah Province, Saudi Arabia. Water 2022, 14, 483. [Google Scholar] [CrossRef]
- Qian, C.; Wu, X.; Mu, W.-P.; Fu, R.-Z.; Zhu, G.; Wang, Z.-R.; Wang, D.-D. Hydrogeochemical characterization and suitability assessment of groundwater in an agro-pastoral area, Ordos Basin, NW China. Environ. Earth Sci. 2016, 75, 1–16. [Google Scholar] [CrossRef]
- Wu, J.; Li, P.; Qian, H. Hydrochemical characterization of drinking groundwater with special reference to fluoride in an arid area of China and the control of aquifer leakage on its concentrations. Environ. Earth Sci. 2015, 73, 8575–8588. [Google Scholar] [CrossRef]
- Mustapha, A.; Aris, A.Z.; Ramli, M.F.; Juahir, H. Spatial-temporal variation of surface water quality in the downstream region of the Jakara River, north-western Nigeria: A statistical approach. J. Environ. Sci. Heal. Part A 2012, 47, 1551–1560. [Google Scholar] [CrossRef] [PubMed]
- Li, P.; Wu, J.; Qian, H. Assessment of groundwater quality for irrigation purposes and identification of hydrogeochemical evolution mechanisms in Pengyang County, China. Environ. Earth Sci. 2012, 69, 2211–2225. [Google Scholar] [CrossRef]
- RamyaPriya, R.; Elango, L. Evaluation of geogenic and anthropogenic impacts on spatio-temporal variation in quality of surface water and groundwater along Cauvery River, India. Environ. Earth Sci. 2017, 77, 2. [Google Scholar] [CrossRef]
- Todd, D.K.; Mays, L.W. Groundwater Hydrology; John Wiley & Sons: Hoboken, NJ, USA, 2004; ISBN 0-471-05937-4. [Google Scholar]
- Pyrcz, M.J.; Deutsch, C.V. Geostatistical Reservoir Modeling; Oxford University Press: Oxford, UK, 2014; ISBN 0-19-973144-6. [Google Scholar]
- Zhang, T.; Song, B.; Han, G.; Zhao, H.; Hu, Q.; Zhao, Y.; Liu, H. Effects of coastal wetland reclamation on soil organic carbon, total nitrogen, and total phosphorus in China: A meta-analysis. Land Degrad. Dev. 2023, 34, 3340–3349. [Google Scholar] [CrossRef]
- Prasad, A.; Kumar, D.; Singh, D. Effect of residual sodium carbonate in irrigation water on the soil sodication and yield of palmarosa (Cymbopogon martinni) and lemongrass (Cymbopogon flexuosus). Agric. Water Manag. 2001, 50, 161–172. [Google Scholar] [CrossRef]
- Wu, M.-L.; Wang, Y.-S. Using Chemometrics to Evaluate Anthropogenic Effects in Daya Bay, China. Estuar. Coast. Shelf Sci. 2007, 72, 732–742. [Google Scholar] [CrossRef]
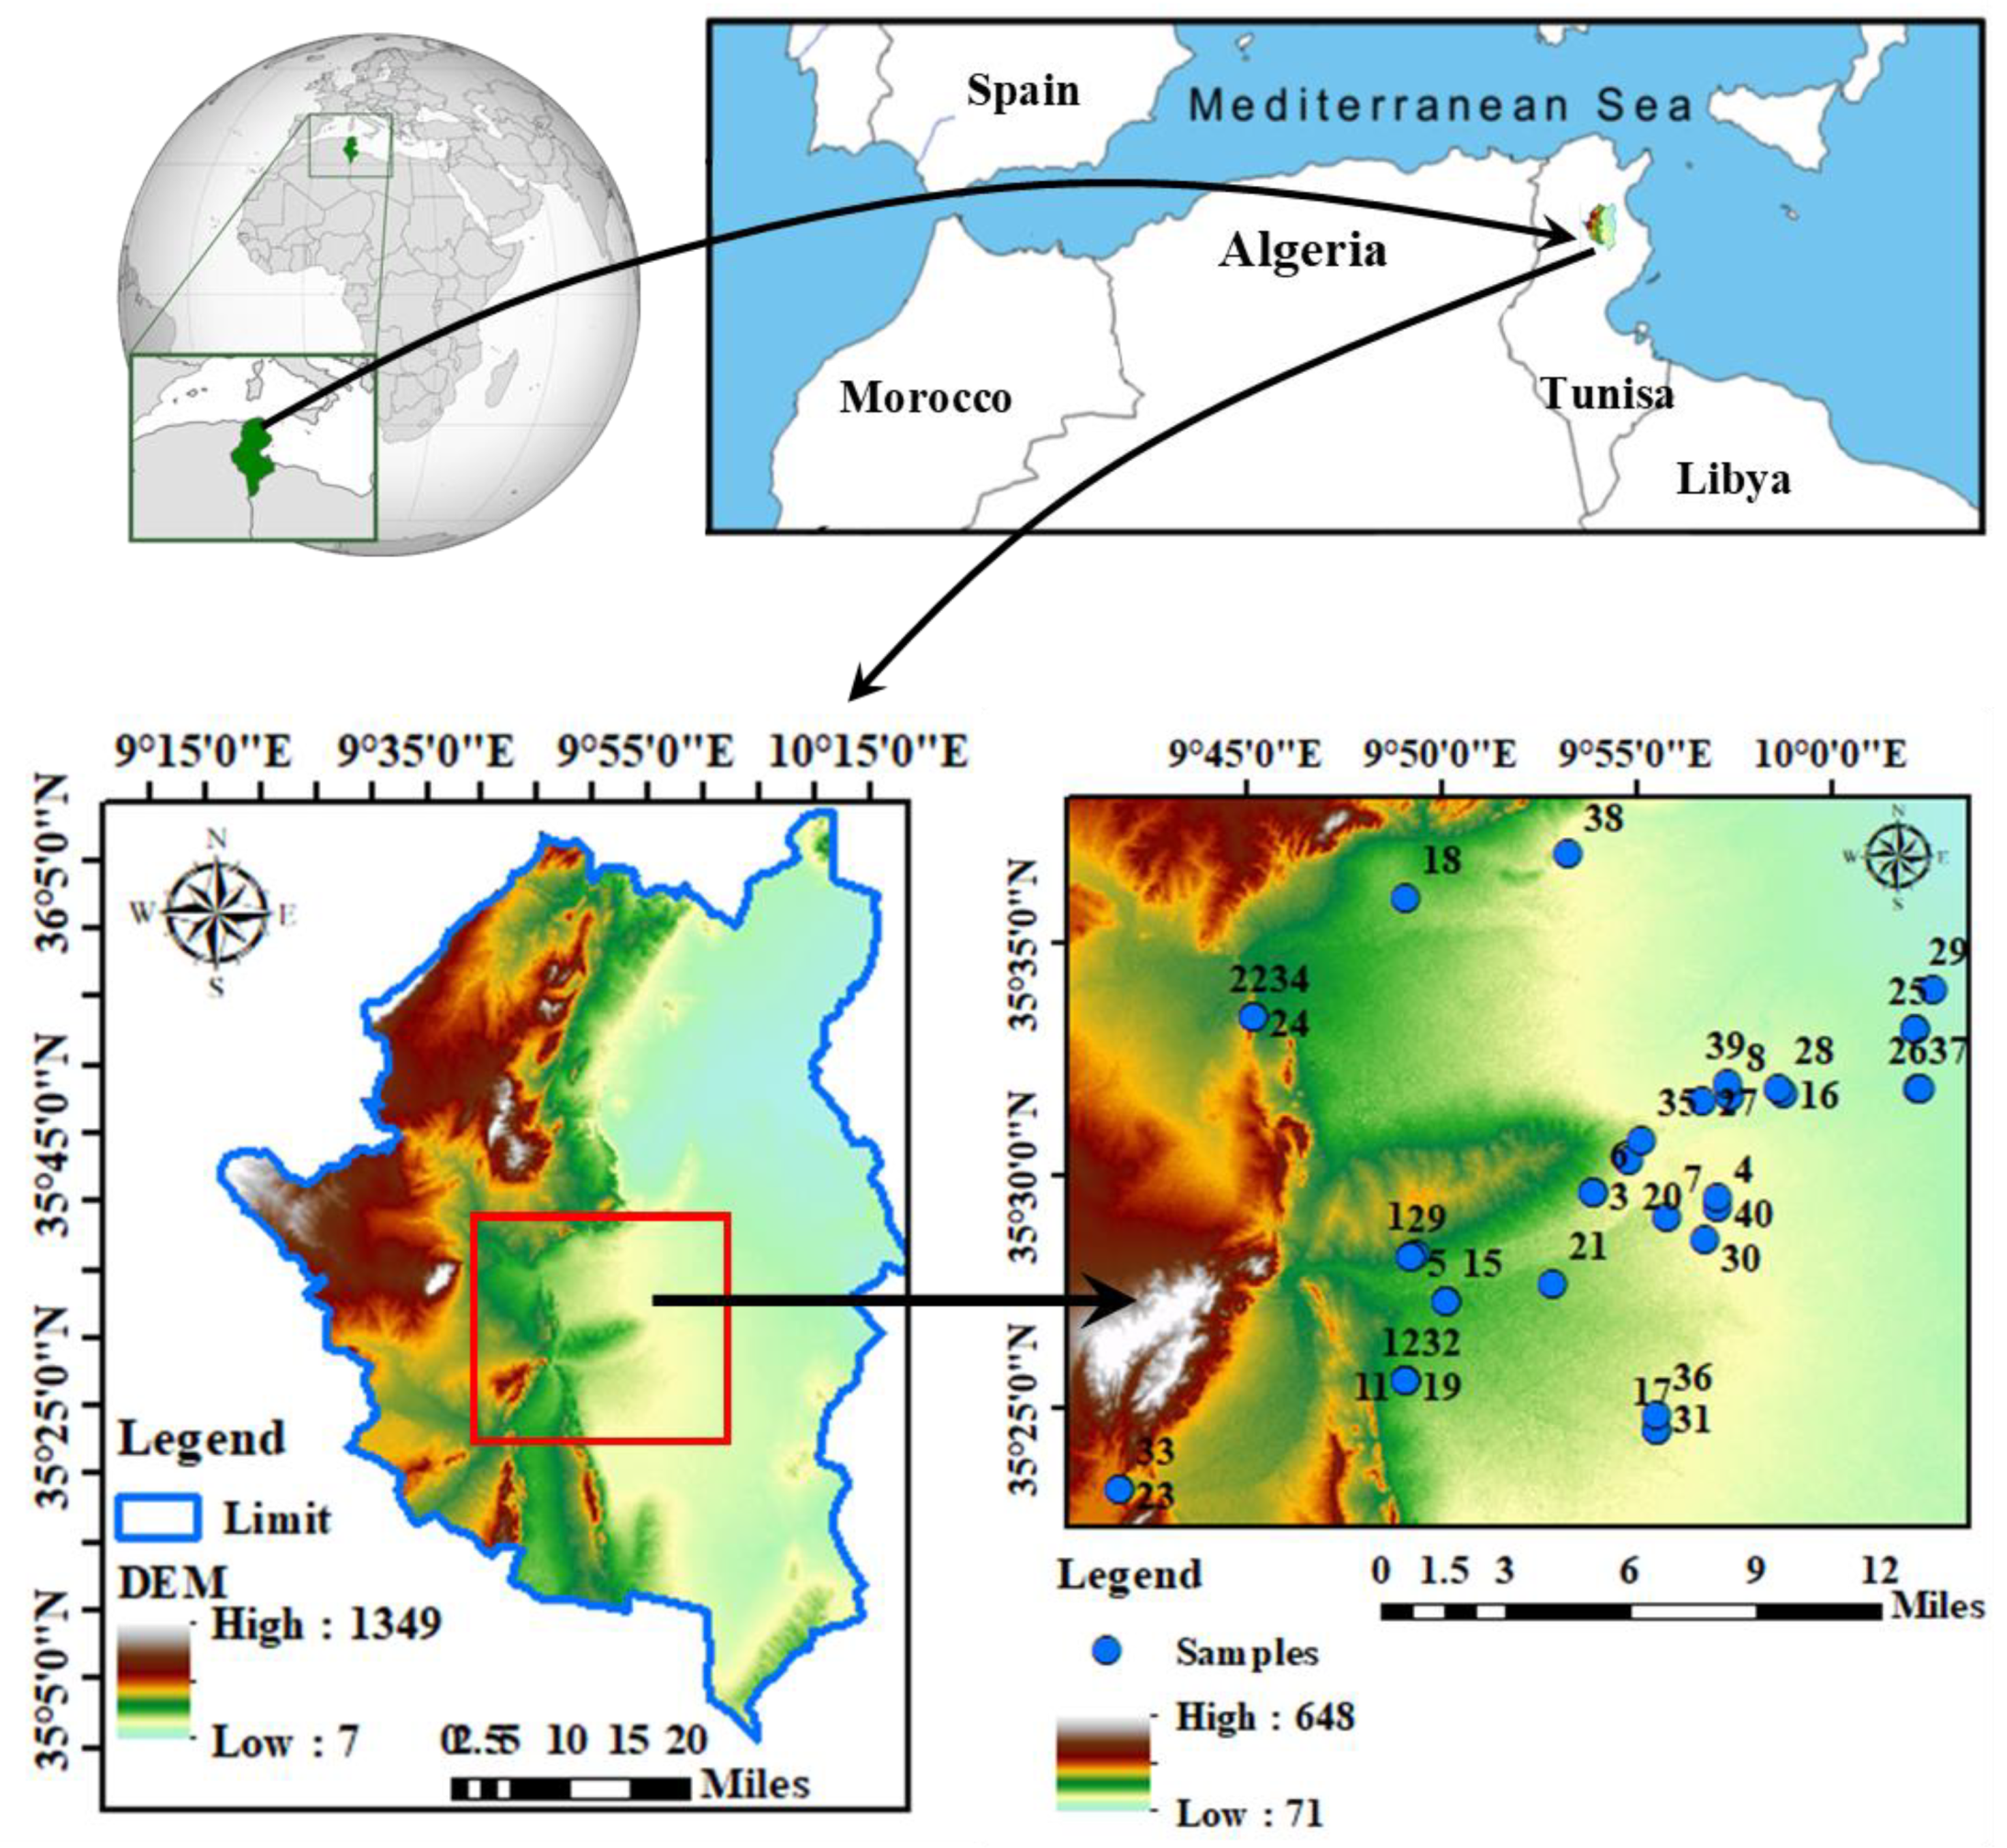

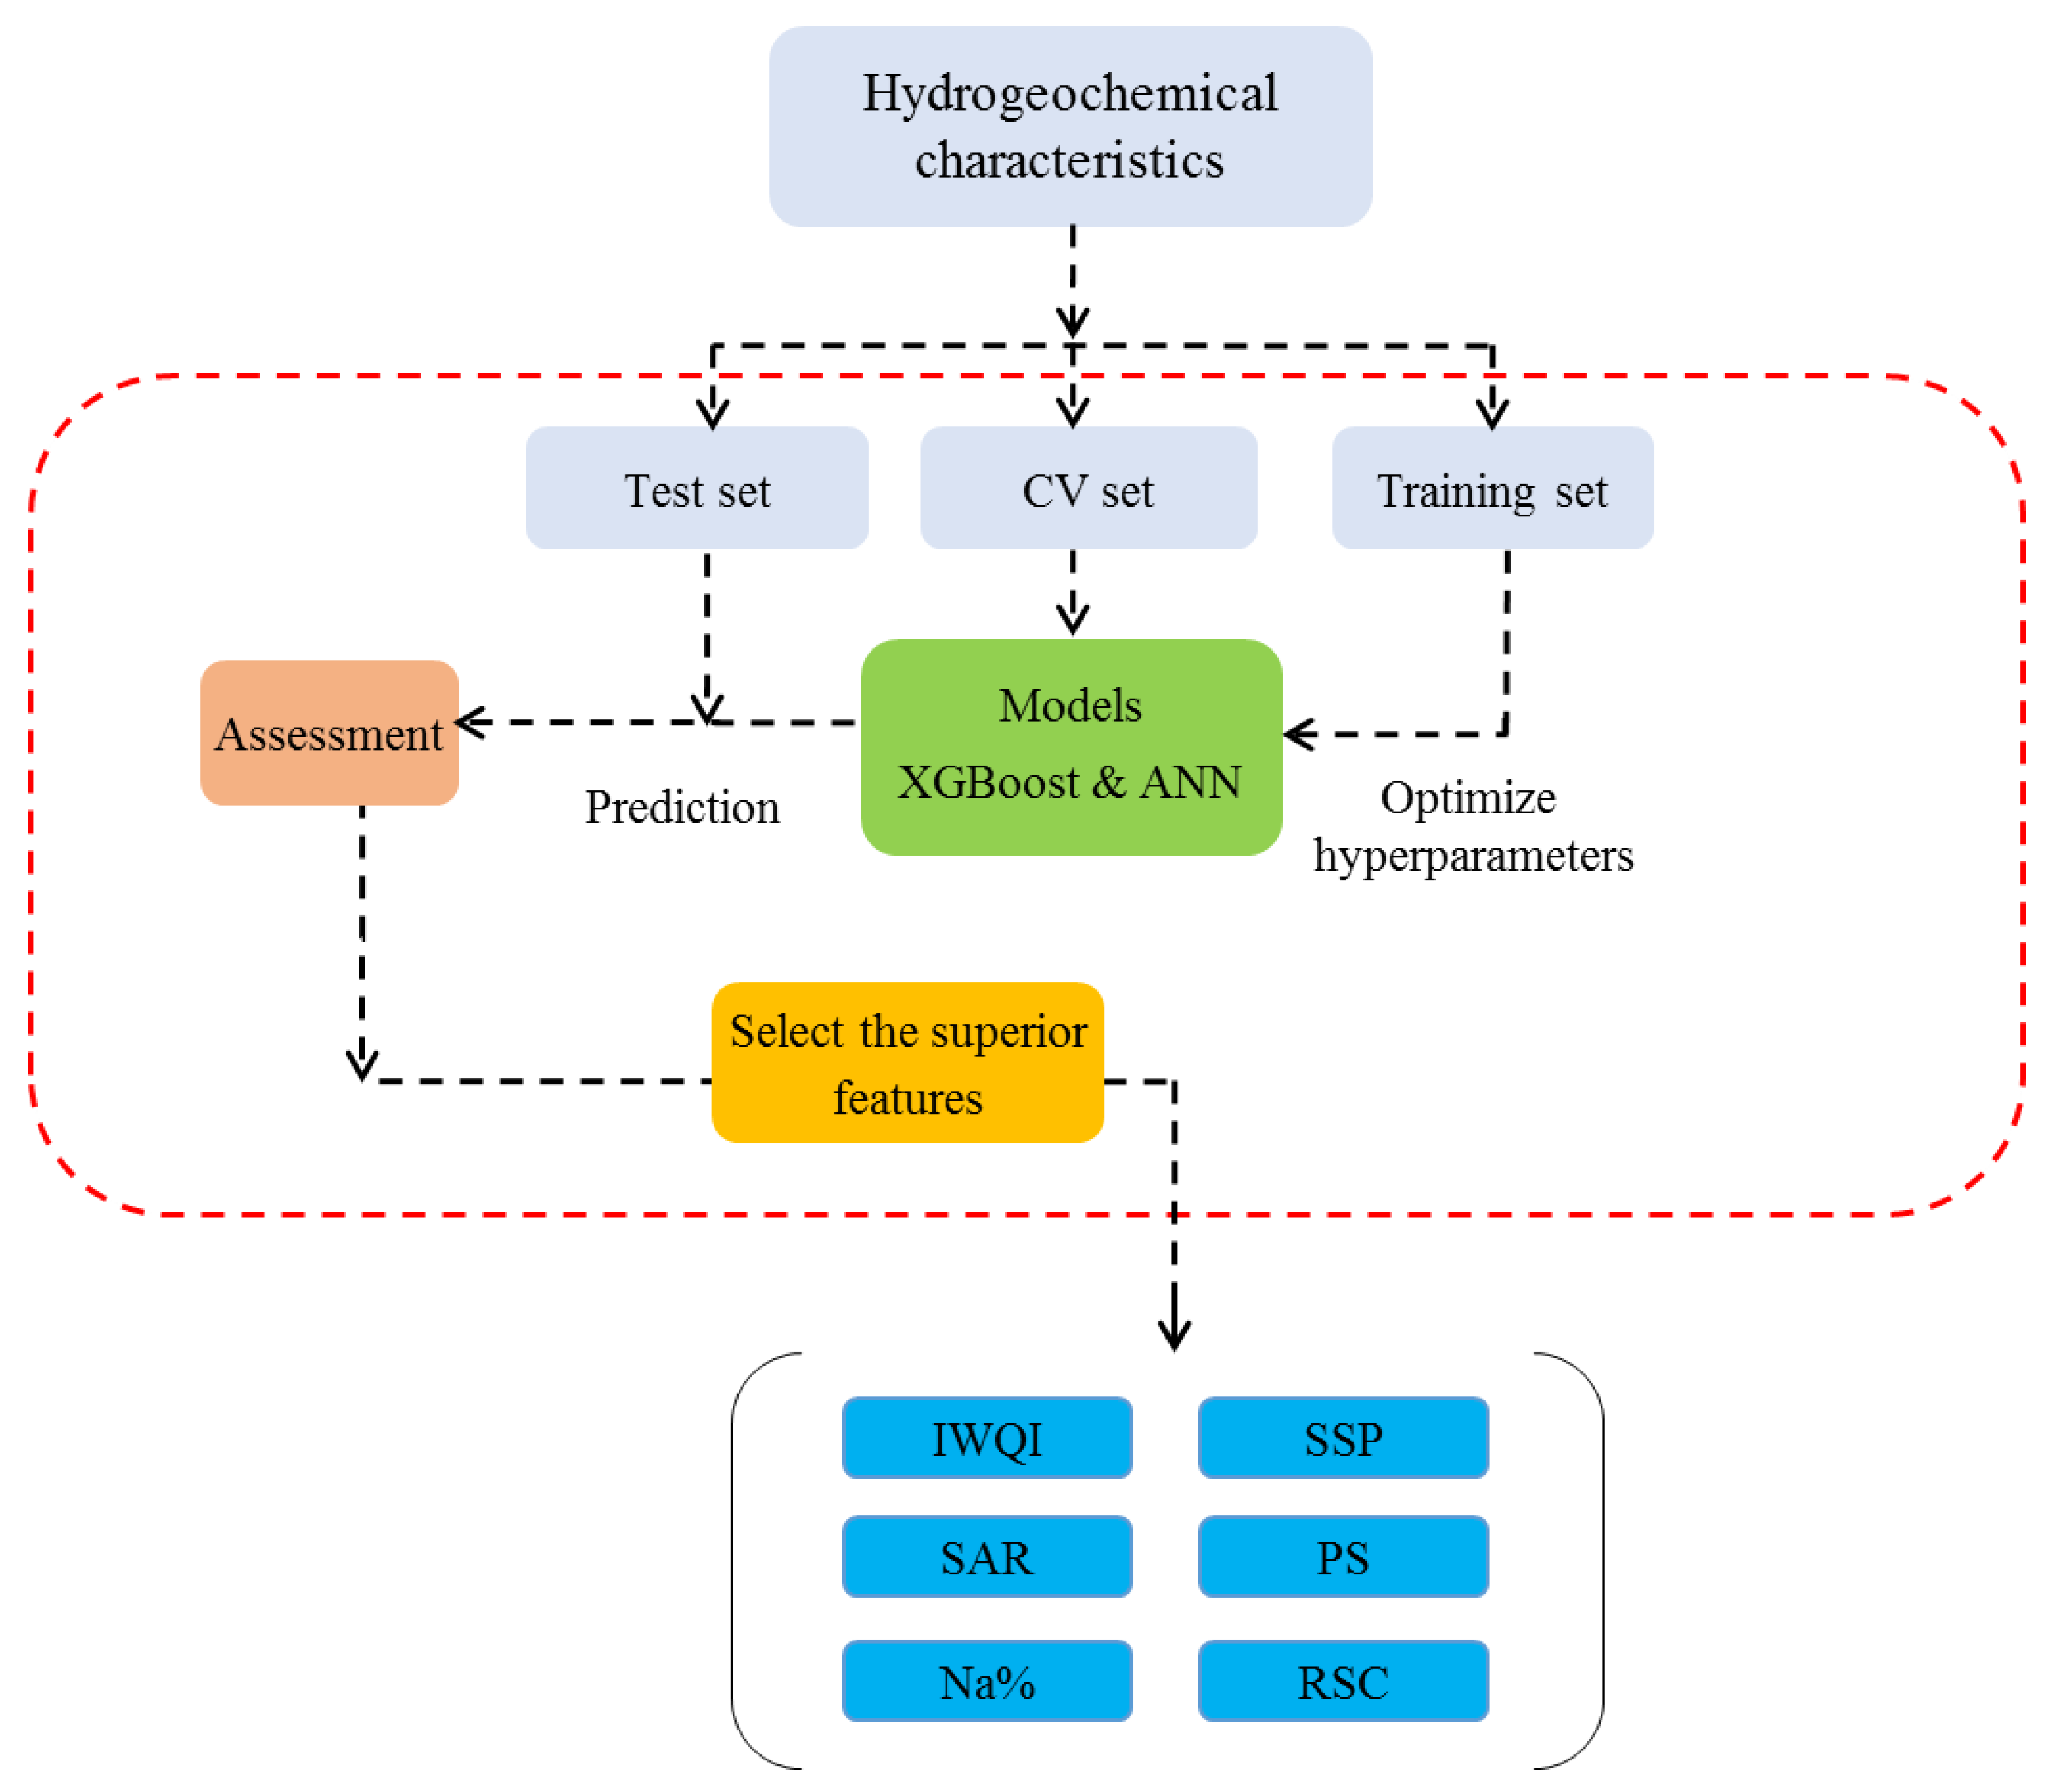
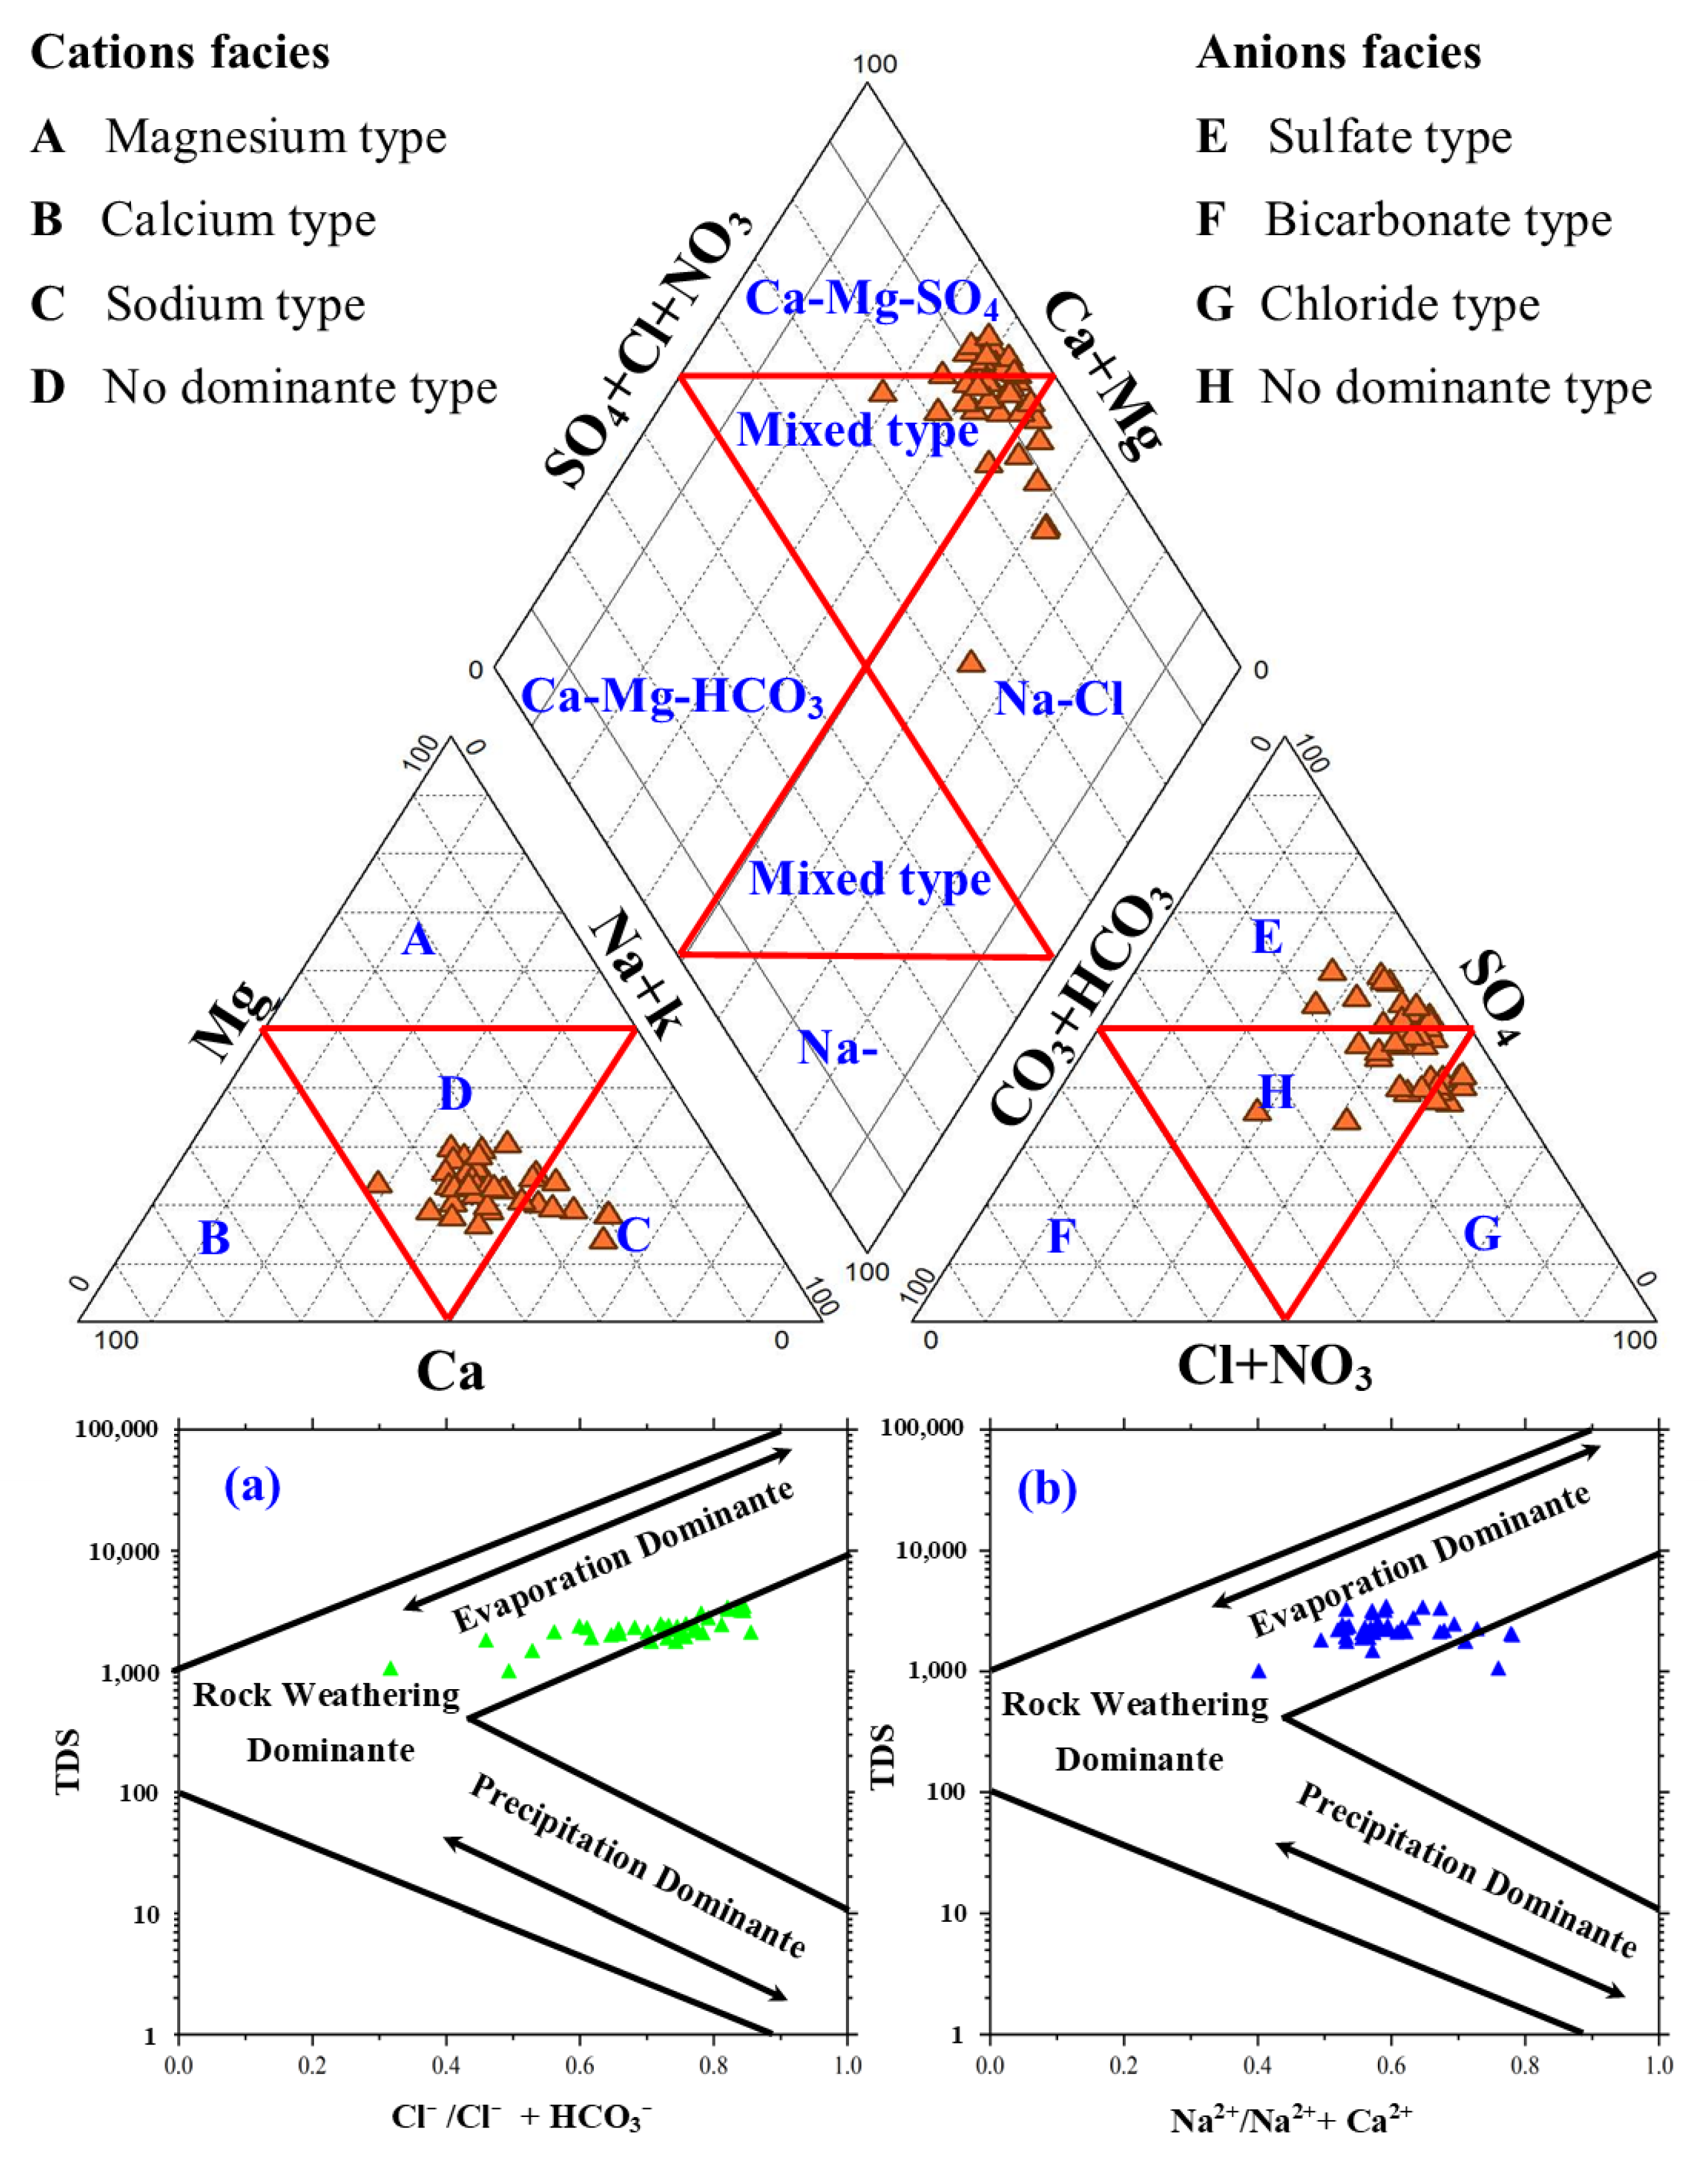
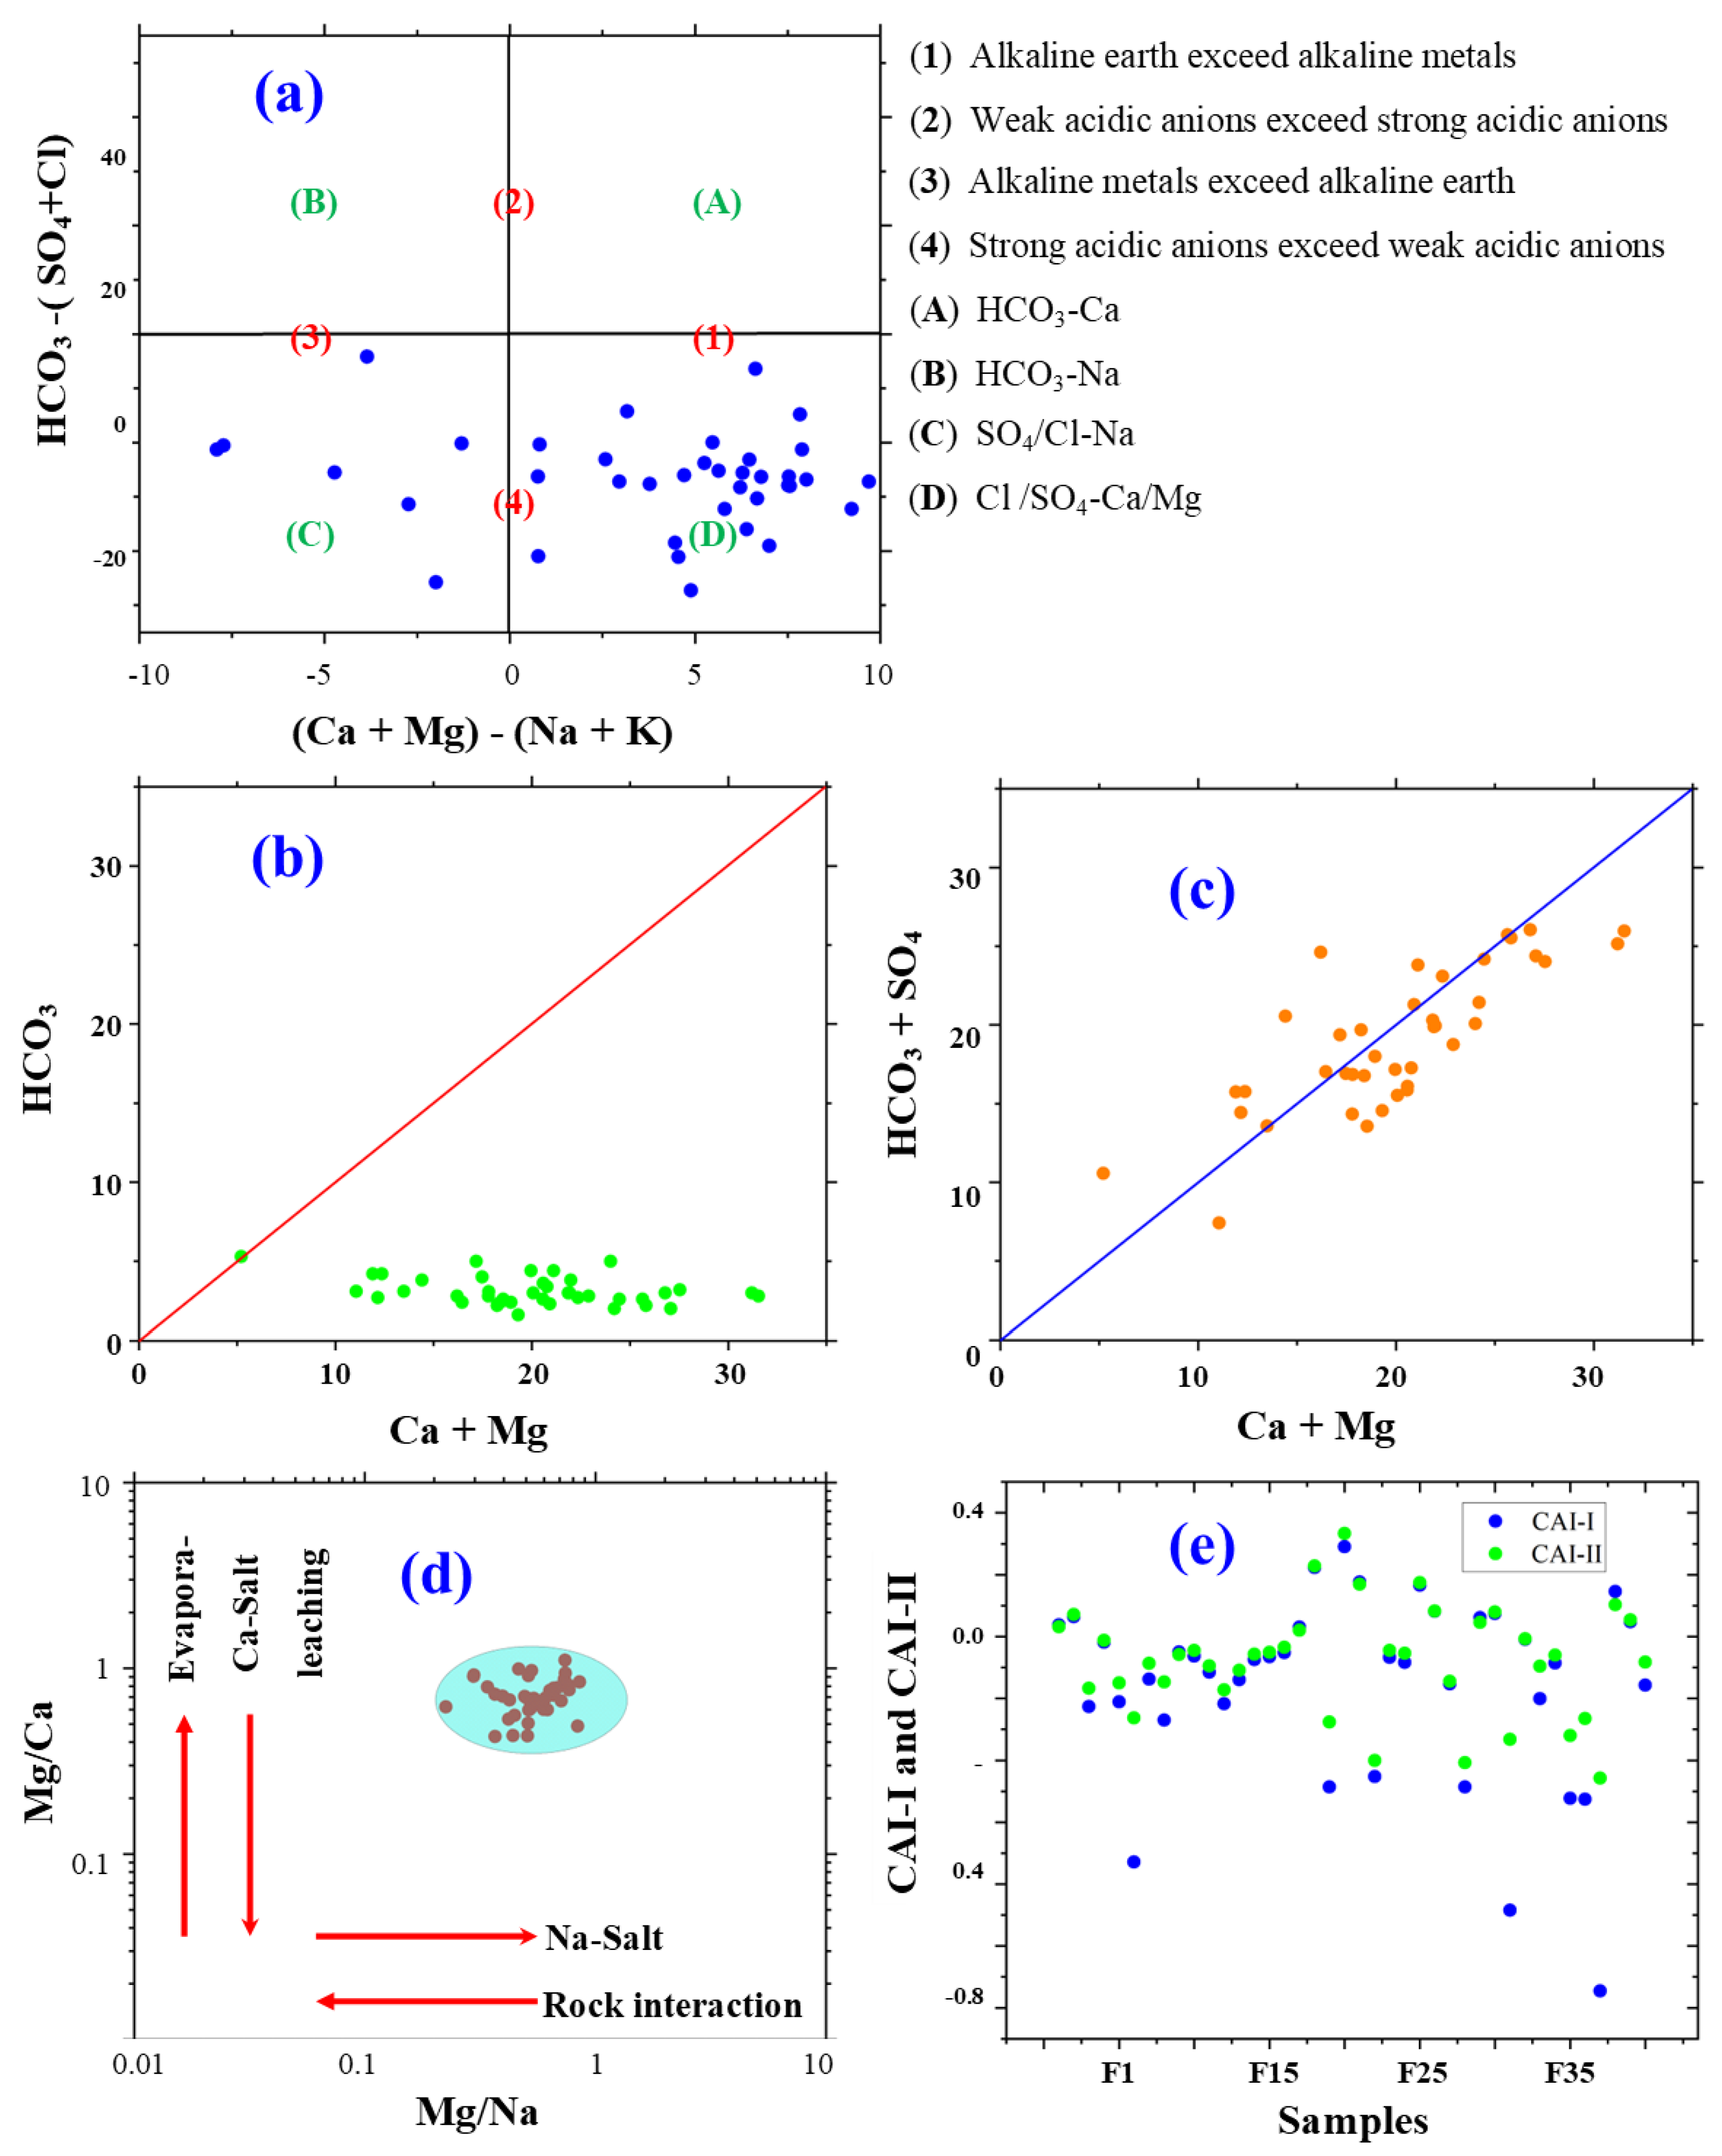
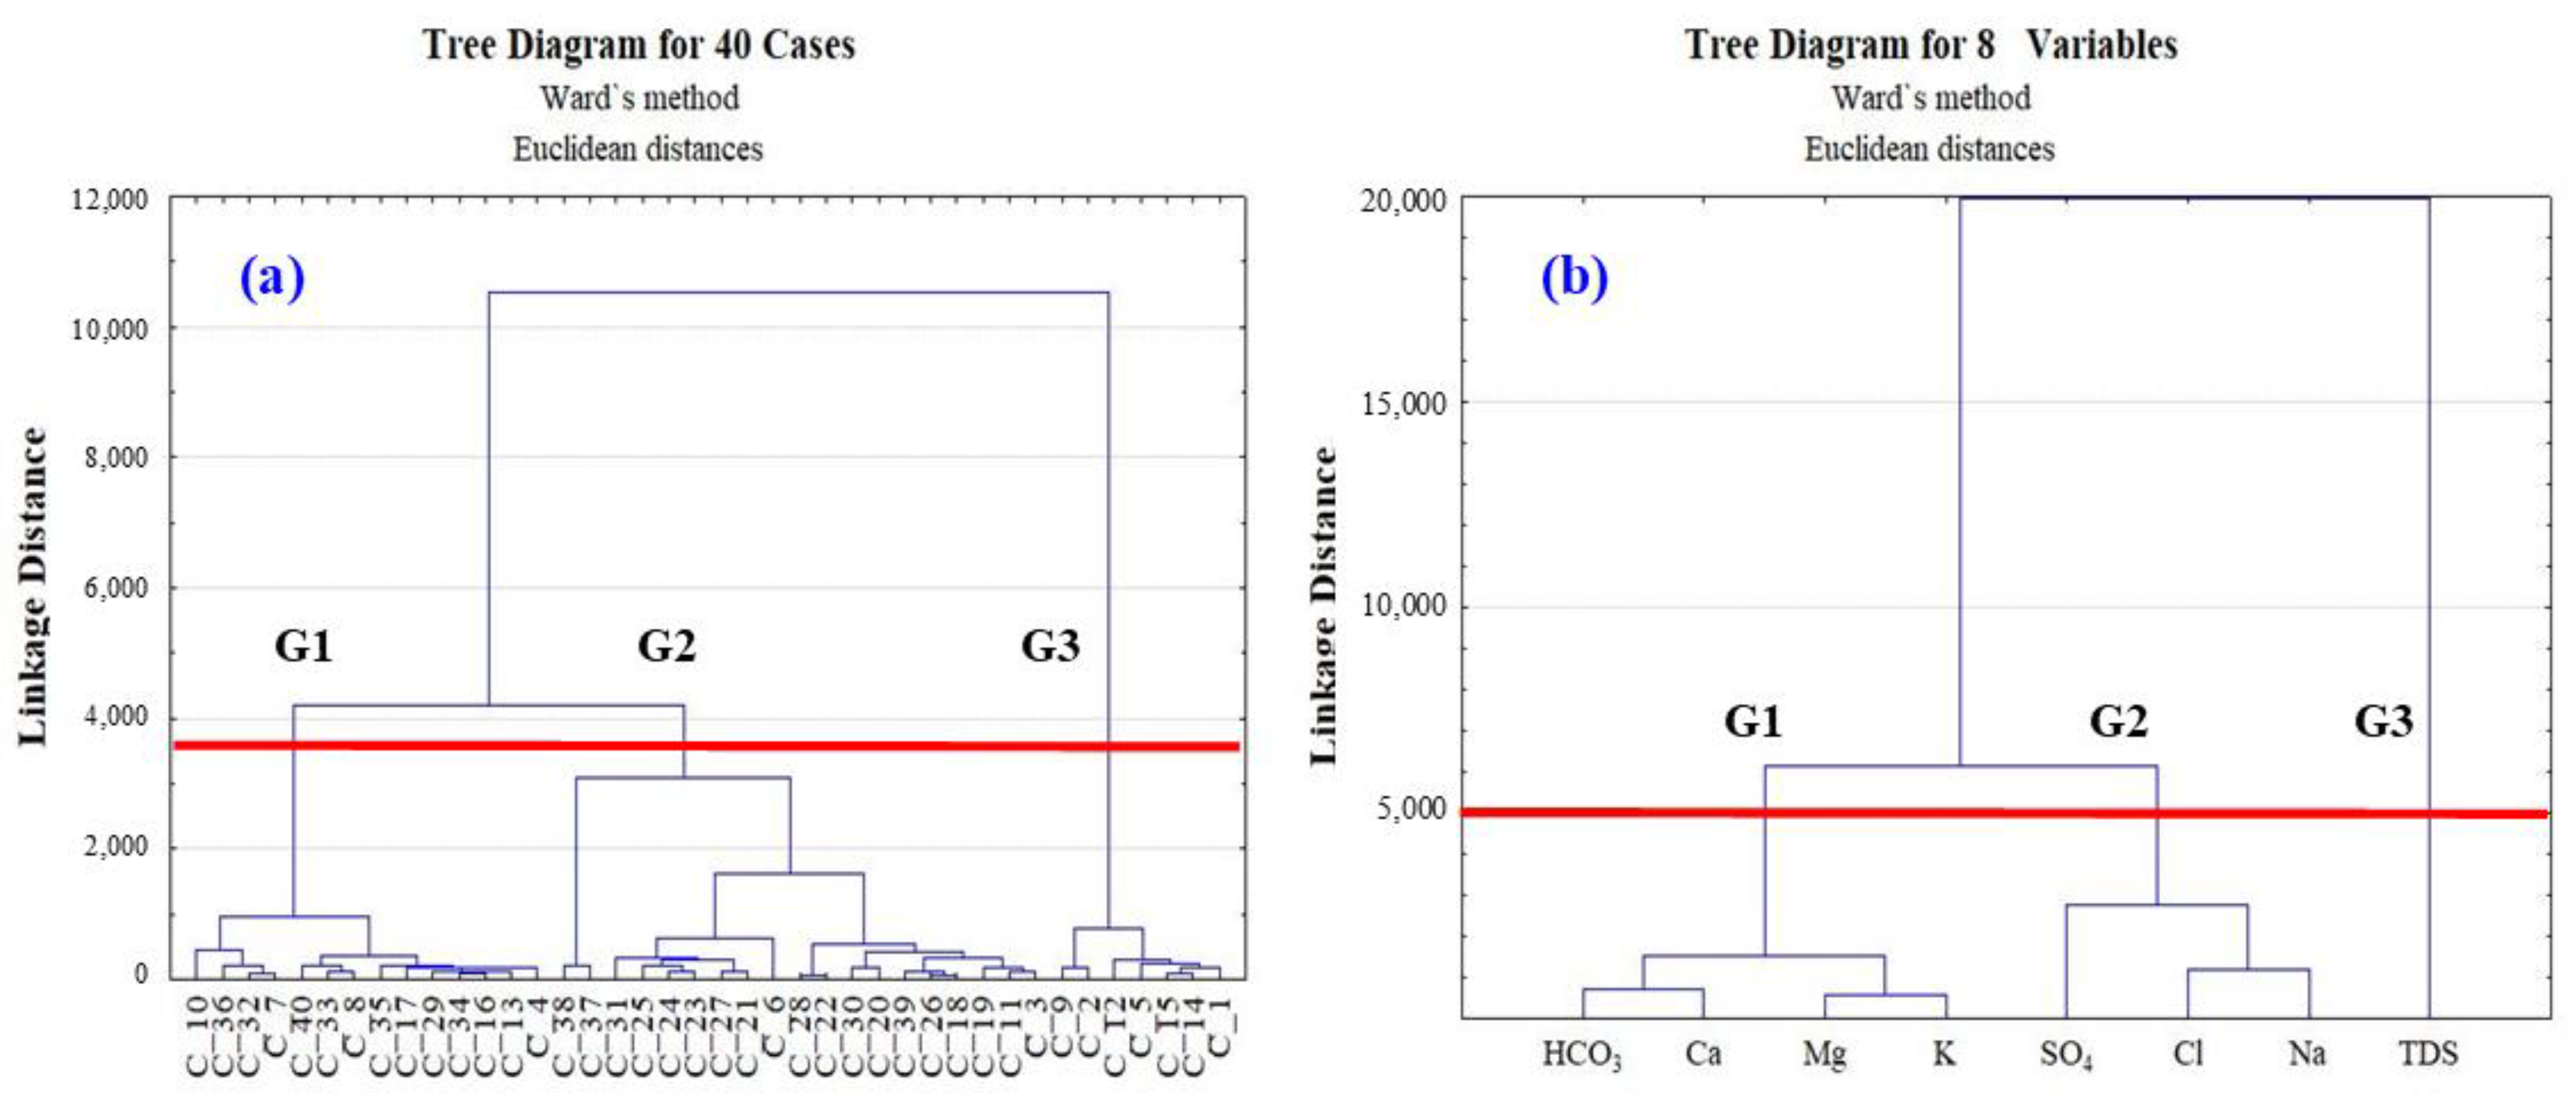
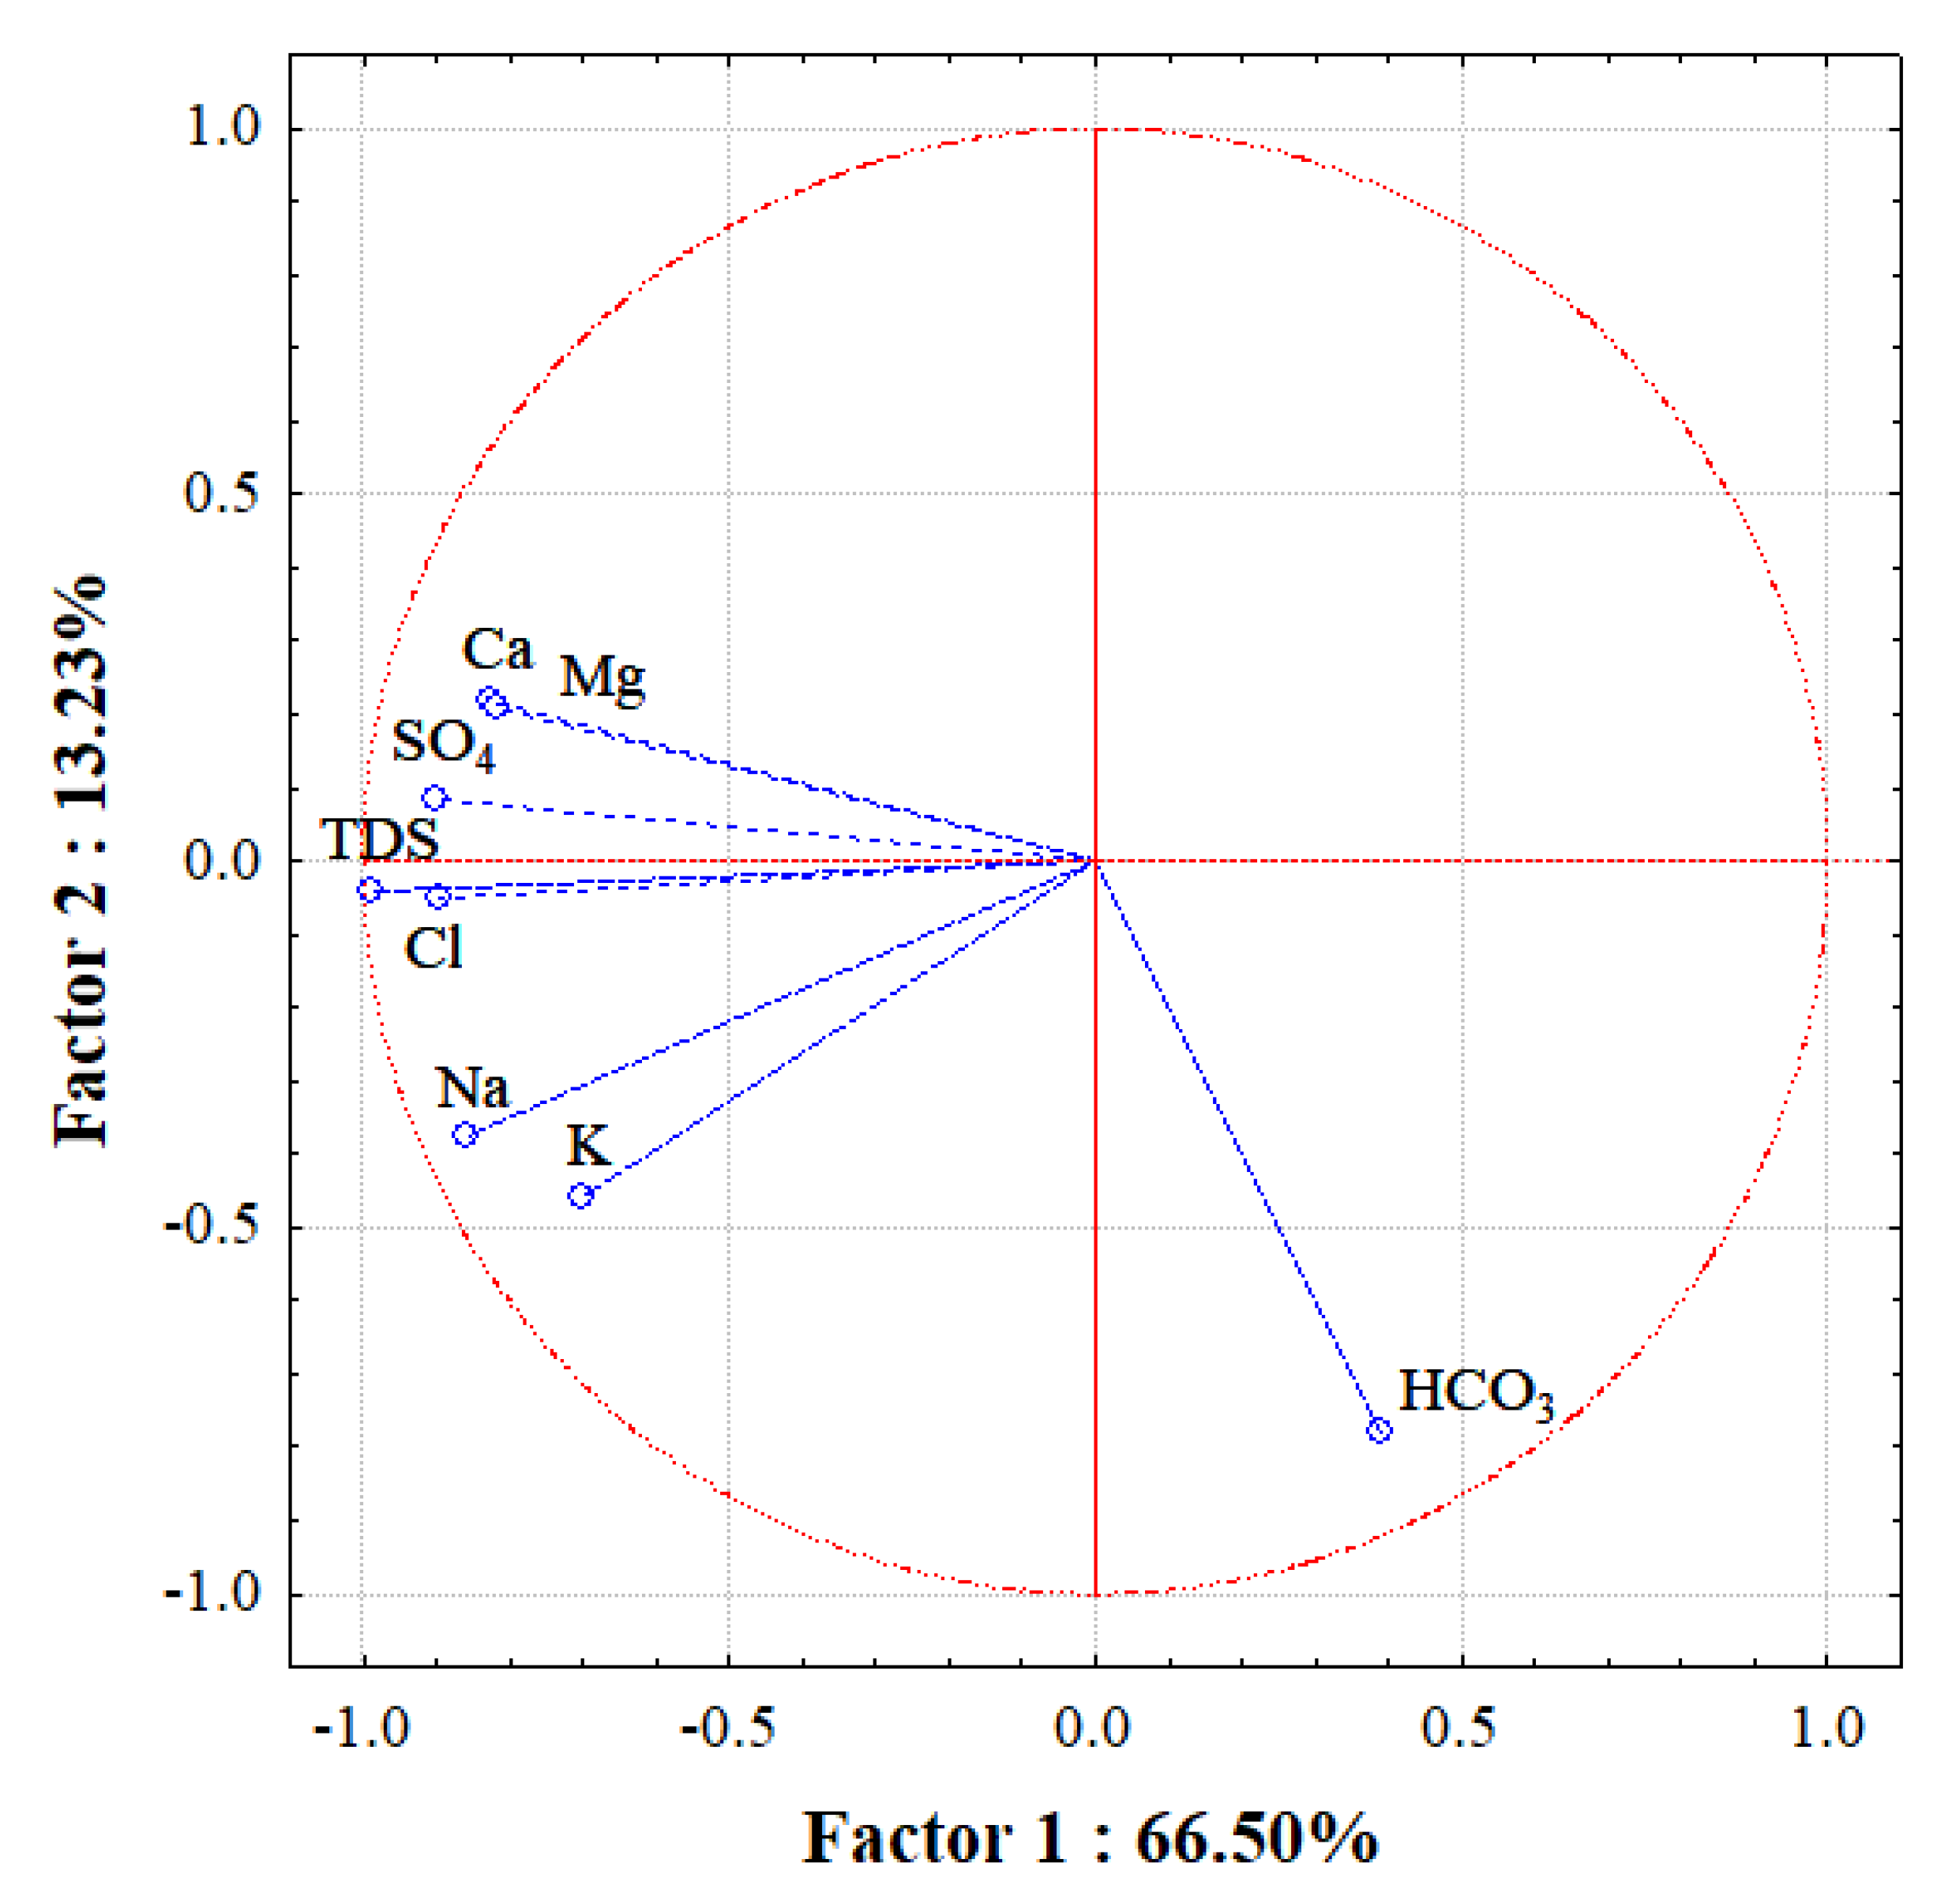
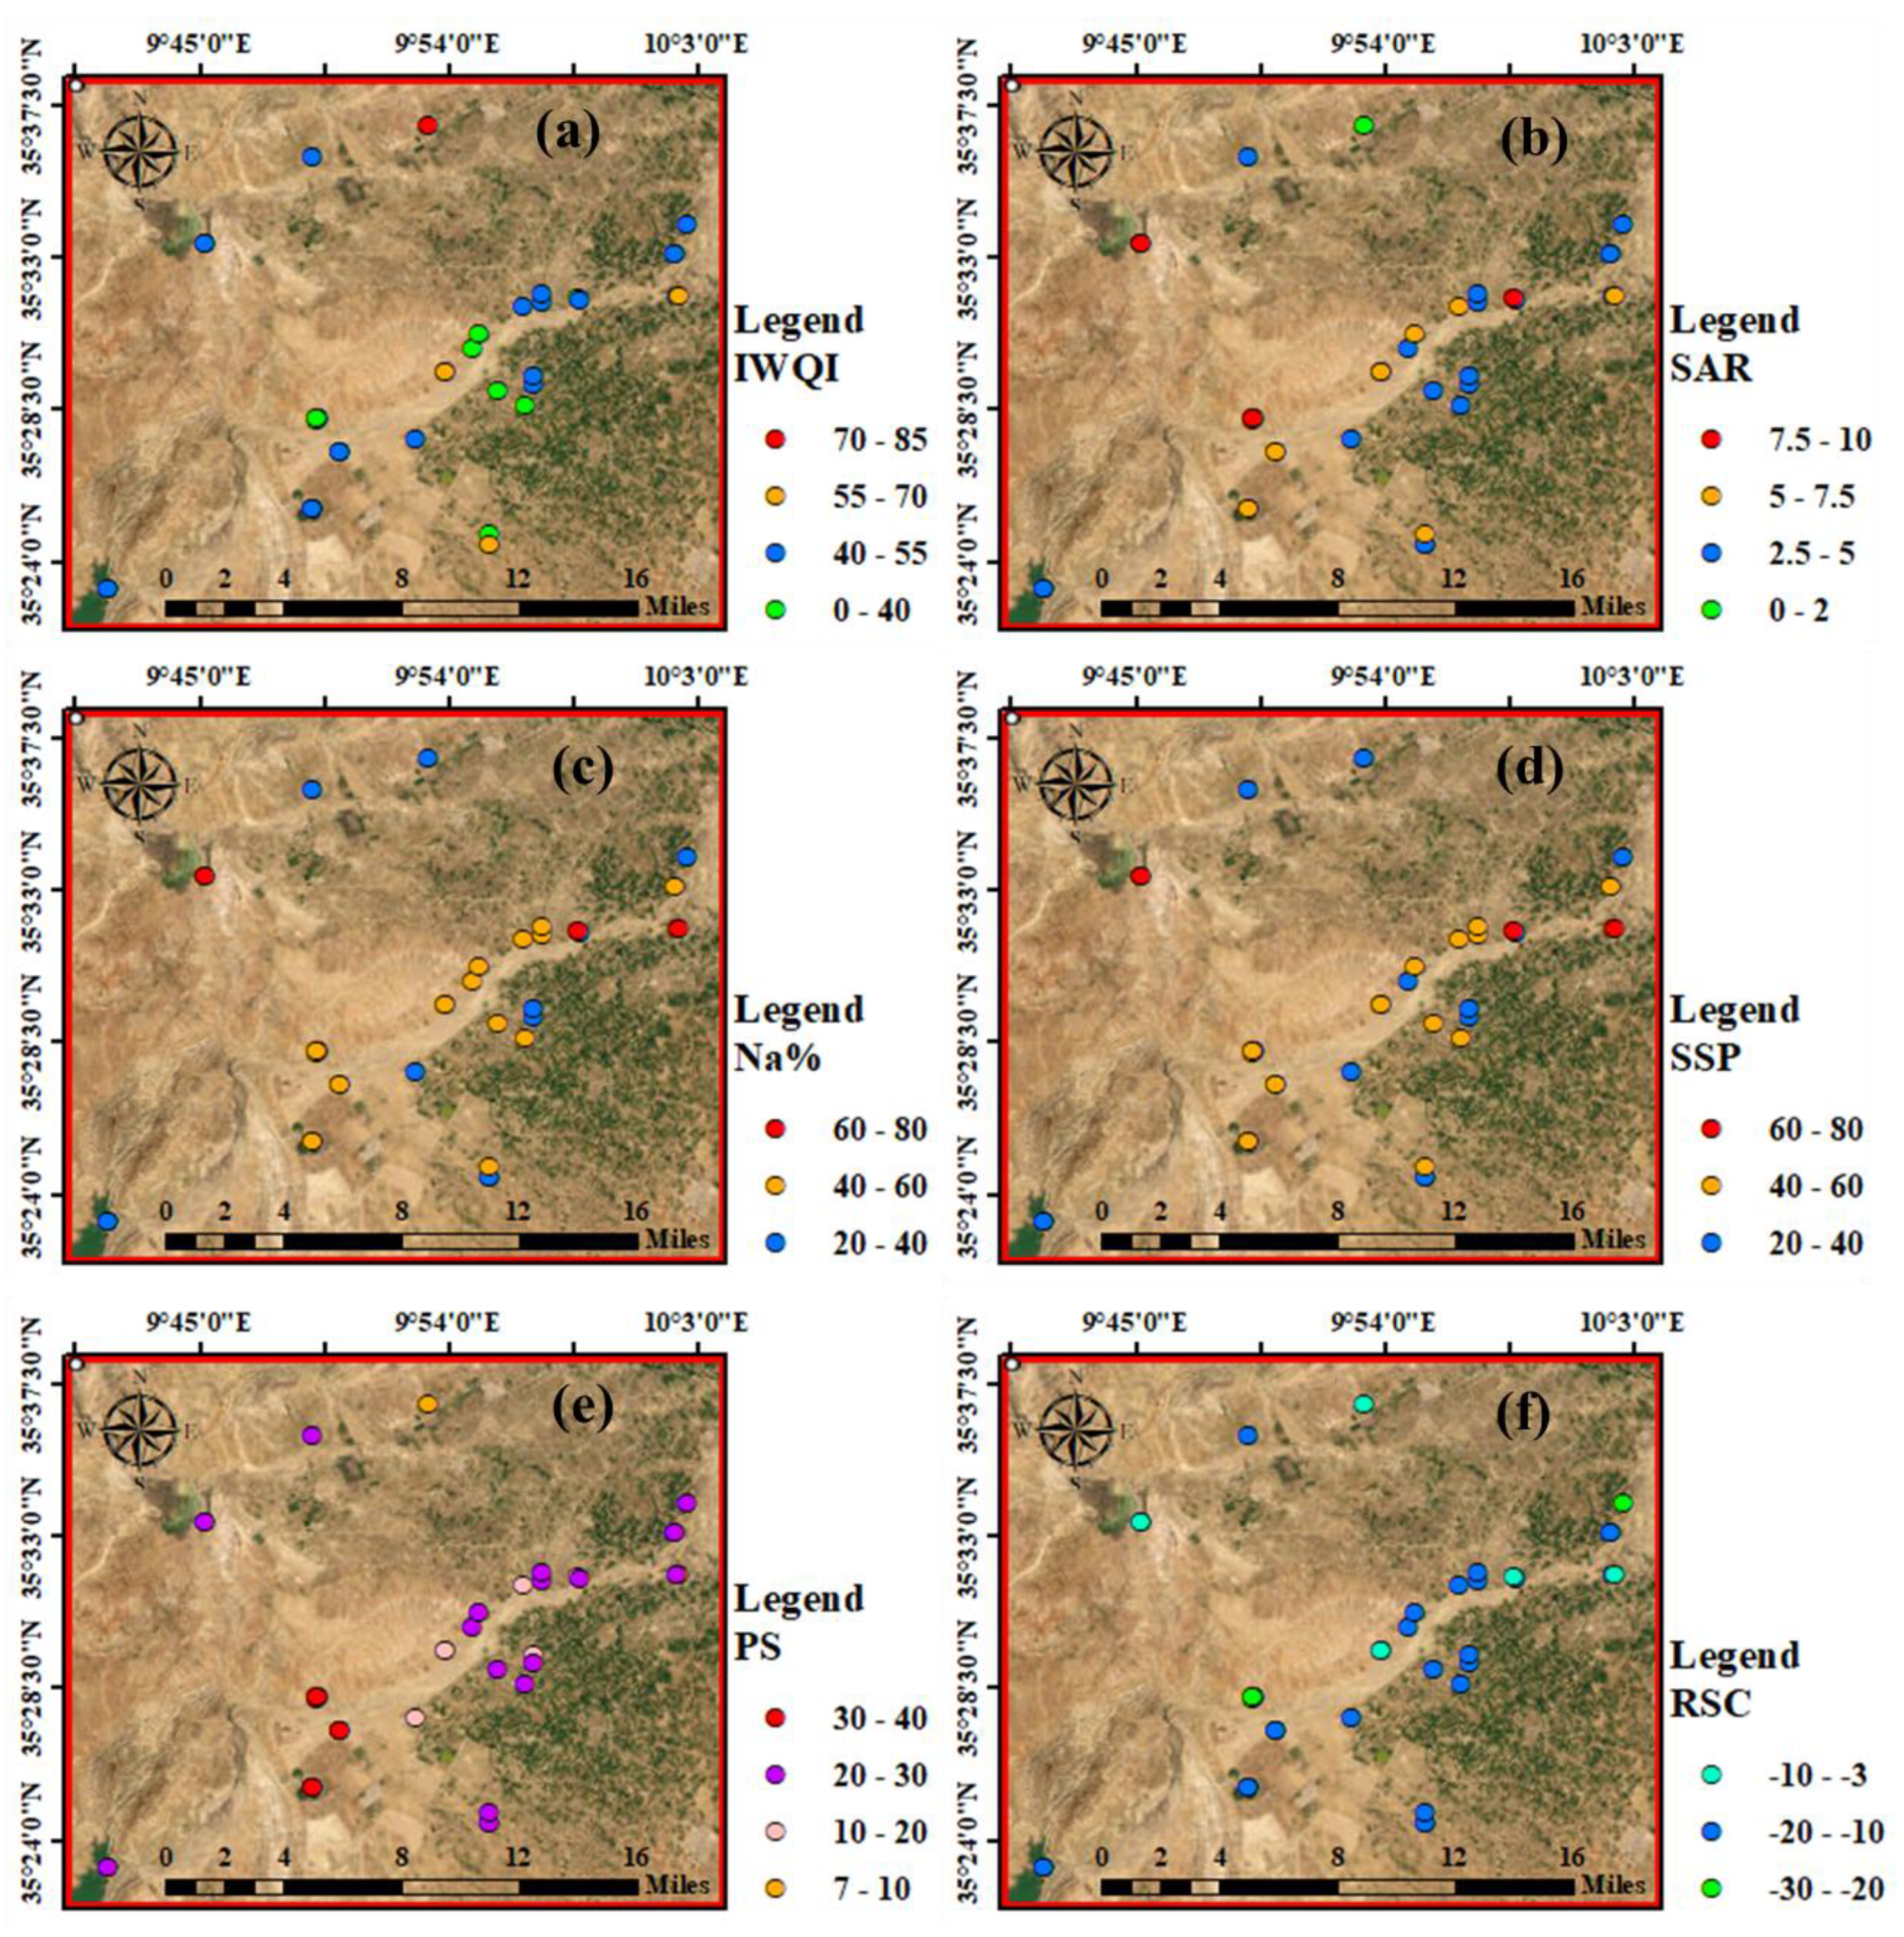
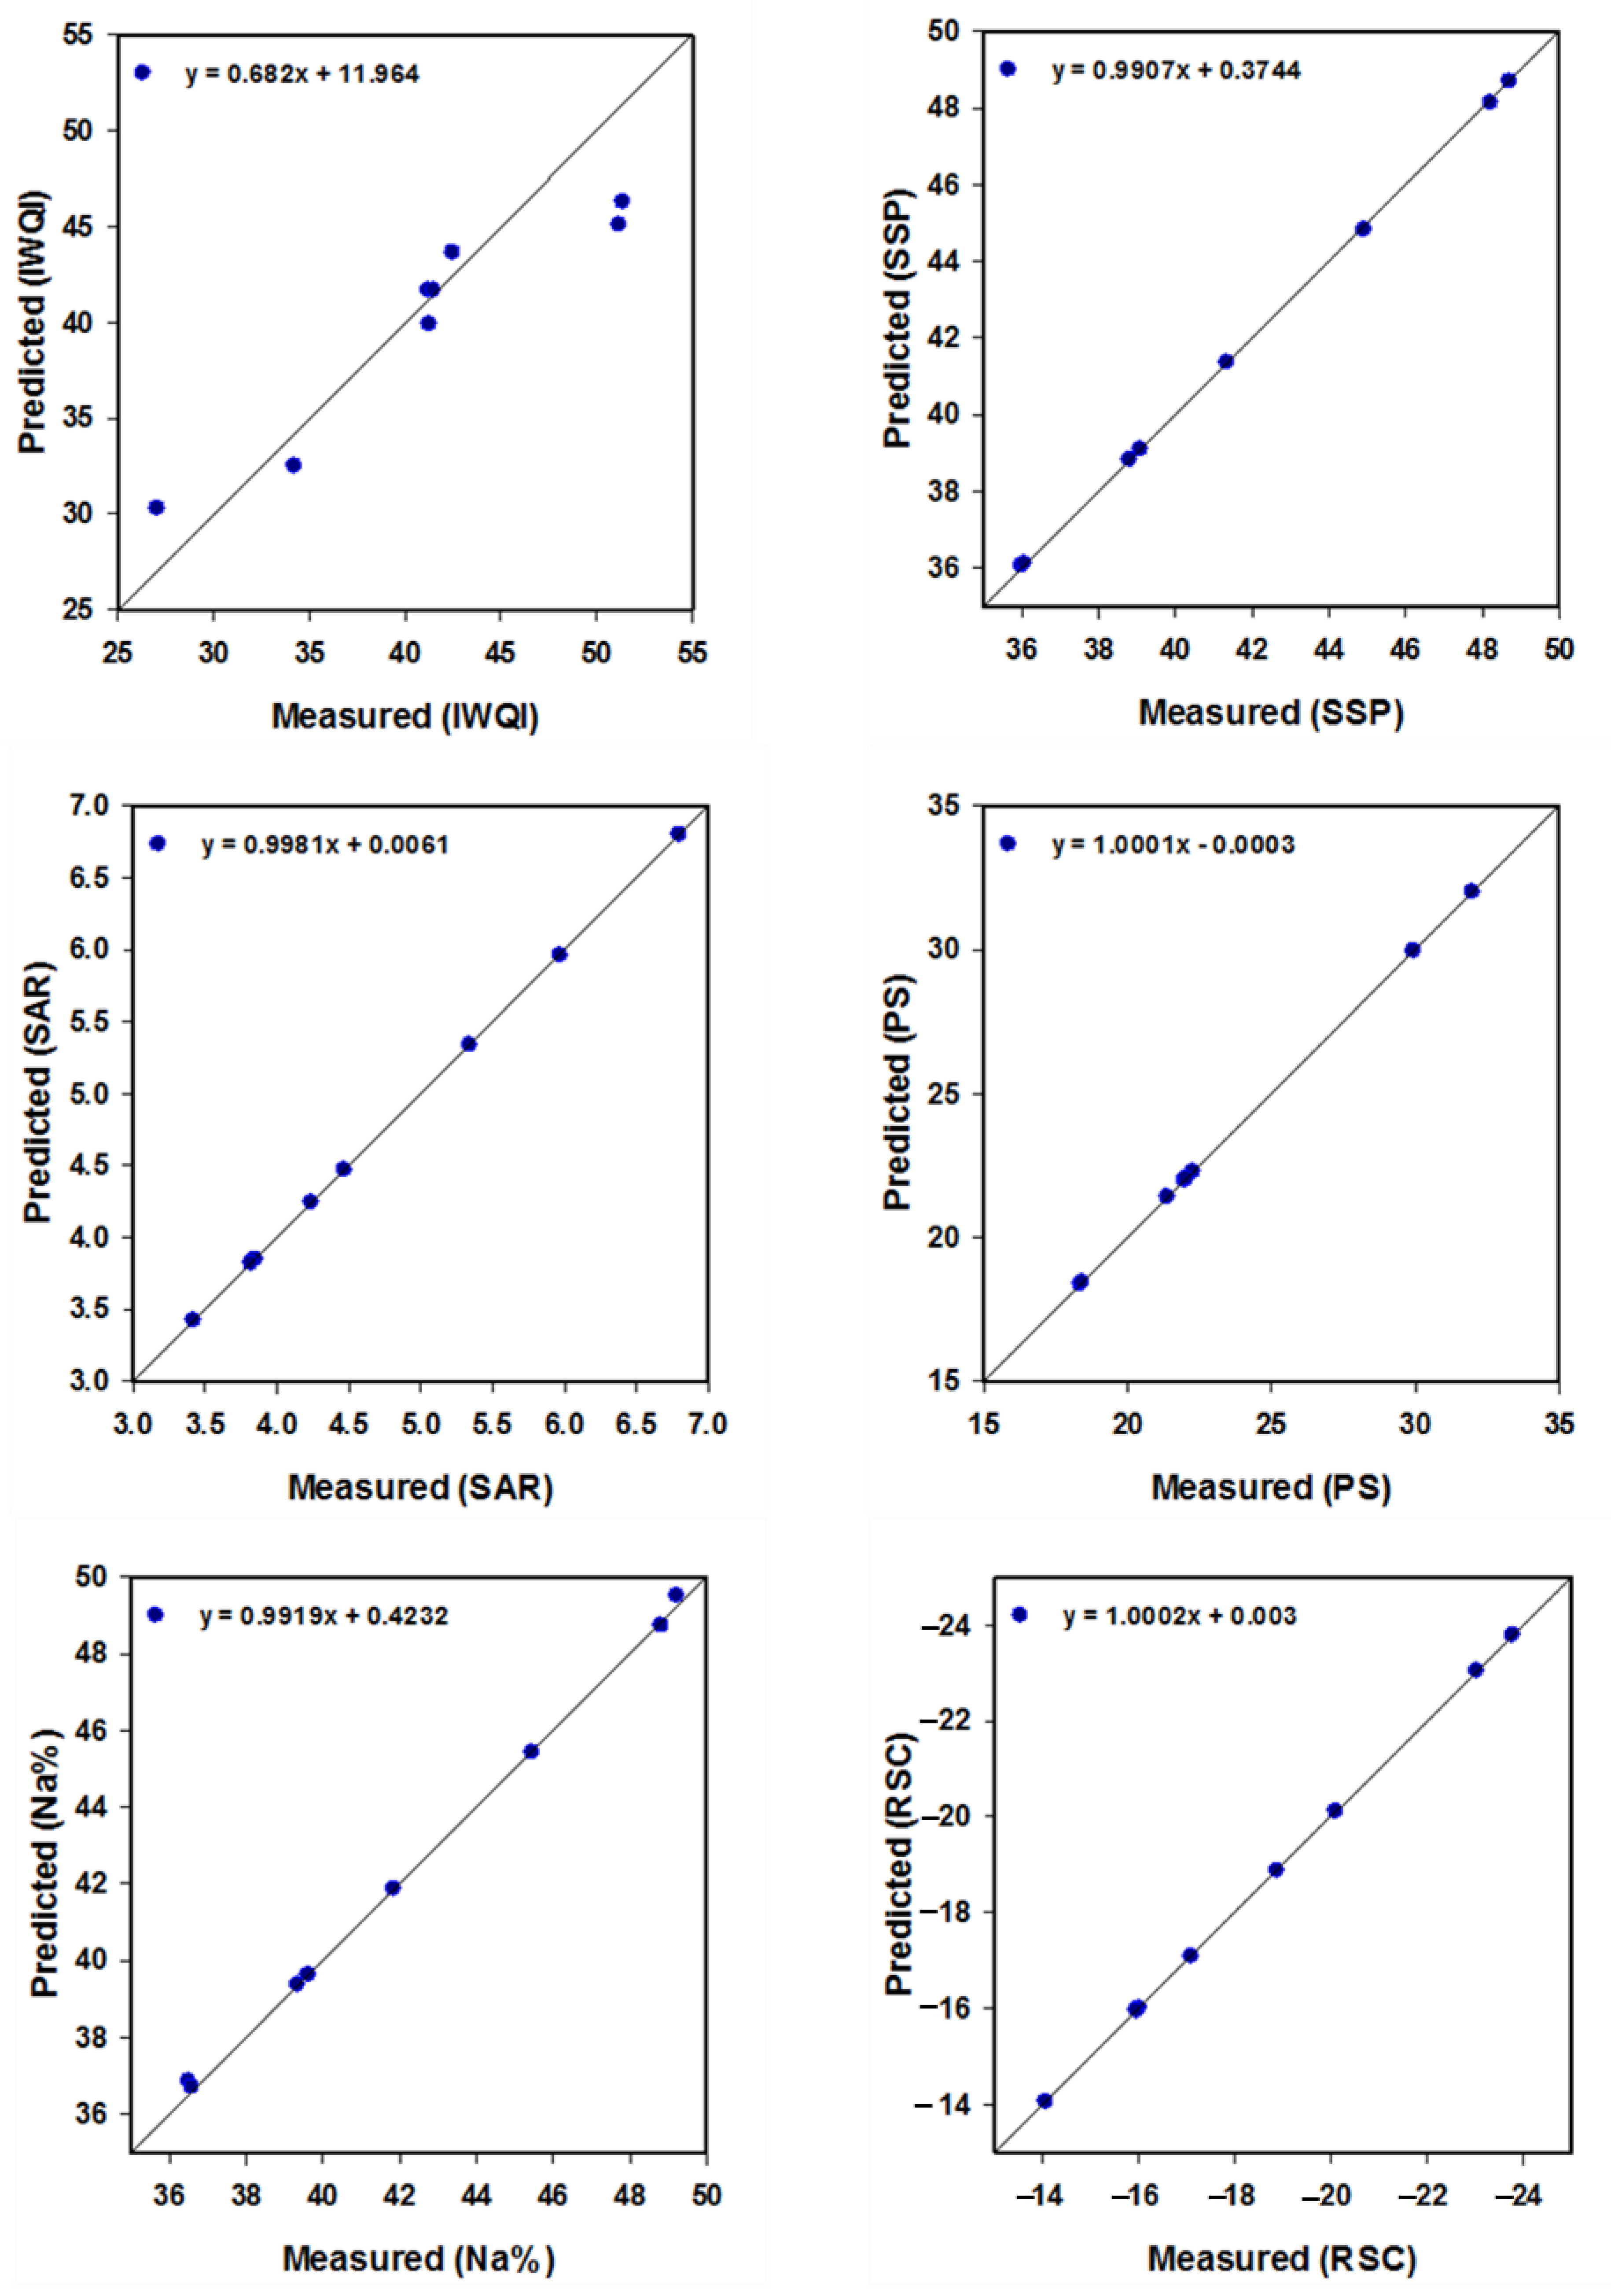
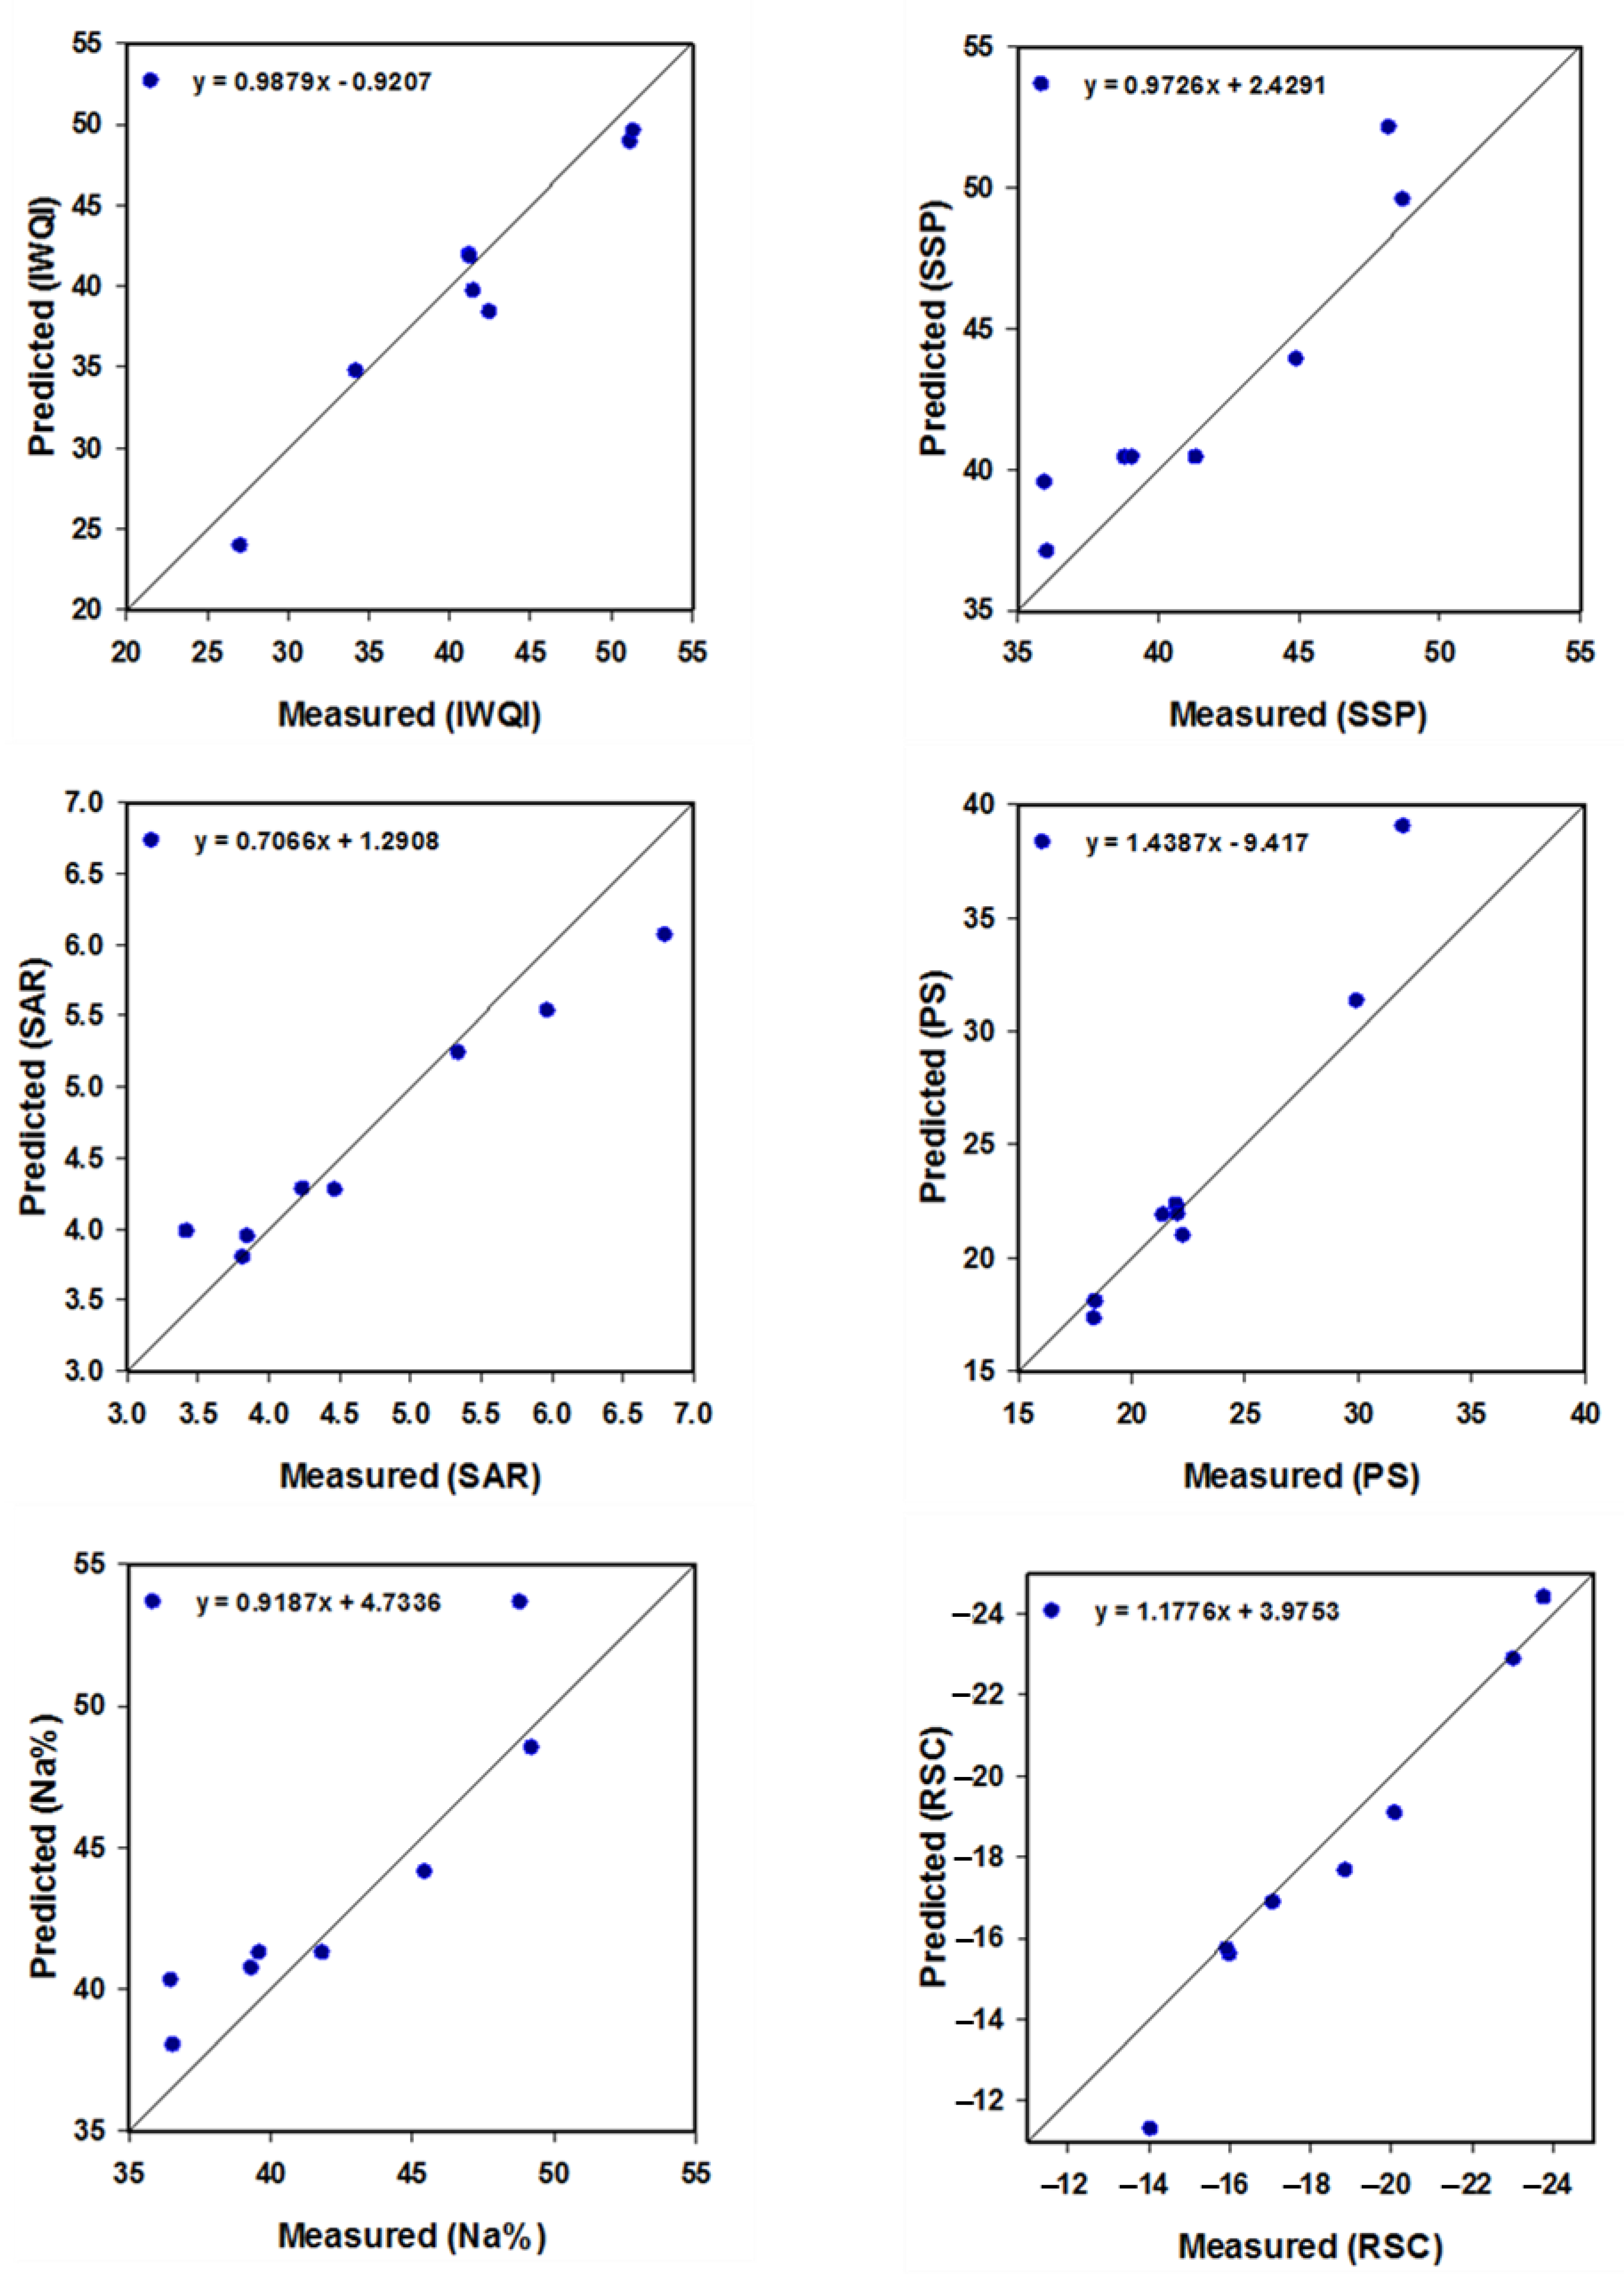
Disclaimer/Publisher’s Note: The statements, opinions and data contained in all publications are solely those of the individual author(s) and contributor(s) and not of MDPI and/or the editor(s). MDPI and/or the editor(s) disclaim responsibility for any injury to people or property resulting from any ideas, methods, instructions or products referred to in the content. |
© 2023 by the authors. Licensee MDPI, Basel, Switzerland. This article is an open access article distributed under the terms and conditions of the Creative Commons Attribution (CC BY) license (https://creativecommons.org/licenses/by/4.0/).