1. Introduction
Climate changes occurring in urban and rural areas have affected river environments and caused the necessity for flexible river management and control [
1]. In order to control rivers efficiently, several large weirs have been installed in the Nakdong River in Korea. The installation of weirs has caused additional changes to the river, with the installation of discharge control facilities and an increase in river recreational areas. With the changes to the rivers due to weir installments, the utilization of river recreational areas has been a topic of interest for many research and legislative guidelines [
2]. Also, since the Nakdong River flows beside many large cities, the local population has access to recreational and outdoor activities that could be conducted in nearby rivers. In order to provide conditions for safe and efficient riverside recreational activities for the public, adequate information on the river status should be provided. Therefore, the necessity for accurate estimations of water quality and hydraulic parameters in riverside recreational areas would be crucial in providing information to users that participate in recreational activities.
Although a willingness to participate in recreational activities is existent, currently, standard assessment systems to evaluate safe conditions for recreational areas are insufficient. The management of water conditions and water quality require the collection and analysis of large datasets that must be evaluated correctly. However, water resource management in government and provincial districts may not have professional training or suitable personnel to evaluate the data properly. Therefore, a range of tools have been previously developed to evaluate water conditions and water quality data. Water quality indices are a tool that was developed to assess the water quality in certain fields. These types of tools usually use a type of function which allows for the analysis of various sets of water quality data with temporal variation to produce a single value that indicates the water condition [
3,
4,
5].
The data aggregation and functions used for this type of research are related to methods such as fuzzy inference, neural networks, or regression models [
6,
7,
8,
9]. They are practical for water management in provincial districts as they are relatively easier to use and understand than complex water quality and hydraulic water datasets. Studies that used these types of indices were limited to water quality datasets only, since the parameters which are concerned with water quality are extensive. However, the necessity for an index for hydraulic parameters exists, since riverside activities are affected by hydraulic parameters, and the evaluation of these conditions using an index would be more efficient than analyzing the hydraulic data directly for regional water management personnel that are not familiar with the hydraulic parameters. Researchers and end users face a challenge in using and evaluating large amounts of various data that could be monitored, as well as the time and resources that are required to collect and analyze the parameters. In order to solve this challenge, researchers have begun to use various indices that use various evaluated sets of hydraulic and water quality variables, which would later be combined into a single value to classify water quality more efficiently for end users, such as those involved in water management for local districts [
10].
Various water quality and hydraulic parameters are used as inputs, and each are supported by a mathematical tool that converts the chosen quantitative water parameters into a single number between 0 and 100 [
11]. This single number serves as an indicator for the water quality with regard to the intended end use, such as river recreational activities [
12,
13]. Key components of this approach include selecting appropriate water quality and hydraulic parameters for measurement and determining a weighting factor for each parameter that reflects its relative importance for the intended end use. The widespread acceptance of these parameters and their corresponding weights is crucial for the success of this approach. The critical steps in this process are the selection and acceptance of the monitored water quality and hydraulic variables, as well as the determination of a weighting factor for each variable that indicates the importance of each parameter for appropriate evaluation. The information covers a range of river characteristics and parameters, and especially water quality variables and their evaluation are crucial for determining the possibility of recreational activities, because poor water quality can negatively impact human health for those participating in riverside activities.
Therefore, this study will develop a new vulnerability index using hydraulic and water quality datasets, considering riverside activities to be used in river condition assessments. The fuzzy inference method will be used for the data evaluation, which will then be aggregated to a single value that is targeted for water management in provincial districts. The developed index will be applied to the target provincial study area for evaluation. Also, this method will be evaluated and combined with a flow model for comprehensive river assessments.
The novelty of this study would be the application of fuzzy theory to hydraulic parameters to create the hydraulic index for recreation in rivers. Although former research has used fuzzy theory to create a model to assess impacts on the ecosystem, using parameters such as the pH, conductivity, biochemical and chemical oxygen demand, and nitrate concentration to find the effects of possible recreational activities [
14], an application of this method for a hydraulic index has not been utilized before. With this novel method, river assessments based on hydraulic parameters could be performed efficiently. It also has high applicability, as this method could be applied using a flow model for spatial river assessment on the suitability of river recreation.
2. Background Theory and Methodology
2.1. Index Development Using Fuzzy Synthetic Evaluation
To develop the vulnerability index for the assessment of riverside areas, the fuzzy synthetic evaluation method was used. The fuzzy synthetic evaluation method is based on fuzzy logic applied to a decision-making method. This method was developed to deal with complex systems and situations that contain uncertainty and imprecise conditions [
15,
16], since some water quality parameters are not precise and may require specific terms to express uncertainties when dealing with effects on human safety [
17]. Also, parameter values which only have significant meaning to experts can be changed into indices using fuzzy sets. These indices then will be related into a sort of acceptability measure, which can be created with the membership functions in a fuzzy set of acceptable conditions of water quality and hydraulics. Therefore, this research will use the fuzzy theory and the fuzzy synthetic evaluation approach [
18,
19] to translate these parameters into an index.
The advantage of using fuzzy logic is the ability to deal with subjective data with high uncertainty. Although this vagueness may seem to be a weakness in certain fields of study where exact and precise data are required, fuzzy logic is powerful in areas that involve conditions or acceptability for human beings. Also, since the variables and parameters that are used in these types of research may be difficult for people with less knowledge in the area, fuzzy logic would enable the values to reach a certain meaning, which would help decision-makers that are not scientists and engineers to understand the acceptability of the values.
Fuzzy logic uses membership values that range from zero to one to show how an environmental variable is represented within a set of conditions. Values that are close to one would be considered acceptable, while values which are close to zero would be considered non-acceptable. Intermediate values which are relatively fuzzy would have membership values near the middle. These values could be shown in the form of a graph, becoming membership functions [
20,
21]. Also, in most situations, more than one environmental variable could be considered important; then, the ‘membership degree’ could be defined to represent the acceptability of the
ith environmental variable. Then, these partial memberships could be combined with several different methods to finally reach a general measurement status of acceptability.
In cases using several environmental variables, the method in which partial memberships are combined into a single value depends on the field of application. The variables could have a minimum standard, in which, if a certain variable does not reach a designated level, the entire value becomes zero. This is applied to fields where the minimum standards are associated with values which may cause lethal results, such as extreme temperatures, no oxygen, etc. In these types of applications, the memberships would be determined based on the minimization of membership degrees. However, in most areas, the values would have compensatory effects, where the low acceptability of a certain value may be compensated with the higher acceptability of other values. The methods regarding how each variable is combined with weighted values are various, and may depend on which variables are used for research and the relationships between each variable [
22].
Figure 1 shows the typical mathematical sets that are used for research,
A, and fuzzy membership sets,
as membership functions, which could be defined using Equations (1) and (2) [
7,
21]:
where
is the membership function in set
, and
is the membership function of set
. In fuzzy theory, all information and the acceptability of each variable are defined based on the membership function, so defining how the value changes through the membership function is crucial in the accurate representation of acceptability. The membership function may be formed in various shapes, in which the simplest shape for application is the triangular type. Other shapes include the trapezoidal type, Gaussian types, bell types, and s-shaped types [
23].
The application of water quality standards was shown with the development of the water quality index by former researchers [
24,
25,
26]. After the determination of the quality classes of the parameters using membership functions, the values could be later combined with a fuzzy rule base to a single value. In this study, the fuzzy inference method was also used for the application to hydraulic parameters to create the vulnerability index.
2.2. Development of the Vulnerability Index
The vulnerability index should consider both water quality variables and hydraulic variables for the safety of people using recreational parks and facilities. The water quality variables and their grades, shown in
Table 1, were selected from variables that are measured automatically from water quality gauge sites in Korea, and are also suggested based on the WHO and USA standards [
27]. The water quality gauge sites provided daily values for the water quality variables for the pH, DO, turbidity, and Chl-a, so these parameters were determined to be appropriate for the index calculation.
The hydraulic variables were selected based on the stream gauge data from the test site. They consist of the velocity, water surface elevation, and water surface top width. In the case of velocity, the following standards, shown in
Table 2, by Mosley [
28] were used for this research. The acceptable values for velocity were defined for each recreational activity.
Using the introduced standards and ranges, the recreational index follows
Figure 2 for constructing membership functions for each water quality variable for the water quality index, and recreational activities for the hydraulic index. The acquired values are then changed into values ranging from zero to one using the membership functions; later, the results are integrated to become the vulnerability index.
The transformation of the acquired values into the membership functions was based on the fuzzy synthetic evaluation method. Index estimation models using the fuzzy method have been widely adapted in many research studies concerning water quality values [
29,
30,
31]. Then, the aggregation method, using the additive function, was applied for the integration of the result of the fuzzy method for each parameter.
For the parameter weighting function, the relative importance of the water quality parameters was determined to be equal. For the case of the hydraulic index, the weights were determined by a panel and survey with experts from universities and water engineering companies. This led to the weight values of 0.45, 0.40, and 0.15 for the water velocity, water surface elevation, and water surface width, respectively. After the parameter weights were applied to the hydraulic membership values, the final index was created.
3. Application and Index Development
3.1. Target Area
To evaluate the recreational conditions in rivers, the method developed in this research was applied to the Nakdong river, as shown in
Figure 3. The river is 510 km long, while the study area ranges up to 10 km, starting from the Nam river confluence up to the Changnyeong–Haman weir. The weir controls the river flow and has a depth of up to 9 m, and has nearby water intake facilities which supply water to neighboring cities, with populations over 3 million. The construction of the weir in 2012 caused the water depth to increase, which caused some retention in the river flow, which would affect the possibility of pollution in the water, so the analysis for the river conditions for recreational activities after the weir construction became necessary, since the environment had changed. Since the target study area contains a large weir that governs the river flow, changes in hydraulic parameters have a significant impact on the vulnerability index. Therefore, the hydraulic characteristics should be considered along with the water quality parameters to be integrated into a single index for the accurate evaluation of the river area. Also, the study area consist of mainly floodplains which have recreational parks, camping areas, and walking roads for recreational areas, and is used frequently by many people, with several citizens participating in river recreation. The study area has both water quality and hydraulic gauging stations, which acquired the data used in this research.
3.2. Development of the Hydraulic Index Based on Activities
The hydraulic membership functions were created using the following stages. First, the parameters which would be selected for the hydraulic index were chosen. Then, the criteria for dividing the index were determined using the recommended values from
Table 2. In the cases of water surface elevation, the safety standard of the water surface level measured from the Jindong gauging station was used [
32]. Using these criteria, each membership function for the hydraulic index was defined. Finally, the membership functions were then integrated into the hydraulic index. The indices consisted of velocity, water surface elevation, and water surface top width. Triangular and trapezoidal shapes were used as the membership functions, and the result of the functions based on recreational activities are shown in
Figure 4. The specific values were based on the information in
Table 2, and then were changed into the membership functions shown below. The triangular membership functions can be defined using Equations (3) and (4), which are similar to previous research [
29].
For the hydraulic index, the grades consisted of three classes, which were good, average, and poor, which follows the criteria introduced above.
3.3. Development of the Water Quality Index
Using the same method as the hydraulic index for creating the water quality index, the following parameters of pH, DO, turbidity, and chlorophyll a were selected, and membership functions were created using the criteria recommended by the WHO. Triangular and trapezoidal shapes were used as the membership functions, and the result of the functions based on recreational activities are shown in
Figure 5. The triangular membership function is the following equation, Equation (5), using the parameters of pH, DO, turbidity, and chlorophyll a for four grades, with a total of 16 values. The value
ui,j would show the water quality parameter
i, in a grade of
j.
3.4. Hydraulic Parameter Estimation
To calculate the values for the hydraulic index in the river, the measured hydraulic data from the gauge site was used. Then, a 2D flow model was utilized so that the hydraulic values could be obtained spatially throughout the river. First, the representative discharge values were determined from low-flow to median-flow values.
Figure 6 shows the discharge duration curve using acquired data form the Jindong Gauging Station from 2013 to 2022. This study used eight sections from the discharge duration curve to estimate the hydraulic values, which would later be converted into the hydraulic index. Then, the depth-averaged numerical model, HDM-2D [
33], was applied to the test area, which used an upwind Petrov–Galerkin stabilization approach from the finite element method. The model is a general-purpose two-dimensional surface flow model that can simulate channel flows and urban inundation, and has been used and verified in various research [
34].
4. Application Results
4.1. Application of Water Quality Index
The water quality data for the four parameters of pH, DO, turbidity, and chlorophyll a were acquired from 2017 to 2022, with the exception of turbidity in 2017 at the Chilseo site. The data were acquired daily from the auto-measuring water quality gauge sites of Choengam and Chilseo, located in the Nakdong River. The data were accumulated from the Water Environment Information System from the Ministry of Environment. The data for each water quality parameter are shown annually in
Figure 7, which shows the time series and periodicity of the parameters. Most of the values showed a periodic nature, with high pH, low DO, high turbidity, and high chlorophyll in the summer. The box plot in
Figure 8 shows the mean values with the x point, the median values with the line inside the box, and the box representing the quartile range of the water quality values, which shows that the pH values and turbidity values increased incrementally.
Then, using the above acquired data, the data were combined into a single water quality index value. Each parameter used the membership indices from
Figure 5 to be transferred into a sub-index value. Then, the parameter weights for each value were considered to be equal, and the combined water quality index was calculated, as shown in
Figure 9. Then, the combined results showed the time series water quality index data, and the values showed temporally low and high values with certain time periods, with high pH, low DO, high turbidity, and high chlorophyll a, especially in the summer of 2018 and 2022. Other low values were shown in periods in which the turbidity and chlorophyll a peaked. In the case of DO, the values would follow a periodic form, which is due to the dissolved oxygen following the temperature of the river body. In normal situations, lower temperatures would lead to a higher DO.
4.2. Application of the Vulnerability Index
The vulnerability index, using the combined results of the water quality index and the hydraulic index data, as well as the criteria from
Figure 4, was applied to both water quality gauge sites. To calculate the hydraulic index, the measured discharge data and the water surface elevation shown in
Figure 10 from the gauge site were used to estimate the flow velocity at the gauge site using geometry data at the gauge point. Also, with the measured water surface elevation, the top width of the water surface was also estimated and applied to the criteria for each recreational activity to calculate the hydraulic index for the study area.
To finally create the vulnerability index shown in
Figure 11, the water quality index results in
Figure 9 were combined with the hydraulic index for each recreational activity. This result shows how the vulnerability index could show at which time a certain type of recreation would be considered preferrable using combined water quality and hydraulic data. The vulnerability index results would usually follow the results of the water quality index, but also have the effect of the hydraulic parameters, such as estimated velocity results, which greatly lowered the index values, especially in summertime, where high discharge was measured due to high rainfall in the summer season, which is shown frequently in the Nakdong River in Korea. Therefore, the vulnerability index would show the values in which safe river recreation activities would be possible, using both water quality and hydraulic data.
This highlights the importance of considering the specific requirements of different recreational activities when assessing water quality and hydraulic acceptability. Overall, the vulnerability index results provide valuable information for assessing the suitability of each recreational activity, both inside and near to water, and identifying potential timings of concern that may require management strategies to ensure safe recreational experiences.
4.3. Application of Two-Dimensional Model for the Hydraulic Index
To find additional applicability and utilization of the vulnerability index for later uses, the two-dimensional flow model HDM-2D was used in conjunction with the hydraulic index to generate results that provide a comprehensive assessment of hydraulic acceptability for different recreational activities. The flow model utilizes bathymetry and boundary conditions such as discharge and water depth, which are used to simulate the water flow in the target river area. Then, the flow model results, such as the water velocity and water depth, are used to calculate the hydraulic index for each area of the river system. These results would be the basis for estimating the values of the memberships for the hydraulic index.
First, the discharge conditions from the flow duration curve were selected to represent the discharge in eight flow situations. Then, the flow model simulations were conducted to find the water depth and velocity from the two-dimensional flow model, which would be used later as input parameters for the hydraulic index.
Figure 12 shows the results of the two-dimensional model, applied to the target area. The two-dimensional flow model could identify areas that may pose potential hazards or risks to recreational activities due to high velocity or high water depth, which could make swimming or boating dangerous.
The flow model results show the changes in flow velocity and water depth according to eight different discharge conditions from the duration curve. The velocity north of the island showed exceptionally large values compared to other regions of the target area. In contrast, a velocity decrease with the flow discharge decrease was shown, especially at the south of the island, indicating that this area had the most changes in the flow parameters due to discharge condition changes. The discharge conditions did not cause a large difference in the water depth, possibly due to the fact that the target area river is very large, with a width of nearly 800 m, so the discharge changes would not affect the water depth considerably.
4.4. Application of Hydraulic Index Based on Activities
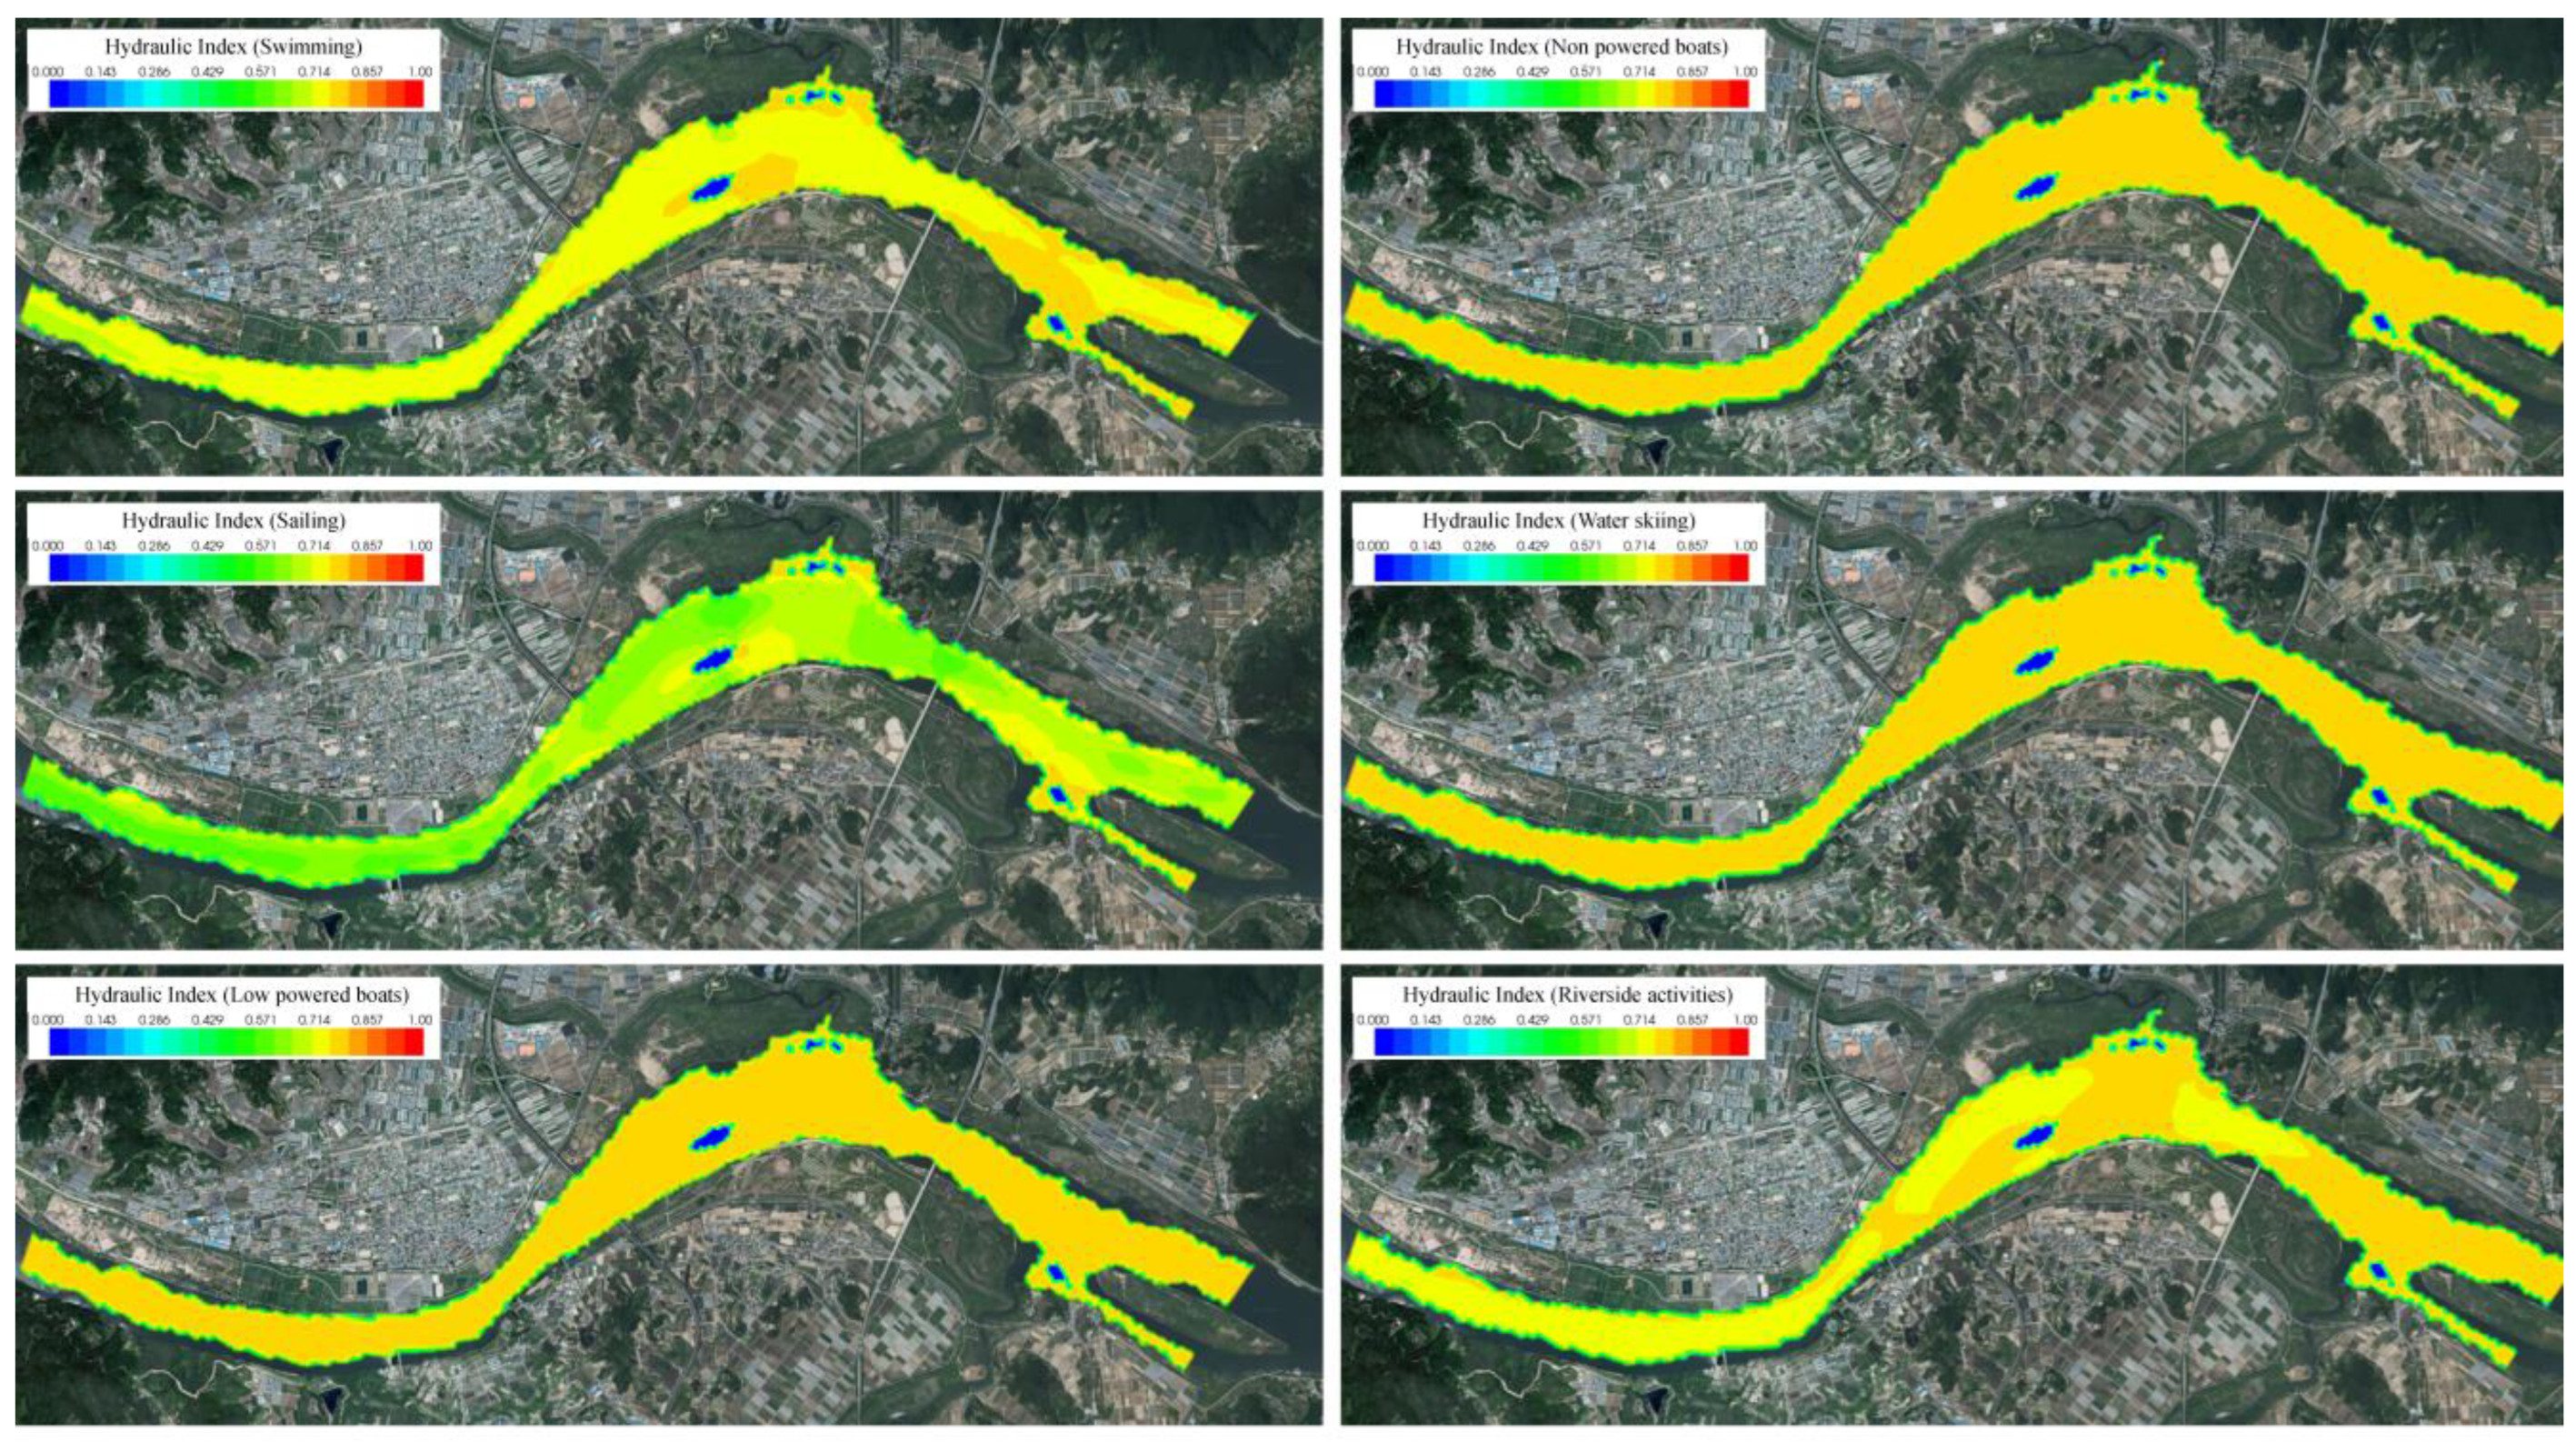
The results from the two-dimensional flow model were then applied to the hydraulic index to create the index results, mapped onto the entire area downstream of the weir, which is depicted in the 2D map shown in
Figure 13 using discharge condition 1, which is the first marked point 1 from the discharge duration curve that was shown in
Figure 6. The results are shown in the figure based on each recreational activity. The index would show the hydraulic acceptability of each area, which was the result of the flow model parameters. The results showed that most values were in the range of 0.5 to 0.8, which would be considered ‘average’. The area in the middle of the river was shown to be ‘poor’, due to the small island located in the area. Furthermore, the results revealed that swimming and sailing activities had lower hydraulic acceptability values compared to other activities. This was attributed to the higher standards that these activities typically require, particularly with regard to the simulated velocity from the flow model. Near the downstream area of the island, sailing activities would be more acceptable due to the lower flow velocity results, which coincide with the swimming activities results. Also, a higher hydraulic index was estimated at the northern area of the target river due to the lower velocity flow results in the area. Then, the calculated hydraulic index based on the two-dimensional flow model results were compared with the index based on the measured data from the gauge site in
Figure 11 for the Chilseo and Cheongam sites, to find if the calculated index was sufficient to reflect the changes in the hydraulic parameters spatially. Shown as in
Table 3, the hydraulic index based on the two-dimensional flow model compared well with the results of the index based on the gauge-measured results, with differences ranging between 0.8 and 6.5%. This shows how the index could be used to find spatial areas in which the recreation would be more preferrable or unsuitable for each activity.
5. Discussions
The indices used in this research can be utilized to find the effects of discharge changes on water quality. An additional analysis to find the effect of discharge on the water quality index were conducted by comparing the results of the index in two different water quality measurement stations. Using the eight different discharge conditions from the duration curve, the data from
Figure 9 and
Figure 10 were used with the data from the target area, which were measured from the gauging station in
Figure 3. The comparison of the water quality index results from the two stations according to discharge conditions are shown in
Figure 14. The comparison shows that, as the flow increased in the target area with the weir, the water quality index values tended to decrease. It is assumed that higher values of discharge were induced by increased precipitation at the site, and usually, increased rainfall would transport riverside pollution or increase turbidity in the rivers, which then causes lower water quality values. High turbidity could cause the water to be unclear, and not recommended for direct contact. High values of chlorophyll a would lead to a high algae biomass in the waterbody, which would cause bad odors and decreased levels of dissolved oxygen. Some algae may produce toxins that could be a health concern.
Overall, the main points of this paper are the following:
This study collected water quality data for four parameters, and the data were used to create a combined water quality index, which allowed for a more holistic understanding of water quality over time by considering changes in multiple parameters;
The resulting combined water quality index values showed temporal fluctuations, with certain time periods showing high values for pH, low values for DO, high turbidity, and high chlorophyll a, particularly during the summer of 2018 and 2022;
This study provides insights into the temporal patterns of water quality in the target area, and also showed how discharge increases affect water quality decreases;
The hydraulic index showed how to identify areas in which certain recreational activities would be appropriate or unacceptable;
This study highlights the importance of using the vulnerability index for monitoring and managing water resources, as it allows for a more comprehensive understanding of the possibilities for water usage and recreation.
In accordance with point five, by identifying these areas, management and mitigation strategies can be implemented to reduce the risk to recreational users and maintain a safe and enjoyable experience. Another key insight is the ability to assess the impact of different factors on recreational acceptability. For example, the hydraulic index is used to evaluate the impact of changes in flow rate and water depth, affecting hydraulic acceptability for different recreational activities. This can provide valuable information for decision making related to water management, infrastructure development, and land-use planning.
This research shows differences with former research such as the one conducted by Ioannidou [
14], by using hydraulic parameters for creating the index, while former research has focused only on water quality parameters using the fuzzy method. Overall, the hydraulic index can serve as a valuable tool for assessing hydraulic acceptability and identifying potential hazards or risks to recreational activities in river systems. By providing detailed and accurate results, the hydraulic index can help to guide management and mitigation strategies, to ensure safe and enjoyable recreational experiences for users. This is significant, since analyzing the hydraulic data directly for regional water-management personnel that are not familiar with the hydraulic parameters would be a challenge. There could be problems, especially in rural regional government areas, where there is a lack of experienced researchers managing the rivers, so an index such as the one developed in this study would be helpful in decision and policy making for these areas. Therefore, by using various indices, using sets of evaluated hydraulic and water quality variables combined into a single value to classify water quality more efficiently, it would be more suitable for end users such as policy makers and rural water management.
The limitations of this study are the lack of other spatial measurements using ADCPs or ADV. Since this research did not conduct additional ADCP or ADV measurements in the river, the comparisons were limited to the water quality gauge sites. This was due to the reason that the flow model development was not the main focus, but rather the development and application of a method to evaluate recreational activity acceptability. Also, the vulnerability index was created using only water quality data that were measured daily at water quality measurement sites, so the number of water quality parameters used for the index was limited to four. Future studies with more water quality data could be conducted if other variables were also collected daily.
6. Conclusions
In this study, a vulnerability index and hydraulic index for recreational activities were developed for assessments in riverside areas to provide water quality and hydraulic information to the public. These novel indices consist of several river recreational activities such as swimming, water skiing, canoeing, etc., and were calculated using hydraulic information. The hydraulic information and water quality information were integrated with fuzzy synthetic evaluations, with parameters such as velocity, water surface elevation, and water surface width for the hydraulic information, and the DO, pH, turbidity, and chlorophyll a for the water quality information measured at the automatic water quality measurement sites. Each parameter was given a membership degree value using membership indices, and the parameter weights were considered to be equal to be combined into a single water quality index value. The importance of such an index lies in the fact that it provides a comprehensive assessment of water quality with regard to the specific recreational activities that people engage in, either on or near a river. Also, the index would identify areas in which certain recreational activities would be appropriate or unacceptable. Data analysis combined with water quality index values showed temporal fluctuations, with certain time periods showing high values for pH, low values for DO, high turbidity, and high chlorophyll a, particularly during the summer of 2018 and 2022.
Then, for an additional analysis and application of the proposed index, it was applied to the Nakdong River, downstream of a large weir. The hydraulic index was also combined with the results from a two-dimensional flow model for the spatial representation of the index, for the categorization of the safe recreational acceptability level in the river. This showed the hydraulic indices mapped onto a 2D plane for information on acceptability for recreational activities. The results showed that the calculated index was sufficient to reflect changes in the hydraulic parameters shown with spatial data, with a comparison to the index calculation from the gauge-measured data, with differences ranging from 0.8% to 6.5%.
Overall, this study provides valuable information on water quality and the acceptable hydraulic values for recreation in the Nakdong River, and shows the applicability of a combined vulnerability index for monitoring water resources in the target area. This study’s findings could be a valuable tool and guide to inform management decisions, ensuring safe water resources for human use. Future studies using remote sensing to acquire spatial water quality data will improve the index, with additional spatial data representing water quality, which could be combined with the created vulnerability index for the better representation of the conditions in rivers.
Author Contributions
Conceptualization, J.S. and I.W.S.; methodology, J.S. and I.W.S.; software, J.S. and T.G.K.; validation, J.S. and T.G.K.; writing—original draft preparation, Y.D.K. and T.G.K.; writing—review and editing, J.S., T.G.K. and Y.D.K.; project administration, I.W.S. and Y.D.K.; funding acquisition, Y.D.K. All authors have read and agreed to the published version of the manuscript.
Funding
This research was funded by the research fund of the aquatic ecological health technology development project of the Ministry of Environment, grant number 2021003030005.
Data Availability Statement
The data presented in this study will be shared by the authors if requested.
Conflicts of Interest
The authors declare no conflict of interest.
References
- Field, C.B. (Ed.) IPCC 2014 Summary for Policymakers. In Climate Change 2014: Impacts, Adaptation, and Vulnerability. Part A: Global and Sectoral Aspects. Contribution of Working Group II to the Fifth Assessment Report of the Intergovernmental Panel on Climate Change; Cambridge University Press: Cambridge, UK; New York, NY, USA; pp. 1–32.
- Korea Water Resources Association. Explanation of River Design Standards; Korea Water Resources Association: Daejeon, Republic of Korea, 2019. [Google Scholar]
- Uddin, M.G.; Nash, S.; Olbert, A.I. A review of water quality index models and their use for assessing surface water quality. Ecol. Indic. 2021, 122, 107218. [Google Scholar] [CrossRef]
- Uddin, M.G.; Nash, S.; Rahman, A.; Olbert, A.I. A comprehensive method for improvement of water quality index (WQI) models for coastal water quality assessment. Water Res. 2022, 219, 118532. [Google Scholar] [CrossRef]
- Sutadian, A.D.; Muttil, N.; Yilmaz, A.G.; Perera, B.J.C. Development of river water quality indices—A review. Environ. Monit. Assess. 2016, 188, 58. [Google Scholar] [CrossRef]
- Lobato, T.C.; Hauser-Davis, R.A.; Oliveira, T.F.; Silveira, A.M.; Silva, H.A.N.; Tavares, M.R.M.; Saraiva, A.C.F. Construction of a novel water quality index and quality indicator for reservoir water quality evaluation: A case study in the Amazon region. J. Hydrol. 2015, 522, 674–683. [Google Scholar] [CrossRef]
- Gharibi, H.; Mahvi, A.H.; Nabizadeh, R.; Arabalibeik, H.; Yunesian, M.; Sowlat, M.H. A novel approach in water quality assessment based on fuzzy logic. J. Environ. Manag. 2012, 112, 87–95. [Google Scholar] [CrossRef] [PubMed]
- Chau, K.W. A review on integration of artificial intelligence into water quality modelling. Mar. Pollut. Bull. 2006, 52, 726–733. [Google Scholar] [CrossRef] [PubMed]
- Shil, S.; Singh, U.K.; Mehta, P. Water quality assessment of a tropical river using water quality index (WQI), multivariate statistical techniques and GIS. Appl. Water Sci. 2019, 9, 168. [Google Scholar] [CrossRef]
- Hernández-Romero, A.H.; Tovilla-Hernández, C.; Malo, E.A.; Bello-Mendoza, R. Water quality and presence of pesticides in a tropical coastal wetland in southern Mexico. Mar. Pollut. Bull. 2004, 48, 1130–1141. [Google Scholar] [CrossRef]
- Lumb, A.; Sharma, T.C.; Bibeault, J.F. A review of genesis and evolution of water quality index (WQI) and some future directions. Water Qual. Expo. Health 2011, 3, 11–24. [Google Scholar] [CrossRef]
- Massoud, M.A. Assessment of water quality along a recreational section of the Damour River in Lebanon using the water quality index. Environ. Monit. Assess. 2012, 184, 4151–4160. [Google Scholar] [CrossRef] [PubMed]
- Almeida, C.; González, S.O.; Mallea, M.; González, P. A recreational water quality index using chemical, physical and microbiological parameters. Environ. Sci. Pollut. Res. 2012, 19, 3400–3411. [Google Scholar] [CrossRef] [PubMed]
- Ioannidou, I.A.; Paraskevopoulos, S.; Tzionas, P. Fuzzy modeling of interactions among environmental stressors in the ecosystem of Lake Koronia, Greece. Environ. Manag. 2003, 32, 624–638. [Google Scholar] [CrossRef]
- Chang, N.B.; Chen, H.W.; Ning, S.K. Identification of river water quality using the fuzzy synthetic evaluation approach. J. Environ. Manag. 2001, 63, 293–305. [Google Scholar] [CrossRef]
- Zadeh, L.A. Fuzzy sets. Inf. Control 1965, 8, 338–353. [Google Scholar] [CrossRef]
- Silvert, W. Fuzzy indices of environmental conditions. Ecol. Model. 2000, 130, 111–119. [Google Scholar] [CrossRef]
- Zadeh, L.A. Outline of a new approach to the analysis of complex systems and decision processes. IEEE Trans. Syst. Man Cybern. 1973, 1, 28–44. [Google Scholar] [CrossRef]
- Ross, T.J. Fuzzy Logic with Engineering Applications; University of New Mexico: Albuquerque, NM, USA, 1995. [Google Scholar]
- Wu, Z.; Wang, X.; Chen, Y.; Cai, Y.; Deng, J. Assessing river water quality using water quality index in Lake Taihu Basin, China. Sci. Total Environ. 2018, 612, 914–922. [Google Scholar] [CrossRef] [PubMed]
- Seo, I.W.; Choi, S.Y. Development of River Recreation Index Model by Synthesis of Water Quality Parameters. J. Korean Soc. Civ. Eng. 2014, 34, 1395–1408. [Google Scholar]
- Jang, J.S.R.; Sun, C.T.; Mizutani, E. Neuro-Fuzzy and Soft Computing: A Computational Approach to Learning and Machine Intelligence; Prentice-Hall: Saddle River, NJ, USA, 1997. [Google Scholar]
- Icaga, Y. Fuzzy evaluation of water quality classification. Ecol. Indic. 2007, 7, 710–718. [Google Scholar] [CrossRef]
- Tyagi, S.; Sharma, B.; Singh, P.; Dobhal, R. Water quality assessment in terms of water quality index. Am. J. Water Resour. 2013, 1, 34–38. [Google Scholar] [CrossRef]
- Wang, W.C.; Xu, D.M.; Chau, K.W.; Lei, G.J. Assessment of river water quality based on theory of variable fuzzy sets and fuzzy binary comparison method. Water Resour. Manag. 2014, 28, 4183–4200. [Google Scholar] [CrossRef]
- Petersen, W.; Bertino, L.; Callies, U.; Zorita, E. Process identification by principal component analysis of river water-quality data. Ecol. Model. 2001, 138, 193–213. [Google Scholar] [CrossRef]
- World Health Organization. Guidelines for Safe Recreational Water Environments, Volume 1: Coastal and Fresh Waters; World Health Organization: Geneva, Switzerland, 2003. [Google Scholar]
- Mosley, M.P. Flow requirements for recreation and wildlife in New Zealand rivers—A review. J. Hydrol. 1983, 22, 152–174. [Google Scholar]
- Lermontov, A.; Yokoyama, L.; Lermontov, M.; Machado, M.A.S. River quality analysis using fuzzy water quality index: Ribeira do Iguape river watershed, Brazil. Ecol. Indic. 2009, 9, 1188–1197. [Google Scholar] [CrossRef]
- Li, R.; Zou, Z.; An, Y. Water quality assessment in Qu River based on fuzzy water pollution index method. J. Environ. Sci. 2016, 50, 87–92. [Google Scholar] [CrossRef] [PubMed]
- Lai, Y.C.; Tu, Y.T.; Yang, C.P.; Surampalli, R.Y.; Kao, C.M. Development of a water quality modeling system for river pollution index and suspended solid loading evaluation. J. Hydrol. 2013, 478, 89–101. [Google Scholar] [CrossRef]
- Ministry of Environment. Korea Annual Hydrological Report; Ministry of Environment: Sejong, Republic of Korea, 2014. [Google Scholar]
- Song, C.G.; Seo, I.W.; Kim, Y.D. Analysis of secondary current effect in the modeling of shallow flow in open channels. Adv. Water Resour. 2012, 41, 29–48. [Google Scholar] [CrossRef]
- Park, I.H.; Seo, I.W.; Shin, J.; Song, C.G. Experimental and Numerical Investigations of Spatially-varying Dispersion Tensors Based on Vertical Velocity Profile and Depth-Averaged Flow Field. Adv. Water Resour. 2020, 142, 103606. [Google Scholar] [CrossRef]
| Disclaimer/Publisher’s Note: The statements, opinions and data contained in all publications are solely those of the individual author(s) and contributor(s) and not of MDPI and/or the editor(s). MDPI and/or the editor(s) disclaim responsibility for any injury to people or property resulting from any ideas, methods, instructions or products referred to in the content. |
© 2023 by the authors. Licensee MDPI, Basel, Switzerland. This article is an open access article distributed under the terms and conditions of the Creative Commons Attribution (CC BY) license (https://creativecommons.org/licenses/by/4.0/).


