Article

Numerical Modelling and Performance Evaluation of Vacuum Membrane Distillation for Energy-Efficient Seawater Desalination: Towards Energy-Efficient Solutions

1
Laboratory of Biomaterials and Transport Phenomena, University of Medea, Medea 26000, Algeria
2
Biotechnology, Water, Environment and Health Laboratory, Abbes Laghrour University, Khenchela 40000, Algeria
3
Laboratoire de Génie des Procédés Chimiques, Department of Process Engineering, University of Ferhat Abbas, Setif 19000, Algeria
4
Univ Rennes, Ecole Nationale Supérieure de Chimie de Rennes, CNRS, ISCR—UMR6226, 35000 Rennes, France
5
Laboratoire de Recherche sur le Médicament et le Développement Durable (ReMeDD), Department of Environmental Engineering, University of Salah Boubnider Constantine 3, El Khroub 25012, Algeria
6
Research Unit on Analysis and Technological Development in Environment (URADTE-CRAPC), BP 384, Bou-Ismail Tipaza 42004, Algeria
7
College of Engineering, Imam Mohammad Ibn Saud Islamic University, IMSIU, Riyadh 11432, Saudi Arabia
8
Department of Chemistry, Imam Mohammad Ibn Saud Islamic University (IMISIU), P.O. Box 5701, Riyadh 11432, Saudi Arabia
9
School of Engineering, Merz Court, Newcastle University, Newcastle upon Tyne NE1 7RU, UK
*
Authors to whom correspondence should be addressed.
Water 2023, 15(20), 3612; https://doi.org/10.3390/w15203612
Submission received: 1 September 2023 / Revised: 25 September 2023 / Accepted: 5 October 2023 / Published: 16 October 2023
(This article belongs to the Special Issue Novel Approaches to Nutrients and Pollutants Removal from Wastewaters)

Abstract

:
Vacuum membrane distillation (VMD) is a compelling technique for desalinating water because it exhibits superior pure water permeability at lower operating temperatures compared to other membrane distillation technologies. This leads to reduced energy consumption, lower heat loss via conduction across the membrane surface, and minimal heat transfer through conduction due to the low pressure on the permeate side. Detailed modelling of heat and mass transfer in VMD is essential for optimizing the process as it provides valuable insights that contribute to the advancement and successful implementation of seawater desalination using VMD technology. The aim of this study is to establish a comprehensive numerical model that describes the water vapor transfer across a hydrophobic micro-porous membrane in single-stage and multi-stage VMD processes for seawater desalination. The numerical predictions were compared to experimental data in addition to numerical computations based on an existing literature database, and good agreement has been found. The investigation also conducted a sensitivity analysis of process variables and membrane specifications on the VMD performance, as well as an assessment of the impact of temperature and concentration polarization. The obtained results showed that the permeation flux reached 18.42 kg/m2·h at 35 g/L feed concentration, 65 °C feed temperature, 50 L/h feed flow rate, and 3 kPa vacuum pressure. Moreover, the findings revealed that the feed temperature was the most significant factor, while the feed flow rate was the least important in determining the permeation flux. Additionally, the findings suggested that the effectiveness of the VMD process heavily relies on the composition and permeability of the support materials. Finally, the results confirmed that temperature polarization had a more significant effect on the reduction of the permeate flux than the concentration polarization.

1. Introduction

Water quality detection and treatment are crucial components in ensuring the safety and sustainability of water resources. Monitoring water quality involves the analysis of various physicochemical parameters to assess its suitability for different uses. Various studies have focused on improving the existing treatment methods and exploring innovative technologies for more sustainable and cost-effective water purification [1,2]. Seawater desalination is considered one of the most promising methods for the production of fresh water by removing salt and other minerals to ensure its safety for human consumption and various industrial uses. Two primary methods are employed for seawater desalination: thermal desalination and membrane desalination. Thermal desalination involves heating seawater and condensing the resulting vapor, while membrane desalination utilizes semi-permeable membranes to separate salt and other impurities [3,4]. However, both methods have their limitations. Thermal desalination is costly due to the significant energy requirements, and membrane desalination can face issues like the fouling and scaling of membranes, leading to reduced efficiency and increased maintenance expenses. Furthermore, both approaches may pose environmental concerns, such as discharging concentrated brine back into the ocean, which can negatively impact marine life [5,6].
Membrane distillation (MD) stands as a separation technique, deploying hydrophobic membranes to segregate elevated-temperature saline water from cooler, decontaminated water vapor. MD presents a range of benefits, notably its operation at reduced temperatures and pressures, resulting in diminished energy consumption and adaptability to residual heat sources. Furthermore, MD exhibits resistance to fouling and scaling, culminating in decreased maintenance requisites and extended membrane longevity. Its application scope encompasses the desalination of both seawater and brackish water, the treatment of industrial wastewater, and the retrieval of valuable substances from solutions [7].
MD encompasses diverse configurations, including direct contact membrane distillation (DCMD), air gap membrane distillation (AGMD), vacuum membrane distillation (VMD), and sweep gas membrane distillation (SGMD). In DCMD, the membrane is directly exposed to hot saline water, presenting potential issues such as membrane fouling and scaling. AGMD introduces a slight air gap between the membrane and the heated saline water to counter fouling and scaling, although it may marginally impact efficiency. VMD employs a vacuum to establish a pressure gradient across the membrane, intensifying the motive force for water vapor transportation, but it requires notable energy input. Conversely, SGMD employs a sweep gas to carry off water vapor, consequently lowering the partial pressure of water vapor at the membrane interface and augmenting the driving force for water vapor transfer [8,9,10].
VMD is gaining prominence due to its efficacy in diverse applications, encompassing the separation of aqueous solutions and the removal of gases and volatile organic compounds from water [11,12,13]. In seawater desalination, VMD offers multiple benefits [14,15], as it is less susceptible to temperature polarization at the membrane surface. Heat conduction losses across the membrane are also significantly diminished, and in certain instances, they are negligible [16]. Nonetheless, the primary limitation of VMD pertains to its intricate setup involving vacuum and external condensers [17,18], which might induce notable pressure fluctuations on the membrane surface, potentially resulting in wetting or decreased membrane hydrophobicity. These factors have the potential to adversely affect the quality of the generated permeate [19,20].
It holds great significance to acquire an extensive comprehension of the processes taking place within the membrane and module of MD by means of mathematical simulation [21,22,23]. This is essential to guarantee the effective and dependable implementation of MD technology. The main objective of MD modeling lies in the anticipation of the permeate flux and the understanding of its relationship with various factors such as the configuration of the MD module, properties of the membrane, and operational variables [24,25,26]. While numerous mathematical models have been documented in the literature for MD, the predominant attention has been on the modeling of DCMD due to its relative simplicity, whereas other configurations of MD have been comparatively less explored [27,28]. Nevertheless, ongoing endeavors are currently focused on refining the analysis and modeling of MD, with specific emphasis on optimizing the utilization of VMD in desalination [14,29]. Indeed, a considerable number of experimental studies have been carried out, and models have been formulated to identify key factors influencing VMD membrane modules, permeation flux, and energy consumption. The performance sensitivity of a specific membrane is often associated with variables such as feed water temperature, applied vacuum pressure, and solute concentration in the feed solution. To predict the permeation flux across MD membranes, the Dusty-Gas Model (DGM), commonly used for characterizing the mass transfer in porous materials, is employed [30,31]. The DGM combines the three different models, that is, Knudsen, Poiseuille, and molecular flows, and is one of the main theories in practical use for diffusion through a porous media. In this model, the porous medium is imagined to behave similarly to stationary uniformly distributed large particles, i.e., dust, that block the moving gas particles. Both particles are then treated as one mixture, and the mass transfer equations are derived using the kinetic theory of gases [32].
Soni et al. [33] established a mathematical model that accounts for the temperature-dependent physical properties of the fluid to describe the transport mechanisms in VMD. Both experimental and modeling outcomes indicate that the permeate flux rises with a reduction in the vacuum pressure (higher vacuum) and an increase in the flow rate of the feed fluid. A study by Banat et al. [11] conducted a sensitivity analysis of the operational conditions and revealed that the mass transfer across the membrane is highly responsive to the feed temperature, especially in the case of higher vacuum, whereas it is more sensitive to the vacuum pressure when low feed temperatures are employed. Similarly, Upadhyaya et al. [34] carried out a sensitivity investigation of the desalination process through VMD and observed that the mass flow is significantly influenced by factors such as the thickness, tortuosity, porosity, and pore diameter of the membrane, while remaining sensitive to the vacuum pressure and feed temperature. Mericq et al. [14] also emphasized the significance of membrane permeability and demonstrated the potential for VMD to compete with reverse osmosis (RO) in terms of energy efficiency, provided that a suitable membrane is selected. Lee et al. [35] employed a one-dimensional VMD method in their research to predict the efficiency of seawater desalination by evaluating the effectiveness of VMD modules of the hollow fiber type. The study evaluated specific energy consumption and productivity and scrutinized the primary operating parameters that influence the VMD performance under varying conditions. Wang et al. [36] created a two-dimensional model using the finite element method in hollow fibers for VMD and discovered that optimal conditions can lead to a cost reduction of up to 38% in water production. Hayer et al. [37] developed a numerical model using principles of fluid mechanics, heat, and mass transfer to investigate the impact of different factors on VMD in hollow fiber membrane modules. The findings indicated that higher feed flow rates and temperatures led to an increased transmembrane flux. However, the study also revealed that the influence of feed flow rate on the VMD separation performance diminished at specific rates. Additionally, the model identified the primary mechanisms governing the diffusion process within the membrane module, with diffusion being the most dominant factor, followed by viscous flow. Kim et al. [38] presented an extensive mathematical model of the hollow-fiber VMD process for seawater desalination. This model incorporated mass, momentum, and energy balances, as well as the transmembrane flux model. The researchers discovered that a basic VMD model could potentially overestimate the mean permeate flux, as the detailed model accounted for pressure build-up in the fiber lumen. Liu et al. [39] employed numerical simulations to investigate hollow-fiber VMD by considering mass, energy, and momentum transfer and treating the membrane as a functional surface. Nevertheless, the study did not incorporate the impact of concentration on the boundary condition equations of the membrane’s vapor pressure.
Ashghari et al. [40] incorporated mass and heat transfer models into a VMD system and confirmed their accuracy using experimental data. They further examined the influence of various operating factors, such as feed temperature, vacuum pressure on the permeate side, feed concentration, and heat transfer coefficient, on the permeate flux. The outcomes revealed that higher feed temperature and heat transfer coefficient led to an increase in the permeate flux, whereas elevated vacuum pressure and feed concentration resulted in a decrease in the permeate flux. The use of artificial neural networks (ANNs) for simulating mass transfer in VMD was explored by Dragoi et al. [41], with the aim of predicting the permeate flux for the treatment of radioactive wastewater. The study compared various ANN structures to identify the optimal model for the system and optimized the VMD process to determine the most favorable operating conditions that would maximize the mass transfer rate. Ibrahim et al. [42] developed a mathematical model that accounts for both heat and mass transfers during VMD to examine how changes in membrane properties during the process affect the permeation flux. The model divided the module into several cells and solved a system of nonlinear equations numerically. The researchers also explored the impact of module properties, operating conditions, and membrane characteristics on the water permeation flux.
Past investigations into VMD have predominantly concentrated on the anticipation of the permeate flow and its interrelation with diverse variables. Nevertheless, a noticeable gap exists in the body of knowledge regarding the role of concentration polarization in membrane scaling within the context of MD, as well as the adeptness of MD modeling in ameliorating this concern via the optimization of modules, membranes, and variables. Furthermore, the exploration of the impact of agitating velocities on both the feed and permeate facets of MD assemblies, and their ramifications on transmembrane flow, has been inadequately probed. As such, it is of utmost importance to undertake extended MD modeling analyses to meticulously scrutinize the ramifications of agitating velocities and the synergistic effects amongst MD operational parameters on the permeate flux within pre-existing configurations [25].
In recent times, considerable attention has arisen surrounding multi-stage vacuum membrane distillation (M-VMD) desalination systems due to their potential advantages over single-stage configurations. Various modeling methodologies have been employed in the existing literature to anticipate the performance of M-VMD systems across diverse operational conditions, encompassing parameters such as the feed flow rate, temperature, and pressure. Certain investigations have put forth mathematical models and corroborated their validity through experimental data. Furthermore, Computational Fluid Dynamics (CFD) techniques have been utilized to simulate flow dynamics and heat transfer within M-VMD systems, yielding insightful perspectives for system refinement and optimization. Empirical models have also been formulated to foresee the M-VMD system’s efficacy based on empirical data [42,43,44,45,46,47]. Nevertheless, the modeling of M-VMD systems introduces challenges in effectively accounting for the impacts of concentration polarization and scaling, both of which exert a considerable influence on the overall system efficacy. Additionally, a comprehensive exploration of the influence of agitation rates on transmembrane flux, especially pertaining to both the feed and permeate sides of MD modules, remains relatively limited. Consequently, further research endeavors are indispensable to acquire a holistic comprehension of these facets.
The aim of this investigation is to construct a comprehensive framework that precisely portrays the mechanism of water vapor transportation across a hydrophobic micro-porous membrane within single-stage and multi-stage VMD setups employed for desalinating seawater. The model encompasses the influences of temperature and concentration polarization phenomena, thereby providing a holistic grasp of the system’s dynamics. Furthermore, a sensitivity analysis is executed to delve into the impact of diverse operational parameters on the VMD system’s performance. Variables such as the temperature of the feed water, the rate of feed flow, the concentration of the feed, and the vacuum pressure are scrutinized to assess their implications on the system’s efficiency and efficacy. By amalgamating the incorporation of temperature and concentration polarization phenomena with the sensitivity analysis, this study imparts valuable insights for fine-tuning the operational conditions in order to optimize the effectiveness of the VMD systems applied in seawater desalination contexts.
It is essential to note that, to the best of our knowledge, no similar investigation has been undertaken previously, making our research unique and significant as it fills a noticeable gap in the existing scientific literature. By delving into specific aspects of water vapor transport through a hydrophobic micro-porous membrane in single-stage and multi-stage VMD systems for seawater desalination, while considering temperature and concentration polarization effects, our study introduces new perspectives for understanding and advancing this critical field. The outcomes of this research could have profound implications for the desalination industry and the scientific community focused on water treatment technologies.

2. Materials and Methods
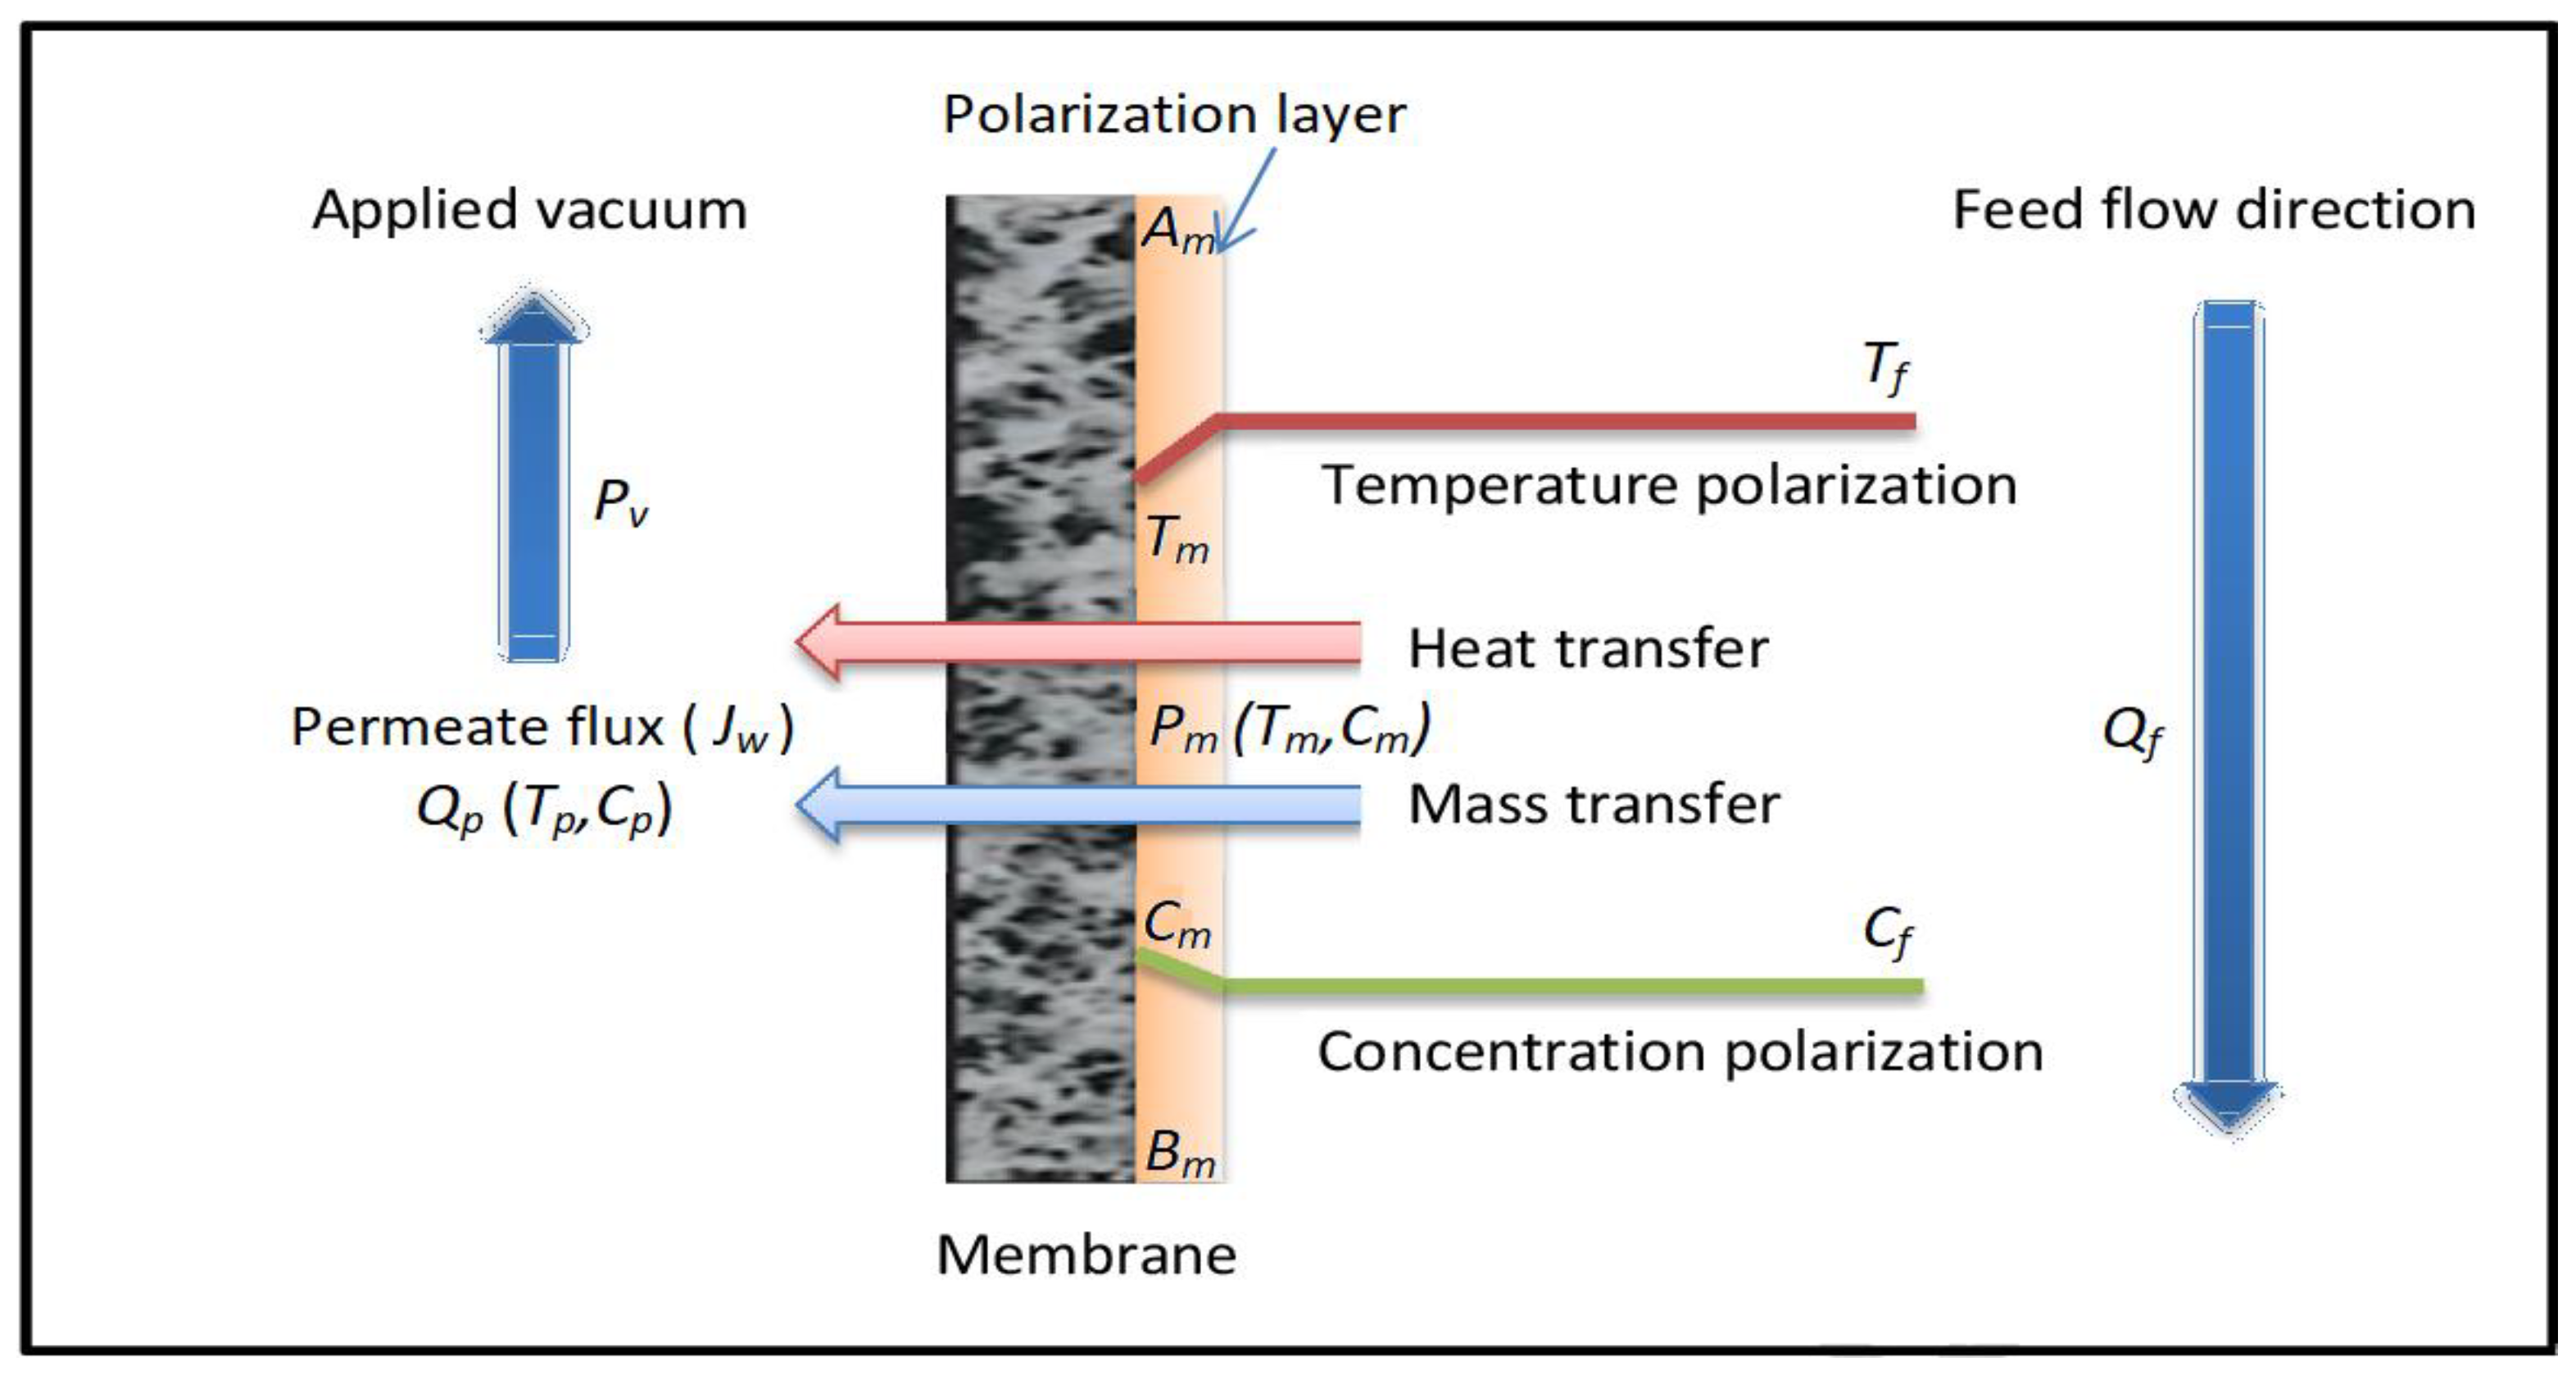
2.1. VMD Modeling

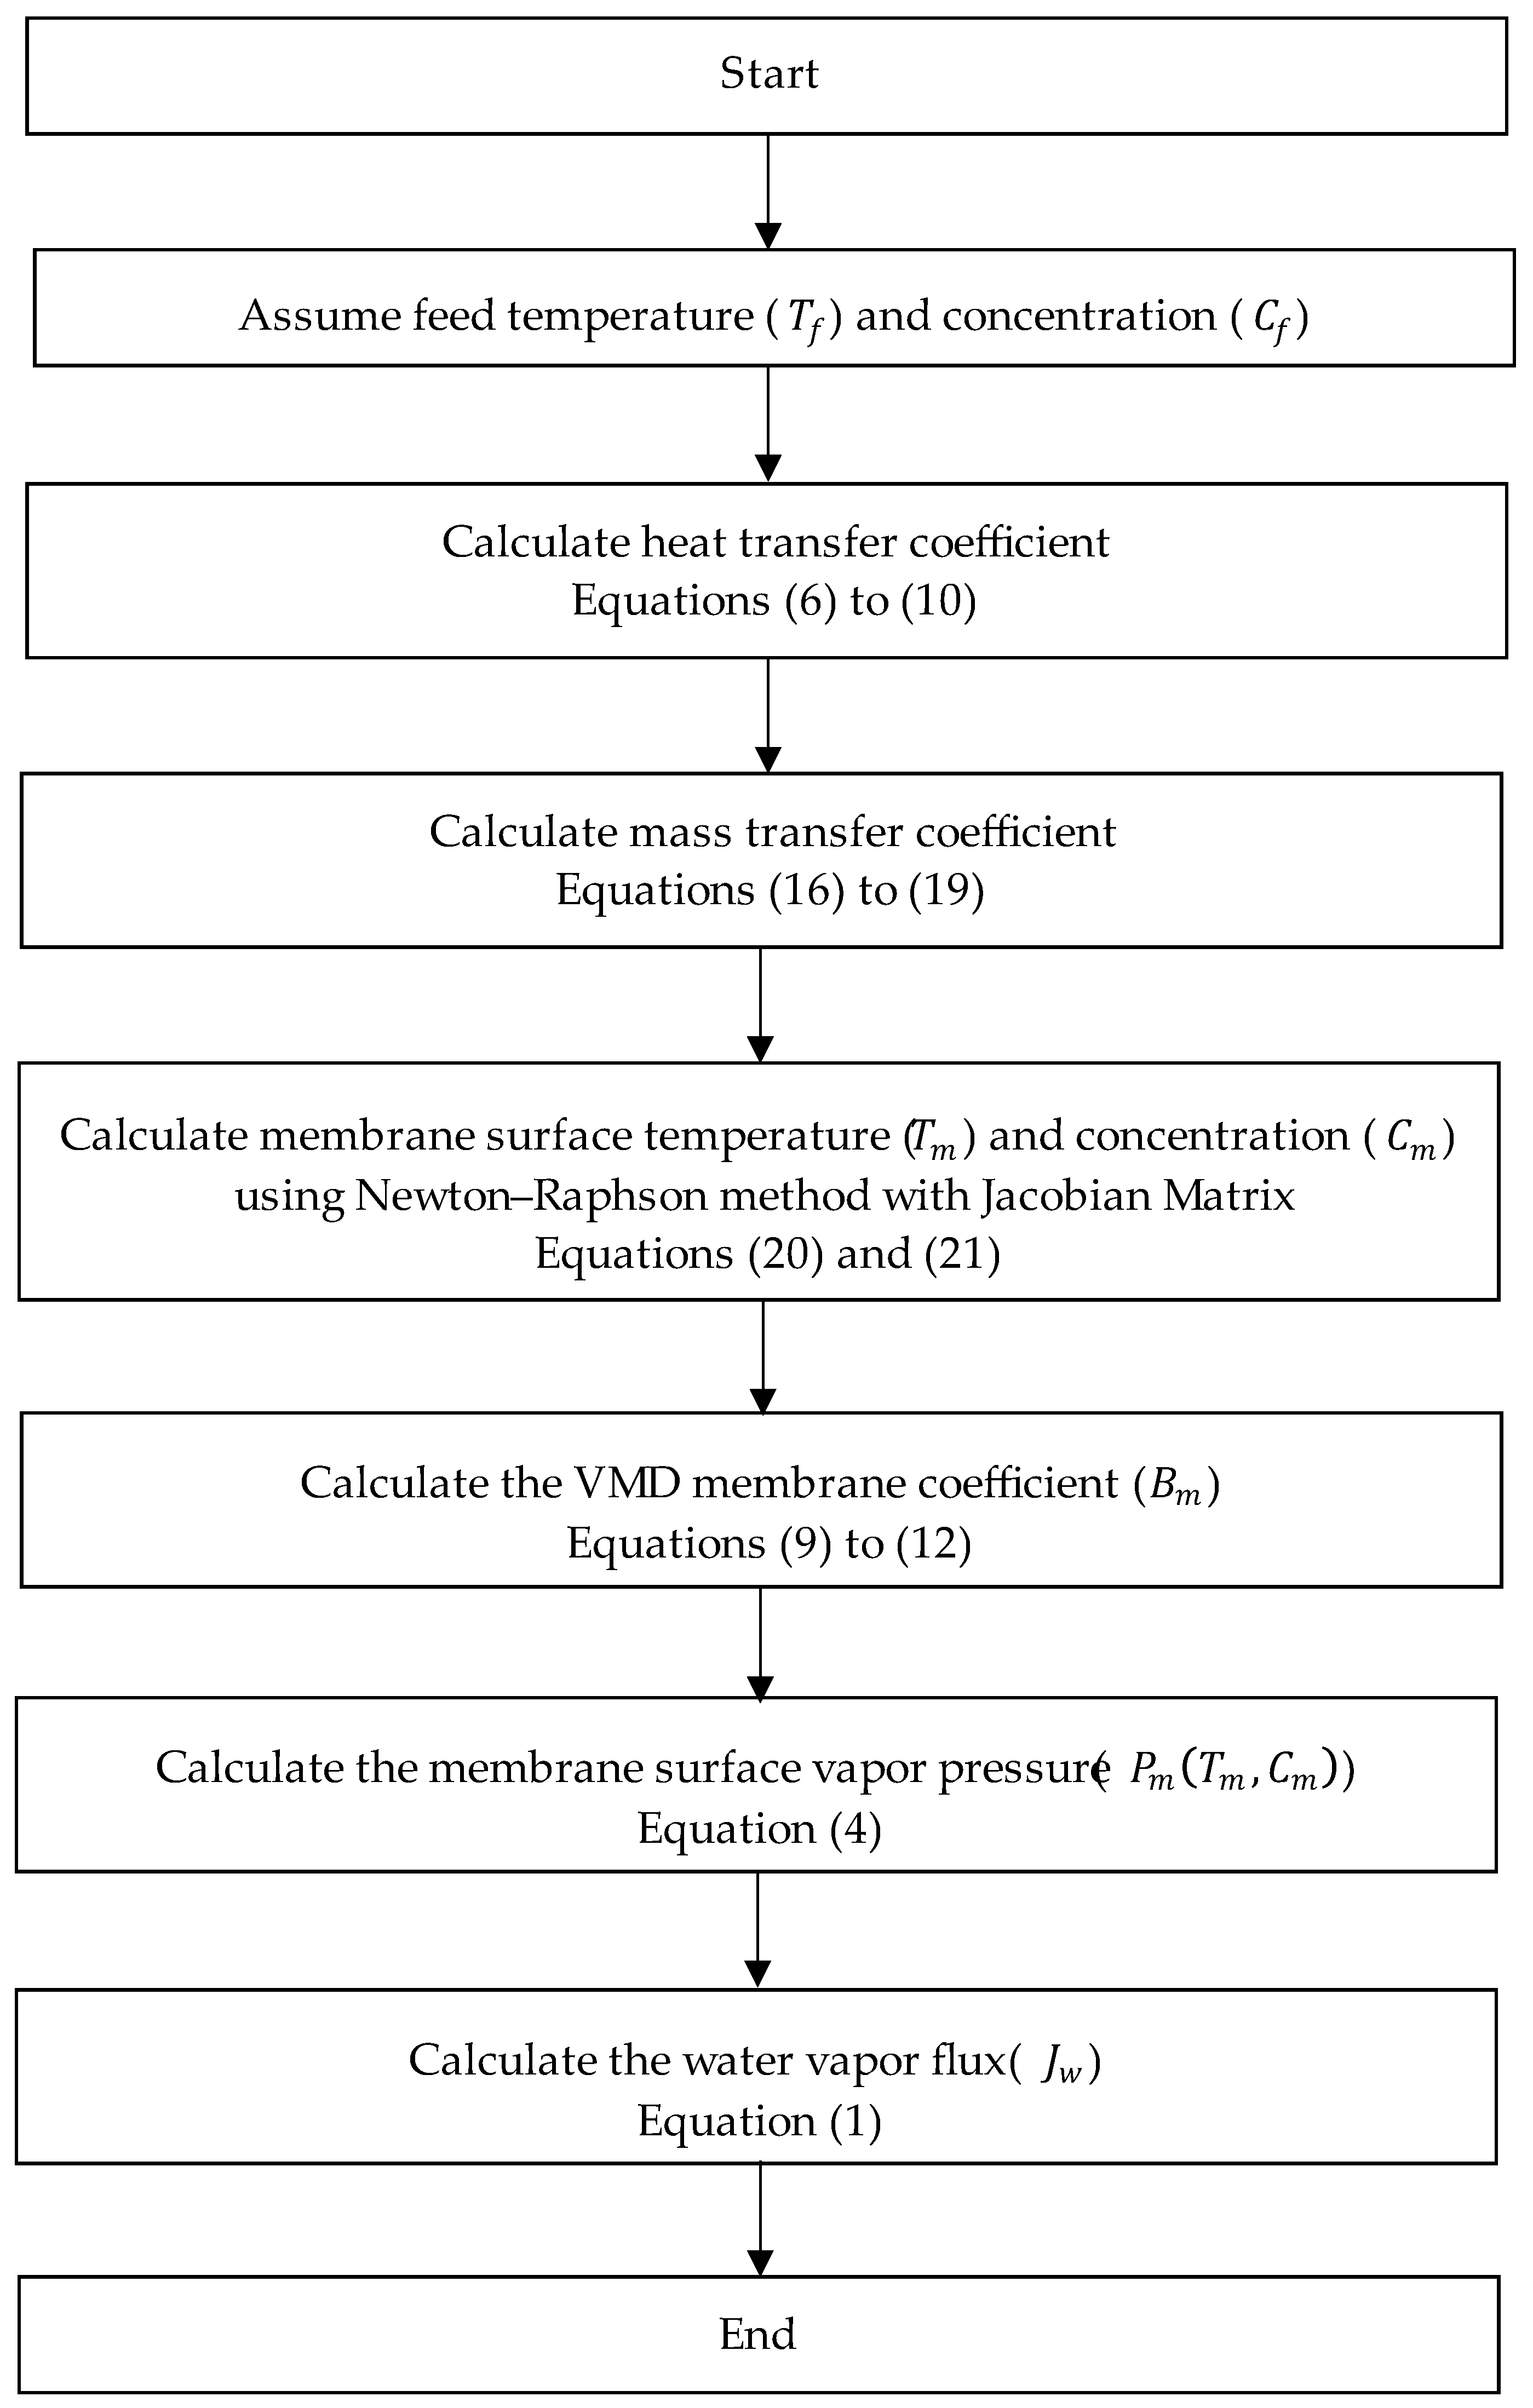
2.1.1. Single-Stage VMD

VMD employs a membrane to serve as a selective barricade, enabling the passage of vapor while obstructing liquids and impurities. The vapor that permeates the membrane undergoes condensation and is amassed as the permeate. The primary driving force behind this procedure is the dissimilarity in vapor pressure between the feed and permeate sides of the membrane. By introducing a vacuum to the permeate facet, this pressure differential is magnified, leading to an augmented separation efficiency. The VMD technique is executed within a tangential flow cell that employs a hollow-fiber membrane, facilitating simultaneous heat and mass transfers, as depicted in Figure 1. The exchange of heat transpires across all three states of matter: liquid, solid, and gas. Conversely, the transfer of mass is confined to the liquid and gas phases [48].
For simulating heat and mass transfer in the VMD process, the research employs the Knudsen flow model due to its ability to encompass a wide range of mass transport mechanisms [33]. To streamline the model, the following assumptions are considered:
  • The process is considered to be in a steady state.
  • The transfer of momentum within the vacuum domain is considered to be insignificant.
  • A negligible heat transfer is assumed in the permeate domain, as well as through the membrane by means of conduction.
  • The transfer of mass within the permeate is not considered, and it is assumed that the mass fraction of water vapor is equal to one.
  • It is presumed that the distillate does not contain any salt.
When water is transported in bulk across the membrane, the flux of water vapor, denoted as J w , can be mathematically expressed as shown in the following equation [32,49]:
J w = B m P m T m , C m P v
where B m is the VMD membrane coefficient, T m is the feed temperature at the membrane surface, C m is the concentration of solute at the membrane surface, P m T m , C m is the feed water vapor pressure on the membrane surface, and P v is the vacuum pressure.
In the Knudsen flow model, the membrane coefficient, B m , is represented using the following expression [50]:
B m = M D k n R T m δ
D k n is the diffusion coefficient of the solute given by
D k n = 2 ε r 3 τ 8 R T m π M 0.5
where ε is porosity, r is the pore radius, r is the membrane thickness, τ is the pore tortuosity, M is the molecular mass of water, and R is the gas constant.
Table 1 displays the primary characteristics of the membranes employed in the research [51].
The vapor pressure at the membrane surface, denoted as  P m T m , C m , is determined using Raoult’s law, which remains valid across a wide range of temperatures and concentrations (0 < T < 200 °C and 0 < S < 240 g/kg) [52]:
  P m T m , C m = exp 5.80 × 10 3 / T m + 1.39 4.86 × 10 2 T m + 4.18 × 10 5 T m 2 + 1.45 × 10 8 T m 3 + 6.55 log T m 1 + 0.57257 C m / 1000 C m
MD systems utilize latent and conductive heat transfer mechanisms to enable the movement of heat. When a boundary layer forms on the membrane’s surface within these systems, the temperature at that specific surface becomes lower when compared to the incoming feed temperature. Conversely, VMD systems experience minimal conductive heat transfer due to the low-pressure environment on the permeate side of the membrane. As a result, the mathematical representation of the heat flux passing through the liquid boundary layer can be expressed by the subsequent equation [53]:
h w T f T m = J w Δ H v
The equation to determine the heat transfer coefficient, h w , is derived as follows [32,54]:
h w = λ w . N u d h
with
N u = 1.86 R e × P r × d h L 0.33 R e < 2100   :   Laminar   flow
or
N u = 0.023 R e 0.8 P r 0.33 R e > 4000   :   Turbulent   flow
In the equations,   λ w denotes the thermal conductivity of water,   d h represents the hydraulic diameter, and L indicates the length of the channel.
R e = ρ w . v . d h μ w
P r = C p , w . μ λ w
The thermophysical properties of seawater are determined using the correlations provided by Sharqawy et al. [52], which are functions of temperature and salinity.
Assuming a state of continuous operation, we can express the mass balance equation for the input solution as follows:
Q f C f = Q p C p
The permeate flux,   J w , quantifies the volume of permeate produced per unit area of the membrane over a specific period of time.
J w = Q p / A m
By combining the above equations, the feed flow rate can be expressed as
Q f = J w . A m C f
The temperature polarization coefficient (TPC) is a measure of the polarization effect that results from differences in temperature. It is usually defined as the ratio of the actual driving force to the theoretical driving force and can be represented by the following equation [49,55]:
T P C = T m T p T f T p
The concentration profile of salt on the membrane surface can be determined using the equation below [56,57], which employs film theory to account for concentration polarization.
C m C f = exp J w k
In a similar manner, the coefficient of mass transfer, denoted as k , may be evaluated by employing the correlation of a dimensionless parameter [58]:
k = S h × D k n d h
with
S h = 1.86 R e × S c × d h L 0.33 R e < 2100 : Laminar   flow
or
S h = 0.023 R e 0.8 S c 0.33 R e > 4000 : Turbulent   flow
Schmidt numbers can be calculated using
S c = μ w ρ w × D k n
Concentration polarization (CPC) is described as the C m / C f ratio, representing the actual concentration gradient relative to the theoretical concentration gradient. A substantial CPC value signifies a notable concentration polarization impact, potentially leading to reduced process efficiency and increased energy consumption [59,60].
To assess the permeate flux (Equation (1)), T m and C m at the membrane surface are determined by employing the subsequent two equations:
f 1 = T f B m exp 5.80 × 10 3 / T m + 1.39 4.86 × 10 2 T m + 4.18 × 10 5 T m 2 + 1.45 × 10 8 T m 3 + 6.55   log T m 1 + 0.57257 C m / 1000 C m P v H v h w
f 2 = C f × exp B m exp 5.80 × 10 3 / T m + 1.39 4.86 × 10 2 T m + 4.18 × 10 5 T m 2 + 1.45 × 10 8 T m 3 + 6.55   log T m 1 + 0.57257 C m / 1000 C m P v k
The intricate and nonlinear equations mentioned earlier are addressed utilizing a FORTRAN program that incorporates the classical Newton–Raphson technique with the Jacobian matrix. This method proves to be highly efficient when tackling nonlinear equation systems, as it facilitates a quicker convergence and enhanced precision. At each iteration, the approach involves the calculation of the Jacobian matrix, which is then utilized to update the present approximation of the solution. This iterative process continues until the discrepancy between the previous and current approximations falls below a predetermined threshold.
Upon the conclusion of the computational procedure, the temperature and concentration at the membrane module’s surface are determined utilizing an identical approach to that applied for the steam raiser. Subsequently, with the acquired data, the permeate flux is computed by considering the determined surface temperature and membrane concentration (Figure 2).

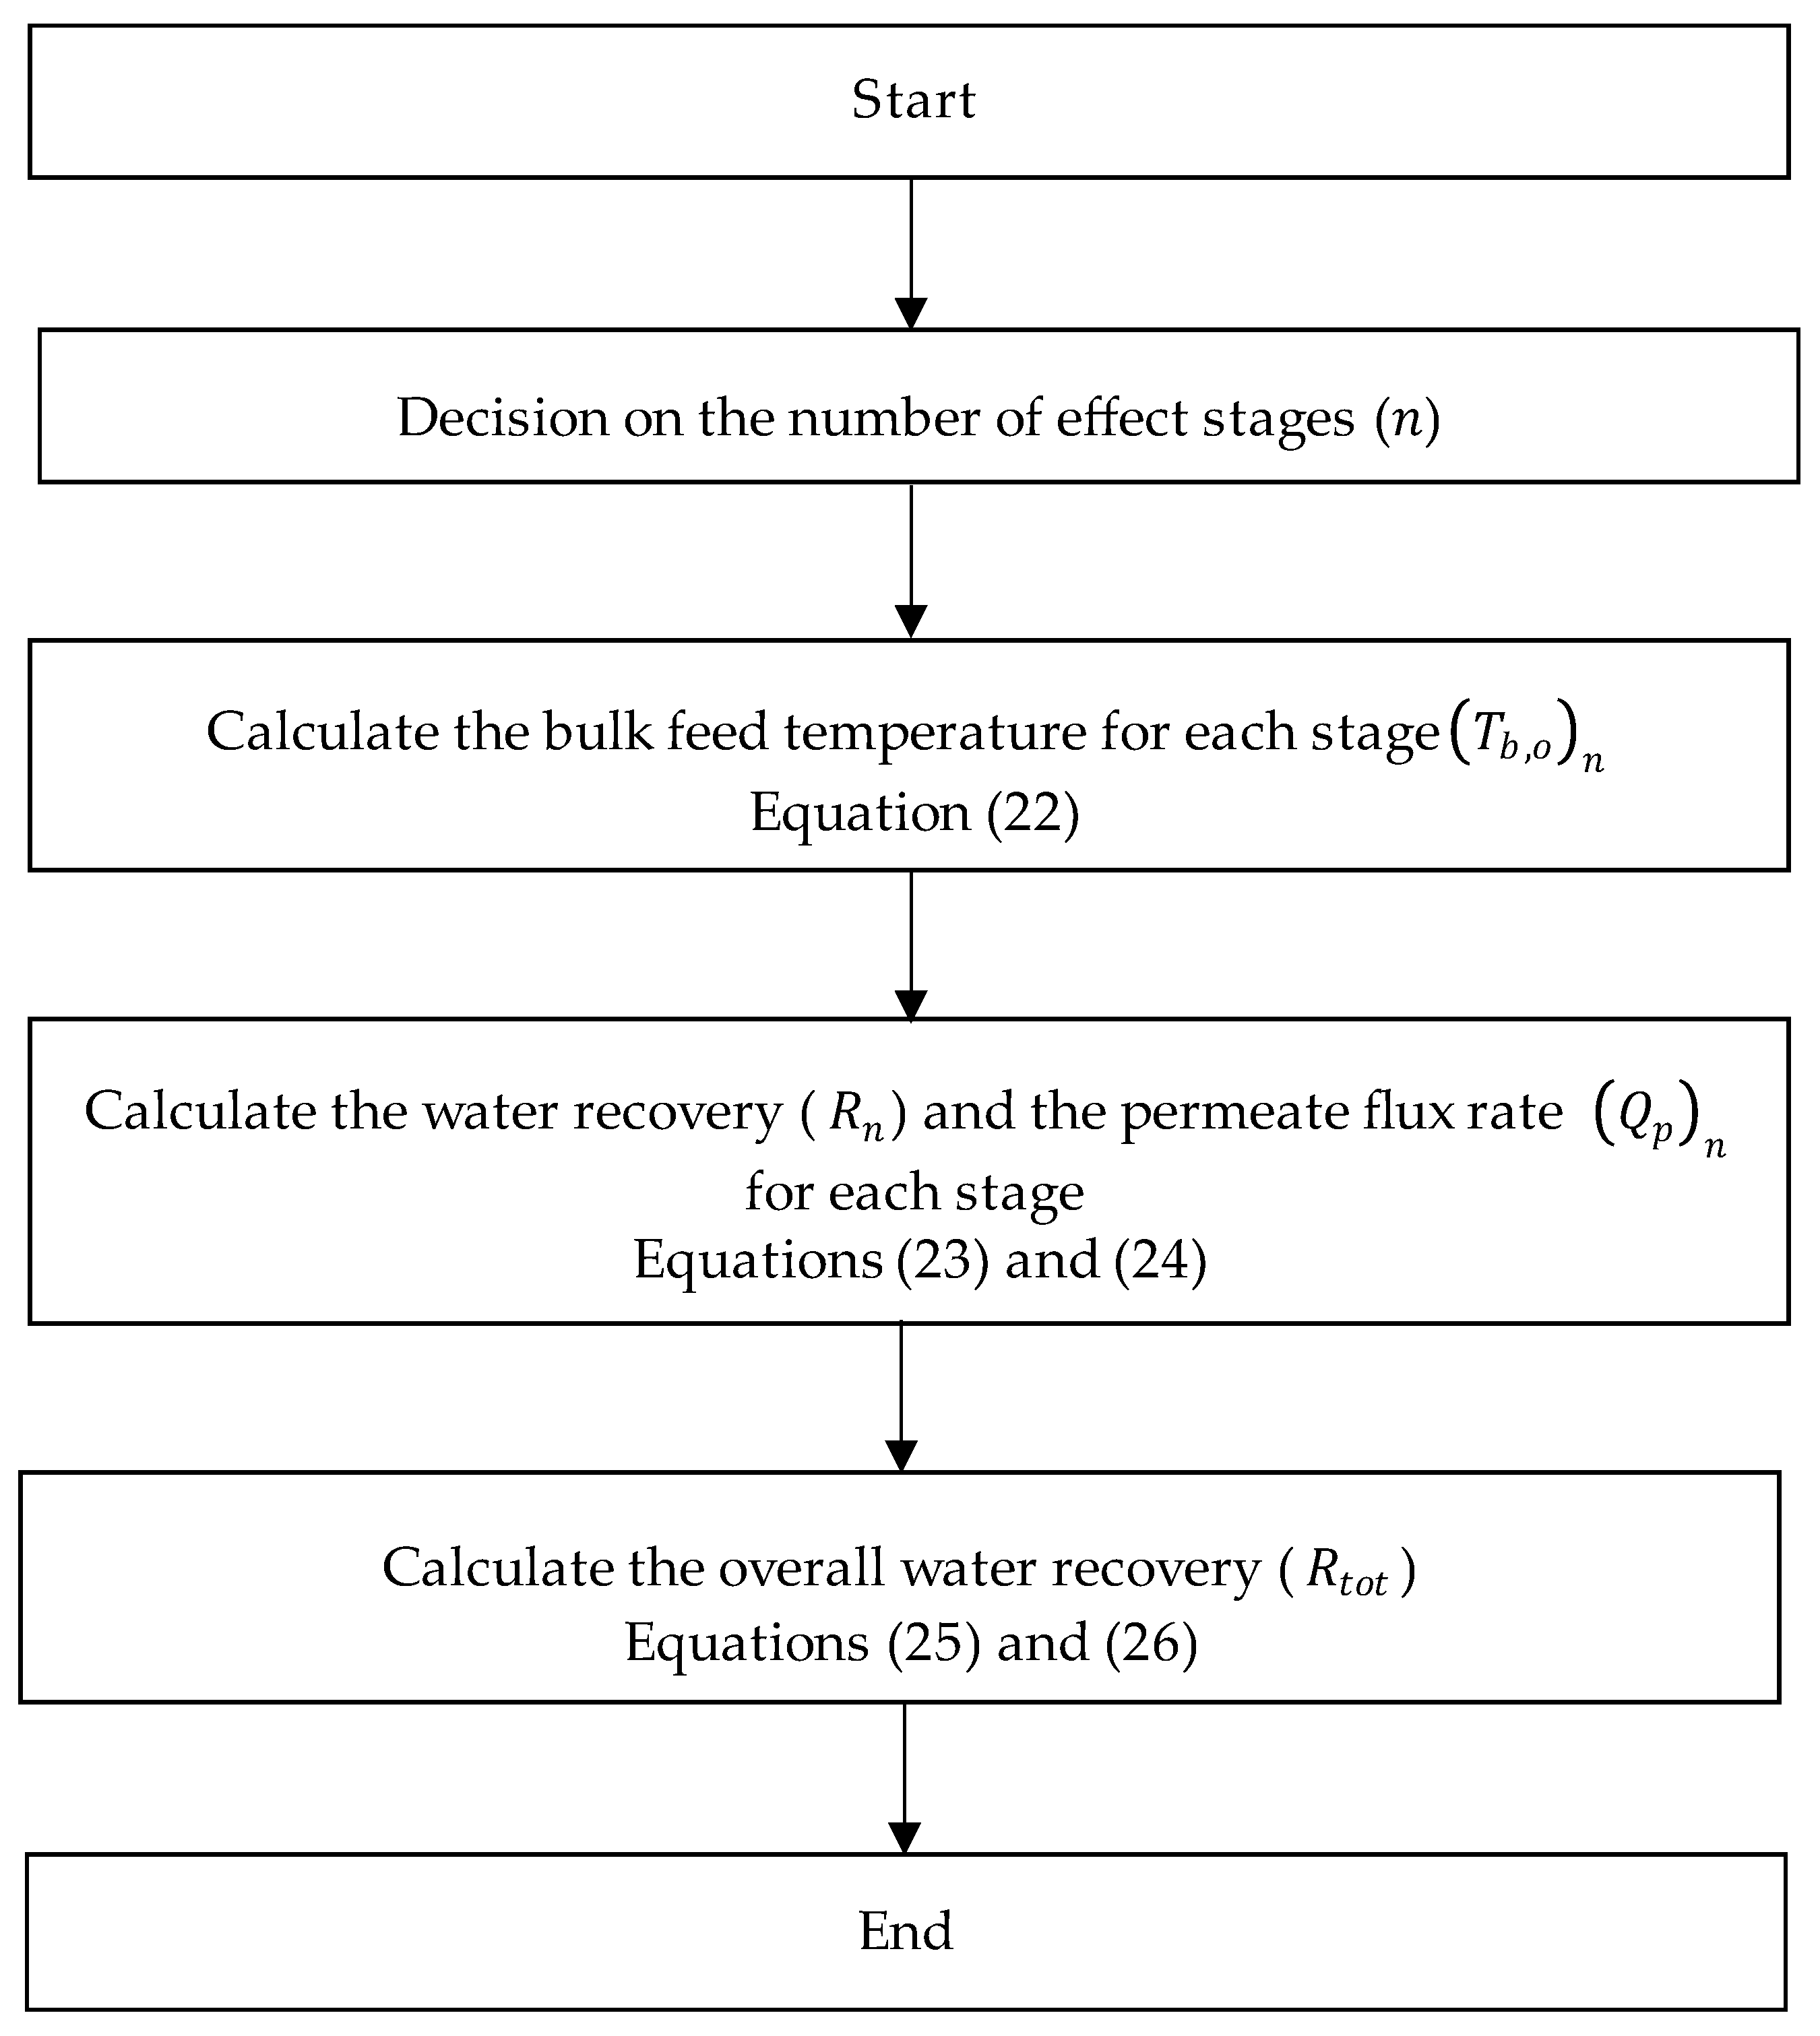
2.1.2. Multi-Staging in VMD

M-VMD has attracted considerable interest for improving the efficiency of single-stage setups. In the M-VMD procedure (shown in Figure 3), the feed solution undergoes initial heating and subsequent introduction into the first phase of the membrane module. A vacuum applied to the opposite side of the membrane aids in liquid evaporation, with the membrane serving as an effective barrier against liquid passage. The resulting vapor is condensed on a cool surface to form a distillate. The remaining brine solution is then fed into the next stage, where the same process is repeated. The vapor produced in each stage is typically recycled and utilized as the heat source for the subsequent stage, thereby improving the overall efficiency of the process.
Assuming negligible convection heat loss to the environment, the bulk feed inlet temperature for each successive stage is determined using the energy balance from the predecessor stage [61].
H v = C p , w Q b , i n T b , i n T b , o n
where Q b , i n is the flow rate of steam from the previous stage.
The mentioned equation can be employed to calculate the bulk feed outlet temperature T b , o n , which will serve as the bulk feed inlet temperature for the subsequent stage.
The water recove60ry R i for a one-stage VMD can be expressed as [47]
R i = η C p , w T b , i T b ; o Δ H v
In the formula, T b , i T b ; o symbolizes the temperature variance of the brine from the module’s entry to its exit, while η represents the presumed thermal efficiency of the VMD process, established at 90% [62].
The water recovery for each stage can be expressed as follows:
R n = Q p n Q b , i n = Q p n Q b , i 1 . i = 1 n 1 1 R i
where Q b , i n is the brine inlet flux of the module and Q p n is the permeate flow rate.
The cumulative distillate flux from individual stages is aggregated to determine the overall total distillate flux:
Q p t o t = Q p 1 + Q p 2 + + Q p n = j = 1 n Q p j
By combining Equations (24) and (25), the overall water recovery is obtained as
R t o t = Q p t o t Q f , i 1 = R 1 + 1 R 1   R 2 + 1 R 1 1 R 2 R 3 + R n i = 1 n 1 1 R i
By utilizing the mathematical model established in this investigation, we have computed the temperature at the outlet of the feed, the permeate flux, and the water recovery for the initial-stage module. As the membrane modules are linked in succession, the outlet temperature of the feed from the preceding module is adopted as the inlet temperature for the subsequent module. Subsequently, Q p n , R n , and T b , o n for each module can be determined in a sequential manner. Ultimately, R t o t is calculated (Figure 4).
The range of the design and operating parameters used in the numerical simulation are listed in Table 2.

3. Results

3.1. Model Validation

In this research, the precision of the newly devised computational model was validated through a comparison between its outcomes and experimental data obtained from a previous investigation on a VMD system. The VMD system was tested with an aqueous NaCl solution at 3 kPa pressure on the permeate side and a 35 g/L feed solution, considering various flow rates [51]. The agreement between the empirical data and the computational outcomes was strong within the temperature range of 40 to 70 °C, as illustrated in Figure 5.
A maximum percentage error of less than 5% was observed at various feed temperature settings, which is considered acceptable. As a result, the numerical model developed in this study could be used to simulate and design a VMD system for specific operating conditions. Moreover, the numerical model developed in this study was compared with the mathematical model described in [51] for further validation. The predicted permeate flux for different feed water temperatures at 3 kPa and feed salt concentration of 35 g/L is given in Table 3. It can be seen that the proposed model shows a better agreement with respect to the experimental data compared to the previously described model. The mean absolute percentage error (MAPE) values for the present model and the model developed in [51] are found to be 3.76% and 6.57%, respectively. The high accuracy of the developed numerical model is due to the consideration of both temperature and concentration polarization effects in the model since heat and mass transfer occur simultaneously in the VMD process. In addition, the feed side membrane surface temperature and concentration were computed using numerical solutions. Therefore, all these factors resulted in complicated modeling steps and a more accurate model-based approach.

3.2. Impact of Operating Conditions

Various operational factors significantly impact the effectiveness of the VMD. These factors encompass feed temperature, feed flow rate, and water vapor pressure. Consequently, these parameters play a critical role in shaping the feed concentration, permeate flux, and membrane properties.

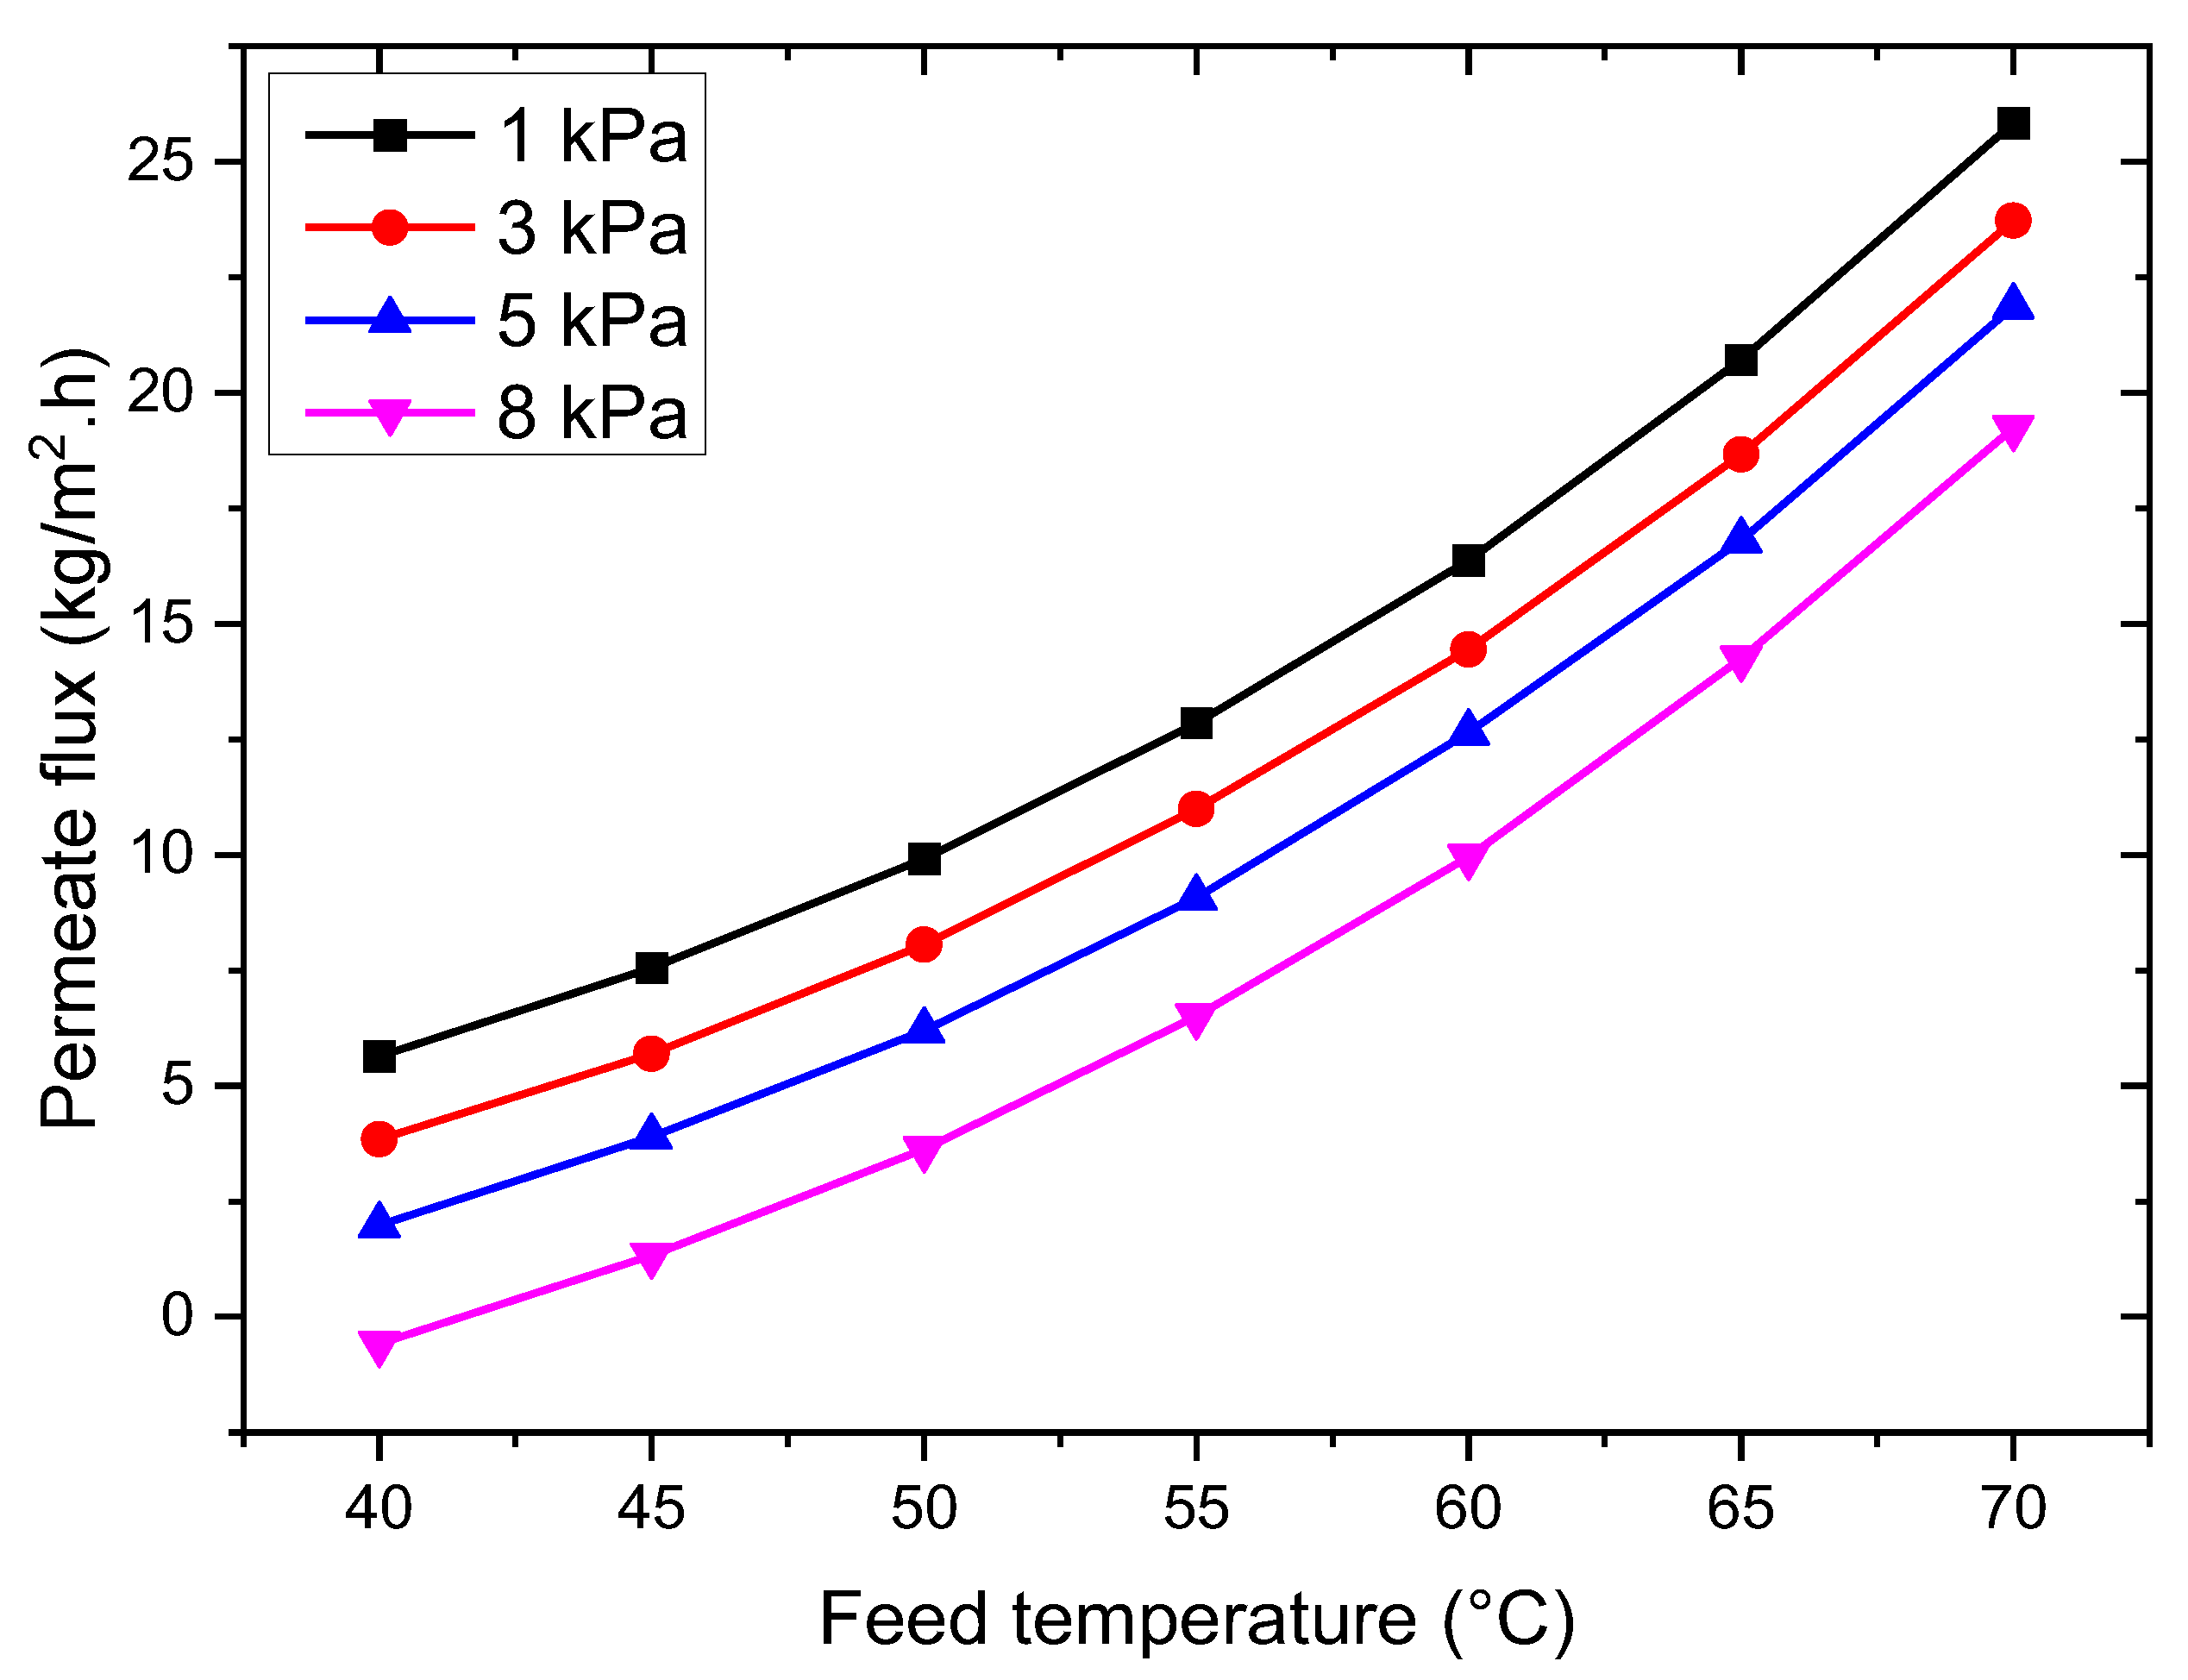
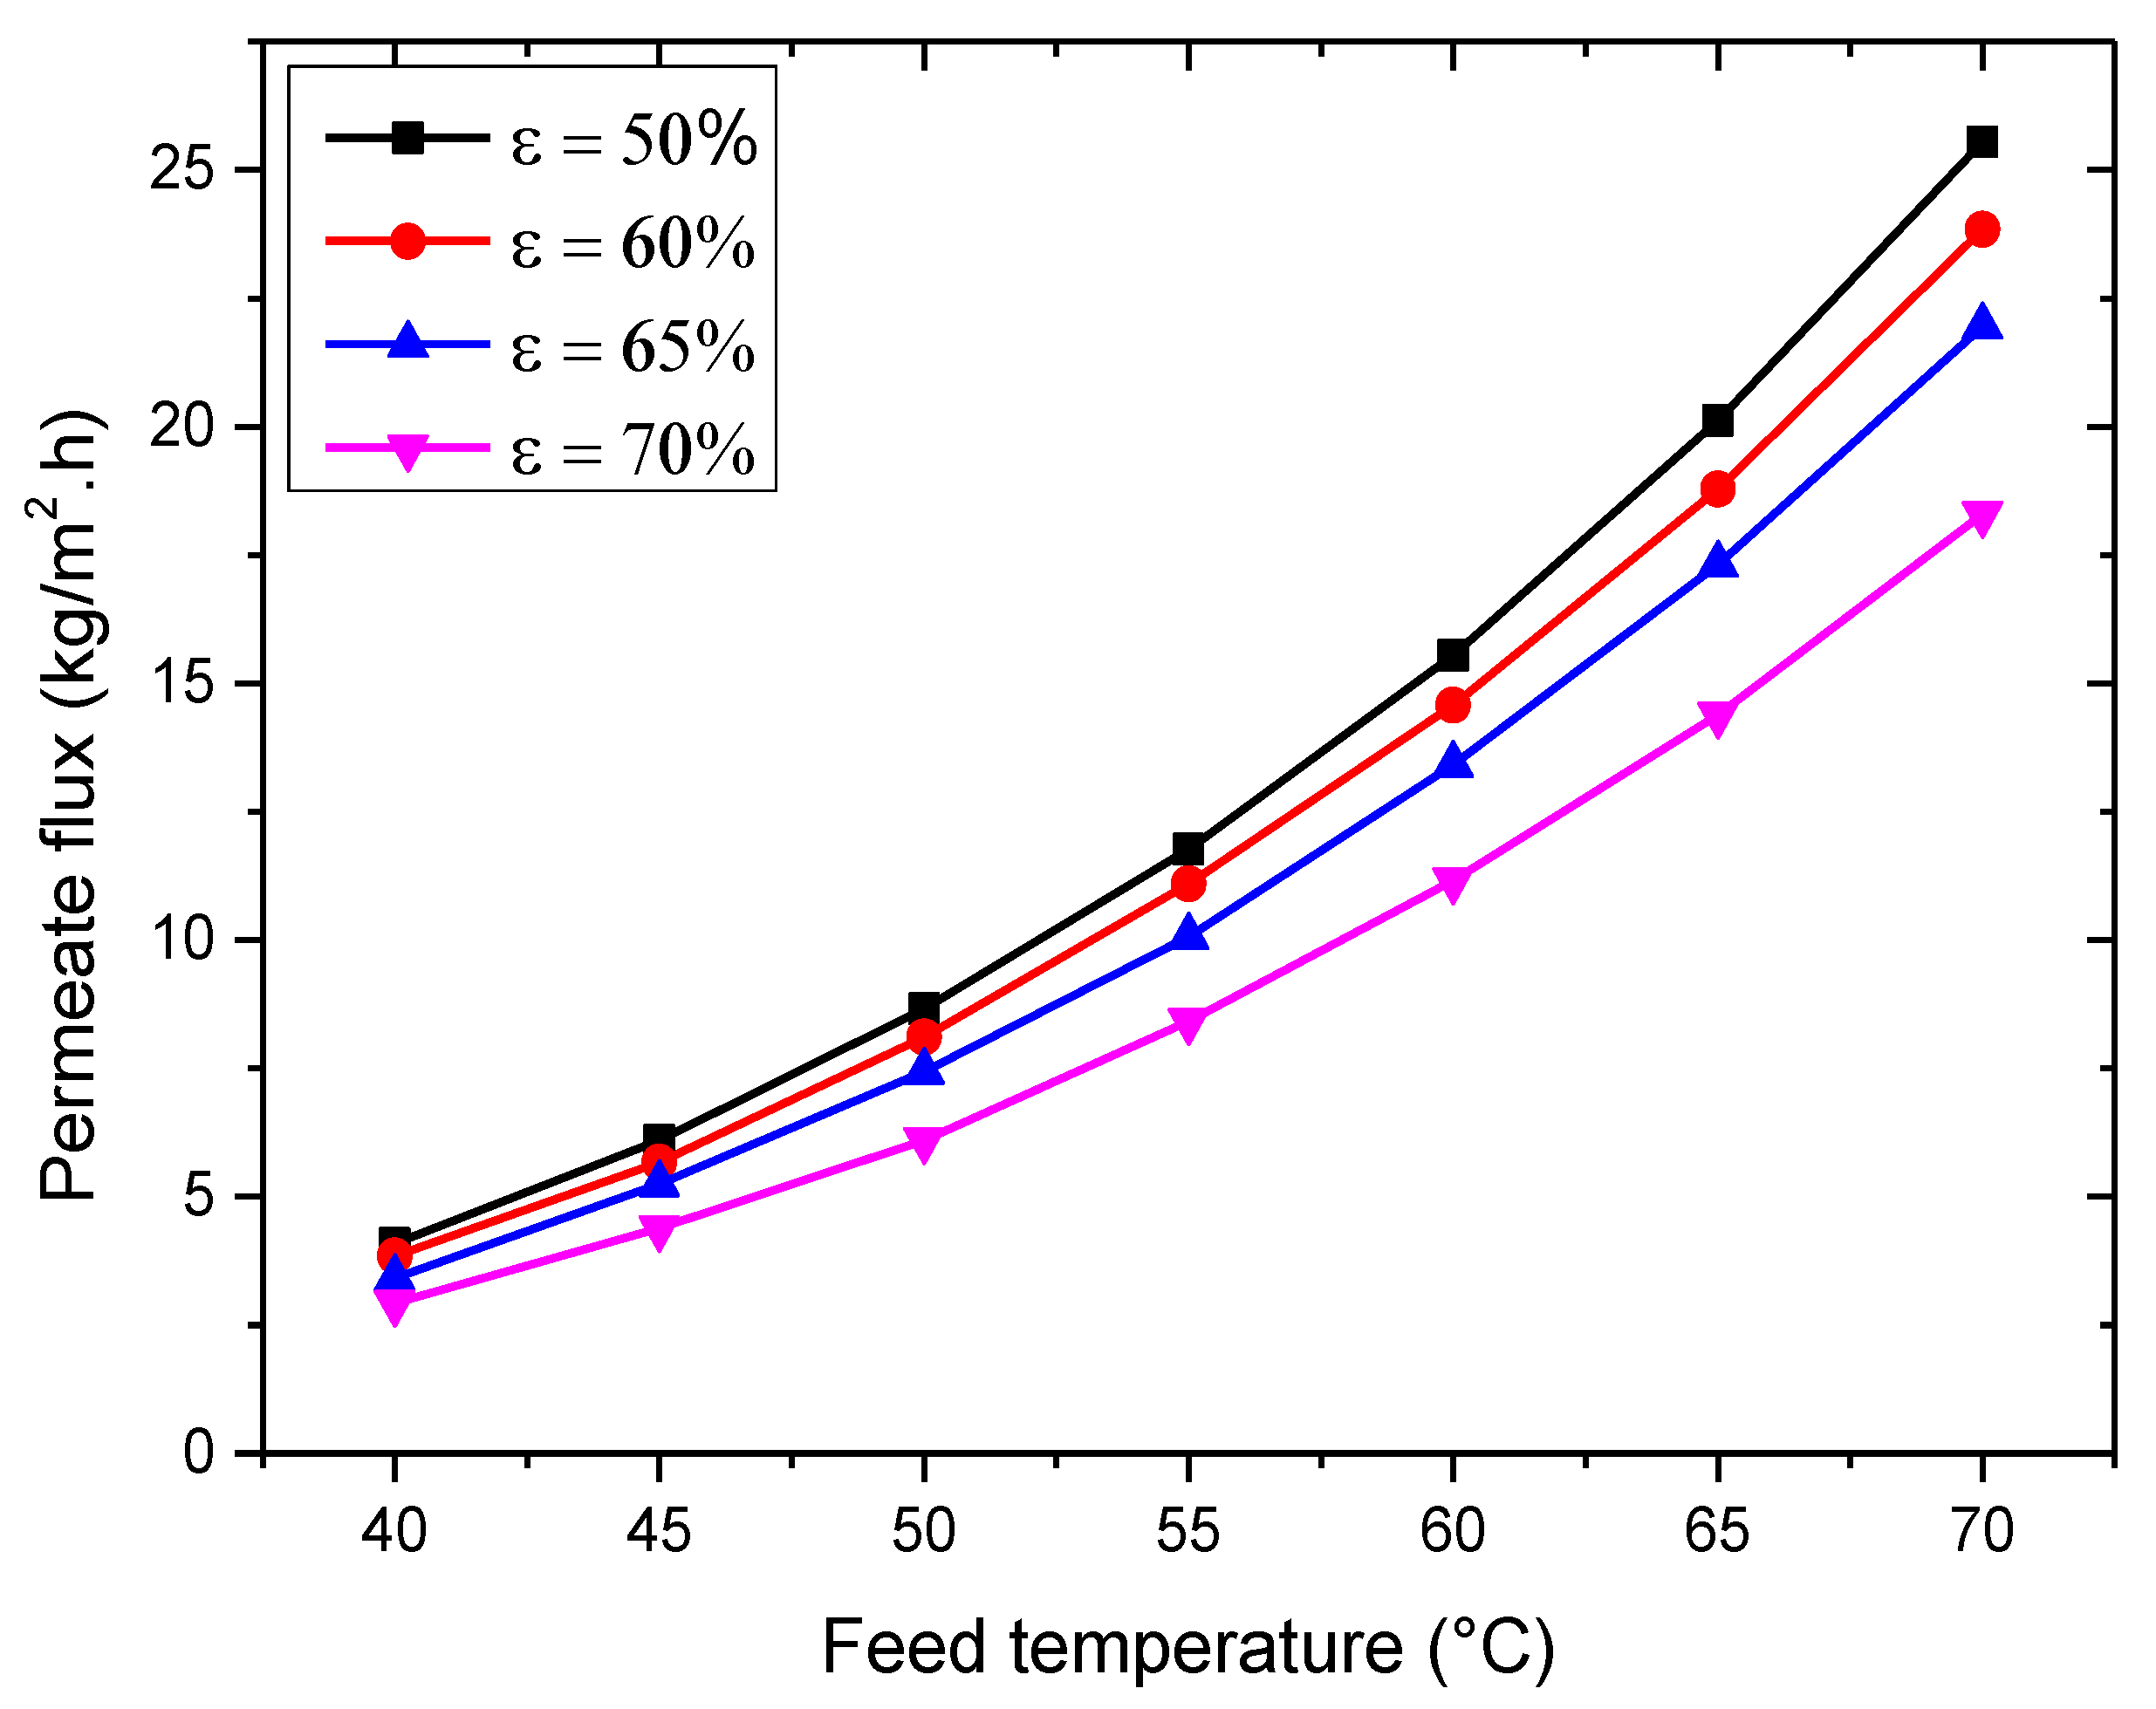
3.2.1. Influence of Feed Temperature

The temperature of the input solution plays a vital role in the MD process since it affects the partial pressure difference of water across the membrane. Figure 6 illustrates the correlation between the temperature of the feed water and the permeate flow. The experiments were executed while keeping the feed concentration at 35 g/L and the flow rate at 50 L/h. Different levels of vacuum pressure were employed, and the feed temperature was modified within the scope of 45 to 70 °C. The findings demonstrate that an elevation in the feed temperature leads to a corresponding upsurge in the permeate flow, manifesting a notable exponential pattern at higher temperatures. This behavior can be elucidated by Antoine’s equation (Equation (4)), which establishes a link between the vapor pressure and feed temperature. For example, under a vacuum pressure of 1 kPas, elevating the feed temperature from 45 to 50 °C brought about an approximate 31% enhancement in permeation flow. Similarly, elevating the feed temperature to 55, 65, and 70 °C resulted in permeate flow enhancements of approximately 117%, 174%, and 242%, respectively. The driving force behind the MD is the alteration in vapor pressure across the membrane module. The elevated temperatures of the input solution cause an escalation in the vapor pressure, consequently amplifying the permeate flow.

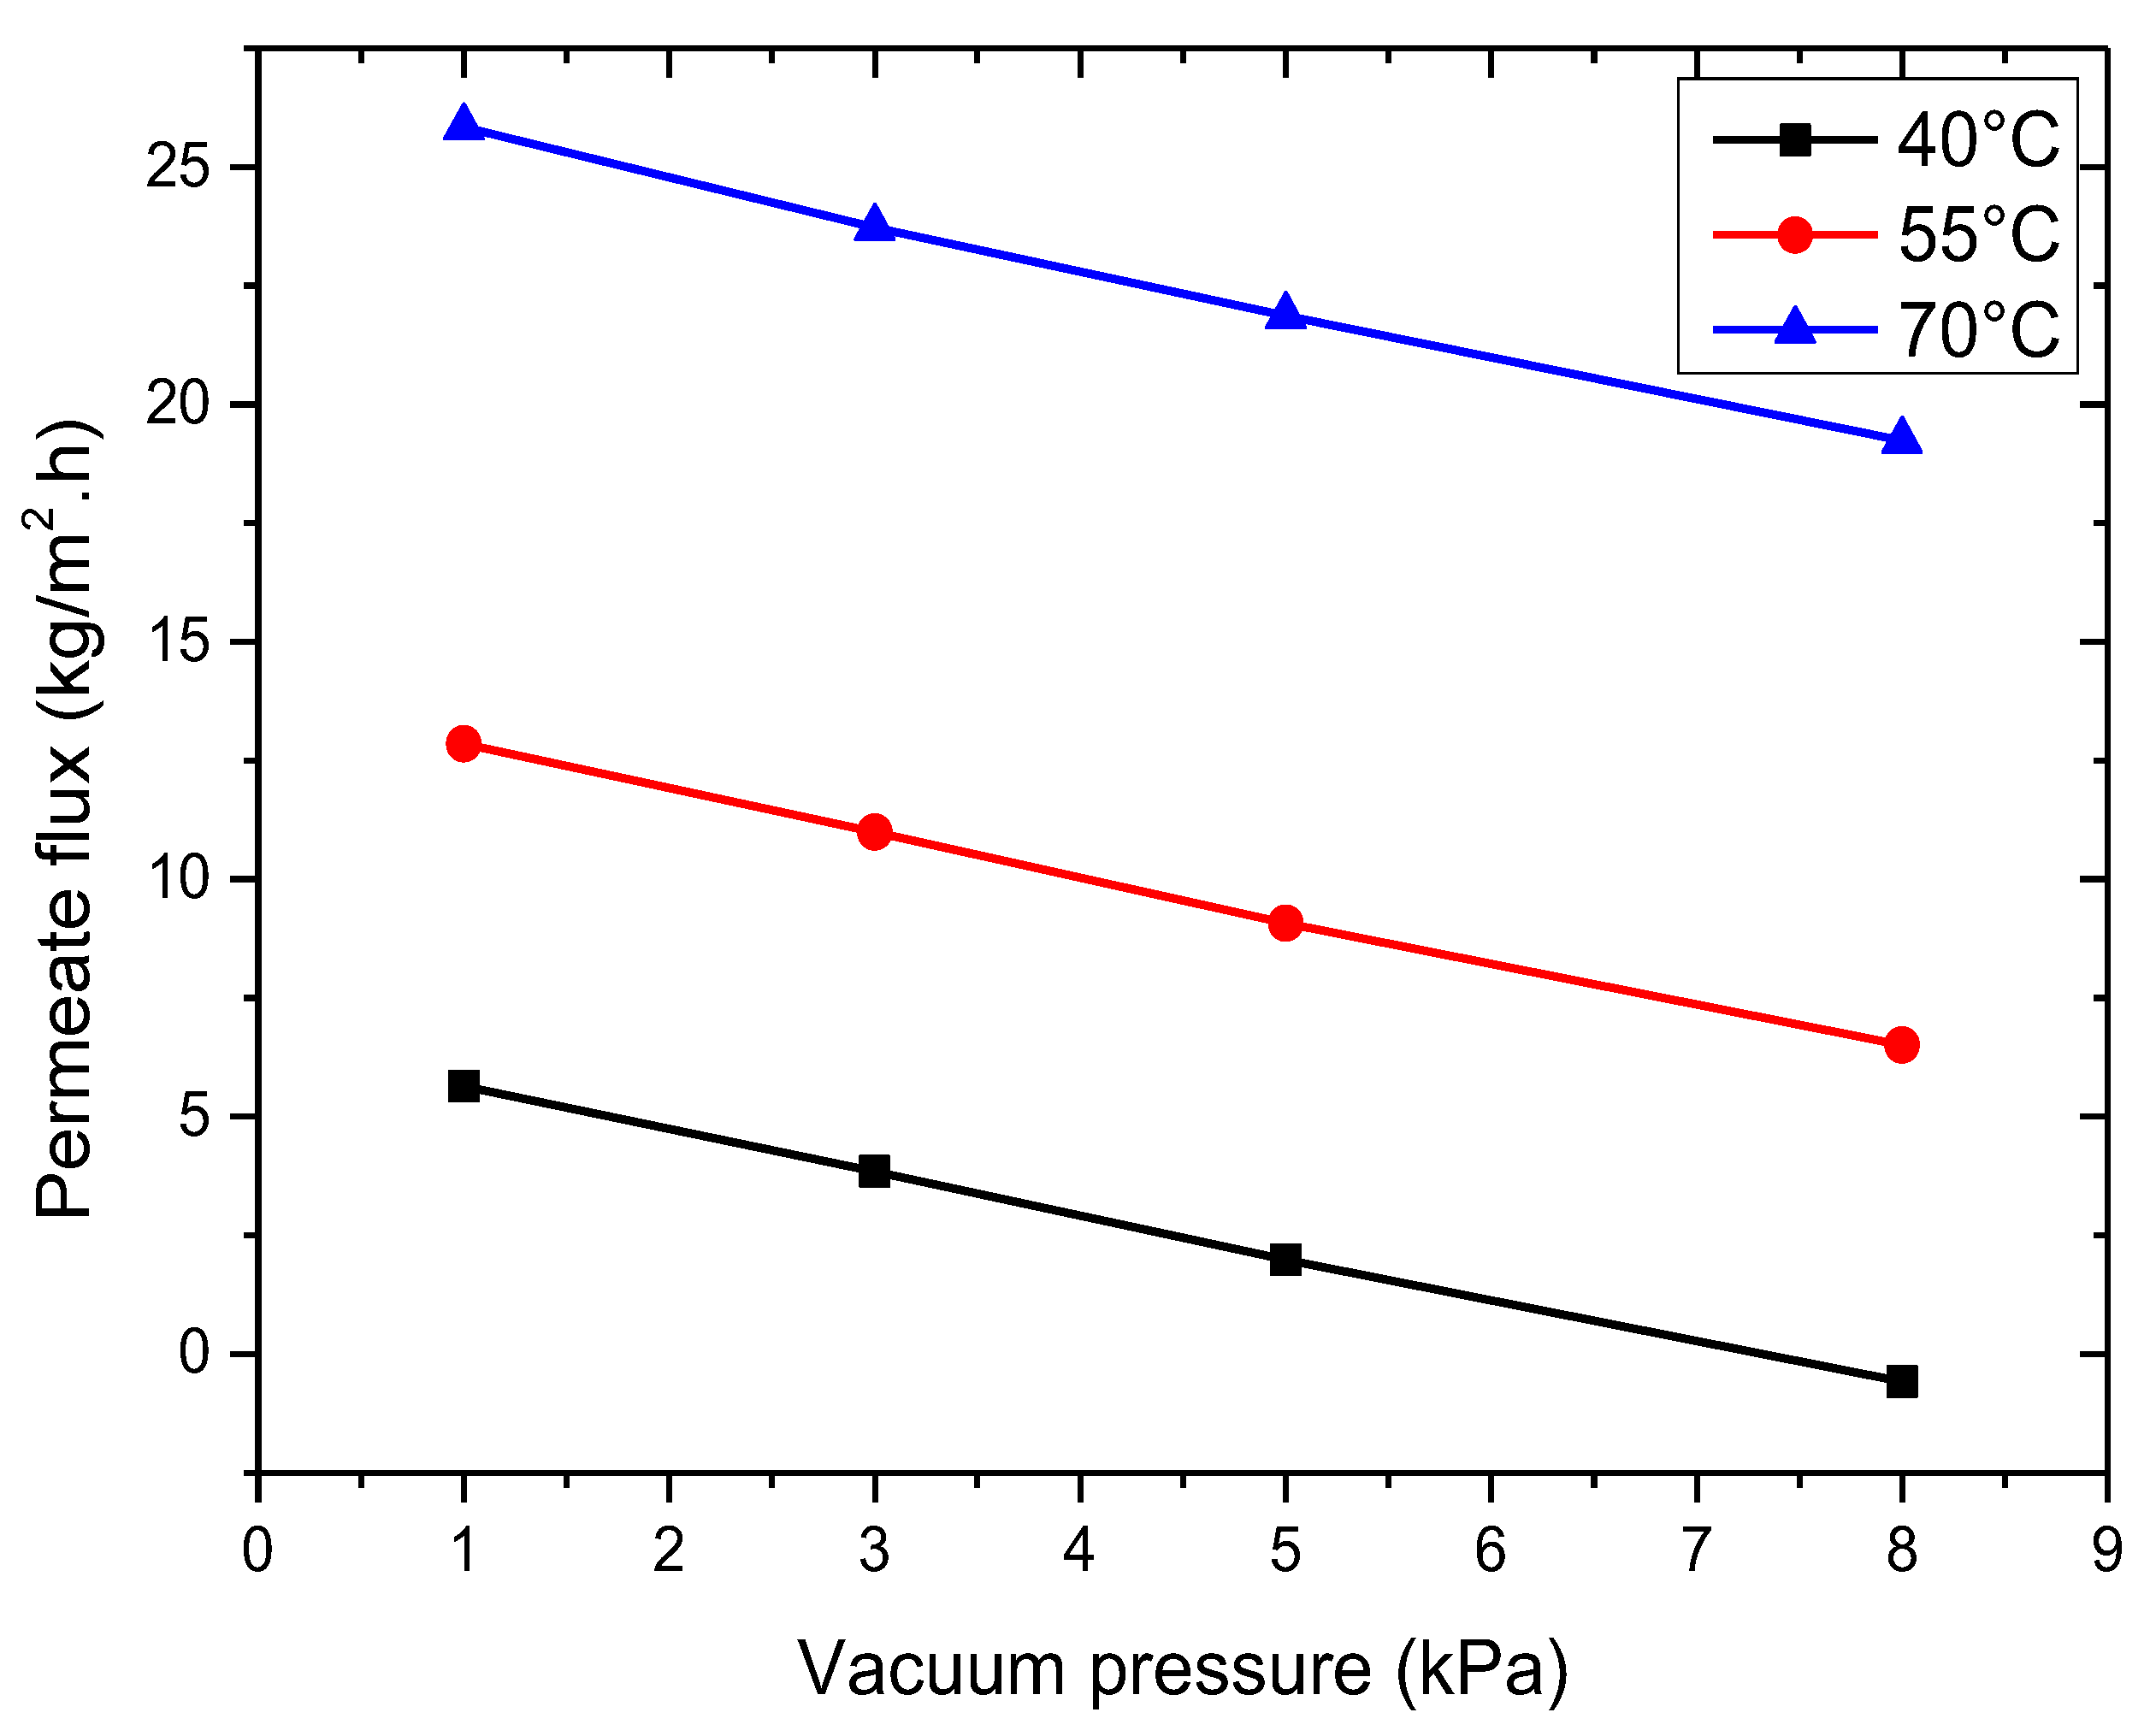
3.2.2. Effect of Vacuum Pressure

In the process of VMD, the pressure exerted on the permeate side plays a critical role as it determines the force driving the mass transfer between the pressurized feed side and the vacuum side. As depicted in Figure 7, the permeate flow rate decreases with an elevation in vacuum pressure on the permeate side, across various feed temperatures, resulting in an approximate reduction of 6.2–6.6 kg/m2·h when the vacuum pressure is raised from 1 to 8 kPa (as per Equation (1)). This decline in permeate flow can be ascribed to the decrease in the pressure gradient across the membrane, which primarily propels the permeation of water vapor through the membrane. A decreased pressure gradient leads to a decreased driving force for the water vapor to traverse the membrane, culminating in a diminution of the permeate flow. Furthermore, augmenting the vacuum pressure on the permeate side could potentially induce concentration polarization, an occurrence stemming from hindered mass transfer that results in the accumulation of salts or other dissolved solutes in proximity to the membrane surface. Consequently, this elevated resistance to mass transfer further contributes to the decrease in permeate flow. However, an excessive reduction in pressure should be averted, as it might cause the hydrophobic membrane to become damp, potentially compromising the efficiency of salt rejection.

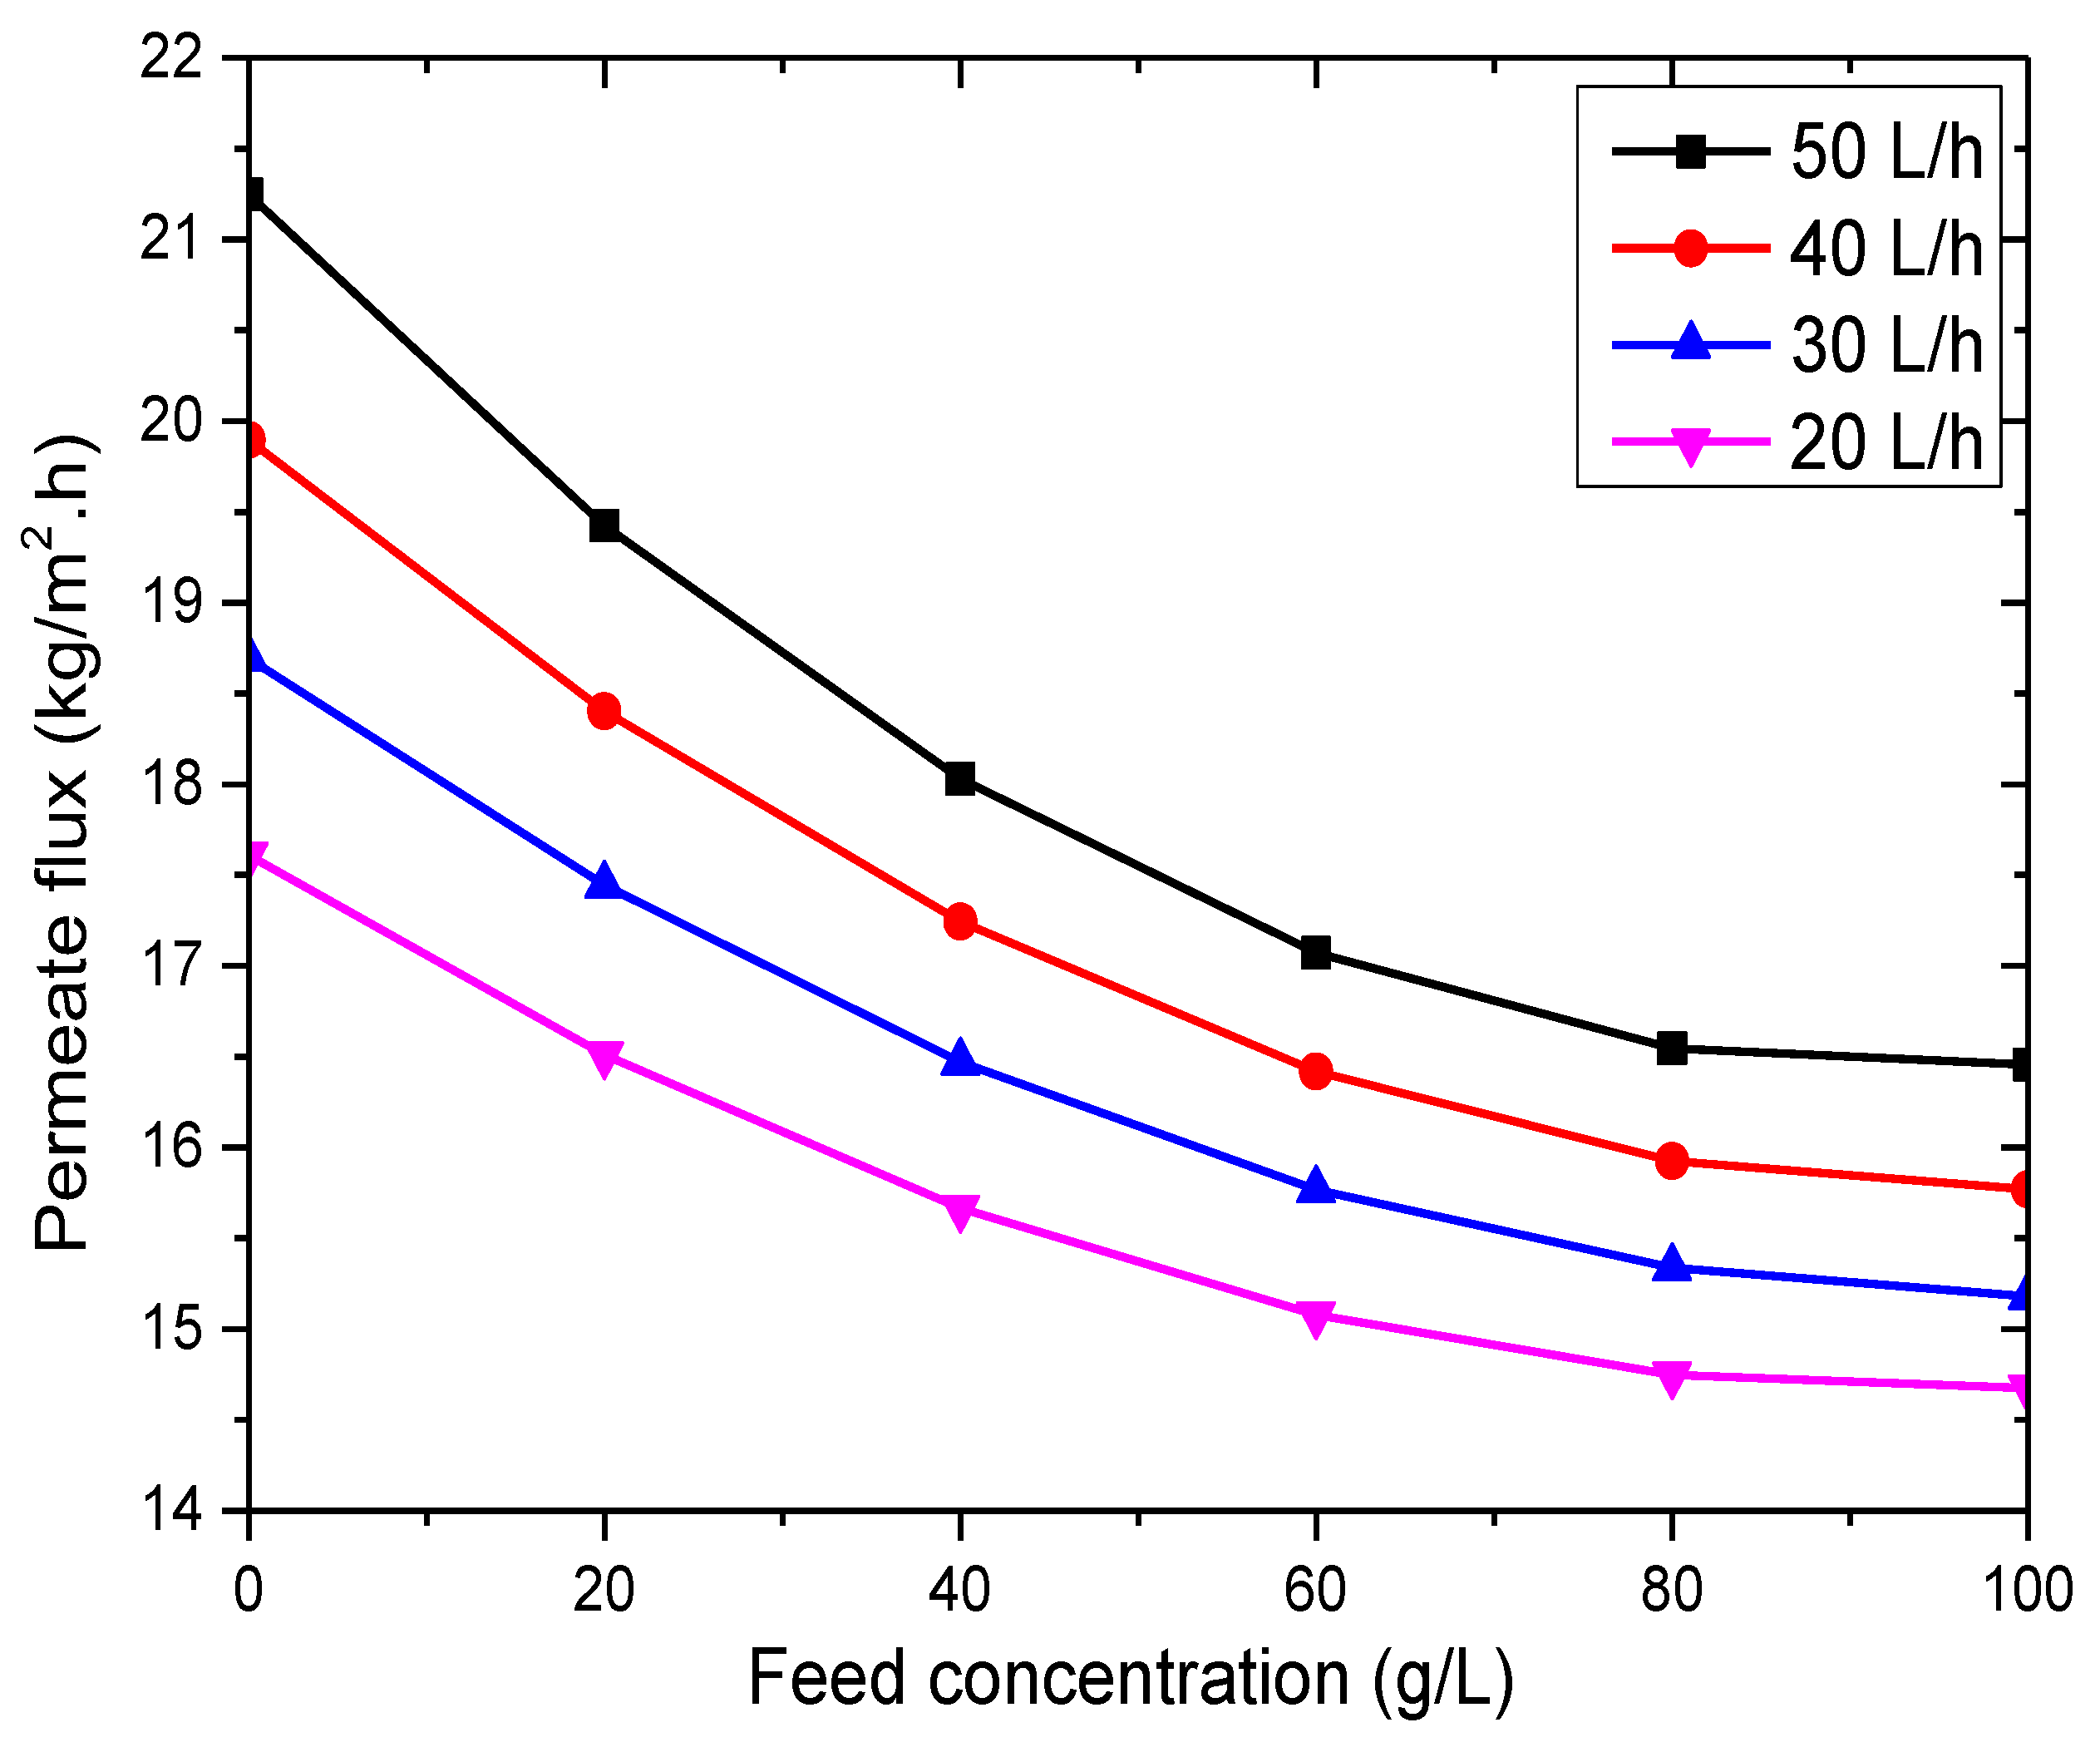
3.2.3. Effect of Feed Concentration

The performance of the VMD process is notably influenced by the concentration of the input solution. As depicted in Figure 8, the flux of the permeate decreases with the increase in the salt concentration at various flow rates. This reduction is attributed to the development of the concentration boundary layer (CBL), which aligns with the thermal boundary layer. As a result, this leads to a decline in resistance to vapor transfer and the flow of the permeate (Equation (15)). The permeation flux experiences a decrease of approximately 12–18% as the salt concentration rises from 0 to 40 g/L due to the decrease in vapor pressure of the solution caused by dissolved chemicals. Furthermore, with the rise in feed concentration from zero to 70 and 100 g/L, the permeation flux experiences reductions of about 18–27% and 20–29%, respectively. This decline can be associated with the decrease in the water activity coefficient, subsequently reducing the driving force across the membrane. Moreover, the physical characteristics of the input solution, including heightened viscosity and density, also influence the mass flow over the membrane by impacting the Reynolds number and heat transfer coefficient.

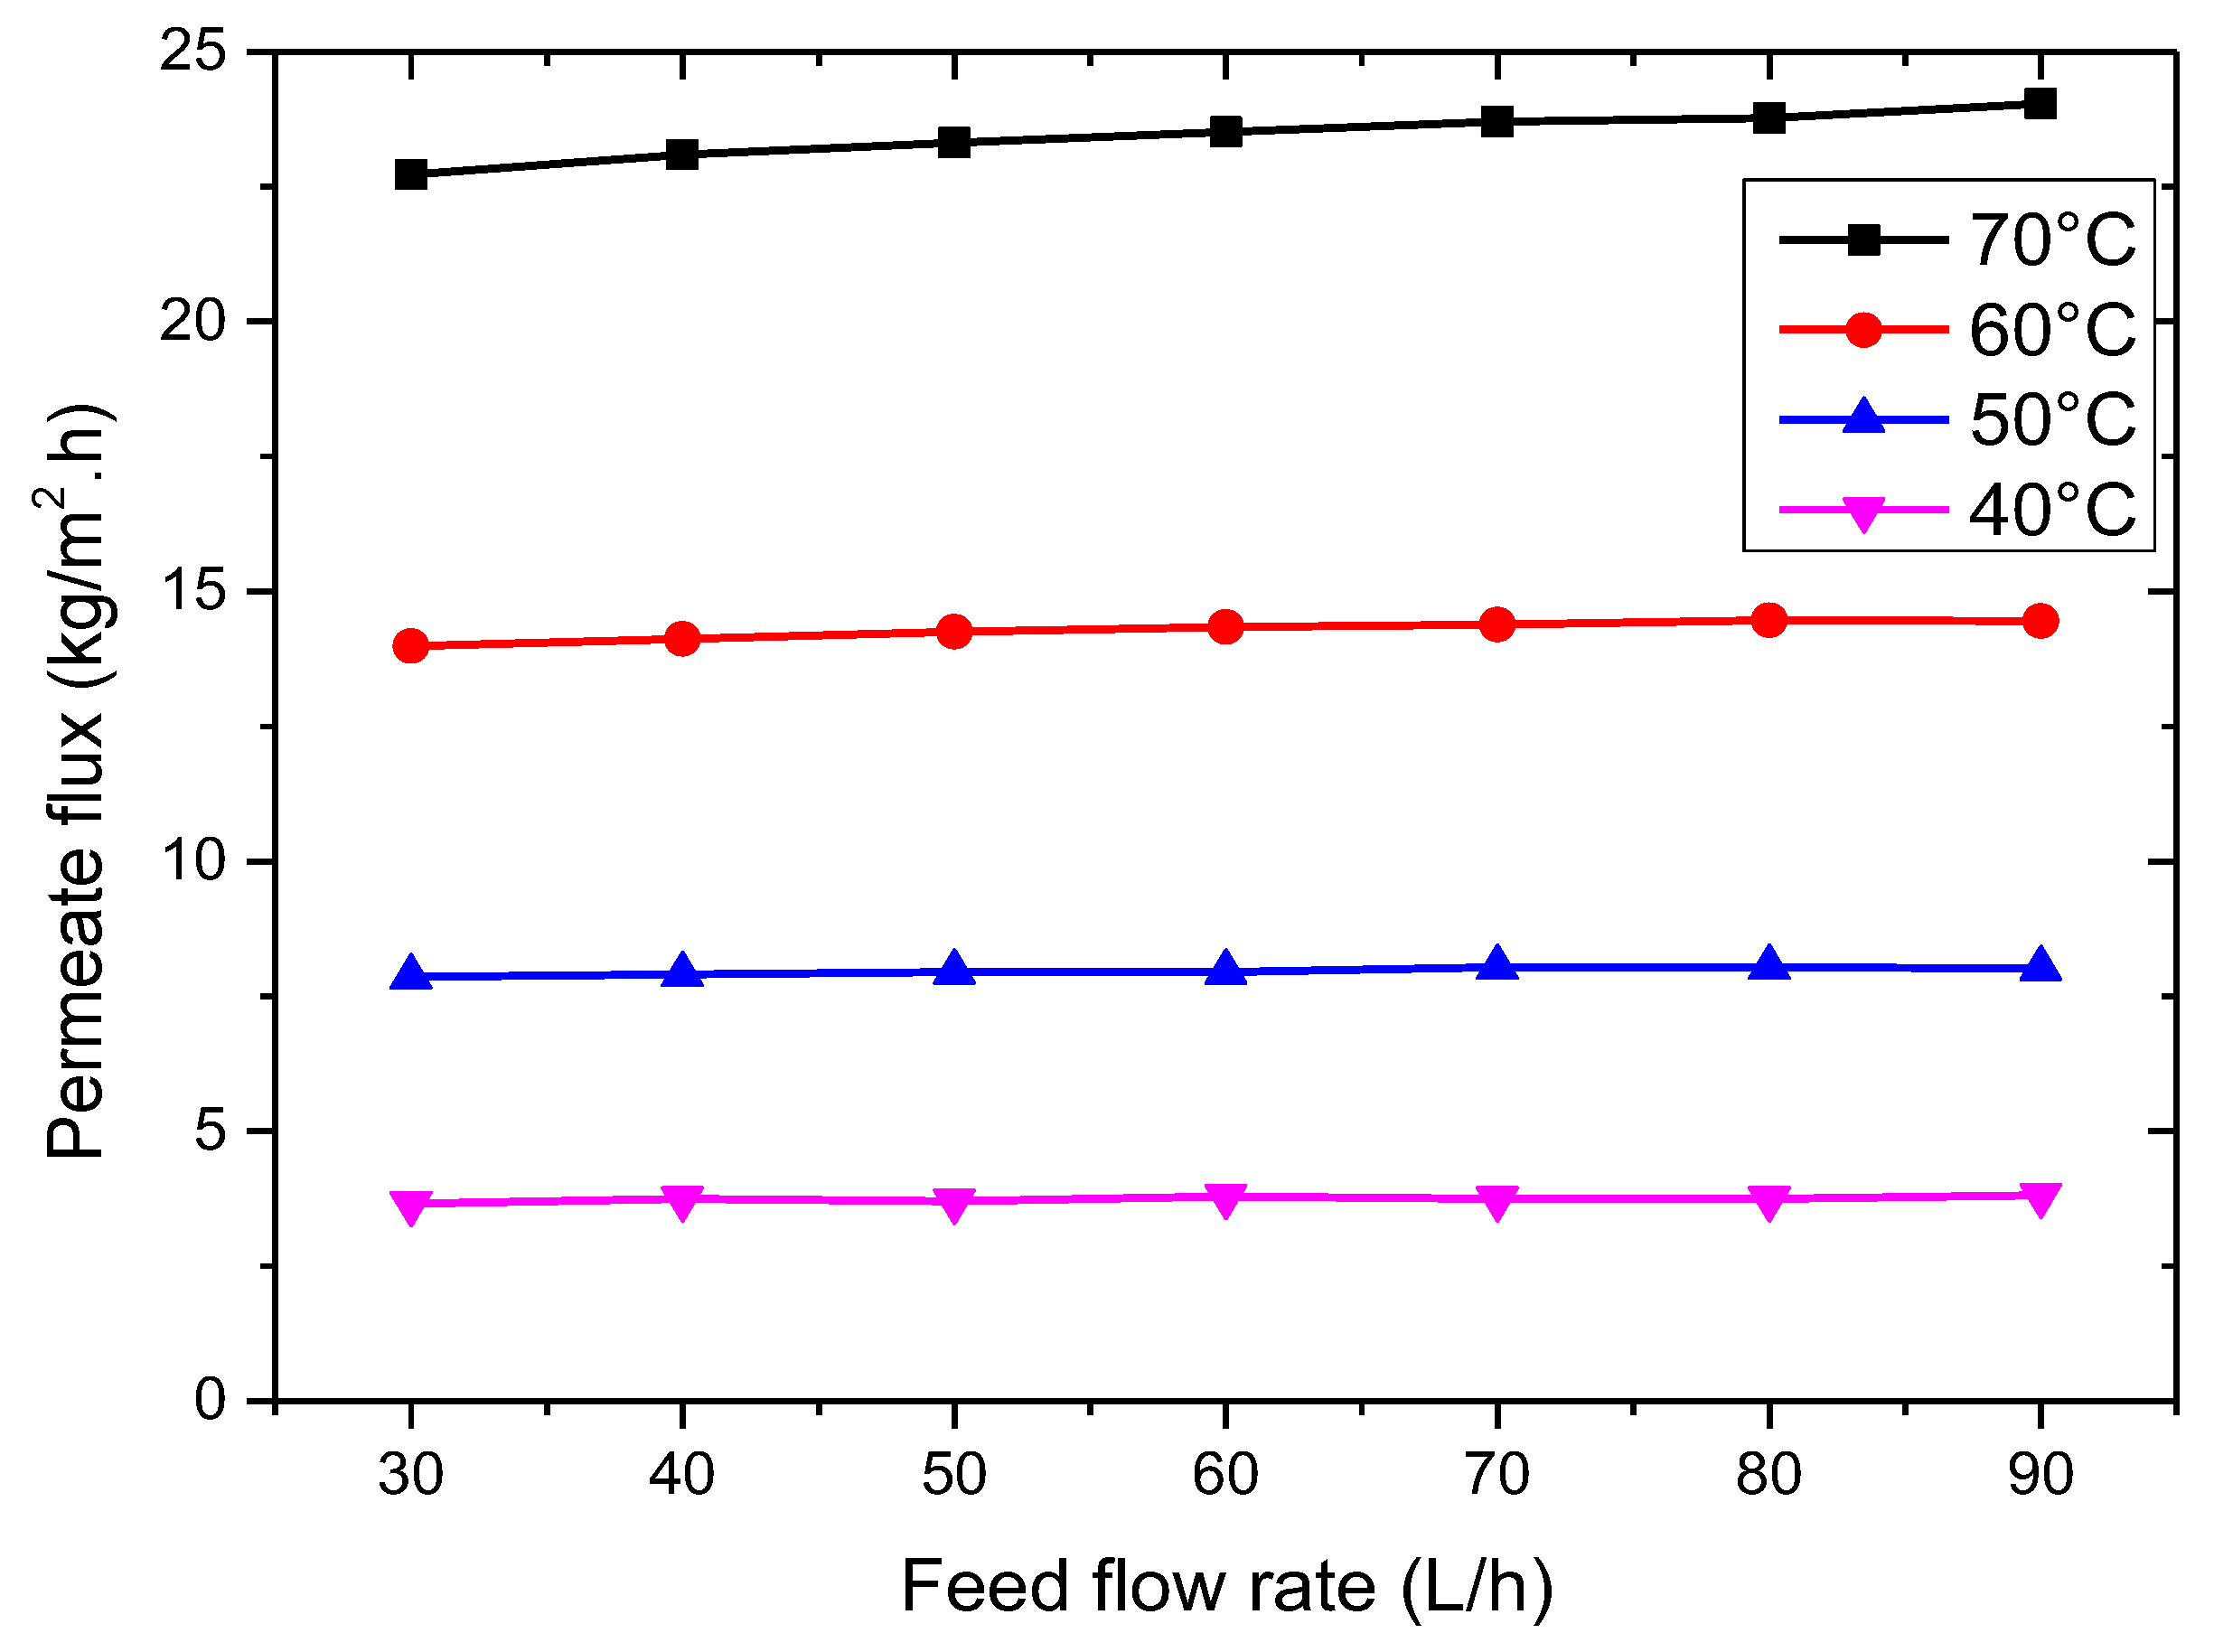
3.2.4. Effect of Feed Flow Rate

The efficiency of the VMD process is heavily impacted by the rate at which the feed is introduced. Figure 9 illustrates the influence of variations in the feed flow rate and temperature on the permeate flux, while maintaining a constant feed solution concentration at 35 g/L and applying a consistent vacuum pressure of 3 kPa on the permeate side. The findings reveal that the permeate flux undergoes a proportional augmentation with an escalation in the feed flow rate. It is important to note, however, that alterations in the feed temperature do not substantially sway this pattern, as indicated in Equation (13). Elevating the feed flow rate induces a decrease in the thickness of the boundary layer on the feed side, ultimately resulting in an enhanced mass transfer coefficient and permeate flux across the membrane surface. Furthermore, a thinner boundary layer on the heated feed side amplifies the heat transfer coefficient by mitigating the temperature disparity between the bulk feed and the membrane interface. For instance, when the feed flow rate is increased from 30 to 40 L/h, there is an approximate 1% rise in the permeate flux, while elevating the feed flow rate to 60 and 90 L/h leads to increases of about 2.5% and 3.3% in the permeate flux, respectively. These improvements can be attributed to the more efficient mass transfer and heat transfer coefficients at higher feed flow rates, ultimately resulting in a higher permeate flux. However, it is essential to optimize the feed flow rate to ensure efficient MD while preventing fouling or other operational issues. A balanced feed flow rate is critical for achieving the optimal VMD performance.

3.2.5. Effect of Membrane Characteristics

The effectiveness of the VMD process can be impacted by various membrane properties, with the thickness of the membrane being a particularly critical factor. As shown in Figure 10, the permeate flux is influenced by the membrane thickness under a constant vacuum pressure of 3 kPa on the permeate side and feed temperatures ranging from 40 to 70 °C. A decrease in the membrane thickness leads to an increase in the permeate flux due to the reduction in the mass transfer resistance (Equation (2)). Nonetheless, thinner membranes also result in increased heat dissipation, presenting a balancing act between the advantage of a lower heat loss and the disadvantage of a diminished permeate flux. In Figure 11, the impact of membrane porosity on the VMD process is depicted. It illustrates that a greater membrane porosity leads to a higher permeate flux, even when operating with comparable feed conditions. Membranes possessing a higher porosity provide a larger evaporative surface and facilitate mass transfer, resulting in a reduced mass transfer resistance and an enhanced mass transfer flux (Equation (3)). Enhancing the membrane porosity proves particularly beneficial for boosting the flux at elevated temperatures. Additionally, maintaining a highly porous VMD membrane is crucial for preventing wetting issues.
The efficiency of vapor transport in VMD depends significantly on the membrane material and microstructure, as they play a vital role in determining the overall effectiveness of the process. Commonly used porous membranes in MD applications are made of hydrophobic materials like polypropylene (PP), poly(vinylidene fluoride) (PVDF), and polytetrafluoroethylene (PTFE) in either hollow-fiber (HF) or flat-sheet (FS) forms. PP presents several advantages over PVDF and PTFE, including cost-effectiveness, favorable mechanical properties, high thermal stability, and resistance to acids, alkalis, and organic solvents.
A comparison of the permeation flux between the PP hollow-fiber membranes used in this study and other membrane types, such as PVDF-PTFE, is presented in Table 4. Notably, the permeation flux achieved in this investigation surpasses that reported in most of the related literature, demonstrating the exceptional performance of the PP hollow-fiber membranes employed in this research.

3.3. Polarization Effect

In VMD, there is a possibility of encountering polarization effects that can have an impact on the overall process performance. Polarization refers to the build-up of temperature gradients and/or concentration gradients either at the surface of the membrane or in the boundary layer that is close to the membrane. The polarization effects in VMD can mainly be categorized into two types: temperature polarization and concentration polarization.

3.3.1. Temperature Polarization

Dealing with temperature polarization poses a considerable obstacle within MD processes. This phenomenon arises when a temperature disparity exists between the bulk of the feed and the membrane surface at the liquid/vapor boundary. Figure 12 illustrates the impact of feed temperature and flow rate on the temperature polarization coefficient. The simulation was conducted at an absolute pressure of 3 kPa on the vacuum side. As depicted in the diagram, augmenting the feed temperature leads to an increased flux in VMD, whereas adjustments to the feed flow rate yield minimal influence. The escalation in the VMD flux is attributed to the elevated vapor pressure in the upper region resulting from the heightened feed temperature, consequently intensifying the impetus for mass transfer. Furthermore, the elevated temperature diminishes the viscosity of the liquid, encouraging turbulent movement. Although elevating the feed flow rate diminishes the temperature polarization due to a higher Reynolds number and heat transfer coefficient, the principal determinant impacting the heat and mass transfers remains the transmembrane resistance. As a result, the feed flow rate becomes an inconsequential element in the VMD flux.

3.3.2. Concentration Polarization

Concentration polarization arises within MD processes when the solute concentration adjacent to the membrane’s surface surpasses that of the bulk feed, primarily due to the effects of evaporation. Figure 13 depicts the impact of the feed concentration and temperature on the concentration polarization coefficient (CPC) while operating under a vacuum pressure of 3 kPa and a feed flow rate of 50 L/h. As the feed temperature escalates from 30 °C to 40 °C, the CPC values exhibit a range spanning from 1.14 to 1.42. Augmented feed concentrations lead to a mitigated manifestation of the concentration polarization phenomenon. Elevating the feed concentration prompts a heightened solute concentration at the membrane’s surface, consequently resulting in a diminished pressure on the permeate side. This, in turn, reduces the concentration gradient, thereby facilitating a gradual augmentation in the permeation flow. In scenarios characterized by elevated feed temperatures, a more substantial boundary layer is established owing to the amplified permeate flux. As a consequence, an elevated CPC is observed since a larger quantity of solute is transported to the membrane and subsequently rejected. This necessitates an increased diffusion of the solute back into the bulk solution. The graphical representation indicates a marginal shift in CPC values in correspondence with the upsurge in the feed temperature.

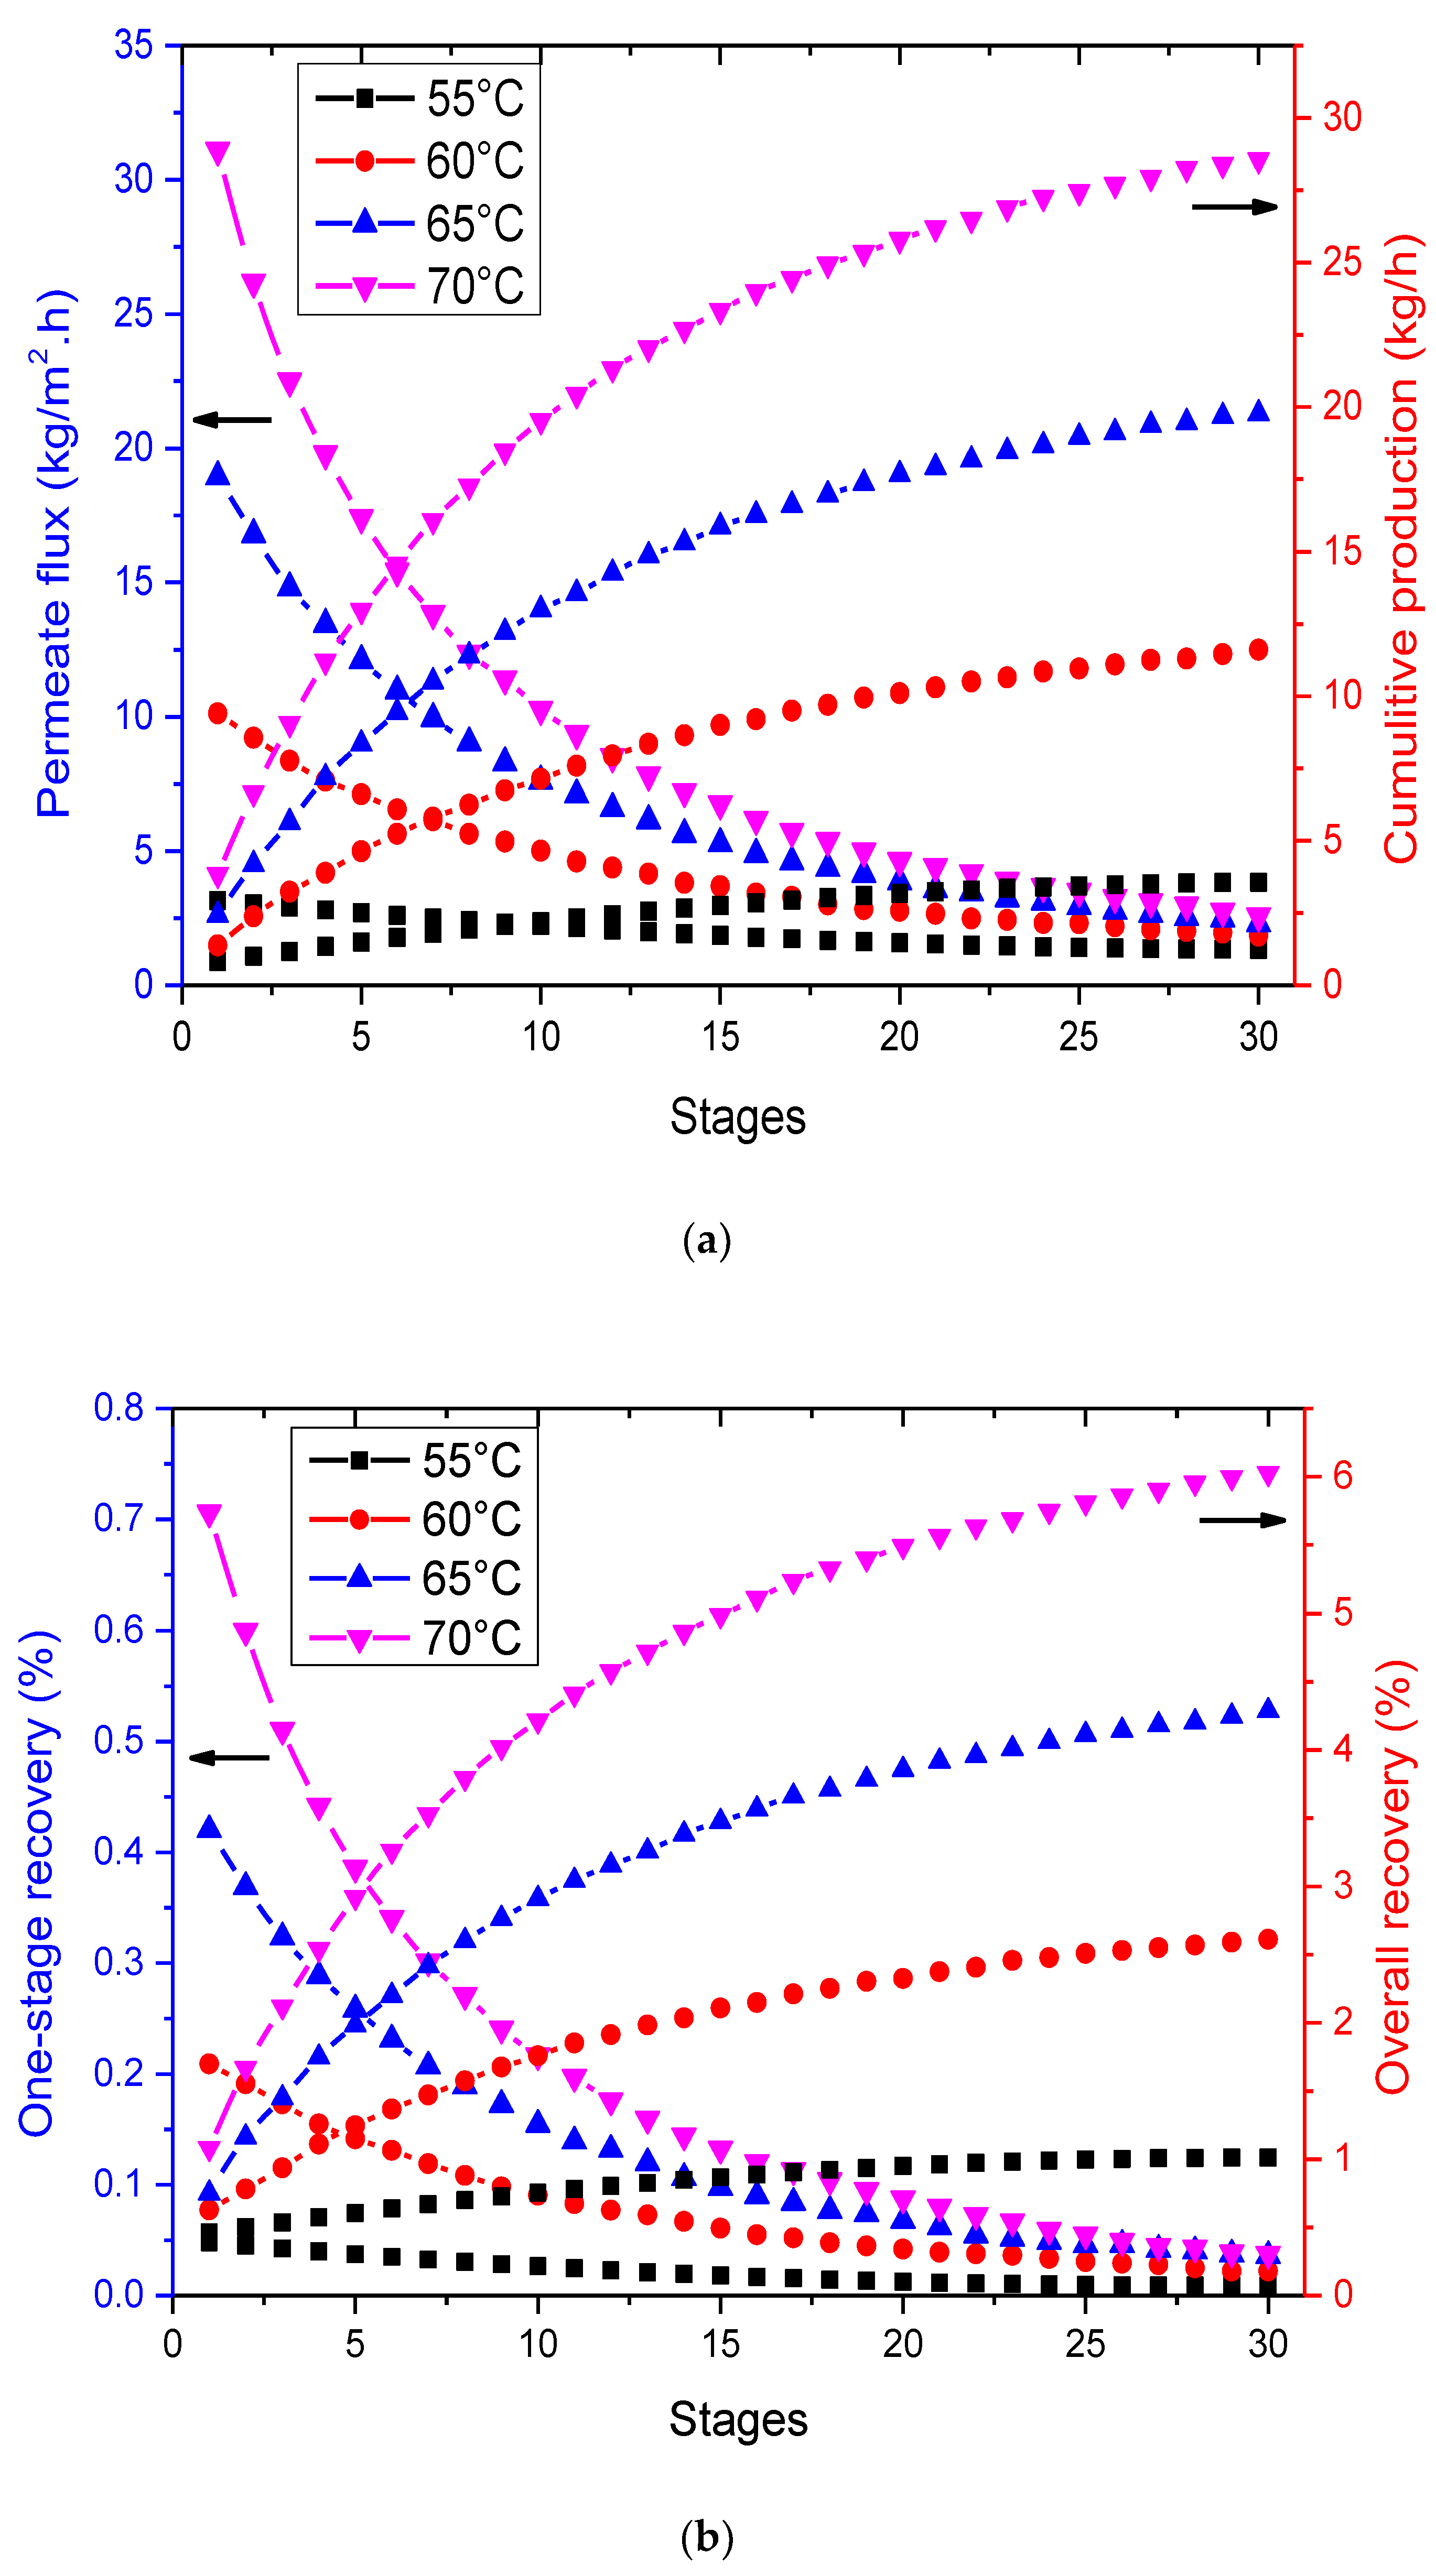
3.4. Effect of Multi-Staging in VMD

M-VMD combines the benefits of vacuum distillation and multi-effect systems, resulting in significant heat and water recovery capabilities. In Figure 14a, the graph displays the permeate output for each individual stage within an M-VMD process including 30 one-stage modules for different feed water temperatures. Simulations were conducted with a feed concentration of 35 g/L, a feed flow rate of 100 L/h, and an absolute pressure of 3 kPa on the permeate side. Based on the graph, it is evident that the water output decreases progressively as the number of stages increases, particularly at higher feed temperatures. This behavior is attributed to the greater permeate output during the early stages due to higher feed solution temperatures and lower salinity compared to the later stages. Consequently, the increased permeate yield extracts more energy from the input side, resulting in a decrease in the feed solution’s inlet temperature and an increase in the feed concentration for subsequent stages. Nevertheless, the cumulative water production steadily rises, as depicted in Figure 14a. Additionally, the initial stage’s temperature plays a vital role in enhancing the overall water production. At a feed temperature of 70 °C, the highest permeate flux achieved in a single stage is 31.1 kg/m2·h, and the total cumulative production amounts to 28.5 kg/h.
In Figure 14b, the water recovery for both individual stages and the overall process demonstrates a similar increasing trend, as illustrated in Figure 14a. The maximum one-stage recovery achieved is 0.7%, while the overall recovery reaches 6% at a feed temperature of 70 °C. It is essential to note that the recovery values cannot exceed 7% in a single pass, as reported in the literature for DCMD modules [16].

4. Conclusions

In this paper, a comprehensive modeling approach was developed by analyzing the heat and mass transfer in both single-stage and multi-stage VMD processes for seawater desalination to evaluate the impact of various operating parameters on the water production and the contribution of polarization to the permeate flux. By identifying critical parameters and understanding the underlying mechanisms governing heat and mass transfer, engineers and researchers can design and operate VMD systems with improved performance and stability.
The numerical predictions were compared with previous experimental and numerical results of VMD, and the findings revealed the following:
  • The proposed numerical model provides a better fit with experimental data by introducing the polarization concentration phenomenon. As a result, the numerical model developed in this study could be used with confidence to simulate and design a VMD system for specific operating conditions.
  • The VMD permeation flux increases with rising feed temperature and flow rate but decreases with increased feed salt concentration and vacuum pressure. At 35 g/L feed concentration, 65 °C feed temperature, 50 L/h feed flow rate, and 3 kPa vacuum pressure, the permeation flux reached 18.42 kg/m2·h.
  • The VMD process has minimal sensitivity to feed concentration, making it highly advantageous for water desalination.
  • The permeate flux increases with membrane porosity and decreases with membrane thickness.
  • The most influential factor in determining the permeation flux is feed temperature, followed by membrane thickness, vacuum pressure, membrane porosity, feed concentration, and feed flow rate.
  • Temperature polarization has a more significant effect on the permeate flux than concentration polarization.
  • Multi-staging is a promising approach to enhance the performance of VMD and has the potential to make this process more efficient. However, it is important to optimize the operating conditions for each stage to ensure that the maximum separation efficiency is achieved while minimizing the energy consumption.
Finally, it is worth mentioning that fouling has a lesser impact on MD compared to other pressure-driven membrane methods. Nevertheless, it can result in a poor performance of the membrane process. Fouling and the accumulation of contaminants on the membrane surface led to reduced effective membrane area and wetting, which causes a decrease in distillate flux and rejection levels. Hence, it is crucial to minimize the effects of these issues to achieve optimum efficiency in the VMD process. This will be published soon as the second part of the current study, using CFD simulations in order to identify areas of high salt concentration and their impact on the water vapor flux.

Author Contributions

Conceptualization, Z.T., Z.F., S.L., H.T., A.A., M.Z., M.K., A.A.A., L.K. and J.Z.; Methodology, Z.T., Z.F., S.L., H.T., A.A., A.A.A., L.K. and J.Z.; Software, Z.T., Z.F., H.T., A.A., M.Z., M.K., A.A.A., L.K. and J.Z.; Validation, Z.T., Z.F., H.T., A.A., M.K., A.A.A., L.K. and J.Z.; Formal analysis, Z.T., Z.F., H.T., A.A., M.K., A.A.A., L.K. and J.Z.; Investigation, Z.T., Z.F., S.L., H.T., A.A., M.Z., A.A.A. and L.K.; Resources, Z.T., Z.F., S.L., H.T., A.A. and M.Z.; Data curation, Z.T., Z.F., H.T., A.A., M.Z. and J.Z.; Writing—original draft, Z.T. and Z.F.; Writing—review & editing, S.L., H.T., A.A., M.Z., M.K., A.A.A., L.K. and J.Z.; Visualization, Z.T., S.L., H.T., A.A., M.Z., M.K., A.A.A., L.K. and J.Z.; Supervision, A.A.; Project administration, Z.T., H.T., A.A., A.A.A., L.K. and J.Z. All authors have read and agreed to the published version of the manuscript.

Funding

Not applicable.

Data Availability Statement

Not applicable.

Acknowledgments

This work was supported and funded by the Deanship of Scientific Research at Imam Mohammad Ibn Saud Islamic University (IMSIU) (grant number IMSIU-RP23013).

Conflicts of Interest

The authors declare no conflict of interest.

Nomenclature

A m effective membrane area[m2]
B m permeate coefficient of the membrane[kg·m2·s−1·Pa−1]
C solute concentration[g/kg]
C m solute concentration on the membrane surface[g/kg]
C f concentration of the feed solution[g/kg]
C p concentration of the permeate.[g/kg]
C p , w water heat capacity[J·kg−1·K]
D k n diffusion coefficient of solute[m2·s−1]
d h hydraulic diameter[m]
h w heat transfer coefficient[W·m−2·s−1]
Δ H v latent heat of vaporization[J·kg−1]
J w water vapor flux[kg·m−2·s−1]
k mass transfer coefficient[m·s−1]
L effective length of fiber[m]
M molecular mass of water[kg·mol−1]
N u Nusselt number
P pressure[Pa]
P r Prandtl number
P v pressure in the vacuum side[Pa]
Qflow rate[L/h]
Q b , i n flow rate of steam
Q p n permeate flow rate.
Q f volumetric flow rate of the feed solution
Q p volumetric flow rate of the permeate
R gas constant
water recovery
[J mol−1·K−1]
[%]
r membrane pore radius[m]
R e Reynolds numbers
R i water recovery
R n ,water recovery
S c Schmidt number
S h Sherwood number
T temperature[K]
T b , o n bulk feed outlet temperature[K]
T m membrane surface feed[K]
T p permeate side temperature[K]
Greek symbols
δ membrane thickness[m]
ε membrane porosity[-]
η membrane thermal efficiency[%]
τ membrane pore tortuosity[-]
ρwater density[kg·m−1]
λ thermal conductivity of the water[W·m−1·K−1]
μ dynamic viscosity[Pa·s−1]
Subscripts
b,ibrine, inlet
b,obrine, outlet
ffeed
i,nstage number
Mmembrane surface
vvacuum
ttotal

References

  1. Zhang, J.; Luo, X.; Zhang, X.; Xu, Y.; Xu, H.; Zuo, J.; Liu, D.; Cui, F.; Wang, W. Three-dimensional porous photo-thermal fiber felt with salt-resistant property for high efficient solar distillation. Chin. Chem. Lett. 2021, 32, 1442–1446. [Google Scholar] [CrossRef]
  2. He, W.; Zhou, L.; Wang, Y.; Yu, L.; Hou, Y.; Bi, S.; Wang, M.; Hou, X. Ternary hierarchical structure based solar-driven evaporator for long-lasting concentrated brine treatment. EcoMat 2023, 5, e12355. [Google Scholar] [CrossRef]
  3. Lin, S.; Zhao, H.; Zhu, L.; He, T.; Chen, S.; Gao, C.; Zhang, L. Seawater desalination technology and engineering in China: A review. Desalination 2021, 498, 114728. [Google Scholar] [CrossRef]
  4. Han, J.; Xing, W.; Yan, J.; Wen, J.; Liu, Y.; Wang, Y.; Wu, Z.; Tang, L.; Gao, J. Stretchable and Superhydrophilic Polyaniline/Halloysite Decorated Nanofiber Composite Evaporator for High Efficiency Seawater Desalination. Adv. Fiber Mater. 2022, 4, 1233–1245. [Google Scholar] [CrossRef]
  5. Triki, Z.; Bouaziz, M.N.; Boumaza, M. Techno-economic analysis of an integrated solar vacuum membrane distillation system for the treatment of reverse osmosis desalination brine. Desalination Water Treat. 2017, 83, 193–203. [Google Scholar] [CrossRef]
  6. Soliman, M.N.; Guen, F.Z.; Ahmed, S.A.; Saleem, H.; Khalil, M.J.; Zaidi, S.J. Energy consumption and environmental impact assessment of desalination plants and brine disposal strategies. Process. Saf. Environ. Prot. 2021, 147, 589–608. [Google Scholar] [CrossRef]
  7. Khayet, M. Membranes and theoretical modeling of membrane distillation: A review. Adv. Colloid Interface Sci. 2011, 164, 56–88. [Google Scholar] [CrossRef]
  8. Swaminathan, J.; Chung, H.W.; Warsinger, D.M.; Lienhard, J.H. Energy efficiency of membrane distillation up to high salinity: Evaluating critical system size and optimal membrane thickness. Appl. Energy 2018, 211, 715–734. [Google Scholar] [CrossRef]
  9. Suga, Y.; Takagi, R.; Matsuyama, H. Effect of hollow fiber membrane properties and operating conditions on pre-venting scale precipitation in seawater desalination with vacuum membrane distillation. Desalination 2022, 527, 115578. [Google Scholar] [CrossRef]
  10. Guo, J.; Deka, B.J.; Kim, K.-J.; An, A.K. Regeneration of superhydrophobic TiO2 electrospun membranes in seawater desalination by water flushing in membrane distillation. Desalination 2019, 468, 114054. [Google Scholar] [CrossRef]
  11. Banat, F.; Al-Rub, F.A.; Bani-Melhem, K. Desalination by vacuum membrane distillation: Sensitivity analysis. Sep. Purif. Technol. 2003, 33, 75–87. [Google Scholar] [CrossRef]
  12. Wu, B.; Tan, X.; Li, K.; Teo, W.K. Removal of 1,1,1-trichloroethane from water using a Poly(Vinylidene fluoride) hollow fiber membrane module: Vacuum membrane distillation operation. Sep. Purf. Tech. 2006, 52, 301–309. [Google Scholar] [CrossRef]
  13. Bagger-Jørgensen, R.; Meyer, A.S.; Varming, C.; Jonsson, G. Recovery of volatile aroma compounds from black currant juice by vacuum membrane distillation. J. Food Eng. 2004, 64, 23–31. [Google Scholar] [CrossRef]
  14. Mericq, J.P.; Laborie, S.; Cabassud, C. Vacuum membrane distillation of seawater reverse osmosis brines. Water Res. 2010, 44, 5260–5273. [Google Scholar] [CrossRef] [PubMed]
  15. Cabassud, C.; Wirth, D. Membrane distillation for water desalination: How to choose an appropriate membrane? Desalination 2003, 157, 307–314. [Google Scholar] [CrossRef]
  16. Koo, J.; Han, J.; Sohn, J.; Lee, S.; Hwang, T.-M. Experimental comparison of direct contact membrane distillation (DCMD) with vacuum membrane distillation (VMD). Desalination Water Treat. 2013, 51, 6299–6309. [Google Scholar] [CrossRef]
  17. Shao, F.; Hao, C.; Ni, L.; Zhang, Y.; Du, R.; Meng, J.; Liu, Z.; Xiao, C. Experimental and theoretical research on N-methyl-2-pyrrolidone concentration by vacuum membrane distillation using polypropylene hollow fiber membrane. J. Membr. Sci. 2014, 452, 157–164. [Google Scholar] [CrossRef]
  18. Ashoor, B.; Mansour, S.; Giwa, A.; Dufour, V.; Hasan, S. Principles and applications of direct contact membrane distillation (DCMD): A comprehensive review. Desalination 2016, 398, 222–246. [Google Scholar] [CrossRef]
  19. Liu, J.; Liu, M.; Guo, H.; Zhang, W.; Xu, K.; Li, B. Mass transfer in hollow fiber vacuum membrane distillation process based on membrane structure. J. Membr. Sci. 2017, 532, 115–123. [Google Scholar] [CrossRef]
  20. Liu, Z.; Gao, Q.; Lu, X.; Ma, Z.; Zhang, H.; Wu, C. Experimental study of the optimal vacuum pressure in vacuum assisted air gap membrane distillation process. Desalination 2017, 414, 63–72. [Google Scholar] [CrossRef]
  21. Camacho, L.M.; Dumée, L.; Zhang, J.; Li, J.-D.; Duke, M.; Gomez, J.; Gray, S. Advances in Membrane Distillation for Water Desalination and Purification Applications. Water 2013, 5, 94–196. [Google Scholar] [CrossRef]
  22. Khalifa, A.E. Water and air gap membrane distillation for water desalination—An experimental comparative study. Sep. Purif. Technol. 2015, 141, 276–284. [Google Scholar] [CrossRef]
  23. Gustafson, R.D.; Murphy, J.R.; Achilli, A. A stepwise model of direct contact membrane distillation for application to large-scale systems: Experimental results and model predictions. Desalination 2016, 378, 14–27. [Google Scholar] [CrossRef]
  24. Luo, A.; Lior, N. Critical review of membrane distillation performance criteria. Desalination Water Treat. 2016, 57, 20093–20140. [Google Scholar] [CrossRef]
  25. Olatunji, S.O.; Camacho, L.M. Heat and Mass Transport in Modeling Membrane Distillation Configurations: A Review. Front. Energy Res. 2018, 6, 1–18. [Google Scholar] [CrossRef]
  26. Kanbur, B.B.; Wu, C.; Duan, F. Multi-criteria thermoeconomic and thermodynamic assessments of the desalination-integrated two-phase liquid-immersion data center cooling system. Int. J. Energy Res. 2020, 44, 10453–10470. [Google Scholar] [CrossRef]
  27. Termpiyakul, P.; Jiraratananon, R.; Srisurichan, S. Heat and mass transfer characteristics of a direct contact membrane distil-lation process for desalination. Desalination 2005, 177, 133–141. [Google Scholar] [CrossRef]
  28. Wu, H.Y.; Tay, M.; Field, R.W. Novel method for the design and assessment of direct contact membrane distillation modules. J. Membr. Sci. 2016, 513, 260–269. [Google Scholar] [CrossRef]
  29. Mericq, J.-P.; Laborie, S.; Cabassud, C. Vacuum membrane distillation for an integrated seawater desalination process. Desalination Water Treat. 2009, 9, 287–296. [Google Scholar] [CrossRef]
  30. Mason, E.A.; Malinauskas, A.P. Gas Transport in Porous Media: The Dusty Gas Model; Elsevier Science Ltd.: Amsterdam, The Netherlands, 1983. [Google Scholar]
  31. Jackson, R. Transport in Porous Catalysts; Elsevier Science Ltd.: Amsterdam, The Netherlands, 1977. [Google Scholar]
  32. Lawson, K.W.; Lloyd, D.R. Review: Membrane distillation. J. Membr. Sci. 1997, 124, 1–25. [Google Scholar] [CrossRef]
  33. Soni, V.; Abildskov, J.; Jonsson, G.; Gani, R. Modeling and analysis of vacuum membrane distillation for the recovery of volatile aroma compounds from black currant juice. J. Membr. Sci. 2008, 320, 442–455. [Google Scholar] [CrossRef]
  34. Upadhyaya, S.; Singh, K.; Chaurasia, S.P.; Agarwal, M.; Dohare, R.K. Parametric Sensitivity Analysis of Vacuum Membrane Distillation for Desalination Process. In Proceedings of the International Conference on Chemical, Ecology and Environmental Sciences, ICCEES, Pattaya, Thailand, 17–18 December 2011. [Google Scholar]
  35. Lee, J.-G.; Kim, W.-S. Numerical modeling of the vacuum membrane distillation process. Desalination 2013, 331, 46–55. [Google Scholar] [CrossRef]
  36. Wang, L.; Wang, H.; Li, B.; Wang, Y.; Wang, S. Novel design of liquid distributors for VMD performance improvement based on cross-flow membrane module. Desalination 2014, 336, 80–86. [Google Scholar] [CrossRef]
  37. Hayer, H.; Bakhtiari, O.; Mohammadi, T. Analysis of heat and mass transfer in vacuum membrane distillation for water de-salination using computational fluid dynamics (CFD). Desalination Water. Treat. 2015, 55, 39–52. [Google Scholar] [CrossRef]
  38. Kim, Y.D.; Kim, Y.B.; Woo, S.Y. Detailed modeling and simulation of an out-in configuration vacuum membrane distillation process. Water Res. 2018, 132, 23–33. [Google Scholar] [CrossRef]
  39. Liu, J.; Wang, Q.; Han, L.; Li, B. Simulation of heat and mass transfer with cross-flow hollow fiber vacuum membrane distillation: The influence of fiber arrangement. Chem. Eng. Res. Des. 2017, 119, 12–22. [Google Scholar] [CrossRef]
  40. Asghari, M.; Lovineh, S.G.; Raji, M. Numerical simulation and theoretical study on effects of operating parameters in Persian Gulf desalination using vacuum membrane distillation. J. Model. Eng. 2018, 16, 41–49. [Google Scholar]
  41. Dragoi, E.-N.; Vasseghian, Y. Modeling of mass transfer in vacuum membrane distillation process for radioactive wastewater treatment using artificial neural networks. Toxin Rev. 2020, 40, 1526–1535. [Google Scholar] [CrossRef]
  42. Ibrahim, S.S.; Alsalhy, Q.F. How far can membrane characteristic parameters bestow at the vacuum membrane distillation (VMD) performance: Modeling and simulation. Sep. Sci. Technol. 2022, 57, 1211–1233. [Google Scholar] [CrossRef]
  43. Sarbatly, R.; Chiam, C.-K. Evaluation of geothermal energy in desalination by vacuum membrane distillation. Appl. Energy 2013, 112, 737–746. [Google Scholar] [CrossRef]
  44. Zhao, K.; Heinzl, W.; Wenzel, M.; Büttner, S.; Bollen, F.; Lange, G.; Heinzl, S.; Sarda, N. Experimental study of the memsys vac-uum-multi-effect-membrane-distillation (VMEMD) module. Desalination 2013, 323, 150–160. [Google Scholar] [CrossRef]
  45. Lee, J.-G.; Kim, W.-S. Numerical study on multi-stage vacuum membrane distillation with economic evaluation. Desalination 2014, 339, 54–67. [Google Scholar] [CrossRef]
  46. Mohamed, E.S.; Boutikos, P.; Mathioulakis, E.; Belessiotis, V. Experimental evaluation of the performance and energy efficiency of a Vacuum Multi-Effect Membrane Distillation system. Desalination 2017, 408, 70–80. [Google Scholar] [CrossRef]
  47. Zhang, Y.; Peng, Y.; Ji, S.; Qi, J.; Wang, S. Numerical modeling and economic evaluation of two multi-effect vacuum membrane distillation (ME-VMD) processes. Desalination 2017, 419, 39–48. [Google Scholar] [CrossRef]
  48. Abu-Zeid, M.A.E.R.; Zhang, Y.; Dong, H.; Zhang, L.; Chen, H.L.; Hou, L. A comprehensive review of vacuum membrane dis-tillation technique. Desalination 2015, 356, 1–14. [Google Scholar] [CrossRef]
  49. Schofield, R.; Fane, A.; Fell, C. Heat and mass transfer in membrane distillation. J. Membr. Sci. 1987, 33, 299–313. [Google Scholar] [CrossRef]
  50. Diban, N.; Voinea, O.C.; Urtiaga, A.; Ortiz, I. Vacuum membrane distillation of the main pear aroma compound: Experimental study and mass transfer modeling. J. Membr. Sci. 2009, 326, 64–75. [Google Scholar] [CrossRef]
  51. Tang, N.; Peng, Y.; Jia, Z.; Zhang, L.; Xiang, J.; Yuan, L.; Cheng, P.; Wang, X.-K. Vacuum membrane distillation simulation of desalination using polypropylene hydrophobic microporous membrane. J. Appl. Polym. Sci. 2015, 132, 41632. [Google Scholar] [CrossRef]
  52. Sharqawy, M.H.; Lienhard, V.J.H.; Zubair, S.M. Thermophysical properties of seawater: A review of existing correlations and data. Desalination Water Treat. 2010, 16, 354–380. [Google Scholar] [CrossRef]
  53. Bandini, S.; Gostoli, C.; Sarti, G. Separation efficiency in vacuum membrane distillation. J. Membr. Sci. 1992, 73, 217–229. [Google Scholar] [CrossRef]
  54. Thomas, L.C. Heat Transfer, 2nd ed.; Prentice Hall: Englewood Cliffs, NJ, USA, 1992. [Google Scholar]
  55. Laganà, F.; Barbieri, G.; Drioli, E. Direct contact membrane distillation: Modelling and concentration experiments. J. Membr. Sci. 2000, 166, 1–11. [Google Scholar] [CrossRef]
  56. Cherayan, M. Ultrafiltration and Microfiltration Handbook; CRC Press: Boca Raton, FL, USA, 1998. [Google Scholar]
  57. McCutcheon, R.; Elimelech, M. Influence of concentrative and dilutive internal concentration polarization on flux behavior in forward osmosis. J. Membr. Sci. 2006, 284, 237–247. [Google Scholar] [CrossRef]
  58. Mengual, J.; Khayet, M.; Godino, M. Heat and mass transfer in vacuum membrane distillation. Int. J. Heat Mass Transf. 2004, 47, 865–875. [Google Scholar] [CrossRef]
  59. Alkhudhiri, A.; Darwish, N.; Hilal, N. Membrane distillation: A comprehensive review. Desalination 2012, 287, 2–18. [Google Scholar] [CrossRef]
  60. Chiam, C.-K.; Sarbatly, R. Vacuum membrane distillation processes for aqueous solution treatment—A review. Chem. Eng. Process. Process Intensif. 2013, 74, 27–54. [Google Scholar] [CrossRef]
  61. Jang, E.; Nam, S.-H.; Hwang, T.-M.; Lee, S.; Choi, Y. Effect of operating parameters on temperature and concentration po-larization in vacuum membrane distillation process. Desalination Water Treat. 2015, 54, 871–880. [Google Scholar] [CrossRef]
  62. Fan, H.; Peng, Y. Application of PVDF membranes in desalination and comparison of the VMD and DCMD processes. Chem. Eng. Sci. 2012, 79, 94–102. [Google Scholar] [CrossRef]
  63. Simone, S.; Figoli, A.; Criscuoli, A.; Carnevale, M.C.; Rosselli, A.; Drioli, E. Preparation of hollow fiber membrane from PVDF/PVP blends and their application in VMD. J. Membr. Sci. 2010, 364, 219–232. [Google Scholar] [CrossRef]
  64. Pangarkar, B.L.; Sane, M.G.; Parjane, S.B.; Abhang, R.M.; Guddad, M. The heat and mass transfer phenomena in vacuum membrane distillation for desalination. Int. J. Chem. Biol. Eng. 2010, 3, 1. [Google Scholar]
  65. Sivakumar, M.; Ramezanianpour, M.; O’halloran, G. Mine Water Treatment Using a Vacuum Membrane Distillation System. APCBEE Procedia 2013, 5, 157–162. [Google Scholar] [CrossRef]
  66. Zhu, H.; Wang, H.; Wang, F.; Guo, Y.; Zhang, H.; Chen, J. Preparation and properties of PTFE hollow fiber membranes for desalination through vacuum membrane distillation. J. Membr. Sci. 2013, 446, 145–153. [Google Scholar] [CrossRef]
  67. Devi, S.; Ray, P.; Singh, K.; Singh, P.S. Preparation and characterization of highly micro-porous PVDF membranes for desali-nation of saline water through vacuum membrane distillation. Desalination 2014, 346, 9–18. [Google Scholar] [CrossRef]
  68. Abdallah, H.; Moustafa, A.F.; Al Anezi, A.A.; El-Sayed, H.E.M. Performance of a newly developed titanium oxide nano-tubes/polyether sulfone blend membrane for water desalination using vacuum membrane distillation. Desalination 2014, 346, 30–36. [Google Scholar] [CrossRef]
  69. Wang, X.; Zhang, L.; Yang, H.; Chen, H. Feasibility research of potable water production via solar-heated hollow fiber membrane distillation system. Desalination 2009, 247, 403–411. [Google Scholar] [CrossRef]
  70. Drioli, E.; Ali, A.; Simone, S.; Macedonio, F.; Al-Jlil, S.; Al Shabonah, F.; Al-Romaih, H.; Al-Harbi, O.; Figoli, A.; Criscuoli, A. Novel PVDF hollow fiber membranes for vacuum and direct contact membrane distillation applications. Sep. Purif. Technol. 2013, 115, 27–38. [Google Scholar] [CrossRef]
  71. Sirkar, K.; Qin, Y. Novel Membrane and Device for Direct Contact Membrane Distillation Based Desalination Process, Report; New Jersey Institute of Technology: Newark, NJ, USA, 2001. [Google Scholar]
  72. Wirth, D.; Cabassud, C. Water desalination using membrane distillation: Comparison between inside/out and outside/in per-meation. Desalination 2022, 147, 139–145. [Google Scholar] [CrossRef]
  73. Liu, D.; Wei, H.; Lu, X. Study on the Reverse Osmosis Rejected Water Treatment Process Based on Vacuum Membrane Distillation. J. Sustain. Dev. 2009, 1, 128–133. [Google Scholar] [CrossRef]
  74. Huang, Q.L.; Xiao, C.F.; Hu, X.Y.; Li, X.F. Study on the effects and properties of hydrophobic poly(tetrafluoroethylene) mem-brane. Desalination 2011, 277, 187–192. [Google Scholar] [CrossRef]
  75. Zhang, J.; Li, J.-D.; Duke, M.; Hoang, M.; Xie, Z.; Groth, A.; Tun, C.; Gray, S. Influence of module design and membrane com-pressibility on VMD performance. J. Membr. Sci. 2013, 442, 31–38. [Google Scholar] [CrossRef]
  76. Ji, Z.; Wang, J.; Hou, D.; Yin, Z.; Luan, Z. Effect of microwave irradiation on vacuum membrane distillation. J. Membr. Sci. 2013, 429, 473–479. [Google Scholar] [CrossRef]
  77. Zhang, J.; Li, J.-D.; Duke, M.; Hoang, M.; Xie, Z.; Groth, A.; Tun, C.; Gray, S. Modelling of vacuum membrane distillation. J. Membr. Sci. 2013, 434, 1–9. [Google Scholar] [CrossRef]
  78. Khayet, M.; Cojocaru, C. Air gap membrane distillation: Desalination, modeling and optimization. Desalination 2011, 287, 138–145. [Google Scholar] [CrossRef]
  79. Alsalhy, Q.F.; Ibrahim, S.S.; Khaleel, S.R. Performance of vacuum poly(propylene) membrane distillation (VMD) for saline water desalination. Chem. Eng. Process. Process. Intensif. 2017, 120, 68–80. [Google Scholar] [CrossRef]
Figure 1. A schematic of heat and mass transfer in VMD process.
Water 15 03612 g001
Figure 2. The procedure (algorithm) used to calculate permeate flux (single-stage VMD).
Water 15 03612 g002
Figure 3. Schematic representation of M-VMD configuration.
Water 15 03612 g003
Figure 4. The procedure (algorithm) used to calculate water recovery (multi-stage VMD).
Water 15 03612 g004
Figure 5. Comparison of experimental and simulated permeate flux for different feed flow rates (a) feed flux 30 kg/m2·h, (b) feed flux 50 kg/m2·h, (c) feed flux 70 kg/m2·h, and (d) feed flux 80 kg/m2·h.
Water 15 03612 g005
Figure 6. The impact of varying the feed temperature on the permeate flux under different vacuum pressures.
Water 15 03612 g006
Figure 7. Effect of vacuum pressure on the permeate flux at different feed temperatures.
Water 15 03612 g007
Figure 8. Influence of varying concentrations on the permeation flux under diverse flow velocities.
Water 15 03612 g008
Figure 9. Influence of varying the feed flow rate on the permeate flux under different feed temperatures.
Water 15 03612 g009
Figure 10. Effect of membrane thickness on permeation flux.
Water 15 03612 g010
Figure 11. Effect of membrane porosity on permeation flux.
Water 15 03612 g011
Figure 12. The impact of the feed temperature on temperature polarization.
Water 15 03612 g012
Figure 13. The influence of the feed concentration on concentration polarization.
Water 15 03612 g013
Figure 14. Effect of muti-staging in vacuum membrane distillation.
Water 15 03612 g014
Table 1. Properties of the membrane module [51].
Membrane TypePolypropylene (PP)
Thickness (μm)210
Porosity (%)60
Tortuosity (−)1.4
Average pore size (μm)0.3–0.7
Effective length of fiber (mm)100–250
Effective membrane area (mm2)28 × 102
Table 2. Desing and operating parameters for VMD simulation.
ParameterValue
Feed inlet temperature40–70 °C
Vacuum pressure on the permeate side1–8 kPa
Feed concentration0–100 g/L
Feed flow rate30–90 L/h
Number of VMD stages1–30
Table 3. Prediction accuracy of the proposed model.
Feed Temperature (°C)Permeate Flux (kg/m2·h)Mean Absolute Percentage Error (%)
Experimental FluxPresent ModelTang et al. [51]Present ModelTang et al. [51]
404.0484.1114.1123.766.57
456.2175.7645.550
508.4588.1007.492
5510.98810.61110.113
6013.87913.54313.651
6517.06017.90118.427
7026.09625.44924.874
Table 4. Operating conditions and permeate flux in several studies for VMD of various types of membranes.
Ref.Membrane TypeMembrane CharacteristicsOperating ConditionsJw (kg/m2·h)
δ (μm)L (mm)A (mm2)ε (%)r (μm)Cf (g/L)Tf (°C)Qf (L/min)Pv (kPa)
[63]PVDF0.17--80.620.1623.27500.53217.9
[64]PTFE-FS175-3.6 × 102700.2230600.9312
[65]PTFE-HF--0.8 × 10⁶-0.2065156
[66]PTFE-HF753904 × 10463.40.4630800.6117.2
[67]PVDF-FS----13075--12.1
[68]TNTs-PES-FS--17.34 × 10²--7650.663015.2
[69]PTFE-FS175-3.6 × 102700.227600.9161.528.34
[70]PVDF-HF0.23200-83.390.318DW500.1441.78
[71]PVDF-HF170--80.620.16DW500.51217.9
[72]PVDF-HF--8 × 10⁴-0.21525-10.54
[72]PE-HF--0.2 × 10⁶-0.11525-10.216
[73]PVDF-HF150902 × 104850.161 CaO75-5.317
[74]PVDF-FS121.4-23.5 × 10276.50.2GW600.5306.56
[75]PTFE-FS45.2--38.6-DW700.53329.45
[75]PVDF-FS0.082-26.4 × 102780.4935730.931.522.4
[76]PP-HF-250----700.8238
[77]PVDF-HF0.011200104790.25-680.145.322
[78]PP-HF0.7250-850.3-72-337
[79]PP-HF45018010.18 × 102700.235650.612.765.8
Present
study
PP-HF21025028 × 102600.335650.833318.42
Note: HF: hollow fiber; FS: flat sheet; PES: polyethersulfone; TNTs: titanium oxide nanotubes; DW: distilled water; and GW: geothermal water.
Disclaimer/Publisher’s Note: The statements, opinions and data contained in all publications are solely those of the individual author(s) and contributor(s) and not of MDPI and/or the editor(s). MDPI and/or the editor(s) disclaim responsibility for any injury to people or property resulting from any ideas, methods, instructions or products referred to in the content.

