Article

Identification of the Sediment Movement Mechanism via Grain Size and Shape: A Case Study of a Beach in Eastern Hainan Island in South China

1
State Key Laboratory of Estuarine and Coastal Research, East China Normal University, Shanghai 200241, China
2
Zhejiang Huadong Mapping and Engineering Safety Technology Co., Ltd., Hangzhou 310012, China
3
College of Harbour and Coastal Engineering, Jimei University, Xiamen 361021, China
4
Second Institute of Oceanography, Ministry of Natural Resources, Hangzhou 310012, China
*
Author to whom correspondence should be addressed.
Water 2023, 15(20), 3637; https://doi.org/10.3390/w15203637
Submission received: 25 September 2023 / Revised: 14 October 2023 / Accepted: 16 October 2023 / Published: 17 October 2023

Abstract

:
This paper used dynamic image analysis (DIA) to analyze the grain size and shape data of beach surface sediments in Bao’ding Bay, eastern Hainan Island, China, and explored the effects of sediment transport modes and beach morphology on the grain size–shape trend curves. This paper adopted a method of combining grain size cumulative frequency curves and grain size–shape trend curves to identify three sediment transport modes: suspension, saltation, and traction, and analyzed the characteristics of the grain size–shape trend curves under different beach morphologies (reflective, intermediate, and dissipative). This paper found that the grain size–shape trend curves can effectively indicate the sediment transport modes and improve the accuracy of subpopulation division; the grain size–shape trend curves showed different distribution characteristics in the cross-shore and longshore directions, which are closely related to the beach’s morphology and sediment transport direction. This paper provides a new method and idea for studying beach sediment transport and sedimentary environment using sediment grain size and shape data.

1. Introduction

As the fundamental properties of sediments, grain size and shape provide information about their transport history, mode, and sedimentary environment [1,2,3,4,5,6,7]. Grain size has been extensively utilized to characterize sedimentary environments, depositional processes, and transport mechanisms [8,9,10,11,12,13]. Specifically, grain size is intimately associated with hydrodynamic conditions [14,15,16]. The sediment transport and deposition process can be examined by plotting the grain size frequency curve and grain size parameters [8,17,18]. Visher [14] was the first to demonstrate that distinct sediment transport or deposition patterns are uniquely reflected in log probability curves of grain size distributions. Sediment grain movement can be divided into three subpopulations due to different transport modes (suspension, saltation, and traction). On the logarithmic probability cumulative distribution curve of grain size, each subpopulation will form a single straight line. The slope of each line varies, indicating different sorting degrees, and the points where the lines intersect are called truncation points. Since then, plotting the log probability cumulative frequency curve of grain size has been frequently employed to evaluate sedimentary environments [19,20,21,22].
However, identifying sub-populations manually from the log probability cumulative frequency curve of grain size may produce ambiguity results. The grain size range associated with the transformation of sediment transport modes depends on the highly variable hydrodynamic conditions. Therefore, solely relying on grain size distribution may not be sufficient to distinguish between different transport modes [14]. Grain size is not the only factor that influences the sediment transport and deposition. Grain shape is another important parameter that affects the sedimentation, abrasion, and movement of sediments in fluid [23,24,25,26]. Several studies have focused on the significance of grain shape in the aeolian transport processes [6,27,28], and have shown that grain shape can be used to identify transport mechanisms and processes in aeolian sediments [6,28]. However, the role of grain shape in beach sediment dynamics has received little attention. Therefore, it is necessary to investigate the relationship between grain shape and transport modes in addition to grain size. In sedimentary dynamics, the impact of hydrodynamics, such as waves and tidal currents on the grain size of surficial sediments on beaches, has been extensively studied [29,30,31]. Hydrodynamic conditions, sedimentary environments, and sediment characteristics are all related to beach states (dissipative, intermediate, and reflective) [32,33,34]. There are obvious differences in the transport and sorting processes of surface sediments under different beach morphologies. Different transport modes can be distinguished through the shape of their grain size cumulative curves. The difference in curve shape and the location of truncation points can distinguish sediments in different environments. Combining the texture of sediment grains has yielded positive results in some studies [35,36,37]. Moreover, the measurement of sediment grain shape has been challenging due to the lack of standardized methods and instruments. With the development of computer image analysis technology in recent years, dynamic image analysis (DIA) has made measuring sediment grain morphology more accurate and efficient. It has been successfully applied in identifying sedimentary environments, sorting grain size, and transportation modes of sediments [6,8]. However, the sorting and abrasion processes of sediment grain shape and the relationship between grain size and shape under different hydrodynamic conditions have not been studied.
This paper employed dynamic image analysis to analyze the grain size and shape of surface sediment samples from the headland bay coast of Bao’ding Bay, eastern Hainan Island (China). Our purposes were as follows: (1) to analyze the indication of the grain size–shape trend curve to sediment motion modes; (2) to determine the particle abrasion and sorting processes of surface sediments from different beach morphologies; (3) to analyze the distribution characteristics of the grain size–shape curves of surface sediments from different beach morphologies; and (4) to analyze the indication of sediment grain shape to sediment transport direction. This study can offer new insights and implications for the study of beach sediment transport mechanisms and has potential applications for coastal management and engineering.

2. Materials and Methods
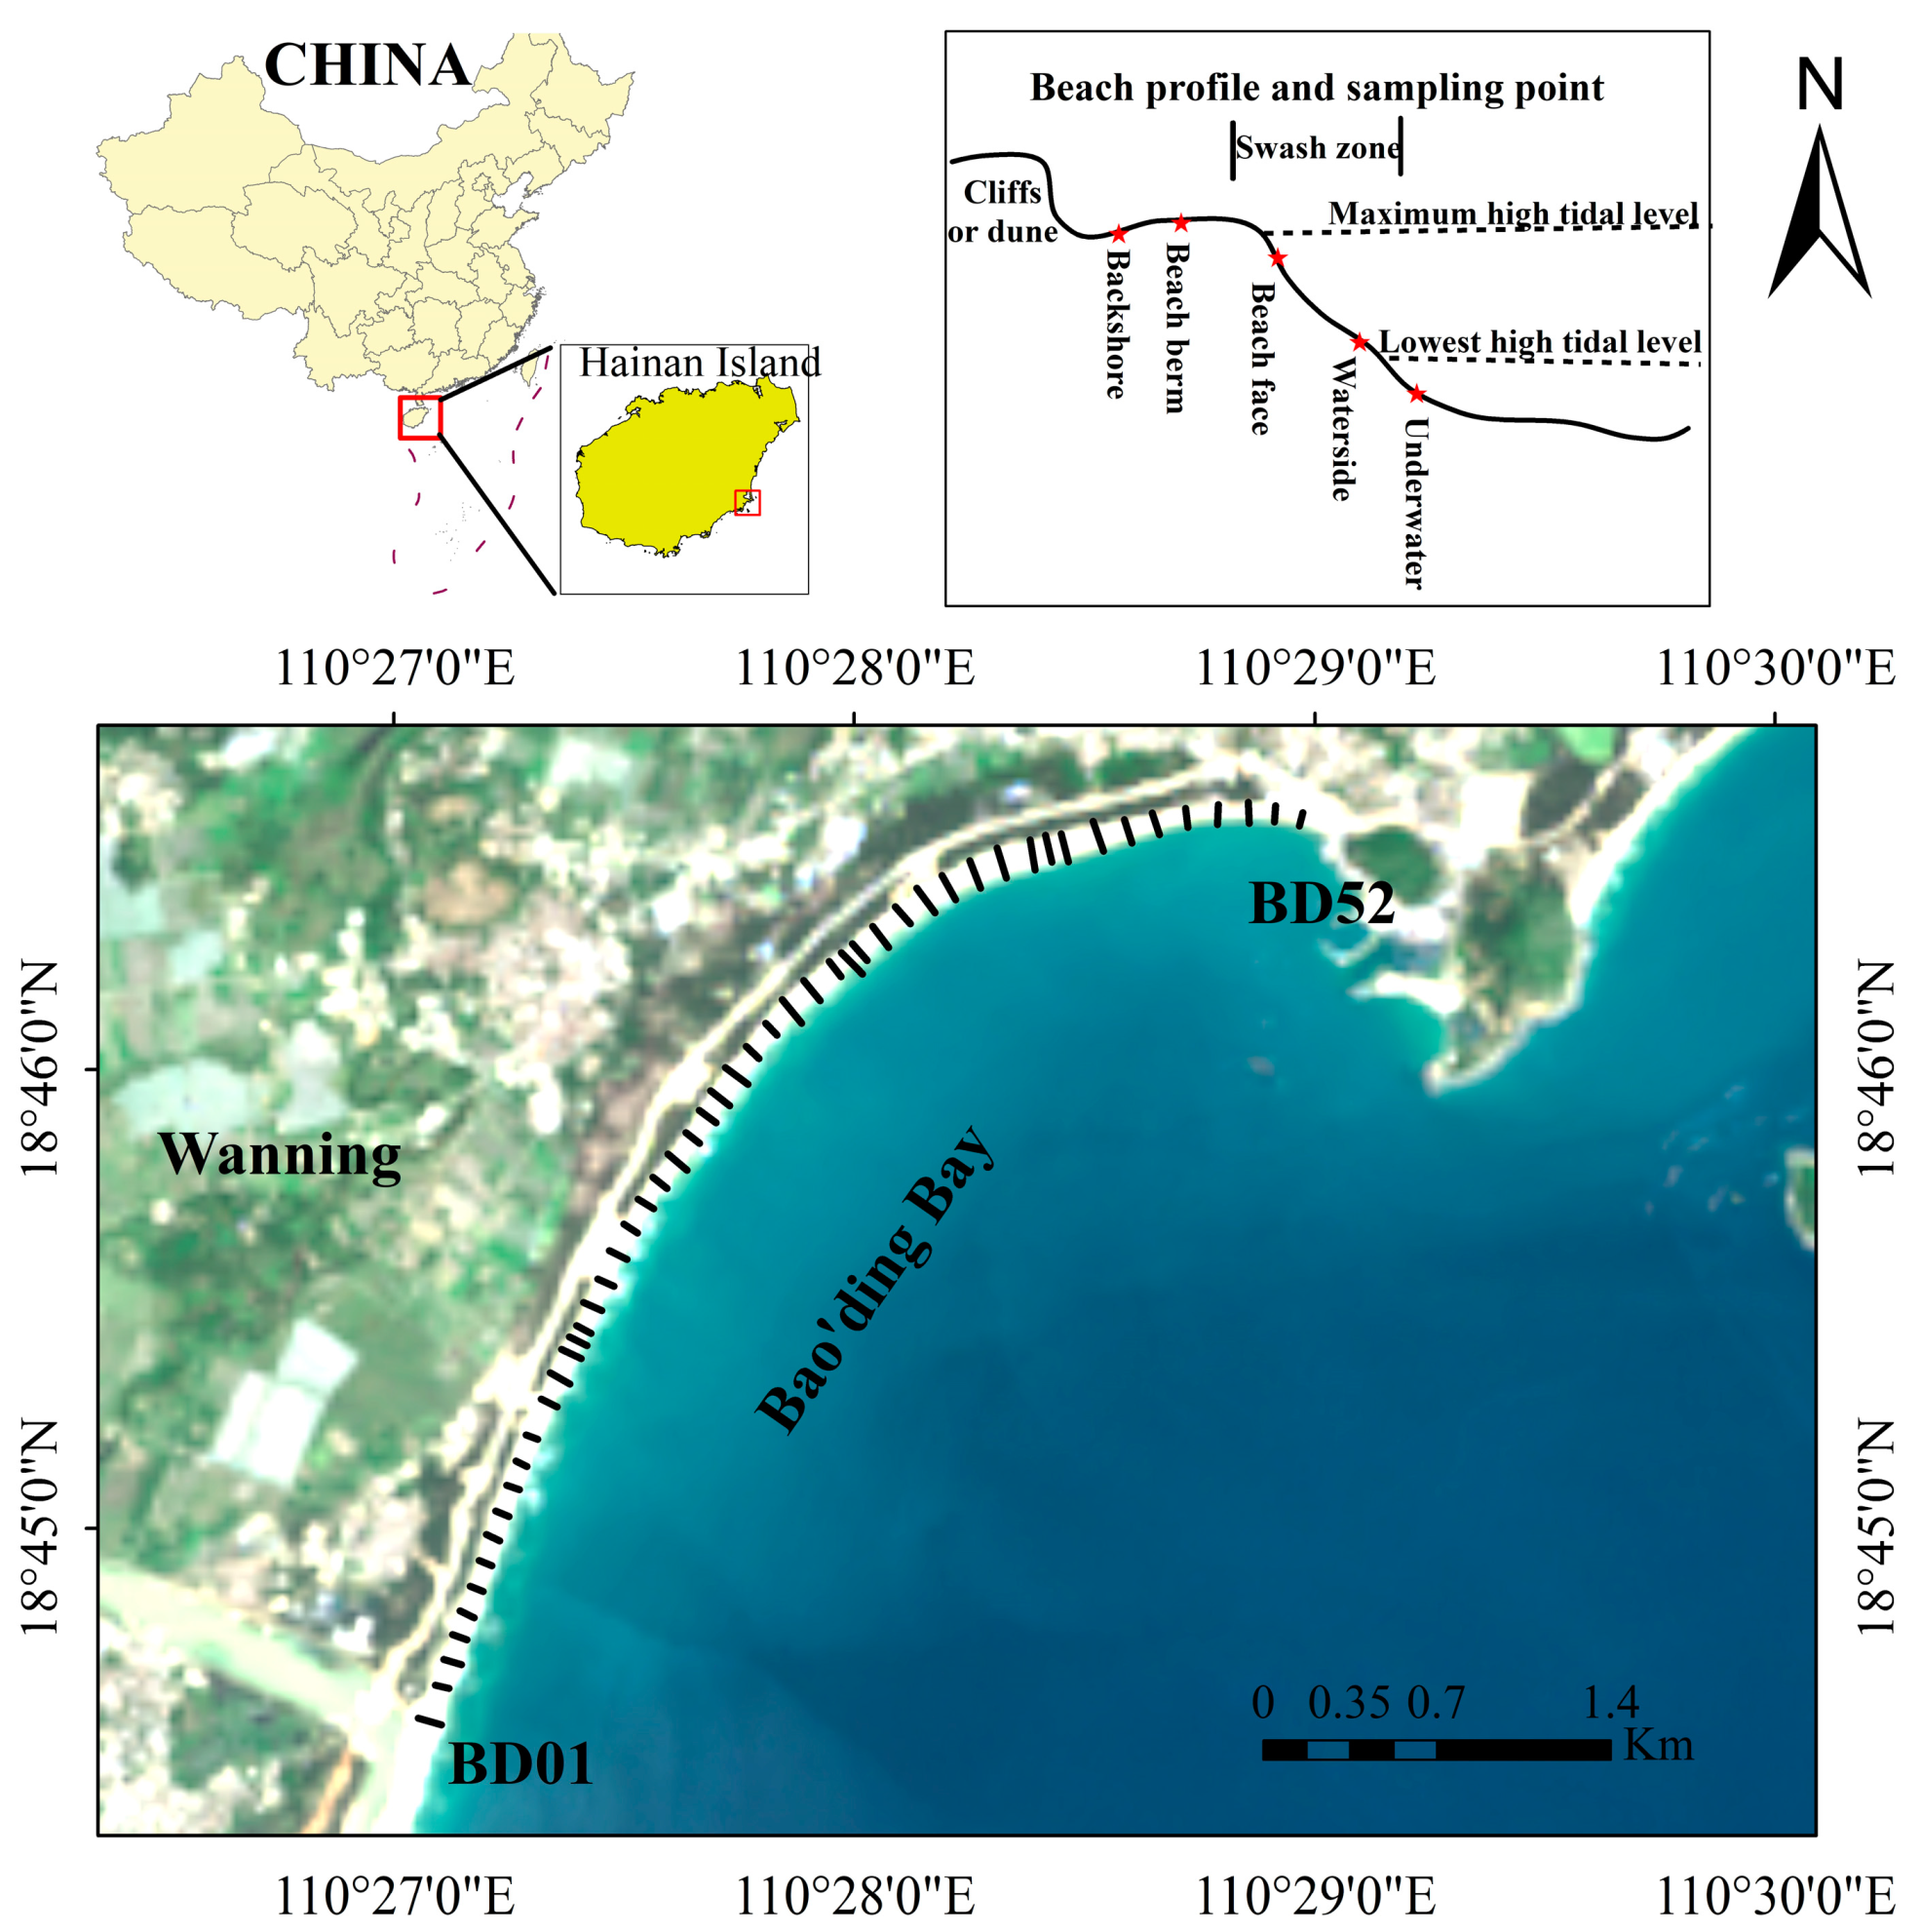
2.1. Study Area

Bao’ding Bay (Figure 1), located in the east of Hainan Island in the South China Sea, is situated between 110.42°–110.45° E and 18.67°–18.73° N. Bao’ding Bay beach is a typical headland-bay beach with a promontory. Its straight section (exposed section) is fully developed. Under the cover of the headland at the northern end, the curved section (sheltered section) is also fully developed, and the headland-bay beach is in a dynamic equilibrium [38]. The beach morphology transitions from a dissipative state to a reflective state from north to south [39]. The study area is a wave-dominated microtide coast, with a mean tidal range of 0.92 m per year [40]. The waves are mainly composed of wind waves and swell waves, which account for 78% of the annual occurrence. The average wave height is 0.9 m, and the maximum is 5.2 m.

2.2. Sediment Sampling and Beach Morphology

Along Bao’ding Bay from south to north, we set up 52 beach sediment sampling transects. A beach topographic survey and surface sediment sampling were conducted on 8 December 2018, from 09:00 to 13:30. The average seawater temperature was 18 °C during the sampling period. The RTK-GPS (Real-Time Kinematic Global Positioning System) was used for beach topography measurements. These transects were accordingly labeled BD01 to BD52 from south to north (Figure 1). The beach width is the perpendicular distance between the backshore vegetation line and the 0 m contour line. Generally, five samples were collected from each transect, and the sampling locations were at the backshore, beach berm, beach face, waterside, and underwater. Due to the complex underwater terrain and the high tide level during sampling, samples were selectively taken at the waterside and underwater locations. A total of 252 sediment samples were sealed in plastic bags. In the laboratory, we removed the organics and carbonates from the samples by adding 5 mL of 30% H2O2 and 5 mL of 0.5 mol/L HCL (10 mL if shell fragments were abundant). We then soaked the samples in pure water for 12 h and drained the supernatant. We dried the samples in an oven at 105 °C for 24 h. Finally, we used dynamic image technology to analyze the samples.
Dissipative, intermediate, and reflective beaches can be distinguished according to their non-dimensional sediment settling velocity ( Ω = H b / ( ω s T ) ) if their morphology is in equilibrium with hydrodynamic forcing [41]. Cheng [39] derived the relationship between the non-dimensional settling velocity parameter Ω (Equation (1)) and the beach slope and the sediment median grain size according to the beach slope formula based on dimensional analysis [42] and the sediment settling velocity formula of the transition zone [43]. It has been used in classifying beach morphology in several studies [39,44]:
Ω = 0.09 D m 2 6.77 D + 0.02 T 0.52
where D is the median grain size (mm), m is the beach slope, and T is degree Celsius. Temperature (T) is a parameter that affects the fluid kinematic viscosity coefficient and, thus, the sedimentation velocity of the sediment. Depending on the value of Ω, the beach can be dissipative (Ω > 6), reflective (Ω < 1.5), or intermediate (1.5 < Ω < 6). [45].

2.3. Dynamic Image Analysis (DIA)

Camsizer-X2 (Microtrac Retsch GmbH, Düsseldorf Hahn, Germany) is a dynamic image analyzer that records the size and shape of grains using two linked cameras (a basic camera and a zoom camera) with a resolution of 0.8 μm, covering a measuring range from 8 μm to 8 mm. This instrument uses dual digital cameras (CCD) imaging technology, including a basic camera (CAM-B) to record the size and morphology information of the larger grains, and a zoom camera (CAM-Z) to record the fine ones [46]. These two cameras can either work together or separately to produce consistent data results for a wide range of grain sizes. The main calculation results include the maximum chord, XC, perpendicular to the measurement direction, the area equivalent circle diameter of the particle projection (Xarea), the distance between two tangents perpendicular to the measurement direction (Feret diameter XFe, with the maximum value as XFemax), and the diameter length through the center of the area in the measurement direction (Martin diameter XMa) (Figure 2). The smallest value of all maximum chords of the grain projection is XCmin, which is close to the sieve results [47].
Sediment grain shape parameters include sphericity, aspect ratio, symmetry, and roundness. Sphericity is a typical shape characteristic that measures how spherical the grains are. The area and the circumference of each grain were calculated. The sphericity is given by the following formula (Equation (2)), where A is the area of a grain projection, and U is the circumference of a grain projection:
S p h e r i c i t y = 4 π A U 2
The values of sphericity range from 0 (extremely narrow rod) to nearly 1 (a perfect circle). This formula is also known as roundness [48,49] or high sensitivity circularity (HSC) [7,50], and it is widely used in grain morphology studies. It is also a common parameter that is used for describing the morphologies of sand and gravel in sedimentology [26,51,52]. Therefore, we used XCmin and sphericity to describe the grain size and shape in this study, respectively.

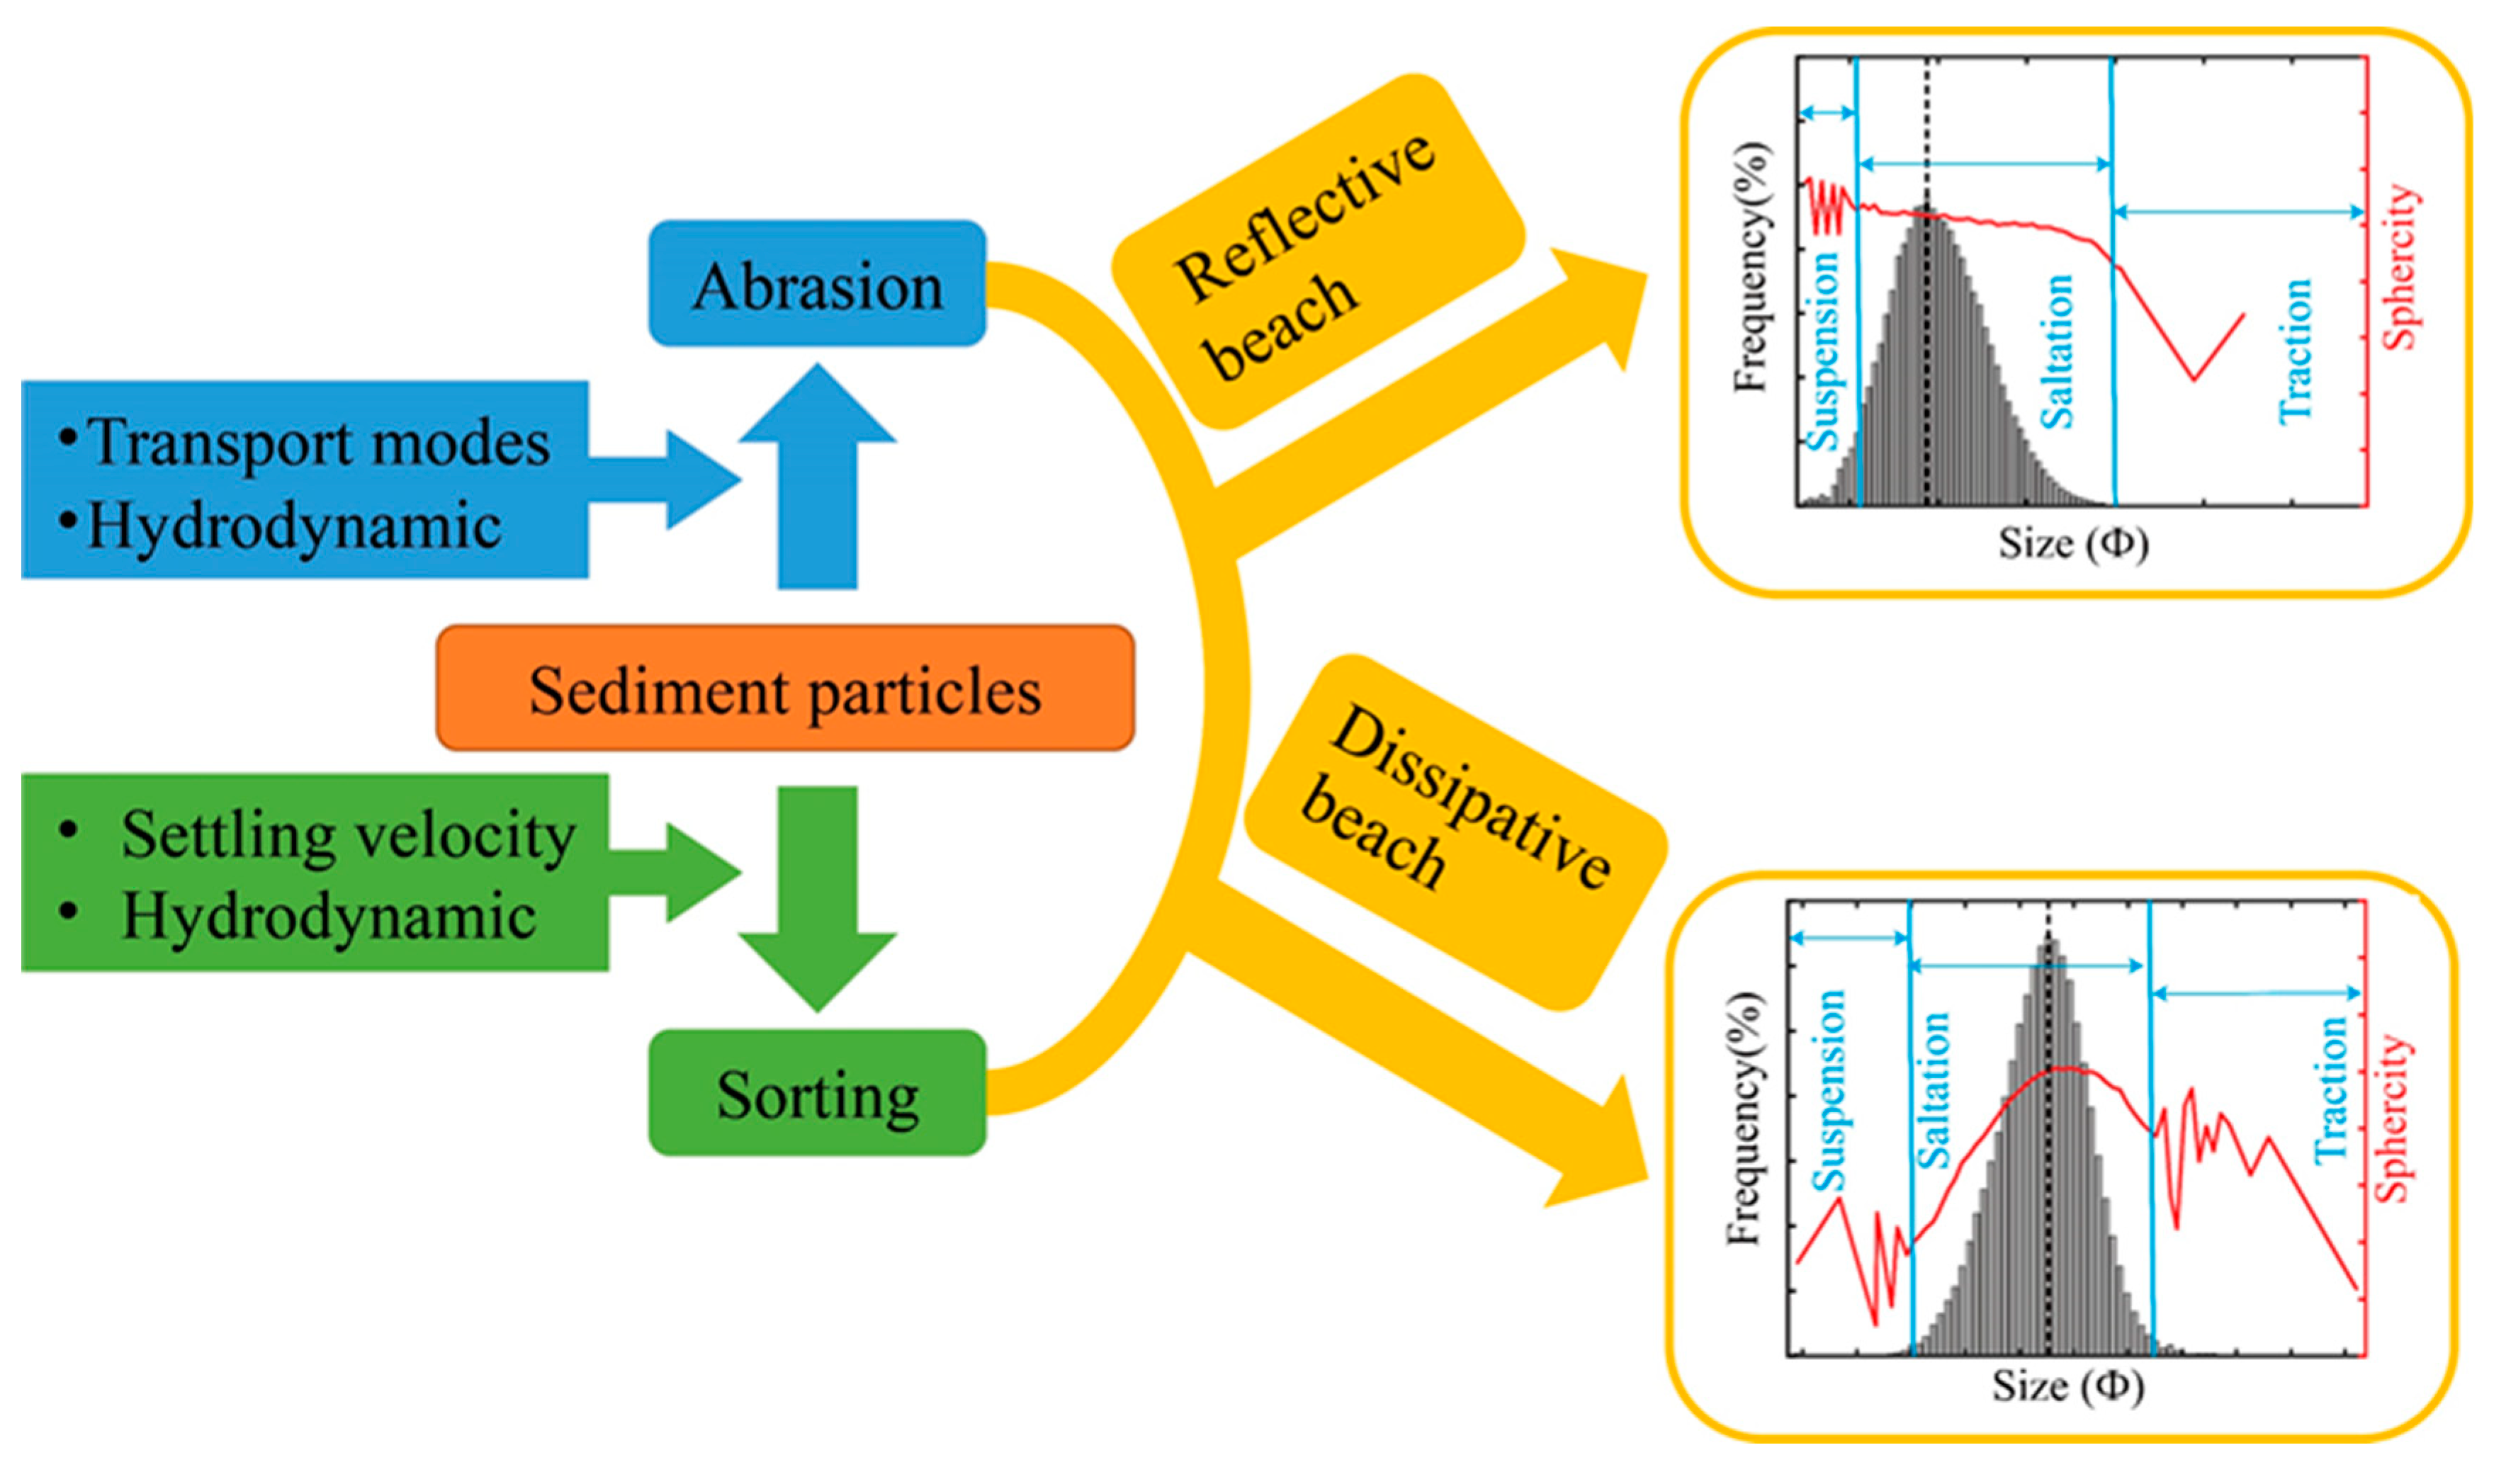
2.4. The Grain Size Cumulative Frequency Curve and the Grain Size–Shape Curve Trend

Visher [14] analyzed the deposition process and environment using the shape of the grain size cumulative frequency curve. This method is based on different log-normal sub-populations corresponding to different sediment transport modes (suspension, saltation, and traction) (Figure 3). Generally, sediment grain size distribution does not conform to a simple normal distribution but consists of several log-normal sub-populations. Each subpopulation has a different mean and standard deviation. Sediments can be divided into the three sub-populations of traction, saltation, and suspension due to their different transport forms. The grain size distribution of each transport mode is a log-normal distribution that differs from other transport modes with its own average grain size and sorting degrees. Therefore, in the probability coordinate system, each sub-population will form a separate line, with different slopes indicating different sorting degrees. The abrasion strength and mechanism of grains with different sizes and transport modes are also produced differently via the varying collision energies between grains [25,26]. At the same time, different transport distances and times lead to different sorting and abrasion processes of sediments during their transport and sediment processes [53,54]. Therefore, the grain size–shape curve trend characteristics provide information on sediment grain sorting and the abrasion process. This study compared the grain size cumulative frequency distribution curves with the grain size–shape trend curves to better understand the deposition process and sediment environments, provide a foundation for the truncation points, and improve accuracy.

3. Results

3.1. Distributions of Grain Size and Grain Shape

The median grain size and shape of sediments distribute along the Bao’ding Bay beach from south to north, as shown in Figure 4. The median grain size (Φ value) increased from south to north, with significant changes in grain size in transect 20. There was little change in grain size in transects 1–20, and a gradual increase in transects 21–52. The sediment grain size at the waterside was smaller than that at the other four characteristic sampling sites, and its longshore distribution fluctuated significantly. The median size ranged from −1.36Φ to 2.66Φ, with a mean value of 1.42Φ. The median sphericity decreased from south to north, with the sediments’ grain sphericity at the backshore and beach berm being larger than at the other three sampling sites, and this difference was larger in transects 24–52. The median sphericity ranged from 0.794 to 0.858, with a mean value of 0.830.
The beach profile was plotted using measured topographic data, as shown in Figure 5. The beach slope of each profile was calculated, and the non-dimensional settling velocity parameter Ω was obtained using Equation (1) (Figure 6). Three types of morphodynamic states were identified along the beach based on the dimensionless parameter Ω. The beach state transitioned from reflective (1–23) to intermediate (24–37) to dissipative (38–52). The reflective beach’s (1–23) slope ranged from 7.2° to 10.9°, with a mean value of 8.4°, and its width ranged from 38.6 m to 75.7 m, with a mean value of 57.1 m. The intermediate beach’s (24–37) slope ranged from 3.5° to 7.0°, with a mean value of 4.7°, and its width ranged from 64.9 m to 121.4 m, with a mean value of 92.6 m. The dissipative beach’s (38–52) slope ranged from 2.4° to 3.8°, with a mean value of 3.2°, and its width ranged from 54.3 m to 128.7 m, with a mean value of 102.5 m.

3.2. Cumulative Frequency Curves and Grain Size–Shape Trend Curves

Figure 7 illustrates the relationship between the sediment grain size–shape trend curves and the log-normal sub-population identified via the grain size cumulative frequency curves. Due to the large number of sediment samples in this study, sediment samples with transects numbered 09, 40, and 50 (reflective, intermediate, and dissipative beaches, respectively) were selected for display here. The cumulative frequency curve of beach sediments can be divided into a range from three to five sub-populations; suspension populations are on the right, traction populations are on the left, and saltation populations are in the middle between them. The suspension and traction population proportions were far less than that of the saltation populations, which accounted for more than 90%. Overall, the grain size–shape trend curves match well with the suspension, saltation, and traction populations. The grain size–shape trend curves corresponding to the suspension and the traction population greatly fluctuated, while those corresponding to the saltation populations were smooth.
For the reflective beach sediments, the suspended population corresponded to smaller sphericity values, while the saltation population displayed an inverse relationship between grain size (Φ value) and sphericity; that is, larger grain sizes corresponded to larger sphericity values (Figure 7a). For the dissipative beach sediments, the sphericity values for the saltation populations first increased and then decreased with grain size (Figure 7c). For the intermediate beach sediments, the grain size–shape trend curve for the saltation populations exhibited two characteristics of both dissipative and reflective beaches; larger particles illustrated reflective beach characteristics, while smaller particles displayed dissipative beach characteristics (Figure 7b).

3.3. Grain Size Frequency Curves and Grain Size–Shape Trend Curves

The highest point of the grain size frequency curves (the maximum content of grain size components) fitted well with the characteristic point of the grain size–shape trend curves, and this correspondence was related to the beach’s morphology (Figure 8). For reflective beaches, the maximum content of grain size components roughly coincided with the mutation point of the grain size–shape trend curve. The size frequency curve can be divided into two sections (I and II) using the highest point. (Figure 8a). In section I, the grain sphericity negligibly changed with increasing grain size until it fluctuated in the traction population. In section II, the smaller grain sizes corresponded to smaller sphericity values until the grain sphericity fluctuated in the suspension population. For the dissipative beaches, the maximum component of sediment size almost completely coincided with the maximum point (maximum grain sphericity value) of the saltation population corresponding to the grain size–shape trend curve, which can be significantly divided into two segments on the left and right sides of the maximum point (I and II) (Figure 8c). In section I, the smaller grain sizes corresponded to larger sphericity values, while in section II it was the opposite. Intermediate beach sediments are complex and exhibit characteristics of both dissipative and reflective parts (Figure 8b).
Moreover, there was a good correspondence between the maximum value of the bimodal sediment grain size frequency curve and the grain size–shape trend curve. The larger grain size (Φ value) on the left side exhibited characteristics similar to those of reflective beach sediments, while the smaller grain size (Φ value) on the right side exhibited characteristics similar to those of dissipative beach sediments.

4. Discussion

4.1. The Indication and Sorting Processes of Sediment Grain Size and Shape

The trend curves of grain size–shape very effectively indicate the different sediment motion modes of sediment grains, mainly because the abrasion of sediment grains exhibits different characteristics under different transport modes and environmental dynamics. The abrasion of grains begins with grain movement. When the grain resistance is less than the instantaneous force of the fluid, abrasion occurs [55]. Abrasion results in an increased grain sphericity and decreased grain sizes, with different abrasion rates for coarse and fine grains [56,57]. Traction grains are mainly large in size, requiring greater power to roll fully, and are often surrounded and covered by other smaller grains, resulting in insufficient abrasion. Grain shape is greatly affected by its initial shape. Grains transported in suspension are small, and the collision energy between grains suspended in water is very low. Due to fluid viscosity, the momentum of the grains dissipates, and no collision abrasion occurs [58]. Therefore, the shape of suspended grains is greatly affected by their initial shape when broken from the parent rock, resulting in a size–shape curve displaying a strong level of fluctuation. Saltation grains have large dynamic energies and a greater number of inter-grains and grain–bed collisions, resulting in more sufficient abrasion. In the same dynamic environment, grain shape is related to grain size. Therefore, the grain size–shape curve for saltation populations is smooth. Saltation is often divided into more than one section due to the different sedimentary dynamic environments and sources. It is difficult and fuzzy to distinguish only by grain size distribution; however, this problem can be well solved by combining the grain size–shape trend curve (Figure 7). In addition to the grain size distribution, determining the transport mode by combining the grain size–shape trend curve is a promising method that is less fuzzy, and has been successfully applied in this paper.
Sediment sorting encompasses both grain size and grain shape, with the components of appropriate size and large grain shape value often being preferentially selected and deposited during transportation. The grain size and shape of preferentially sorted particles exhibit distinct properties in various beach morphodynamic states. During their transportation, grains settle and accumulate at different grain sizes under different hydrodynamic conditions. Settling velocity is the dominant sorting parameter [59]. Settling velocity is higher for more spherical and regular grains [27,60]. The irregular grains have low setting velocities, and their falling path tends to deviate from the vertical descent to a spiral, inclined, circular, or another undefined path [60,61]. The sediment grain size component has the highest content, and the sphericity value of the grains in this component is also relatively high (Figure 8). For the reflective beaches, there is a large hydrodynamic force that allows for the sediment suspension and saltation population grains to move sufficiently. Gradually increasing the grain size and sphericity increases the settling velocity and facilitates deposition. However, for sediment particles in the saltation populations with too large a grain size (section I, Figure 8a), their grain sphericity is also large. They have higher settling velocities, resulting in a short transport distance that prevents them from reaching the beach.
For the dissipative beaches, the water flow prevents the suspended grains from settling, and their energies are insufficient for the traction particles to reach the beach, resulting in less deposition of both the suspended and traction grains. For the saltation particles (section I and II), the smaller ones in section II can be easily moved with the flow (Figure 8c). As the grain size and sphericity increase, the settling velocity increases, and the sediments are more easily deposited. Conversely, with the increase in grain size and decrease in grain sphericity, the grains in section I (Figure 8c) become increasingly difficult to initiate. Even after they have been initiated, their settling velocity is relatively larger, and their transport distance is very short, preventing further deposits. Therefore, the sediment sorting process can be determined using the combined grain size, shape, and hydrodynamics.
Sediment grains are abraded and sorted during transport. The abrasion process determines the relationship between grain size and shape, while the sorting process determines the relationship between grain morphology (size and shape) and size components. Sediment grain abrasion and sorting characteristics differ significantly under different hydrodynamic conditions (Figure 9). The abrasion of sediment particles is a long timescale process, while sediments are continuously being sorted. The interaction between abrasion and sorting results in grain size–shape trend curve and size–frequency curve relationships related to hydrodynamic conditions, depositional environments, and transport modes.

4.2. Response of the Grain Size–Shape Trend Curve of Beach Surface Sediments to Beach Morphology

The trend curves of sediment grain size–shape in Bao’ding Bay were different in different beach morphologies and different locations within the same beach transect, especially in the saltation section. Spherical grains bounce higher and farther; thus, they move faster than non-spherical particles. Sediment grains’ roundness increases from the foreshore to backshore dunes due to sorting and abrasion during their transport [54]. In the cross-shore direction of the reflective beaches, the grain size–shape trend curve for the saltation populations displayed a decreasing grain sphericity from the backshore to underwater under the same grain size, with notably smaller sediment grain shape values at the waterside and underwater (Figure 10). In the saltation populations at and above the beach face, grain sphericity was more regular with minor differences. The maximum sphericity of the grain size–shape trend curve generally appeared at the backshore. Differences in the grain size–shape trend curves for the dissipative beach sediments were mostly observed in larger particles, with minimal variation in smaller particles. For the intermediate beaches, the grain size–shape trend curves for the saltation populations exhibited characteristics of both dissipative and reflective beaches. The larger grains showed reflective beach characteristics but were more pronounced than the grain size–shape trend curve for reflective beach sediments, while smaller particles showed dissipative beach sediments characteristics. Cross-shore slope gradients are the main driver of beach morphology change. Therefore, dissipative, reflective, and intermediate beaches mainly differ in terms of cross-shore transport, as different beach profile shapes and consequent wave transformation patterns result in different spatial sediment transport patterns [62]. The swash zone is quite narrow for reflective beaches, which have a steeper slope. Near the water’s edge, waves break and force a large amount of sediment up. During wave breaking and scouring of the beach, the grain size and shape of the sediments are continuously sorted. For the same grain size, grains with a larger grain sphericity have a longer transport distance, and sediment grain sphericity at the waterside and underwater are distinct from that on land beach (Figure 10). There is an increase in sediment grain sphericity from the underwater to the backshore. The swash zone is wide for dissipative beaches, and cross-shore radiation stresses and wave set-up gradients tend to be smaller [62]. Therefore, grain sphericity is more obvious in distinguishing large grains, with a larger grain sphericity at positions closer to the land. Intermediate beaches have varying degrees of coastal inhomogeneity in hydrodynamic processes and morphology, with intermediate beach states usually having large cross-shore transport gradients. This is also why the cross-shore grain size–shape trend curves for intermediate beaches are quite different across the shore and exhibit variable characteristics alongshore.
In the longshore direction of Bao’ding Bay beach, trend curves of sediment grain size–shape are shown in Figure 11. These grain size–shape trend curves highlighted the appearance of an inflection point near the grain size of 2.5 Φ. When the grain size (Φ value) was smaller than 2.5 Φ, the grain sphericity of the reflective beaches was larger than that of the dissipative beaches, with little difference in grain sizes (Φ values) greater than 2.5 Φ, being small. By analyzing the trend curve of grain size–shape in an exposed section and a sheltered section, significant disparities between them were discovered, particularly for coarser particles (wit a size greater than 2.5 Φ). This shows that there is little material exchange between the exposed and sheltered parts of the beach.
In headland-bay beach environments, a longshore wave energy gradient is generally observed, and the wave energy increases from the sheltered to exposed parts of the beach [63]. As a result of this longshore change in wave energy, it is also common to observe gradient types of morphodynamic beaches. This usually leads to the formation of dissipative beaches in the sheltered part of the beach and reflective beaches in the exposed parts [39,45]. The reflective beaches are located in an exposed part of the headland-bay beach with large hydrodynamic conditions [38]. Sediment grains in the saltation population can move sufficiently. These larger grains have a greater momentum and a sufficient level of abrasion, leading to a larger grain sphericity as the grain size increases. Dissipative beaches with weak hydrodynamic conditions are located in the sheltered part of the headland-bay beach and are sheltered by the headland [38,64]. For sediment grains in the saltation populations, extremely large grains move at slower speeds and travel shorter distances, resulting in insufficient abrasion. Due to fluid viscosity, the momentum dissipates for very small grains. As a result, there is a range in grain size where the grains fully collide and abrade, resulting in a larger grain sphericity. Thus, within a certain range grain size, a sphericity that is the largest, larger, or smaller than this range results in a smaller grain sphericity.
In the exposed section, the coastline is perpendicular to the direction of the predominant wave. In the sheltered section, the waves refract and diffract due to protection from the headland, making it difficult to exchange material between the exposed section and the sheltered section of the beach. As the intermediate section connects the exposed and sheltered sections together, there is often sediment transport and exchange with both ends, leading to the grain size–shape trend curves of the intermediate beaches that include the characteristics of the grain size–shape curves for sediments in both the exposed and sheltered sections.

4.3. Indication of Grain Shape to Sediment Transport Direction

The distribution characteristics of grain morphology have a notably indicative effect on sediment transport trends. Gao and Collins [65,66] and Gao [67] proposed a two-dimensional method to determine net sediment transport patterns based on three grain-size parameters (mean size, sorting, and skewness), This method is called the grain size trend analysis (GSTA). The GSTA results showed some distinct characteristics in the Bao’ding Bay beach (Figure 12). The arrows indicate the direction of sediment transport. The lengths of each arrow represent the significance of transport trends [66]. It is apparent from Figure 12 that the sediment transport direction is mainly towards land, with the exception of the northern part of the exposed section, where the transportation direction is alongshore. Past research results have shown that the grain sphericity tends to increase with the same grain size from sea to land [53,68,69]. Each part of the beach (exposed section, transition section, and sheltered section) presents different characteristics along the coast. However, there is not much difference within one part of the beach. Comparative GSTA results have shown that the direction of sediment transport trend is almost the same as that of a larger grain sphericity increase. However, it is worth noting that the GSTA results in the northern part of the exposed section show that the sediments tend to be transported along the coast, which is different from the direction of grain sphericity increase and is mainly related to the complex dynamic conditions in the swash zone. The swash zone is an important beach area where sediment transport is a significant part. Sediment transport in this swash zone is affected by beach face morphology, waves, and beach groundwater [70,71,72]. In the exposed section of the beach, with large slopes and violent wave scouring, the sorting and deposition of sediment grain size are dynamic and changeable. Bao’ding Bay is a dynamic equilibrium headland bay coast and an independent geomorphological unit [38]. On long time scales, littoral drift is almost non-existent. Therefore, these GSTA results mostly depict the instantaneous transport trend of sediments. The grain shape changes are mainly caused by long-term sorting and abrasion, while the distribution trend for grain sphericity indicates the long-term transport trend of sediments.

5. Conclusions

This study employed the DIA method to obtain sediment grain size and shape parameters. Through an analysis involving grain size–shape trend curves and size probability accumulation curves in Bao’ding Bay beach sediments, this study revealed insights into the characteristics of grain size and shape across different beach morphology types.
The grain size–shape trend curves can effectively indicate the different sediment motion modes (suspension, saltation, and traction) and improve the accuracy of traditional classification solely based on grain size probability cumulative frequency curves. The grain size–shape trend curves of sediments moved in suspension and traction fluctuated greatly, while the saltation population’s grain size–shape trend curves were smooth. This method can help identify the transport conditions and depositional environments of sediments more precisely. This study also found that the abrasion and sorting processes of sediment grains vary across different beach morphodynamic states (reflective, intermediate, and dissipative) and hydrodynamic conditions. The cross-shore distribution characteristics of grain size–shape trend curves reflect the sediment transport direction across the shore. The longshore distribution characteristics of grain size–shape trend curves showed that there is little material exchange between the exposed and sheltered parts of the headland-bay beach. The intermediate beaches encompass characteristics of both reflective and dissipative beaches, indicating that they are the active area of material exchange. The GSTA results showed that the sediment transport direction is mainly towards land, with the exception of the northern part of the exposed section, where it is alongshore. The GSTA results mostly depict the instantaneous transport trend of sediments, while the distribution trend for grain sphericity indicates the long-term transport trend of sediments. This shows that grain shape can provide complementary information to grain size in studying sediment transport patterns. This paper also contributed to the understanding of the coastal processes and dynamics in headland-bay beaches, and has implications for coastal management, erosion control, and coastal engineering. In this study, DIA was unable to measure the true three-dimensional shapes of sediments, only their two-dimensional projections. Future studies are recommended to employ more advanced techniques to measure the three-dimensional shapes of sediments and compare them with DIA results. Future studies should also use more complex models to account for the temporal and spatial variations in sediment transport, and study other types of beaches and coasts.

Author Contributions

Conceptualization, W.C., S.C. and J.Z.; methodology, W.C. and X.Z.; formal analysis, W.C., J.G. and J.Z.; investigation, W.C., S.C., X.Z., J.H. and J.G.; resources, W.C., S.C. and J.H.; data curation, X.Z. and J.G.; writing—original draft preparation, W.C., S.C. and X.Z.; writing—review and editing, J.Z. and J.G.; visualization, W.C.; project administration, W.C.; funding acquisition, S.C. and X.Z. All authors have read and agreed to the published version of the manuscript.

Funding

This research was funded by the National Natural Science Foundation of China, (41906184), the Nation Natural Science Foundation of Fujian Province (2022J05156), and the Public Science and Technology Research Funds Projects of Ocean, China (201405037), to which the authors are most grateful.

Institutional Review Board Statement

Not applicable.

Informed Consent Statement

Not applicable.

Data Availability Statement

The data that support the findings of this study are available from the corresponding author upon reasonable request.

Acknowledgments

This work was supported by the Science and Technology Basic Resources Investigation Program of China (Grant No. 2022FY202404).

Conflicts of Interest

The authors declare no conflict of interest.

References

  1. Pettijohn, F.J. The Texture of Sediment. In Sedimentary Rocks, 2nd ed.; Harper and Row Publishers: New York, NY, USA, 1972; pp. 25–77. ISBN 0060451912. [Google Scholar]
  2. Oakey, R.J.; Green, M.; Carling, P.A.; Lee, M.W.E.; Sear, D.A.; Warburton, J. Grain-shape analysis—A new method for determining representative grain shapes for populations of natural grains. J. Sediment. Res. 2005, 75, 1065–1073. [Google Scholar] [CrossRef]
  3. Blott, S.J.; Pye, K. Particle shape: A review and new methods of characterization and classification. Sedimentology 2008, 55, 31–63. [Google Scholar] [CrossRef]
  4. Suzuki, K.; Fujiwara, H.; Ohta, T. The evaluation of macroscopic and microscopic textures of sand grains using elliptic Fourier and principal component analysis: Implications for the discrimination of sedimentary environments. Sedimentology 2015, 62, 1184–1197. [Google Scholar] [CrossRef]
  5. Woronko, B.; Dłużewski, M.; Woronko, D. Sand-grain micromorphology used as a sediment-source indicator for Kharga Depression dunes (Western Desert, S Egypt). Aeolian Res. 2017, 29, 42–54. [Google Scholar] [CrossRef]
  6. van Hateren, J.A.; van Buuren, U.; Martinus Arens, S.; Theodorus van Balen, R.; Arnoud Prins, M. Identifying sediment transport mechanisms from grain size–shape distributions: Applied to aeolian sediments. Earth Surf. Dyn. 2020, 8, 527–553. [Google Scholar] [CrossRef]
  7. Chmielowska, D.; Woronko, B.; Dorocki, S. Applicability of automatic image analysis in quartz-grain shape discrimination for sedimentary setting reconstruction. Catena 2021, 207, 105602. [Google Scholar] [CrossRef]
  8. Folk, R.L.; Ward, W.C. Brazos River bar: A study in the significance of grain size parameters. J. Sediment. Res. 1957, 27, 3–26. [Google Scholar] [CrossRef]
  9. Vandenberghe, J.; Sun, Y.; Wang, X.; Abels, H.A.; Liu, X. Grain-size characterization of reworked fine-grained aeolian deposits. Earth-Sci. Rev. 2018, 177, 43–52. [Google Scholar] [CrossRef]
  10. Liang, J.; Liu, J.; Xu, G.; Chen, B. Grain-size characteristics and net transport patterns of surficial sediments in the Zhejiang nearshore area: East China Sea. Oceanologia 2020, 62, 12–22. [Google Scholar] [CrossRef]
  11. Zhan, Z.; Jiang, F.; Chen, P.; Gao, P.; Lin, J.; Ge, H.; Wang, M.; Huang, Y. Effect of gravel content on the sediment transport capacity of overland flow. Catena 2020, 188, 104447. [Google Scholar] [CrossRef]
  12. Zhang, P.; Yao, W.; Liu, G.; Xiao, P.; Sun, W. Experimental study of sediment transport processes and size selectivity of eroded sediment on steep Pisha sandstone slopes. Geomorphology 2020, 363, 107211. [Google Scholar] [CrossRef]
  13. Katharina Tholen, T.P.; Hezi Yizhaq, I.K.; Kroy, K. Megaripple mechanics: Bimodal transport ingrained in bimodal sands. Nat. Commun. 2022, 13, 162. [Google Scholar] [CrossRef] [PubMed]
  14. Visher, G.S. Grain size distributions and depositional processes. J. Sediment. Petrol. 1969, 39, 1074–1106. [Google Scholar]
  15. Molinaroli, E.; Guerzoni, S.; De Falco, G.; Sarretta, A.; Cucco, A.; Como, S.; Simeone, S.; Perilli, A.; Magni, P. Relationships between hydrodynamic parameters and grain size in two contrasting transitional environments: The Lagoons of Venice and Cabras (Italy). Sediment. Geol. 2009, 219, 196–207. [Google Scholar] [CrossRef]
  16. Venkatramanan, S.; Chung, S.Y.; Ramkumar, T.; Park, N. Grain size trend and hydrodynamic condition of Tirumalairajan River Estuary, East Coast of India. Oceanology 2014, 54, 532–540. [Google Scholar] [CrossRef]
  17. Vandenberghe, J. Grain size of fine-grained windblown sediment: A powerful proxy for process identification. Earth-Sci. Rev. 2013, 121, 18–30. [Google Scholar] [CrossRef]
  18. Prodger, S.; Russell, P.; Davidson, M. Grain-size distributions on high-energy sandy beaches and their relation to wave dissipation. Sedimentology 2016, 64, 1289–1302. [Google Scholar] [CrossRef]
  19. Liu, S.; Li, P.; Feng, A.; Zhang, Z.; Yu, X.; Zhu, Z. Morphological variation and sediment dynamic in a cape-bay beach with a tidal channel around (Sanshan Dao beach, west coast of Laizhou Bay, China). Indian J. Geo. -Mar. Sci. 2017, 46, 847–859. [Google Scholar]
  20. Zhong, Y.; Chen, Z.; Li, L.; Liu, J.; Li, G.; Zheng, X.; Wang, S.; Mo, A. Bottom water hydrodynamic provinces and transport patterns of the northern South China Sea: Evidence from grain size of the terrigenous sediments. Cont. Shelf Res. 2017, 140, 11–26. [Google Scholar] [CrossRef]
  21. Joevivek, V.J.; Chandrasekar, N.; Jayangondaperumal, R.; Thakur, V.C.; Purniema, K.S. An interpretation of wave refraction and its influence on foreshore sediment distribution. Acta Oceanol. Sin. 2021, 38, 151–160. [Google Scholar] [CrossRef]
  22. Wang, S.; Pan, C.; Xie, D.; Xu, M.; Yan, Y.; Li, X. Grain size characteristics of surface sediment and its response to the dynamic sedimentary environment in Qiantang Estuary, China. Int. J. Sediment. Res. 2022, 37, 457–468. [Google Scholar] [CrossRef]
  23. Bridge, J.S.; Bennett, S.J. A model for the entrainment and transport of sediment grains of mixed sizes, shapes, and densities. Water Resour. Res. 1992, 28, 337–363. [Google Scholar] [CrossRef]
  24. Sun, R.; Xiao, H.; Sun, H. Realistic representation of grain shapes in CFD–DEM simulations of sediment transport with a bonded-sphere approach. Adv. Water Resour. 2017, 107, 421–438. [Google Scholar] [CrossRef]
  25. Novák-Szabó, T.; Sipos, A.Á.; Shaw, S.; Bertoni, G.; Pozzebon, A.; Grotolli, E.; Sarti, G.; Ciavola, P.; Domokos, G.; Jerolmack, D.J. Universal characteristics of particle shape evolution by bed-load chipping. Sci. Adv. 2018, 4, eaao4946. [Google Scholar] [CrossRef] [PubMed]
  26. Li, K.M.; Zuo, L.; Nardelli, V.; Alves, T.M.; Lourenco, S.D.S. Morphometric signature of sediment particles reveals the source and emplacement mechanisms of submarine landslides. Landslides 2019, 16, 829–837. [Google Scholar] [CrossRef]
  27. Komar, P.D.; Reimers, C.E. Grain shape effects on settling rates. J. Geol. 1978, 86, 193–209. [Google Scholar] [CrossRef]
  28. Shang, Y.; Kaakinen, A.; Beets, C.J.; Prins, M.A. Aeolian silt transport processes as fingerprinted by dynamic image analysis of the grain size and shape characteristics of Chinese loess and Red Clay deposits. Sediment. Geol. 2018, 375, 36–48. [Google Scholar] [CrossRef]
  29. McLaren, P.; Bowles, D. The effects of sediment transport on grain-size distributions. J. Sediment. Res. 1985, 55, 457–470. [Google Scholar]
  30. Gunaratna, T.; Suzuki, T.; Yanagishima, S. Cross-shore grain size and sorting patterns for the bed profile variation at a dissipative beach: Hasaki Coast, Japan. Mar. Geol. 2019, 407, 111–120. [Google Scholar] [CrossRef]
  31. Bujan, N.; Cox, R.; Masselink, G. From fine sand to boulders: Examining the relationship between beach-face slope and sediment size. Mar Geol. 2019, 417, 106012. [Google Scholar] [CrossRef]
  32. Wright, L.D.; Chappell, J.; Thom, B.G.; Bradshaw, M.P.; Cowell, P. Morphodynamics of reflective and dissipative beach and inshore systems: Southeastern Australia. Mar. Geol. 1979, 32, 105–140. [Google Scholar] [CrossRef]
  33. Almeida, L.P.; Ferreira, Ó.; Pacheco, A. Thresholds for morphological changes on an exposed sandy beach as a function of wave height. Earth Surf. Process. Landf. 2011, 36, 523–532. [Google Scholar] [CrossRef]
  34. Scott, T.; Masselink, G.; Russell, P. Morphodynamic characteristics and classification of beaches in England and Wales. Mar. Geol. 2011, 286, 1–20. [Google Scholar] [CrossRef]
  35. Tunwal, M.; Mulchrone, K.F.; Meere, P.A. Quantitative characterization of grain shape: Implications for textural maturity analysis and discrimination between depositional environments. Sedimentology 2018, 65, 1761–1776. [Google Scholar] [CrossRef]
  36. Hatfield, R.G.; Wheeler, B.H.; Reilly, B.T.; Stoner, J.S.; Housen, B.A. Particle size specific magnetic properties across the Norwegian-Greenland seas: Insights into the influence of sediment source and texture on bulk magnetic records. Geochem. Geophys. Geosyst. 2019, 20, 1004–1025. [Google Scholar] [CrossRef]
  37. Martewicz, J.; Kalińska, E.; Weckwerth, P. What hides in the beach sand? A multiproxy approach and new textural code to recognition of beach evolution on the southern and eastern Baltic Sea coast. Sediment. Geol. 2022, 435, 106154. [Google Scholar] [CrossRef]
  38. Cheng, W.F.; Chen, S.L.; Hu, J. Stability of headland bay beaches on the east coast of Hainan Island. Ocean Eng. 2017, 35, 121–128. (In Chinese) [Google Scholar]
  39. Cheng, W.F. Stability and Sedimentary Behaviors of Headland-Bay Beaches: A Case Study of Wanning Cosat, Hainan Island. Master’s Dissertation, East China Normal University, Shanghai, China, 2017. (In Chinese). [Google Scholar]
  40. Wang, B.C.; Chen, S.L.; Gong, W.P.; Lin, Y.Q.; Xu, Y. Formation and Evolution of Hainan Island Harbor Coast; China Ocean Press: Beijing, China, 2006; pp. 75–188. ISBN 7-5027-6635-9. (In Chinese) [Google Scholar]
  41. Wright, L.D.; Short, A.D. Morphodynamic variability of surf zones and beaches; a synthesis. Mar. Geol. 1984, 56, 93–118. [Google Scholar] [CrossRef]
  42. Sunamura, T. Quantitative predictions of beach-face slopes. Geol. Soc. Am. Bull. 1984, 95, 242–245. [Google Scholar] [CrossRef]
  43. Chang, R.F. Coastal Engineering Environment; China Ocean University Press: Qingdao, China, 1997; pp. 124–125. ISBN 7-81026-885-6. (In Chinese) [Google Scholar]
  44. Zhu, S.B.; Li, Z.Q. Study on beach response to Typhoon Khanun (No. 1720) along southern Leizhou Peninsula. J. Trop Oceanogr. 2019, 38, 96–104. (In Chinese) [Google Scholar]
  45. Short, A.D. Wave-dominated beaches. In Handbook of Beach and Shoreface Morphodynamics; Short, A.D., Ed.; Wiley Science: Chichester, UK, 1999; pp. 173–203. [Google Scholar]
  46. Plate, M.; Pankratz, J. Apparatus for Determining the Particle Size Distribution of a Mixture. U.S. Patent 60,661,130, 9 May 2000. [Google Scholar]
  47. Luo, Z.; Cai, B.; Chen, S. Grain size and shape analysis of beach sediment using dynamic image analysis and comparison with sieving method. Acta Sedimentol. Sin. 2016, 34, 881–898. (In Chinese) [Google Scholar]
  48. Krumbein, W.C. Measurement and geological significance of shape and roundness of sedimentary particles. J. Sediment. Res. 1941, 11, 64–72. [Google Scholar] [CrossRef]
  49. Patro, B.C.; Sahu, B.K. Factor analysis of sphericity and roundness data of clastic quartz grains: Environmental significance. Sediment. Geol. 1974, 11, 59–78. [Google Scholar] [CrossRef]
  50. Campaña, I.; Benito-Calvo, A.; Pérez-González, A.; Bermúdez de Castro, J.M.; Carbonell, E. Assessing automated image analysis of sand grain shape to identify sedimentary facies: Gran Dolina archaeological site (Burgos, Spain). Sediment. Geol. 2016, 346, 72–83. [Google Scholar] [CrossRef]
  51. Szabó, T.; Domokos, G.; Grotzinger, J.P.; Jerolmack, D.J. Reconstructing the transport history of pebbles on Mars. Nat. Commun. 2015, 6, 8366. [Google Scholar] [CrossRef]
  52. Dadd, K.; Foley, K. A shape and compositional analysis of ice-rafted debris in cores from IODP Expedition 323 in the Bering Sea. Deep Sea Res. Part II Top. Stud. Oceanogr. 2016, 125–126, 191–201. [Google Scholar] [CrossRef]
  53. Shepard, F.P.; Young, R. Distinguishing between beach and dune sands. J. Sediment. Res. 1961, 31, 196–214. [Google Scholar]
  54. Kasper-Zubillaga, J.J.; Dickinson, W.W.; Carranza-Edwards, A.; Hornelas-Orozco, Y. Petrography of quartz grains in beach and dune sands of Northland: North Island: New Zealand. N. Z. J. Geol. Geophys. 2005, 48, 649–660. [Google Scholar] [CrossRef]
  55. Pál, G.; Domokos, G.; Kun, F. Curvature flows: Scaling laws and the geometry of attrition under impacts. Sci. Rep. 2021, 11, 20661. [Google Scholar] [CrossRef]
  56. López, M.; López, I.; Aragonés, L.; Serra, J.C.; Esteban, V. The erosion on the east coast of Spain: Wear of particles: Mineral composition: Carbonates and Posidonia oceanica. Sci. Total Environ. 2016, 572, 487–497. [Google Scholar] [CrossRef]
  57. López, M.; Baeza-Brotons, F.; López, I.; Tenza-Abril, A.J.; Aragonés, L. Factors influencing the rate of beach sand wear: Activation layer thickness and sediment durability. Sci. Total Environ. 2019, 658, 367–373. [Google Scholar] [CrossRef] [PubMed]
  58. Jerolmack, D.J.; Brzinski, T.A. Equivalence of abrupt grain-size transitions in alluvial rivers and eolian sand seas: A hypothesis. Geology 2010, 38, 719–722. [Google Scholar] [CrossRef]
  59. McCave, I.N. Size sorting during transport and deposition of fine sediments: Sortable silt and flow speed. Dev. Sedimentol. 2008, 60, 121–142. [Google Scholar]
  60. Dietrich, W.E. Settling velocity of natural particles. Water Resour. Res. 1982, 18, 1615–1626. [Google Scholar] [CrossRef]
  61. Salman, A.D.; Verba, A. New approximate equations to estimate the drag coefficient of different particles of regular shape. Period Polytech. Chem. Eng. 1988, 32, 261–276. [Google Scholar]
  62. Aagaard, T.; Greenwood, B.; Hughes, M. Sediment transport on dissipative: Intermediate and reflective beaches. Earth-Sci. Rev. 2013, 124, 32–50. [Google Scholar] [CrossRef]
  63. Silvester, R.; Hsu, J.R.C. Coastal Stabilization; Innovative Concepts; Prentice-Hall Inc.: Englewood Cliffs, NJ, USA, 1993; p. 578. ISBN 9780131403109. [Google Scholar]
  64. Klein, A.H.F.; Ferreira, Ó.; Dias, J.M.A.; Tassler, M.G.; Silveira, L.F.; Benedet, L.; de Menezes, J.T.; de Abreu, J.G.N. Morphodynamics of structurally controlled headland-bay beaches in southeastern Brazil: A review. Coast Eng. 2010, 57, 98–111. [Google Scholar] [CrossRef]
  65. Gao, S.; Collins, M. A critique of the McLaren method for defining sediment transport paths—Discussion. J. Sediment. Petrol. 1991, 61, 143–146. [Google Scholar] [CrossRef]
  66. Gao, S.; Collins, M. Net sediment transport patterns inferred from grain-size trends: Based upon definition of “transport vectors”. Sediment. Geol. 1992, 81, 47–60. [Google Scholar] [CrossRef]
  67. Gao, S. A Fortran program for grain-size trend analysis to define net sediment transport pathways. Comput. Geosci. 1996, 22, 449–452. [Google Scholar] [CrossRef]
  68. McCarthy, G.R. The rounding of beach sands. Am. J. Sci. 1933, s5-25, 205–224. [Google Scholar] [CrossRef]
  69. Williams, A.T.; Morgan, P. Quartz grain S.E.M. textural variations of the beach/dune interface, Long Island, U.S.A. J. Coast. Res. 1988, 37–45. [Google Scholar]
  70. Conley, D.C.; Griffin, J.G. Direct measurements of bed stress under swash in the field. J. Geophys. Res. Atmos. 2004, 109, C03050. [Google Scholar] [CrossRef]
  71. Masselink, G.; Puleo, J.A. Swash-zone morphodynamics. Cont. Shelf Res. 2006, 26, 661–680. [Google Scholar] [CrossRef]
  72. Heiss, J.W.; Puleo, J.A.; Ullman, W.J.; Michael, H.A. Coupled surface-subsurface hydrologic measurements reveal infiltration, recharge, and discharge dynamics across the swash zone of a sandy beach. Water Resour. Res. 2015, 51, 8834–8853. [Google Scholar] [CrossRef]
Figure 1. Study area and transects of beach sediment sampling.
Water 15 03637 g001
Figure 2. Different grain size definitions and the dynamic image method test illustrated via a schematic diagram: (a) maximum chord diameter, (b) equal area circle diameter, (c) Feret diameter, (d) Martin diameter, and (e) DIA.
Water 15 03637 g002aWater 15 03637 g002b
Figure 3. The relationship between transportation and grain size population distribution and truncation points (adapted with permission from Ref. [14]. 1969, SEPM).
Water 15 03637 g003
Figure 4. The sediment grain size and sphericity distributions along the Bao’ding Bay beach: (a) grain size; (b) sphericity.
Water 15 03637 g004
Figure 5. The beach profile and field pictures of the Bao’ding Bay: (a) reflective, (b) intermediate, (c) dissipative, and (df) filed pictures.
Water 15 03637 g005aWater 15 03637 g005b
Figure 6. The beach slope of each profile and the non-dimensional settling velocity parameter Ω.
Water 15 03637 g006
Figure 7. The sediment grain size–shape trend curve and the cumulative frequency curve identify the suspension, saltation, and traction populations, with numbers 1 to 5 indicating the beach’s location (from land to sea): (a) reflective, (b) intermediate, and (c) dissipative.
Water 15 03637 g007aWater 15 03637 g007b
Figure 8. The grain size frequency curves and the grain size–shape trend curves of Bao’ding bay beach sediments, with numbers 1 to 5 indicating the beach’s location (from land to sea): (a) reflective, (b) intermediate, and (c) dissipative.
Water 15 03637 g008aWater 15 03637 g008b
Figure 9. Schematic diagram of the relationship between grain size and shape characteristics and the abrasion and sorting processes (the dotted lines represent the maximum content of grain size components).
Water 15 03637 g009
Figure 10. Cross-shore distribution characteristics of sediment grain size–shape curves.
Water 15 03637 g010
Figure 11. Longshore distribution characteristics of sediment grain size–shape curves: (a) the backshore, (b) beach berm, (c) beach face, (d) waterside, (e) underwater, and (f) Legend.
Water 15 03637 g011aWater 15 03637 g011b
Figure 12. Sediment transport trend of Bao’ding Bay beach.
Water 15 03637 g012
Disclaimer/Publisher’s Note: The statements, opinions and data contained in all publications are solely those of the individual author(s) and contributor(s) and not of MDPI and/or the editor(s). MDPI and/or the editor(s) disclaim responsibility for any injury to people or property resulting from any ideas, methods, instructions or products referred to in the content.

