Article

Effects of Terrain near Taiwan Island on Typhoons with Different Tracks and Typhoon Waves

1
College of Ocean and Earth Sciences, Xiamen University, Xiamen 361102, China
2
Research and Development Center for Ocean Observation Technologies, Xiamen University, Xiamen 361102, China
3
Laboratory of Underwater Acoustic Communication and Marine Information Technology, Ministry of Education, Xiamen University, Xiamen 361102, China
4
College of Physics and Electonic Information Enginerring, Minjiang University, Fuzhou 350100, China
5
Fujian Marine Forecasts, Fuzhou 350100, China
*
Authors to whom correspondence should be addressed.
Water 2023, 15(20), 3661; https://doi.org/10.3390/w15203661
Submission received: 25 September 2023 / Revised: 15 October 2023 / Accepted: 18 October 2023 / Published: 19 October 2023

Abstract

:
The terrain, such as Taiwan Island, have been shown to have complex effects on typhoons and the associated typhoon waves. Terrain effects change with typhoon tracks. In this study, three types of typhoon tracks (northern, middle and southern) were defined according to the relationship between the typhoon tracks and Taiwan Island. Typhoons on these three tracks and typhoon waves were simulated using the Weather Research and Forecasting–Simulating Waves Nearshore model. In each type of typhoon, a control case without the Taiwan topography was simulated to compare with real cases. The results showed that typhoons on different tracks were affected by the terrain of Taiwan Island in different ways. Taiwan Island had weakening, decelerating and deflective effects on typhoons. The ranking for the weakening effect was middle track (81%) > southern track (69%) > northern track (3%). The decelerating effect was 7% in the northern track and 25% in the southern track. The deflective effect of the terrain makes typhoons on the northern (southern) track deflect toward the south (north). When a typhoon on a middle track passed over Taiwan Island, a new center of low pressure would replace the former center and make the track discontinuous. In addition, the influence of typhoons on regions near Taiwan Island changed with the typhoon’s tracks. The influence ranking of typhoons in Taiwan Island was the middle track > southern track > northern track, which was consistent with that of typhoons in the Taiwan Strait and opposite to that of typhoons in Fujian Province. The influence ranking of typhoons on the Taiwan Strait was the opposite of the typhoon intensity ranking, which suggests that the intensities of wind and waves in the strait were more related to typhoon tracks than typhoon intensity. The variations in the significant wave height were similar to those of the wind speed, but there was a time lag (2 h) between them due to the wave growth process and swells. In addition, the significant wave height distribution sometimes differed from the wind speed distribution under the influence of swells and terrain.

1. Introduction

Typhoons and typhoon waves are some of the causes of the most severe natural disasters around the world, severely threatening navigation and fisheries’ safety [1,2,3]. Typhoon waves often cause seawater intrusion and damage breakwaters, particularly under the shoaling effect in coastal regions [4,5,6]. Typhoons also pose a threat to the safety of life and property of people on land [7,8,9]. Taiwan Island is located between Fujian Province and the Pacific Ocean. The region near Taiwan Island is often subject to typhoons and typhoon waves generated in the Northwest Pacific Ocean, which result in extensive loss of life and property [10,11,12]. In the past thirty years, typhoons and typhoon waves have caused economic losses of more than USD 18 billion and 1200 fatalities in Fujian Province [1,13,14]. Defense measures against typhoons and typhoon waves should be formulated according to their characteristics [15,16].
The terrain of Taiwan Island clearly influences typhoons [17,18,19]. Previous studies on the effects of Taiwan Island on typhoons have often focused on the effect of the Central Mountain Range [20,21]. The interaction between typhoons and the Central Mountain Range on Taiwan Island, which is more than 3500 m above sea level and aligned in a north–south direction, would cause obvious differences in typhoon characteristics on the eastern and western sides of Taiwan Island [22,23]. Typhoon intensity is often degraded after typhoons pass near the Central Mountain Range and might damage the cyclonic structure [24,25]. Therefore, typhoons generally act more severely on the eastern side because most typhoons pass near Taiwan Island from an east to west direction [26]. Typhoon speed often decreases when the typhoon passes Taiwan Island [27]. In addition, Taiwan Island sometimes deflects typhoon tracks when typhoons pass near the island [21,28,29].
The Taiwan Strait is a strait situated between Fujian Province and Taiwan Island and is characterized by a complex bottom topography and strong tides [30]. Wind speed in the Taiwan Strait is affected by the Venturi effect and increases more obviously, often exceeding 20 m/s before typhoons arrive in the Taiwan Strait [31,32]. In addition, there may be an increase in typhoon intensity as they move into the Taiwan Strait [33,34].
Typhoon waves always have a similar intensity distribution to that of typhoons [35,36]. Typhoon wave characteristics change with typhoon characteristics. However, there are often differences between the intensity distributions of typhoons and typhoon waves under the effects of the wave growth process, swells and terrain [37,38]. Typhoon waves need time to peak at a certain wind speed, which results in a time lag in the wave variations [39,40]. Wind waves change to swells and exist during the period when the wind disappears or when the wind direction changes [41]. The terrain also affects typhoon wave characteristics in different ways. For example, typhoon waves often become stronger and have longer durations in the Taiwan Strait than in the open ocean [42,43].
The complex effect of the terrains of Taiwan Island on typhoons and typhoon waves changes with typhoon tracks [27,44]. Previous studies suggest that track deflection and intensity weakening of typhoons depend on the relationship between typhoon tracks and Taiwan Island [45,46]. Under the influence of typhoons with different tracks, the characteristics of typhoon waves near Taiwan Island are also completely different [47]. However, significant uncertainty remains in understanding the effects of different terrains and the relationship between typhoons and typhoon waves near Taiwan Island under different typhoon tracks.
The aims of this study were to classify typhoon tracks based on their relationship with Taiwan Island, compare the different effects of terrains on typhoons with different tracks and investigate the relationship between typhoons and typhoon waves. This study will help us to understand the effects of different terrains, including Taiwan Island and the Taiwan Strait, on typhoons and typhoon waves.

2. Materials and Methods

Three types of typhoon tracks were identified to investigate the effects of terrain near Taiwan Island under different typhoon tracks. Three typhoon events that passed near Taiwan Island on three types of tracks were simulated using the Weather Research and Forecasting (WRF)–Simulating Waves Nearshore (SWAN) model. Wind speed and direction were used to analyze the typhoon characteristics and significant wave heights were used to characterize typhoon waves. Simulation accuracy was evaluated by comparing the results with buoy observation data. Details of the research region, typhoon events, model and model evaluation methods are described below.

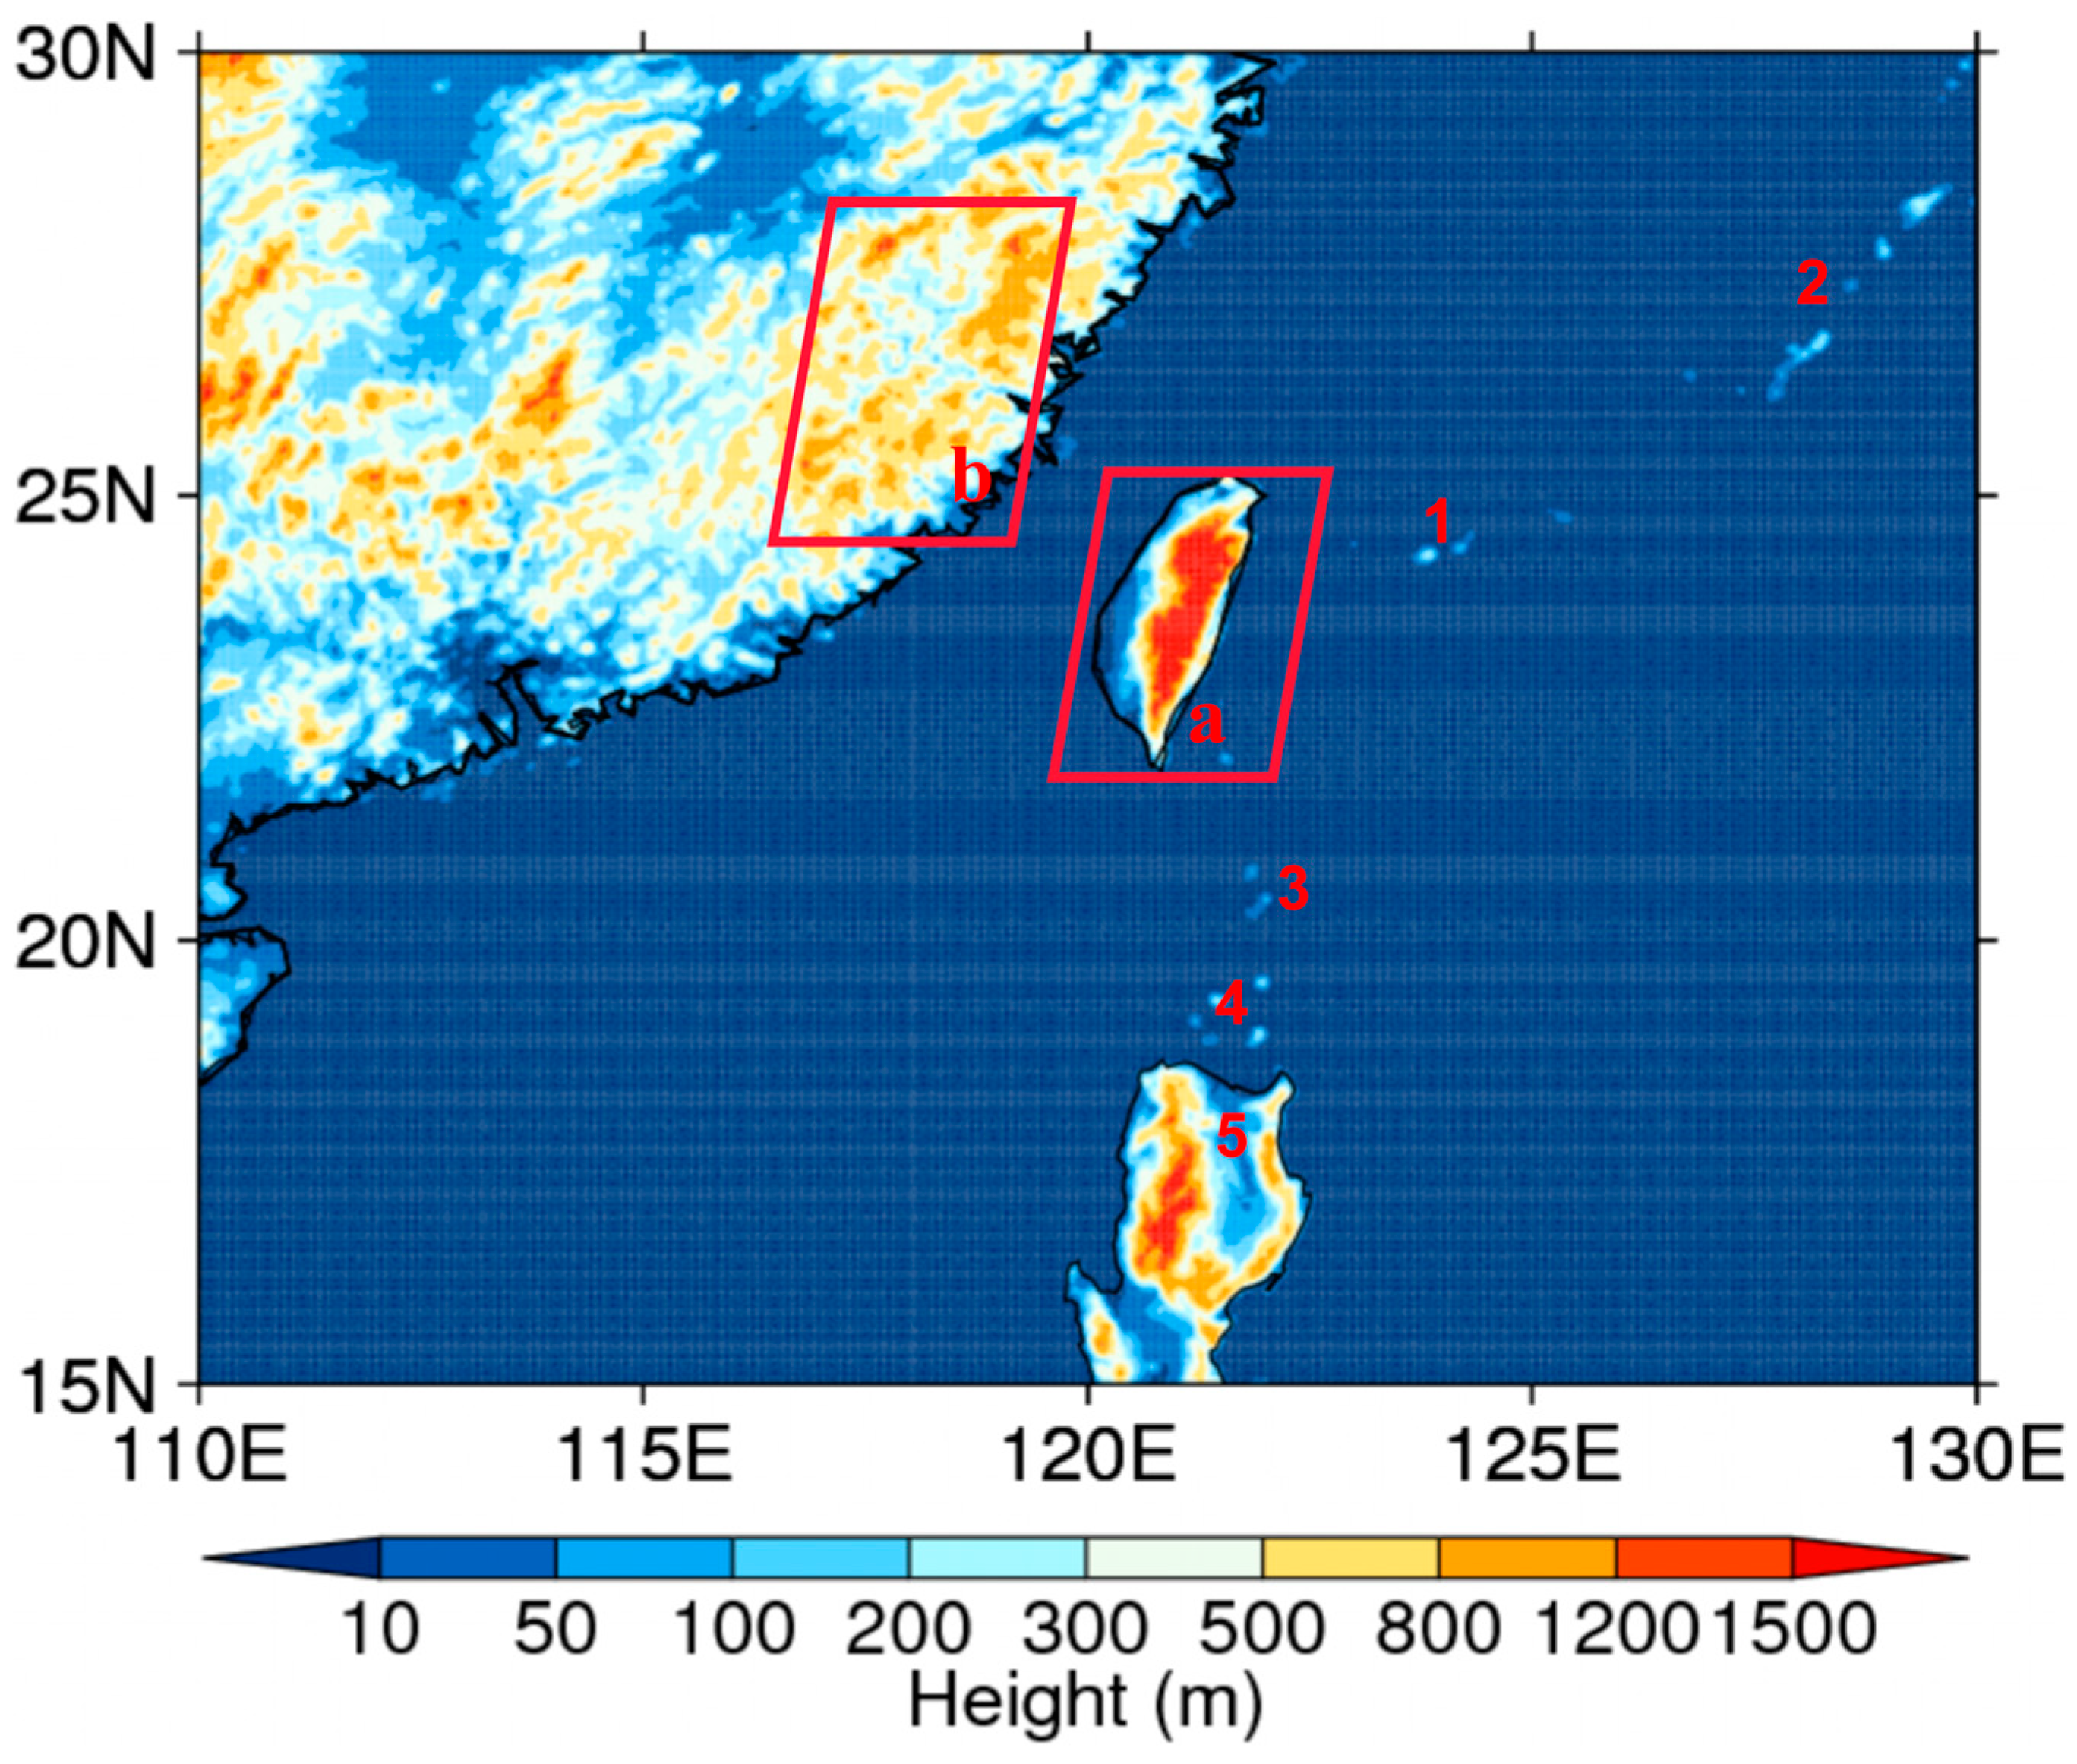
2.1. Region and Parameters

Fujian Province, Taiwan Strait, Taiwan Island, the eastern sea of Taiwan Island and some islands near Taiwan Island were identified as the study area. The terrain height of the study region is shown in Figure 1. To investigate the terrain effects, Taiwan Island was set to be either present or absent in the real and control cases. We analyzed the wind characteristics of the four regions and the typhoon characteristics during typhoon events to investigate the typhoon influences. The typhoon wave characteristics in the Taiwan Strait and eastern sea of Taiwan Island were analyzed and compared with typhoon characteristics to analyze the relationship between wind and waves. The reason for the differences between wind and waves is explained in terms of wave theory and terrain effects.
Wind speed and wind direction are two basic parameters used in wind studies to analyze changes in typhoon characteristics. The significant wave height is closely related to the intensity of typhoon waves and was used as a proxy for typhoon waves in this study.

2.2. Typhoon Classification and Typhoon Events

According to the relationship between typhoon tracks and Taiwan Island, three types of typhoon tracks were identified: northern, middle and southern tracks. Typhoons on the northern (southern) tracks pass through the northern (southern) side of Taiwan Island and typhoons on the middle tracks pass through Taiwan Island.
One typhoon event from each type of typhoon track (Maria, Meranti and Dujuan) was selected to analyze the different effects of terrains near Taiwan Island under the three typhoon tracks.
Typhoon Maria started as a tropical depression on 3 July 2018 and strengthened to a tropical storm on 4 July. Maria reached its peak intensity on 6 July and became a super typhoon with sustained winds of 58 m/s. The typhoon moved westward, passed the northern side of Taiwan Island, made landfall in Fujian Province on 11 July and became extinct on 13 July (Figure 2).
Typhoon Meranti was identified as a tropical storm on 10 September 2016 and strengthened to a super typhoon in two days. Meranti moved toward the northwest, passed by the southern side of Taiwan Island, made landfall in Fujian Province and became extinct on 17 September 2016 (Figure 2). Typhoon Meranti is the strongest typhoon that has occurred in Fujian in the past sixty years.
Typhoon Dujuan formed on 20 September 2015 and strengthened to a typhoon on 24 September. Dujuan reached its peak intensity (super typhoon) on 26 September with wind speeds reaching 55 m/s. The typhoon moved toward the west, passed through Taiwan Island, made landfall in Fujian Province on 29 September and became extinct on 30 September (Figure 2).
Three typhoons passed near Taiwan Island on different tracks. The track of Typhoon Maria passed the northern side of Taiwan Island and the Taiwan Strait, which is a northern track. The track of Typhoon Meranti is regarded as a southern track because it passed through the southern side of Taiwan Island. Typhoon Dujuan passed through Taiwan Island, including the Central Mountain Range and the Taiwan Strait, making it a typhoon with a middle track. The tracks of the three typhoon events are shown in Figure 2.

2.3. WRF-SWAN Model

The WRF model developed by the National Centre for Environmental Prediction and the National Centre for Atmospheric Research is effective in simulating various weather events and was used to simulate typhoon events in this study [48,49]. The model version 3.9.1 was used, and the code can be obtained from the official website (https://www2.mmm.ucar.edu/wrf/, accessed on 25 September 2023). The spatial resolution of the WRF model outer domain was 25 km and the domain covered the Western Pacific, Taiwan Island and Fujian Province (Figure 2). The full process, including the formation, development and extinction of the typhoons, was simulated using the WRF model. The WRF model’s inner domain with a grid size of 5 km focused on Taiwan Island. Terrain elevation in the WRF model was derived from a global topographic data set produced by the United States Geological Survey with a spatial resolution of 1 km. Land cover and land use data were derived from MODIS and the spatial resolution was 500 m. Physical scheme options are important in the WRF model. There are many choices for the different physical processes in the model. Morrison, RRTMG/RRTMG and Grell 3D were chosen as the microphysics, long/short wave radiation and cumulus schemes [50,51,52]. The initial meteorological and boundary conditions were derived from the Final Analysis reanalysis data (https://rda.ucar.edu/datasets/ds083.2/, accessed on 25 September 2023), with a spatial resolution of 1° and temporal resolution of six hours. This product is from the Global Data Assimilation System, which collects observational data from the Global Telecommunications System and other sources. The four-dimensional nudging technique was applied to ensure that the typhoon path was correct. The time-points for starting the simulation were three days before the typhoon events, and the first three days were set as the spin-up of the model. The simulation times of the three typhoon events ended at the extinction of the typhoons.
The SWAN model (version 40.85), developed by the Delft University of Technology, is widely applied in wave simulations and can modify values for parameters in the wind input and the dissipation terms in semi-enclosed areas to include the effects of terrains [53,54,55]. The SWAN model was used to simulate typhoon waves in this study. The spatial resolution of the SWAN model domain was 0.05°, and the domain covered the region near Taiwan Island (Figure 2).
The coupled wind and wave simulation is employed in many studies to analyze the effect of terrain during typhoon episodes and result indicates wind input from model sometimes improve accuracy of simulated wave [56,57,58]. Therefore, the WRF model provides wind at a height of 10 m to simulate typhoon waves in the SWAN model in this study. The simulation times were consistent with those in the WRF simulation.

2.4. Model Evaluation

An evaluation of model performance is required prior to analyzing the characteristics of the simulated winds and waves. Three major parameters in our study, namely, wind speed (WS), wind direction (WD) and significant wave height (SWH), were evaluated by comparing them to hourly observation data from four buoys in the Taiwan Strait. The observational data were obtained from the official website of the Fujian Marine Forecast Station (http://www.fjhyyb.cn/Ocean863Web_MAIN/, accessed on 25 September 2023). The buoy locations are shown in Figure 2. Wind direction is expressed as an angle measure. The north wind is 0 degrees, the east wind is 90 degrees, the south wind is 180 (−180) degrees and the west wind is −90 degrees. Because of the physical limit of buoys, the wave model usually has a broader frequency band. As a result, the significant wave height for the SWAN model was calculated from frequency range between 0.033 Hz and 1 Hz, which is consistent with in situ measurement limitations. The correlation (r), the average error (AE) and index of agreement (d) were assessed, and the results are shown in Table 1 [53]. The index of agreement was calculated using Equation (1)
d = 1 ( M i O i ) 2 ( | M i M ¯ | + | O i O ¯ | ) 2
where M and O are the model result and observational data, respectively, and an overbar indicates an average value. With increasing agreement between the model result and observational data, d approaches 1.

3. Results and Discussion

3.1. Maria Results

3.1.1. Terrain Effect and Typhoon Characteristics

Taiwan Island had weakening, decelerating and deflective effects on typhoons. To remove the effect of other factors, a control case without Taiwan Island was simulated. Wind speed distribution can indicate the energy distribution of a typhoon. The results indicate that the typhoon intensity in real cases deteriorated as the typhoon passed the northern side of Taiwan Island (Figure 3). The maximum wind speed decreased from 37 m/s to 28 m/s and the typhoon energy calculated by wind speed also weakened by 10%. In the control, the maximum wind speed decreased to 32 m/s and typhoon energy weakened by 7%. The weakening effect of Taiwan Island on Maria is not obvious.
To investigate the decelerating effect of Taiwan Island, the typhoon speed when the typhoon passed near Taiwan Island was calculated. The typhoon speed in the real case decreased by 7% compared to that in the control case. The typhoon tracks in the real and control cases are shown in Figure 3. The results suggest that Typhoon Maria moved in a northeastward direction, passed the northern side of Taiwan Island and made landfall in Fujian Province. The simulated typhoon track in the real case deflected toward the south when it passed by Taiwan Island, but the difference was relatively small.
Typhoon Maria passed the northern side of Taiwan Island and made landfall in Fujian Province from 12:00 on 10 July to 12:00 on 11 July. To investigate the wind characteristics near Taiwan Island when Maria passed, the wind speeds at three-hour intervals are shown in Figure 4. The wind speed in the northern part of the typhoon was larger because of the addition of the moving velocity. During the movement of Typhoon Maria, the wind speed characteristics near Taiwan Island changed constantly. The wind speed on the eastern side of Taiwan Island began to increase as Maria passed the northern side of Taiwan Island and gradually weakened after Maria passed over the Taiwan Strait. The wind speed on Taiwan Island did not increase significantly; however, the wind speed in the Taiwan Strait decreased and then increased during this process. The wind speed in the strait reached its peak when Maria made landfall in Fujian Province. In Fujian Province, the wind speed around the mountains increased as Maria approached land. At 6:00 on 11 July, the circular structure of the typhoon was destroyed after Maria hit land in Fujian Province.
To investigate the effects of terrain on the wind characteristic changes, the wind vector for the same time period is shown in Figure 5. The results indicate that the cyclone structure of Maria did not change significantly when Maria passed the northern side of Taiwan Island, and the effect of Taiwan Island on Maria mainly deteriorated the typhoon intensity. During the process, the blocking effect of the island and the counter-clockwise wind direction of Maria caused the wind speed in the Taiwan Strait to decrease and formed a counter-clockwise wind around the island, which increased the wind speed on the eastern side of the island. After Maria reached the Taiwan Strait, the wind speed on the eastern side of the island began to decrease as Maria moved away. The wind direction in the strait continued to change with typhoon location, from north to south. An increase and decrease in the angle between the wind direction in the strait and the direction of the strait resulted in a decrease and increase, respectively, in wind speed in the strait due to the blocking effect from Taiwan Island.
When Maria approached land, the wind direction in Fujian Province was affected by the wind direction of the typhoon and became counter-clockwise. The vortex structure of the wind direction could still be observed in the wind vector on 11 July when the circular structure of the wind speed disappeared, which suggests that the typhoon still existed. The typhoon intensity distribution may depend on the terrain after the typhoon made landfall in Fujian Province. The wind speed decreased significantly under the effect of rough underlying surfaces and strong wind regions were mainly found around mountains. This might be because mountainous regions form narrow passages and increase the wind speed through the Venturi effect. After Maria hit land in Fujian Province, the wind direction near some mountains was perpendicular to the direction of the mountains. When wind direction is vertical to the mountain, the wind speed decreases on the windward slope and increases on the leeward slope of the mountains under the effect of gravitational potential energy. After a typhoon makes landfall, wind speed distribution is influenced by wind direction and terrain, especially mountains, and is discontinuous.

3.1.2. Relationship between Wind and Waves

In this study, significant wave height was used to analyze the typhoon wave characteristics. The intensity of wind waves was closely related to the wind speed, which resulted in similar characteristics for wind speed and significant wave height. However, there were several differences between their distributions. First, the wind wave growth process takes time, which means that the variations in wave distribution has a time lag compared to that of wind. Second, when the wind disappears or the wind direction changes, the wind wave changes to swells and exists for a certain period instead of disappearing immediately. Third, the effects of terrain on the wind and waves are sometimes different. For example, the island decreases wind speed but causes the geometric characteristics of deep-water waves to change and flow around.
The significant wave height distribution at three-hour intervals between 12:00 on 10 July and 12:00 on 11 July is shown in Figure 6 to investigate the wave characteristics near Taiwan Island when Maria passed by the island. Compared with the wind speed distribution for the same time, the significant wave height characteristics were similar. The typhoon waves passed through the northern side of Taiwan Island and gradually disappeared along the coast of Fujian Province. The significant wave height in the northern portion of Maria was higher than that in the southern portion, which is consistent with the wind speed distribution. The variations in significant wave height in the Taiwan Strait and eastern sea of Taiwan Island was also consistent with that of wind speed. However, the significant wave height near the chain of islands forming the Yaeyama and Ryukyu archipelagos was obviously weakened by islands. In addition, there was a time lag (two hours) for variations in significant wave height because of the wave growth process and swells.

3.1.3. Summary

When Maria passed the northern side of Taiwan Island, the weakening, decelerating and deflective effects of Taiwan Island were not obvious. The intensity and speed of Maria decreased by no more than 10% and the typhoon track deflected toward the south. A counter-clockwise wind appeared around the island. The wind direction in the Taiwan Strait changed constantly with the movement of Typhoon Maria. The wind speed trend in the strait was linked to the location of Maria. The temporal and spatial variations in the significant wave height were similar to those in wind speed. However, the wave growth process and swells caused a time lag in the variations in the significant wave height.

3.2. Meranti Results

3.2.1. Terrain Effect and Typhoon Characteristics

Typhoon intensity and maximum wind speed were calculated to evaluate the weakening effect of Taiwan Island. In the real case, the maximum wind speed for Meranti decreased from 52 m/s to 30 m/s and typhoon intensity decreased by 64% after passing the south side of Taiwan Island (Figure 7). However, the maximum wind speed increased to 54 m/s and typhoon intensity increased by 15% in the case, which suggest that Taiwan Island made the typhoon intensity decrease by 69%. The typhoon speed in the real case was 25% slower than that in the control case when Meranti passed near Taiwan Island. The weakening and decelerating effects of Taiwan Island were much greater during Meranti. The typhoon tracks in the two cases are shown in Figure 7. The result shows that Typhoon Meranti moved in a northeastward direction, passing the south side of Taiwan Island during 13–14 September and making landfall in Fujian Province on 15 September. The simulated tracks of the real and control cases were similar in the early stage of the simulation. When the typhoon grew closer to Taiwan Island, it deflected toward the north compared with the control case.
The wind speed distribution at three-hour intervals from 12:00 on 13 September 2016 to 12:00 on 14 September 2016, as shown in Figure 8, were used to investigate the wind characteristics near Taiwan Island when Meranti passed the island. The results suggest that Meranti stayed on the southeast side of Taiwan Island for a specific period, passed the south side of the island and reached the Taiwan Strait. Before Meranti arrived in the Taiwan Strait, there was a noticeable increase in wind speed in the strait because of the Venturi effect. The wind speed on the east side of the island increased as Meranti approached Taiwan Island and then decreased as Meranti moved away. As far as Taiwan Island was concerned, the wind speed near the Central Mountain Range increased as Meranti passed the south side of the island. The wind speed in the strait increased continuously and peaked when Meranti arrived in the strait. The wind speed near the mountains in Fujian Province increased as Meranti moved toward Fujian Province.
Wind vectors for the same time period are shown in Figure 9 to analyze the effect of terrains near Taiwan Island on changes in wind characteristics. The results suggest that the cyclone structure of Meranti remained intact. During this process, the wind direction on the east side of Taiwan Island was affected by Meranti and gradually changed from northeast to south. The wind characteristics around Taiwan Island were linked to the location of Meranti. As Meranti approached the island, the island had a north-easterly wind direction and the wind speed on the island was lower than that over the ocean because of differences in the roughness of the underlying surface. When Meranti passed the south side of the island, the wind direction on the eastern side of island gradually changed to become perpendicular to the Central Mountain Range and the wind speed increased significantly on the leeward slope of the mountain. This may be because gravitational potential energy is converted into kinetic energy when wind passes down a mountain, which increases wind speed. The wind direction in the strait was north-easterly throughout the entire process.

3.2.2. Relationship between Wind and Waves

The significant wave height at three-hour intervals from 12:00 on 13 September to 12:00 on 14 September 2016, as shown in Figure 10, were used to investigate the wave characteristics near Taiwan Island under the influence of Meranti. The significant wave height distribution was similar to the wind speed distribution. The typhoon wave intensity weakened after passing the south side of Taiwan Island. In addition, there was also a time lag (two hours) between the variations in significant wave height and wind speed. The significant wave height on the east side of the island was affected by typhoon waves. When Meranti passed the island, the significant wave height along the east side of the island increased, which is different from the wind speed distribution. This is because the island makes swells spread along the coast. The significant wave height near the chain of lands forming Batanes and Babuyan was also weakened by the island effect.
There was no significant increase in wind speed or change in wind direction in the Taiwan Strait between 12:00 and 18:00 on 13 September. However, the significant wave height in the strait did increase continuously because the wave took time to peak under the effect of a certain wind speed. The complex wind direction was not conducive to wave growth and a stable wind direction for a long time would allow the wave to grow to the peak. The stable wind direction might be an important reason for the significant wave height in the Taiwan Strait during Typhoon Meranti to be higher than that during Typhoon Maria.

3.2.3. Summary

As Meranti passed the south side of Taiwan Island, the typhoon intensity and speed decreased noticeably, and the magnitude was larger than that during Typhoon Maria. The typhoon track deflected toward the north under the deflective effect of Taiwan Island. In addition, there was a noticeable increase in wind speed on the leeward slope of Central Mountain Range because of interactions between the wind and Central Mountain Range. The wind direction in the Taiwan Strait remained stable and in a northeast direction, which might have made the wave growth process continuous and wave intensity greater than that of Typhoon Maria. The relationship between the significant wave height and wind speed was similar to that during Typhoon Maria. However, the swell and terrain effect sometimes caused a significant difference between the wave height distribution and wind speed distribution.
Compared with Typhoon Maria, there were several differences in the terrain effects and relationship between wind and waves during Typhoon Meranti. This result indicated that the interaction between the typhoon and terrain was related to the typhoon track.

3.3. Dujuan Results

3.3.1. Terrain Effect and Typhoon Characteristics

Typhoon Dujuan passed through Taiwan Island and the terrain effect should be the most significant compared to the other tracks. In the real case, the maximum wind speed decreased from 40 m/s to 20 m/s and the typhoon energy weakened by 80% (Figure 11). However, in the control case, the highest wind speed was 42 m/s and typhoon energy increased by 8%. As a result, the terrain effect from Taiwan Island made the typhoon energy decrease by 81% and this weakening effect was the strongest among the three typhoons. The typhoon tracks are shown in Figure 11. The result indicates that Dujuan moved in a northeastward direction, passed through Taiwan Island during 28–29 September and landed in Fujian Province. Several noticeable deflections and a skip occurred in the simulated track in the real case when the typhoon passed through Taiwan Island.
To investigate the reason for the skip, the sea level pressure distribution during the landing of Dujuan in Taiwan Island is shown in Figure 12. The point with the minimum sea level pressure is regarded as the typhoon center in the model. This result suggests that the former low-pressure center on the east side of the island disappeared as the typhoon made landfall. A new center of low pressure appeared on the west side of island and made the typhoon center skip. In addition, the decelerating effect of Taiwan Island on Dujuan was hard to calculate because of the discontinuous track.
The wind speed at three-hour intervals from 00:00 on 28 September to 00:00 on 29 September 2015, as shown in Figure 13, were used to investigate the wind characteristics near Taiwan Island as Typhoon Dujuan passed through the island. Before Dujuan arrived in the Taiwan Strait, the wind speed in the Strait increased during September 27–28 because of the Venturi effect. Additionally, the wind speed decreased, and the intensity distribution was destroyed by Taiwan Island. The wind speed on the east side of Taiwan Island increased as Dujuan approached the island and decreased when it moved away.
The variations in wind speed around Taiwan Island were complex and related to the typhoon movement. The wind speed on the island began to increase as Dujuan approached the island and peaked when Dujuan made landfall on the island. The wind speed then decreased as Dujuan passed the island and increased again as Dujuan arrived in the Taiwan Strait. Finally, the wind speed on the island decreased as Dujuan moved away. The variations in wind speed on the island and the interaction between the typhoon and island were more complex than those noted for Maria and Meranti. The wind speed in the strait increased continuously and peaked as Dujuan just reached the strait.
The wind vectors for the same time period are shown in Figure 14 and were used to investigate the wind direction characteristics and effects of Taiwan Island on the wind speed changes. The wind direction on the east side of Taiwan Island changed from northeast to southwest when the typhoon center reached the island. The wind direction on Taiwan Island was consistent with that of Dujuan during this process. The wind speed distribution on the island was related to typhoon intensity and terrain. The typhoon intensity determines the initial wind speed, and the terrain effect increases or decreases wind speed. Strong wind regions were found near the Central Mountain Range. When the wind direction is parallel (vertical) to a mountain direction, the Venturi effect (effect of gravitational potential energy) increases the wind speed. The wind direction in the strait was northeast before Dujuan arrived in the strait. There were opposite wind directions in the northern and southern regions of the strait when the typhoon center reached the strait.

3.3.2. Relationship between Wind and Waves

The significant wave height distributions at three-hour intervals, as shown in Figure 15, were used to investigate the wave characteristics near Taiwan Island under the influence of Dujuan. The results indicated that the significant wave height distribution was similar to the wind speed distribution, but there was a time lag between them. The east, north and west regions of Taiwan Island were affected by typhoon waves and the significant wave height increases. The significant wave height peaked in the Taiwan Strait as Dujuan was about to arrive in the strait and intensity was the highest among the three typhoon events, which is consistent with the wind speed result.
The regions affected by typhoon waves are different under the influence of typhoons with different tracks. An increase in significant wave height occurred mainly on the north side of the island during Maria, which contrasts with the increases noted during Meranti.

3.3.3. Summary

Prior to Dujuan arriving in the Taiwan Strait, the wind direction in the strait was northeast and the wind speed increased significantly. When Dujuan passed through Taiwan Island, the weakening effect of Taiwan Island on the typhoon was the strongest among the three typhoon events and made typhoon energy decrease by more than 80%. The typhoon track deflected and became discontinuous during the period. In the Taiwan Strait, the wind direction changed with the location of Dujuan and the wind speed was the highest among the three events. When the typhoon center reached the Taiwan Strait, the wind direction and wind speed differed in the northern and southern regions of the strait. The trend of variations in significant wave height was similar to that of variations in wind speed. However, there was a time lag (two hours) between the significant wave height and wind speed trends because of swells and the wave growth process.

4. Conclusions

Three typhoon events (Maria, Meranti and Dujuan) were selected and simulated using the WRF-SWAN model. All three typhoon events moved northeastward, passed near Taiwan Island and made landfall in Fujian Province. Maria passed the north side of Taiwan Island (northern track), Meranti passed the south side of Taiwan Island (southern track) and Dujuan passed through Taiwan Island (middle track). Control cases without Taiwan Island were compared with the real simulations to investigate the effects of terrain near Taiwan Island under different typhoon tracks.
The results showed that Taiwan Island had three effects on typhoons and these effects would change with the typhoon tracks. First, a weakening effect occurred in all three typhoon events, among which, the magnitude ranking was as follows: middle track (81%) > southern track (69%) > northern track (3%). Second, Taiwan Island caused typhoons on the northern (southern) track to move 7% (25%) slower. Third, Taiwan Island makes typhoons on the northern (southern) track deflect toward the south (north). The typhoon on the middle track deflected and skipped when passing through Taiwan Island. The effect of the Taiwan Strait on typhoons mainly increased the wind speed in the strait through the Venturi effect. After the typhoons made landfall in Fujian Province, the typhoon intensity weakened because of the rough underlying surface. The effect of the mountains in Fujian Province on typhoons increased the wind speed between the mountains through the Venturi effect and the wind speed on the leeward slope increased when the wind direction was vertical to mountain direction.
In addition, the influence of typhoons on different regions changed with typhoon tracks. The influence of the typhoons on Taiwan Island was ranked as middle track > southern track > northern track, which is consistent with the ranking for the Taiwan Strait and opposite to that for Fujian Province. The ranking for influence of typhoons on the Taiwan Strait is opposite to the typhoon intensity ranking, which suggests that the influence of typhoons on the strait has a greater association with typhoon tracks than typhoon intensity.
The variations in significant wave height was similar to that of wind speed because the wind waves were induced by wind. There was a time lag (two hours) between the variations in wind speed and significant wave height because the wave growth process takes time and swells can exist for a certain period. The terrain effect and swells sometimes cause variations in significant wave height that are different from those in wind speed.
The results of the current study help us understand the effects of terrains, including Fujian Province, Taiwan Island and the Taiwan Strait, on typhoons and the relationship between typhoons and typhoon waves.

Author Contributions

Methodology, F.Z.; Software, C.L.; Formal analysis, Z.H. and L.W.; Resources, Y.X. and G.W.; Writing—original draft, C.L.; Writing—review & editing, C.L.; Project administration, S.S. and X.L.; Funding acquisition, S.S. All authors have read and agreed to the published version of the manuscript.

Funding

This work was funded by two grants from the National Key Research and Development Project of China (Grants 2017YFC1404800 and 2016YFC1401104), the Marine Economic Development Subsidy Project of Fujian, China (Grant ZHHY-2019-2), the Fujian Province Natural Science Foundation (2023J011573), and the Fujian Science and Technology Major Special Project (2022NZ033023).

Data Availability Statement

The data presented in this study are available on request from the corresponding author.

Acknowledgments

We are grateful to Fujian Marine Forecasts for supplying the buoy data.

Conflicts of Interest

The authors declare no conflict of interest.

References

  1. Chen, F.; Jia, H.; Du, E.; Wang, L.; Wang, N.; Yang, A. Spatiotemporal Variations and Risk Analysis of Chinese Typhoon Disasters. Sustainability 2021, 13, 2278. [Google Scholar] [CrossRef]
  2. Dawson, R.J.; Hall, J.W.; Bates, P.D.; Nicholls, R.J. Quantified Analysis of the Probability of Flooding in the Thames Estuary under Imaginable Worst-case Sea Level Rise Scenarios. Int. J. Water Resour. Dev. 2005, 21, 577–591. [Google Scholar] [CrossRef]
  3. Du, M.; Hou, Y.; Hu, P.; Wang, K. Effects of Typhoon Paths on Storm Surge and Coastal Inundation in the Pearl River Estuary, China. Remote Sens. 2020, 12, 1851. [Google Scholar] [CrossRef]
  4. Longuet-Higgins, M.S.; Stewart, R.W. Radiation stress and mass transport in gravity waves, with application to ‘surf beats’. J. Fluid Mech. 1962, 13, 481–504. [Google Scholar] [CrossRef]
  5. Hu, J. Analysis of the causes of typhoon damage in the Weitou Port of Quanzhou and its restoration. Ocean Eng. 2007, 25, 102–106. [Google Scholar]
  6. Zhang, X.L.; Ying, L.P.; Liu, Y.L. Storm surge disaster and its impact on coastal wetlands in Yellow River Delta. J. Nat. Disasters 2006, 15, 10–13. [Google Scholar]
  7. Emanuel, K. Increasing destructiveness of tropical cyclones over the past 30 years. Nature 2005, 436, 686–688. [Google Scholar] [CrossRef]
  8. Li, J.; Nie, B. Storm surge prediction: Present status and future challenges. Procedia IUTAM 2017, 25, 3–9. [Google Scholar] [CrossRef]
  9. Yu, Y.; Chen, H.; Shih, H.; Chang, C.; Hsiao, S.; Chen, W.; Lin, L. Assessing the Potential Highest Storm Tide Hazard in Taiwan Based on 40-Year Historical Typhoon Surge Hindcasting. Atmosphere 2019, 10, 346. [Google Scholar] [CrossRef]
  10. Chen, J.; Ping, F.; Wang, X.; Li, M. Topographic Influence of Taiwan Island on Typhoon “Matmo”. Chin. J. Atmos. Sci. 2017, 41, 1037–1058. [Google Scholar]
  11. Shen, F.; Xue, M.; Min, J. A comparison of limited-area 3DVAR and ETKFEn3DVAR data assimilation using radar observations at convective scale for the prediction of Typhoon Saomai (2006). Meteorol. Appl. 2017, 24, 628–641. [Google Scholar] [CrossRef]
  12. Liu, Y.; Sun, Z.; Chen, M.; Huang, L.A.; Gao, W. Assimilation of atmospheric infrared sounder radiances with WRF-GSI for improving typhoon forecast. Front. Earth Sci. 2018, 12, 457–467. [Google Scholar] [CrossRef]
  13. Fang, J.Y.; Liu, W.; Yang, S.N.; Brown, S.; Nicholls, R.J.; Hinkel, J.; Shi, X.W.; Shi, P.J. Spatial-temporal changes of coastal and marine disasters risks and impacts in mainland China. Ocean Coast. Manag. 2017, 139, 125–140. [Google Scholar] [CrossRef]
  14. Xiang, C. Analysis of Temporal and Spatial Changes of Typhoon in Fujian Province. J. Catastrophol. 2007, 22, 66–70. [Google Scholar]
  15. Luo, W.H.; He, X.; Ding, C.M. Super Typhoon Defence Scheme of Zhejiang Provinee and Research on Typhoon Hazards. Sci-Tech Inf. Dev. Econ. 2010, 20, 146–150. [Google Scholar]
  16. Wei, Y.Z.; Feng, W.C.; Sun, X.G. Characteristics of landfall typhoon in Fujian Province and its defending research. Mar. Sci. 2006, 11, 50–59. [Google Scholar]
  17. Luo, Z.; Chen, L. Effect of the Orography of Taiwan Island on Typhoon Tracks. Sci. Atmos. Sin. 1995, 19, 701–706. [Google Scholar]
  18. Yu, Z.; Hou, Q.F.; Wang, H.D.; Wu, X.D. A numerical study of the effect of Taiwan Island terrain on typhoon Haitang (0505) track. Trop. Meteorol. 2008, 14, 37–40. [Google Scholar]
  19. Chen, W.; Lin, L.; Jang, J.; Chang, C. Simulation of Typhoon-Induced Storm Tides and Wind Waves for the Northeastern Coast of Taiwan Using a Tide-Surge-Wave Coupled Model. Water 2017, 9, 549. [Google Scholar] [CrossRef]
  20. Zhang, X.; Tang, J.; Wu, C.; Wu, D. An observational study of the inner core structure of Typhoon Meranti (2016) near landfall. Atmos. Sci. Lett. 2020, 21, e962. [Google Scholar] [CrossRef]
  21. Huang, C.Y.; Juan, T.C.; Kuo, H.C.; Chen, J. Track Deflection of Typhoon Maria (2018) during a Westbound Passage Offshore of Northern Taiwan: Topographic Influence. Mon. Weather. Rev. 2020, 148, 4519–4544. [Google Scholar] [CrossRef]
  22. Chen, C.; Chen, Y.; Liu, C. Statistics of heavy rainfall occurrences in Taiwan. Weather Forecast. 2007, 22, 981–1002. [Google Scholar] [CrossRef]
  23. Li, Y.; Guo, L.X.; Xu, Y.L. Impacts of upper-level cold vortex on the rapid change of intensity and motion of Typhoon Meranti (2010). J. Trop. Meteorol. 2012, 18, 207–219. [Google Scholar]
  24. Bender, M.A.; Tuleya, R.E.; Kurihara, Y. A numerical study of the effect of island terrain on tropical cyclones. Mon. Wea. Rev. 1987, 115, 138–145. [Google Scholar] [CrossRef]
  25. Wu, C.C. Numerical simulation of typhoon Gladys (1994) and its interaction with Taiwan terrain using the GFDL hurricane model. Mon. Wea. Rev. 2001, 129, 1533–1549. [Google Scholar] [CrossRef]
  26. Zhang, S.; Qian, Q. Influence of Taiwan Island on the intensity of landed typhoons. J. Mar. Meteorol. 2018, 38, 45–49. [Google Scholar]
  27. Tang, C.K.; Chan, J.C.L. Idealized simulations of the effect of Taiwan and Philippines topographies on tropical cyclone tracks. Q. J. R. Meteorol. Soc. 2014, 140, 1578–1589. [Google Scholar] [CrossRef]
  28. Guo, J. A Numerical Study of the Track Deflection of Supertyphoon Haitang (2005) Prior to Its Landfall in Taiwan. Mon. Weather. Rev. 2008, 136, 598–615. [Google Scholar]
  29. Tang, C.K.; Chan, J.C.L. Idealized simulations of the effect of Taiwan topography on the tracks of tropical cyclones with different steering flow strengths. Q. J. R. Meteorol. Soc. 2016, 142, 3211–3221. [Google Scholar] [CrossRef]
  30. Hong, H.S.; Chai, F.; Zhang, C.Y.; Huang, B.Q.; Jiang, Y.W.; Hu, J.Y. An overview of physical and biogeochemical processes and ecosystem dynamics in the Taiwan Strait. Cont. Shelf Res. 2011, 31, 3–12. [Google Scholar] [CrossRef]
  31. Yang, M.J.; Zhang, D.L.; Tang, X.D. A modeling study of typhoon Nari (2001) at landfall: 2. Structural changes and terrain-induced asymmetries. J. Geophys. Res. 2011, 116, D09112. [Google Scholar] [CrossRef]
  32. Wang, K. Numerical Simulation of Wind Waves and Typhoon Air-Sea Interaction Process. Master’s Thesis, Wuhan University, Wuhan, China, 2021. [Google Scholar]
  33. Xue, L.; Li, Y.; Xu, Y.; Wang, L. Effect of Taiwan topography on the rapid intensification of typhoon Meranti (1010) passing by the Taiwan Strait. Chin. J. Atmos. Sci. 2015, 39, 789–801. [Google Scholar]
  34. Yu, Y.; Duan, H.; Yan, L. Numerical simulation of rapid intensification change of super typhoon Saomai (2006) over the coastal water of China. Chin. J. Atmos. Sci. 2008, 32, 1365–1378. [Google Scholar]
  35. Chen, C.; Li, Y. Study on Molave typhoon wave in South China Sea based on SWAN model. J. Mar. Sci. 2017, 35, 14–19. [Google Scholar]
  36. Shea, D.J.; Gray, W.M. The hurricane’s inner core region. I. Symmetric and asymmetric structure. J. Atmos. Sci. 1973, 30, 1544–1564. [Google Scholar] [CrossRef]
  37. Bowyer, P.J.; MacAfee, A.W. The theory of trapped-fetch waves with tropical cyclones—An operational perspective. Weather Forecast. 2005, 20, 229–244. [Google Scholar] [CrossRef]
  38. Hu, K.L.; Chen, Q. Directional spectra of hurricane-generated waves in the Gulf of Mexico. Geophys. Res. Lett. 2011, 38, L19608. [Google Scholar] [CrossRef]
  39. King, D.B.; Shemdin, O.H. Radar observation of hurricane wave directions. Int. Conf. Coast. Eng. 1978, 8, 209–226. [Google Scholar]
  40. Young, I.R. A review of the sea state generated by hurricanes. Mar. Struct. 2003, 16, 201–218. [Google Scholar] [CrossRef]
  41. Booij, N.; Ris, R.C.; Holthuijsen, L.H. A third-generation wave model for coastal regions: Model description and validation. J. Geophys. Res. Ocean. 1999, 104, 7649–7666. [Google Scholar] [CrossRef]
  42. Zhang, W.Z.; Shi, F.Y.; Hong, H.S.; Shang, S.P.; Kirby, J.T. Tide-surge Interaction Intensified by the Taiwan Strait. J. Geophys. Res. 2010, 115, C06012. [Google Scholar] [CrossRef]
  43. Liu, W.C.; Huang, W.C.; Chen, W.B. Modeling the interaction between tides and storm surges for the Taiwan coast. Environ. Fluid Mech. 2016, 16, 721–745. [Google Scholar] [CrossRef]
  44. Chen, J. Study on the characteristics of typhoon waves under three typical paths in Taiwan Strait. Mar. Forecast. 2018, 35, 1–12. [Google Scholar]
  45. Wu, C.C.; Li, T.H.; Huang, Y.H. Influence of Mesoscale Topography on Tropical Cyclone Tracks: Further Examination of the Channeling Effect. J. Atmos. Sci. 2014, 72, 3032–3050. [Google Scholar] [CrossRef]
  46. Yeh, T.C.; Elsberry, R.L. Interaction of Typhoons with the Taiwan Orography. Part II: Continuous and Discontinuous Tracks across the Island. Mon. Weather Rev. 2009, 121, 13–21. [Google Scholar] [CrossRef]
  47. Tang, C.K.; Chan, J.C.L. Idealized simulations of the effect of local and remote topographies on tropical cyclone tracks. Q. J. R. Meteorol. Soc. 2015, 141, 2045–2056. [Google Scholar] [CrossRef]
  48. Luo, C.; Wang, W.; Sheng, L.; Zhou, Y.; Hu, Z.; Qu, W.; Li, X.; Hai, S. Influence of polluted dust on chlorophyll-a concentration and particulate organic carbon in the subarctic North Pacific Ocean based on satellite observation and the WRF-Chem simulation. Atmos. Res. 2020, 236, 104812. [Google Scholar] [CrossRef]
  49. Wang, W.; Luo, C.; Sheng, L.; Zhao, C.; Zhou, Y.; Chen, Y. Effects of biomass burning on chlorophyll-a concentration and particulate organic carbon in the subarctic North Pacific Ocean based on satellite observations and WRF-Chem model simulations: A case study. Atmos. Res. 2021, 254, 105526. [Google Scholar] [CrossRef]
  50. Iacono, M.J.; Delamere, J.S.; Mlawer, E.J.; Shephard, M.W.; Collins, W.D. Radiative forcing by long-lived greenhouse gases: Calculations with the aer radiative transfer models. J. Geophys. Res. Atmos. 2008, 113, D13103. [Google Scholar] [CrossRef]
  51. Morrison, H.; Gettelman, A. A New Two-Moment Bulk Stratiform Cloud Microphysics Scheme in the Community Atmosphere Model, Version 3 (CAM3). Part I: Description and Numerical Tests. J. Clim. 2008, 21, 3642–3659. [Google Scholar] [CrossRef]
  52. Grell, G.A.; Dezs, D. A generalized approach to parameterizing convection combining ensemble and data assimilation techniques. Geophys. Res. Lett. 2002, 29, 38-1–38-4. [Google Scholar] [CrossRef]
  53. Mostafa, B.; Seyed, M.S.; Mahyar, M.N. Skill assessment of SWAN model in the red sea using different wind data. Reg. Stud. Mar. Sci. 2019, 30, 100714. [Google Scholar]
  54. Khalid, A.; Adem, A.; Nour, E.I.B.; Recep, E.C.; Fouzia, H. Evaluation of a high-resolution wave hindcast model SWAN for the West Mediterranean basin. Appl. Ocean. Res. 2019, 84, 225–241. [Google Scholar]
  55. Mostafa, B.; Seyed, M.S.; Marzieh, H.D. Calibration and skill assessment of two input and dissipation parameterizations in WAVEWATCH-III model forced with ERA5 winds with application to Persian Gulf and Gulf of Oman. Ocean. Eng. 2021, 219, 108445. [Google Scholar]
  56. Chen, S.S.; Zhao, W.; Donelan, M.A.; Tolman, H.L. Directional Wind-Wave Coupling in Fully Coupled Atmosphere-Wave-Ocean Models: Results from CBLAST-Hurricane. J. Atmos. Sci. 2013, 70, 3198–3215. [Google Scholar] [CrossRef]
  57. Olabarrieta, M.; Warner, J.C.; Armstrong, B.; Zambon, J.B.; He, R. Ocean-atmosphere dynamics during Hurricane Ida and Nor’Ida: An application of the coupled ocean-atmosphere-wave-sediment transport (COAWST) modeling system. Ocean Model. 2012, 43, 112–137. [Google Scholar] [CrossRef]
  58. Mohsen, R.; Mostafa, B.; Seyed, M.S.; Mohammad, N.A. Simulating Meteorological and Water Wave Characteristics of Cyclone Shaheen. Atmosphere 2023, 14, 533. [Google Scholar]
Figure 1. The distribution of terrain height around Taiwan Island. (a) Taiwan Island and (b) Fujian Province. The Taiwan Strait is located between (a) and (b). Points 1–5 are islands near Taiwan Island (1. Yaeyama; 2. Ryukyu; 3. Batanes; 4. Babuyan; 5. Luzon).
Water 15 03661 g001
Figure 2. The tracks of typhoon Maria (purple line), Dujuan (red line) and Meranti (blue line). The start time points of tracks are shown on the right and triangles are typhoon locations every 24 h. The Weather Research and Forecasting simulated domain includes the whole figure and black square; the Simulating Waves Nearshore simulated region is the green square; and the location of buoys in the Taiwan Strait are shown as red triangles.
Water 15 03661 g002
Figure 3. Simulated typhoon tracks of Maria in real (red line) and control (blue line) cases. Typhoon locations and max wind speed (m/s) every six hours are marked as triangles and numbers.
Water 15 03661 g003
Figure 4. Wind speed distribution at three-hour intervals from 12:00 on 10 July to 12:00 on 11 July 2018 ((ai) relate to chronological order, (a) refers to the first time point and (i) refers to the last time point).
Water 15 03661 g004
Figure 5. Wind vector at three-hour intervals from 12:00 on 10 July to 12:00 on 11 July 2018 ((ai) relate to chronological order, (a) refers to the first time point and (i) refers to the last time point).
Water 15 03661 g005
Figure 6. Significant wave height distributions at three-hour intervals from 12:00 on 10 July to 12:00 on 11 July 2018 ((ai) relate to chronological order, (a) refers to the first time point and (i) refers to the last time point).
Water 15 03661 g006
Figure 7. Simulated typhoon tracks of Meranti in real (red line) and control (blue line) cases. Typhoon locations and max wind speed (m/s) every six hours are marked as triangles and numbers.
Water 15 03661 g007
Figure 8. Wind speed distributions at three-hour intervals from 12:00 on 13 September to 12:00 on 14 September 2016 ((ai) relate to chronological order, (a) refers to the first time point and (i) refers to the last time point).
Water 15 03661 g008
Figure 9. Wind vectors at three-hour intervals from 12:00 on 13 September to 12:00 on 14 September 2016 ((ai) relate to chronological order, (a) refers to the first time point and (i) refers to the last time point).
Water 15 03661 g009
Figure 10. Significant wave height distributions at three-hour intervals from 12:00 on 13 September to 12:00 on 14 September 2016 ((ai) relate to chronological order, (a) refers to the first time point and (i) refers to the last time point).
Water 15 03661 g010
Figure 11. Simulated typhoon tracks of Dujuan in real (red line) and control (blue line) cases. Typhoon locations and max wind speed (m/s) every six hours are marked as triangles and numbers.
Water 15 03661 g011
Figure 12. Sea level pressure distribution per hour from 09:00 to 12:00 on 28 September 2015 ((ad) relate to chronological order, (a) refers to the first time point and (d) refers to the last time point).
Water 15 03661 g012
Figure 13. Wind speed distribution at three-hour intervals from 00:00 on 28 September to 00:00 on 29 September 2015 ((ai) relate to chronological order, (a) refers to the first time point and (i) refers to the last time point).
Water 15 03661 g013
Figure 14. Wind vectors at three-hour intervals from 00:00 on 28 September to 00:00 on 29 September 2015 ((ai) relate to chronological order, (a) refers to the first time point and (i) refers to the last time point).
Water 15 03661 g014
Figure 15. Significant wave height distribution at three-hour intervals from 00:00 on 28 September to 00:00 on 29 September 2015 ((ai) relate to chronological order, (a) refers to the first time point and (i) refers to the last time point).
Water 15 03661 g015
Table 1. The correlation (r), the average error (AE) and index of agreement (d) of three typhoons.
Typhoon DujuanTyphoon MerantiTyphoon Maria
rAEdrAEdrAEd
Wind speed (m/s)0.760.040.910.77−0.020.910.790.030.93
Wind direction (°)0.950.30.970.790.450.920.850.370.94
Significant wave height (m)0.79−0.040.870.81−0.110.860.84−0.060.89
Disclaimer/Publisher’s Note: The statements, opinions and data contained in all publications are solely those of the individual author(s) and contributor(s) and not of MDPI and/or the editor(s). MDPI and/or the editor(s) disclaim responsibility for any injury to people or property resulting from any ideas, methods, instructions or products referred to in the content.

